Cities with the Lowest Poverty Level Among Children Under the Age of 5 in Nevada

RELATED REPORTS & OPTIONS

Lowest Poverty | Child 0-5
Population
Families and Households
Female Fertility
Female Fertility (Unmarried)
Race (Community Size)
Race (Percentage)
Ancestry (Community Size)
AfghanAfricanAlaska NativeAlaskan AthabascanAlbanianAleutAlsatianAmericanApacheArabArapahoArgentineanArmenianAssyrian / Chaldean / SyriacAustralianAustrianBahamianBangladeshiBarbadianBasqueBelgianBelizeanBermudanBhutaneseBlackfeetBolivianBrazilianBritishBritish West IndianBulgarianBurmeseCajunCambodianCanadianCape VerdeanCarpatho RusynCelticCentral AmericanCentral American IndianCherokeeCheyenneChickasawChileanChineseChippewaChoctawColombianColvilleComancheCosta RicanCreeCreekCroatianCrowCubanCypriotCzechCzechoslovakianDanishDelawareDominicanDutchDutch West IndianEastern EuropeanEcuadorianEgyptianEnglishEstonianEthiopianEuropeanFijianFilipinoFinnishFrenchFrench American IndianFrench CanadianGermanGerman RussianGhanaianGreekGuamanian / ChamorroGuatemalanGuyaneseHaitianHmongHonduranHopiHoumaHungarianIcelanderIndian (Asian)IndonesianInupiatIranianIraqiIrishIroquoisIsraeliItalianJamaicanJapaneseJordanianKenyanKiowaKoreanLaotianLatvianLebaneseLiberianLithuanianLumbeeLuxembourgerMacedonianMalaysianMalteseMarshalleseMenomineeMexicanMexican American IndianMongolianMoroccanNative HawaiianNavajoNepaleseNew ZealanderNicaraguanNigerianNorthern EuropeanNorwegianOkinawanOsageOttawaPaiutePakistaniPalestinianPanamanianParaguayanPennsylvania GermanPeruvianPimaPolishPortuguesePotawatomiPuebloPuerto RicanPuget Sound SalishRomanianRussianSalvadoranSamoanScandinavianScotch-IrishScottishSeminoleSenegaleseSerbianShoshoneSierra LeoneanSiouxSlavicSlovakSloveneSomaliSouth AfricanSouth AmericanSouth American IndianSoviet UnionSpaniardSpanishSpanish AmericanSpanish American IndianSri LankanSubsaharan AfricanSudaneseSwedishSwissSyrianTaiwaneseThaiTlingit-HaidaTohono O'OdhamTonganTrinidadian and TobagonianTsimshianTurkishU.S. Virgin IslanderUgandanUkrainianUruguayanUteVenezuelanVietnameseWelshWest IndianYakamaYaquiYugoslavianYumanYup'ikZimbabwean
Ancestry (Percentage)
AfghanAfricanAlaska NativeAlaskan AthabascanAlbanianAleutAlsatianAmericanApacheArabArapahoArgentineanArmenianAssyrian / Chaldean / SyriacAustralianAustrianBahamianBangladeshiBarbadianBasqueBelgianBelizeanBermudanBhutaneseBlackfeetBolivianBrazilianBritishBritish West IndianBulgarianBurmeseCajunCambodianCanadianCape VerdeanCarpatho RusynCelticCentral AmericanCentral American IndianCherokeeCheyenneChickasawChileanChineseChippewaChoctawColombianColvilleComancheCosta RicanCreeCreekCroatianCrowCubanCypriotCzechCzechoslovakianDanishDelawareDominicanDutchDutch West IndianEastern EuropeanEcuadorianEgyptianEnglishEstonianEthiopianEuropeanFijianFilipinoFinnishFrenchFrench American IndianFrench CanadianGermanGerman RussianGhanaianGreekGuamanian / ChamorroGuatemalanGuyaneseHaitianHmongHonduranHopiHoumaHungarianIcelanderIndian (Asian)IndonesianInupiatIranianIraqiIrishIroquoisIsraeliItalianJamaicanJapaneseJordanianKenyanKiowaKoreanLaotianLatvianLebaneseLiberianLithuanianLumbeeLuxembourgerMacedonianMalaysianMalteseMarshalleseMenomineeMexicanMexican American IndianMongolianMoroccanNative HawaiianNavajoNepaleseNew ZealanderNicaraguanNigerianNorthern EuropeanNorwegianOkinawanOsageOttawaPaiutePakistaniPalestinianPanamanianParaguayanPennsylvania GermanPeruvianPimaPolishPortuguesePotawatomiPuebloPuerto RicanPuget Sound SalishRomanianRussianSalvadoranSamoanScandinavianScotch-IrishScottishSeminoleSenegaleseSerbianShoshoneSierra LeoneanSiouxSlavicSlovakSloveneSomaliSouth AfricanSouth AmericanSouth American IndianSoviet UnionSpaniardSpanishSpanish AmericanSpanish American IndianSri LankanSubsaharan AfricanSudaneseSwedishSwissSyrianTaiwaneseThaiTlingit-HaidaTohono O'OdhamTonganTrinidadian and TobagonianTsimshianTurkishU.S. Virgin IslanderUgandanUkrainianUruguayanUteVenezuelanVietnameseWelshWest IndianYakamaYaquiYugoslavianYumanYup'ikZimbabwean
Immigrant Origin (Total)
AfghanistanAfricaAlbaniaArgentinaArmeniaAsiaAustraliaAustriaAzoresBahamasBangladeshBarbadosBelarusBelgiumBelizeBoliviaBosnia and HerzegovinaBrazilBulgariaBurma / MyanmarCabo VerdeCambodiaCameroonCanadaCaribbeanCentral AmericaChileChinaColombiaCongoCosta RicaCroatiaCubaCzechoslovakiaDenmarkDominicaDominican RepublicEastern AfricaEastern AsiaEastern EuropeEcuadorEgyptEl SalvadorEnglandEritreaEthiopiaEuropeFijiFranceGermanyGhanaGreeceGrenadaGuatemalaGuyanaHaitiHondurasHong KongHungaryIndiaIndonesiaIranIraqIrelandIsraelItalyJamaicaJapanJordanKazakhstanKenyaKoreaKuwaitLaosLatin AmericaLatviaLebanonLiberiaLithuaniaMalaysiaMexicoMicronesiaMiddle AfricaMoldovaMoroccoNepalNetherlandsNicaraguaNigeriaNorth MacedoniaNorthern AfricaNorthern EuropeNorwayOceaniaPakistanPanamaPeruPhilippinesPolandPortugalRomaniaRussiaSaudi ArabiaScotlandSenegalSerbiaSierra LeoneSingaporeSomaliaSouth AfricaSouth AmericaSouth Central AsiaSouth Eastern AsiaSouthern EuropeSpainSri LankaSt. Vincent and the GrenadinesSudanSwedenSwitzerlandSyriaTaiwanThailandTrinidad and TobagoTurkeyUgandaUkraineUruguayUzbekistanVenezuelaVietnamWest IndiesWestern AfricaWestern AsiaWestern EuropeYemenZaireZimbabwe
Immigrant Origin (Percentage)
AfghanistanAfricaAlbaniaArgentinaArmeniaAsiaAustraliaAustriaAzoresBahamasBangladeshBarbadosBelarusBelgiumBelizeBoliviaBosnia and HerzegovinaBrazilBulgariaBurma / MyanmarCabo VerdeCambodiaCameroonCanadaCaribbeanCentral AmericaChileChinaColombiaCongoCosta RicaCroatiaCubaCzechoslovakiaDenmarkDominicaDominican RepublicEastern AfricaEastern AsiaEastern EuropeEcuadorEgyptEl SalvadorEnglandEritreaEthiopiaEuropeFijiFranceGermanyGhanaGreeceGrenadaGuatemalaGuyanaHaitiHondurasHong KongHungaryIndiaIndonesiaIranIraqIrelandIsraelItalyJamaicaJapanJordanKazakhstanKenyaKoreaKuwaitLaosLatin AmericaLatviaLebanonLiberiaLithuaniaMalaysiaMexicoMicronesiaMiddle AfricaMoldovaMoroccoNepalNetherlandsNicaraguaNigeriaNorth MacedoniaNorthern AfricaNorthern EuropeNorwayOceaniaPakistanPanamaPeruPhilippinesPolandPortugalRomaniaRussiaSaudi ArabiaScotlandSenegalSerbiaSierra LeoneSingaporeSomaliaSouth AfricaSouth AmericaSouth Central AsiaSouth Eastern AsiaSouthern EuropeSpainSri LankaSt. Vincent and the GrenadinesSudanSwedenSwitzerlandSyriaTaiwanThailandTrinidad and TobagoTurkeyUgandaUkraineUruguayUzbekistanVenezuelaVietnamWest IndiesWestern AfricaWestern AsiaWestern EuropeYemenZaireZimbabwe
Income
Income (Families)
Income (Households)
Poverty
Poverty (Families)
Unemployment
Employment Occupations
Employment Industries
Employer Class
Commute Time
Commute Means
School Enrollment
Education by Degree Field
Occupancy
Finances
Physical Characteristics
Nevada
Compare Cities
Comparison Subject

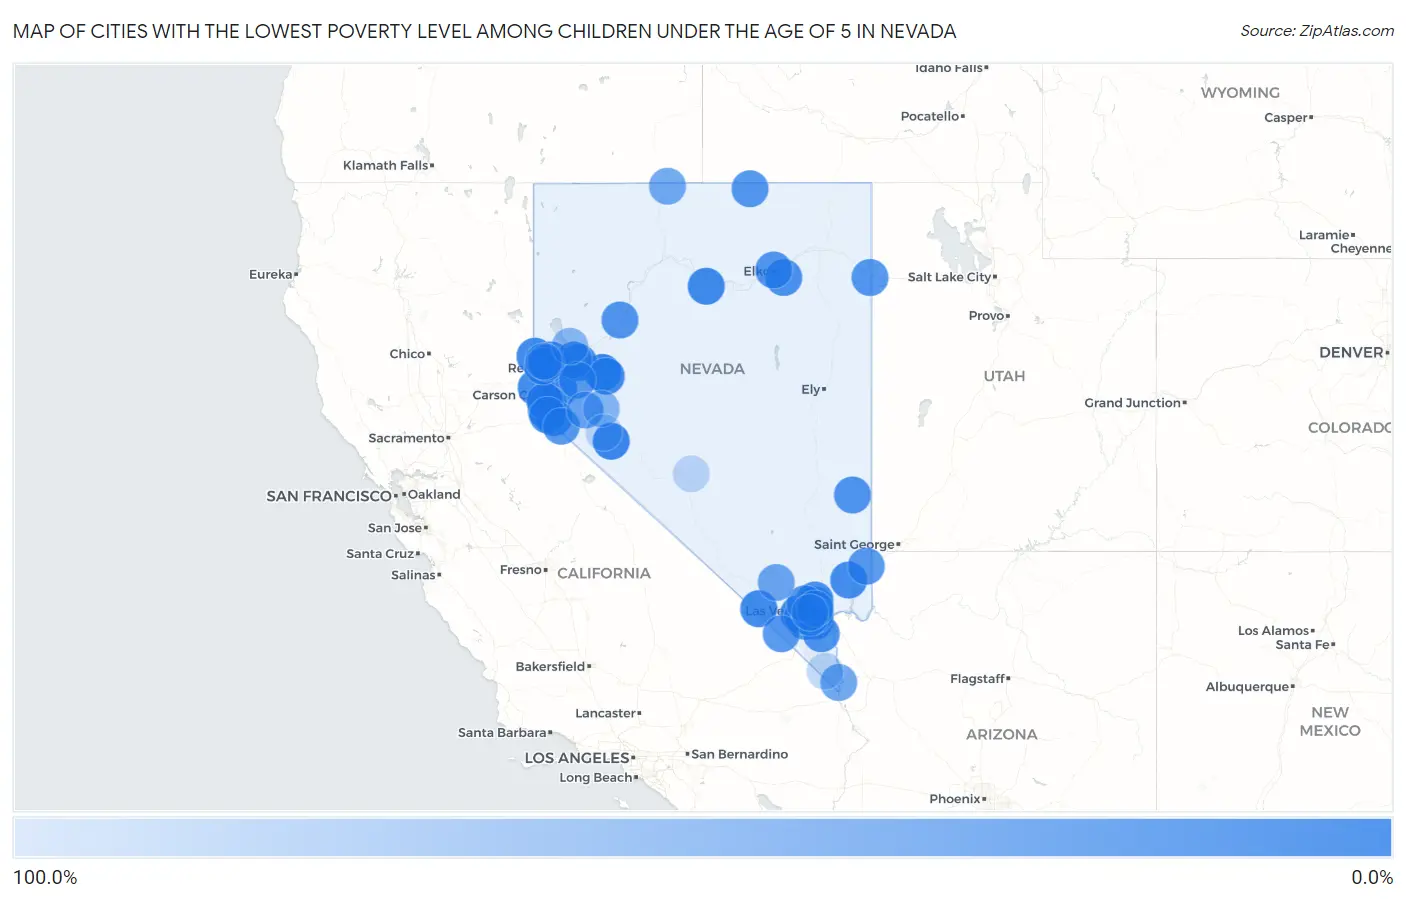
Map of Cities with the Lowest Poverty Level Among Children Under the Age of 5 in Nevada

100.0%
0.0%
Cities with the Lowest Poverty Level Among Children Under the Age of 5 in Nevada Map

Cities with the Lowest Poverty Level Among Children Under the Age of 5 in Nevada

City Child Poverty vs State vs National
1.Hawthorne1.4%18.2%(-16.8)#118.1%(-16.7)#181
2.Fallon2.2%18.2%(-16.0)#218.1%(-15.9)#403
3.Dayton3.2%18.2%(-15.0)#318.1%(-14.8)#807
4.Minden4.0%18.2%(-14.2)#418.1%(-14.1)#1,128
5.Summerlin South4.9%18.2%(-13.3)#518.1%(-13.1)#1,541
6.Johnson Lane5.6%18.2%(-12.6)#618.1%(-12.4)#1,840
7.Cold Springs5.7%18.2%(-12.5)#718.1%(-12.4)#1,875
8.Spanish Springs6.2%18.2%(-12.0)#818.1%(-11.9)#2,065
9.Carter Springs6.2%18.2%(-12.0)#918.1%(-11.8)#2,103
10.Battle Mountain6.9%18.2%(-11.3)#1018.1%(-11.1)#2,390
11.Pahrump7.7%18.2%(-10.5)#1118.1%(-10.4)#2,696
12.Sparks8.5%18.2%(-9.69)#1218.1%(-9.54)#3,053
13.Incline Village8.6%18.2%(-9.62)#1318.1%(-9.47)#3,080
14.Moapa Valley9.5%18.2%(-8.67)#1418.1%(-8.52)#3,492
15.Nellis Afb9.6%18.2%(-8.65)#1518.1%(-8.50)#3,498
16.Fernley9.8%18.2%(-8.41)#1618.1%(-8.26)#3,581
17.Fallon Station10.0%18.2%(-8.16)#1718.1%(-8.01)#3,685
18.Henderson10.5%18.2%(-7.73)#1818.1%(-7.58)#3,841
19.Enterprise11.2%18.2%(-6.98)#1918.1%(-6.83)#4,164
20.Carson12.3%18.2%(-5.93)#2018.1%(-5.78)#4,545
21.North Las Vegas13.9%18.2%(-4.30)#2118.1%(-4.16)#5,178
22.Indian Hills14.8%18.2%(-3.40)#2218.1%(-3.25)#5,517
23.Spring Creek15.6%18.2%(-2.65)#2318.1%(-2.50)#5,790
24.Reno15.7%18.2%(-2.53)#2418.1%(-2.38)#5,831
25.Spring Valley18.1%18.2%(-0.086)#2518.1%(+0.063)#6,639
26.Gardnerville Ranchos18.1%18.2%(-0.069)#2618.1%(+0.081)#6,643
27.Boulder City18.3%18.2%(+0.102)#2718.1%(+0.251)#6,725
28.Wadsworth18.5%18.2%(+0.306)#2818.1%(+0.456)#6,782
29.Panaca18.5%18.2%(+0.336)#2918.1%(+0.486)#6,794
30.Lovelock19.1%18.2%(+0.879)#3018.1%(+1.03)#6,972
31.Elko19.8%18.2%(+1.63)#3118.1%(+1.78)#7,199
32.Sun Valley20.6%18.2%(+2.35)#3218.1%(+2.50)#7,437
33.West Wendover21.4%18.2%(+3.20)#3318.1%(+3.35)#7,682
34.Owyhee21.7%18.2%(+3.53)#3418.1%(+3.68)#7,813
35.Whitney22.6%18.2%(+4.41)#3518.1%(+4.56)#8,098
36.Paradise23.4%18.2%(+5.18)#3618.1%(+5.33)#8,313
37.Topaz Ranch Estates23.5%18.2%(+5.32)#3718.1%(+5.47)#8,339
38.Las Vegas24.1%18.2%(+5.93)#3818.1%(+6.08)#8,529
39.Mesquite25.0%18.2%(+6.79)#3918.1%(+6.94)#8,707
40.Sandy Valley25.0%18.2%(+6.79)#4018.1%(+6.94)#8,723
41.Silver Springs25.9%18.2%(+7.71)#4118.1%(+7.86)#9,010
42.Sunrise Manor34.2%18.2%(+16.0)#4218.1%(+16.2)#10,914
43.Yerington36.1%18.2%(+17.9)#4318.1%(+18.1)#11,273
44.Indian Springs38.9%18.2%(+20.7)#4418.1%(+20.8)#11,745
45.Laughlin41.2%18.2%(+23.0)#4518.1%(+23.1)#12,119
46.Fort Mcdermitt42.1%18.2%(+23.9)#4618.1%(+24.0)#12,263
47.Winchester42.7%18.2%(+24.4)#4718.1%(+24.6)#12,335
48.Schurz60.9%18.2%(+42.7)#4818.1%(+42.9)#14,399
49.Nixon64.1%18.2%(+45.9)#4918.1%(+46.0)#14,653
50.Golden Valley74.0%18.2%(+55.7)#5018.1%(+55.9)#15,244
51.Tonopah100.0%18.2%(+81.8)#5118.1%(+81.9)#15,983
52.Amargosa Valley100.0%18.2%(+81.8)#5218.1%(+81.9)#16,027
53.Walker Lake100.0%18.2%(+81.8)#5318.1%(+81.9)#16,296
54.Cal Nev Ari100.0%18.2%(+81.8)#5418.1%(+81.9)#16,412

Common Questions

What are the Top 10 Cities with the Lowest Poverty Level Among Children Under the Age of 5 in Nevada?
Top 10 Cities with the Lowest Poverty Level Among Children Under the Age of 5 in Nevada are:
What city has the Lowest Poverty Level Among Children Under the Age of 5 in Nevada?
Hawthorne has the Lowest Poverty Level Among Children Under the Age of 5 in Nevada with 1.4%.
What is the Poverty Level Among Children Under the Age of 5 in the State of Nevada?
Poverty Level Among Children Under the Age of 5 in Nevada is 18.2%.
What is the Poverty Level Among Children Under the Age of 5 in the United States?
Poverty Level Among Children Under the Age of 5 in the United States is 18.1%.