Zillah, WA Map & Demographics
Zillah Map
Zillah Overview
$28,745
PER CAPITA INCOME
$77,102
AVG FAMILY INCOME
$68,701
AVG HOUSEHOLD INCOME
24.6%
WAGE / INCOME GAP [ % ]
75.4¢/ $1
WAGE / INCOME GAP [ $ ]
$12,486
FAMILY INCOME DEFICIT
0.41
INEQUALITY / GINI INDEX
3,153
TOTAL POPULATION
1,512
MALE POPULATION
1,641
FEMALE POPULATION
92.14
MALES / 100 FEMALES
108.53
FEMALES / 100 MALES
33.1
MEDIAN AGE
3.3
AVG FAMILY SIZE
2.8
AVG HOUSEHOLD SIZE
1,417
LABOR FORCE [ PEOPLE ]
62.1%
PERCENT IN LABOR FORCE
3.1%
UNEMPLOYMENT RATE
Zillah Zip Codes
Zillah Area Codes
Income in Zillah
Income Overview in Zillah
Per Capita Income in Zillah is $28,745, while median incomes of families and households are $77,102 and $68,701 respectively.
| Characteristic | Number | Measure |
| Per Capita Income | 3,153 | $28,745 |
| Median Family Income | 721 | $77,102 |
| Mean Family Income | 721 | $94,105 |
| Median Household Income | 1,116 | $68,701 |
| Mean Household Income | 1,116 | $81,788 |
| Income Deficit | 721 | $12,486 |
| Wage / Income Gap (%) | 3,153 | 24.59% |
| Wage / Income Gap ($) | 3,153 | 75.41¢ per $1 |
| Gini / Inequality Index | 3,153 | 0.41 |
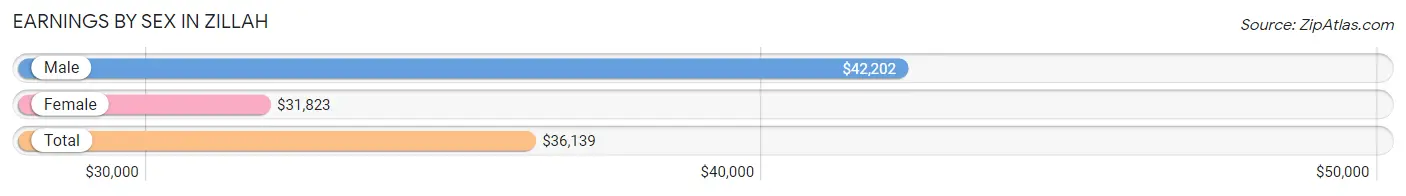
Earnings by Sex in Zillah
Average Earnings in Zillah are $36,139, $42,202 for men and $31,823 for women, a difference of 24.6%.
| Sex | Number | Average Earnings |
| Male | 783 (52.3%) | $42,202 |
| Female | 713 (47.7%) | $31,823 |
| Total | 1,496 (100.0%) | $36,139 |
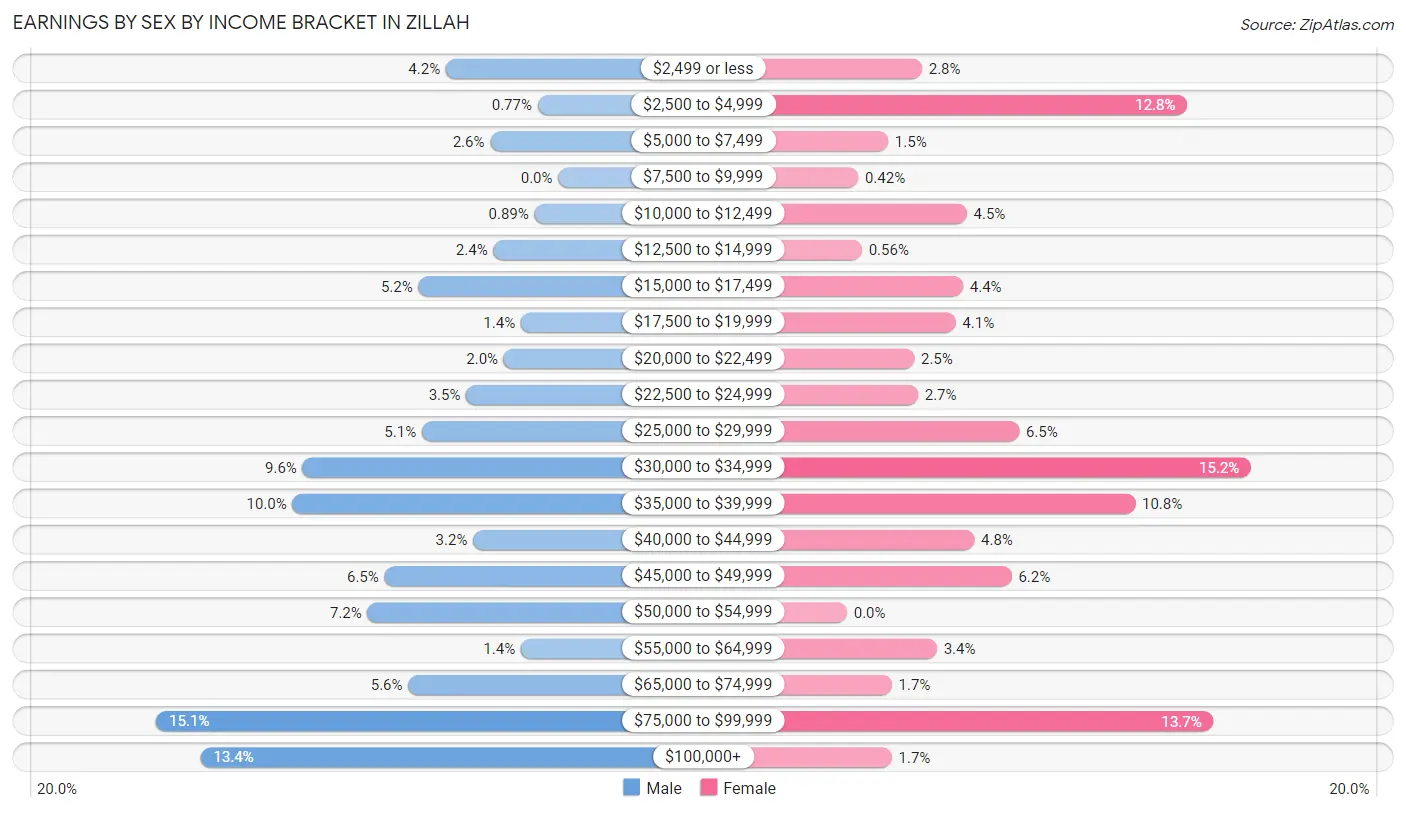
Earnings by Sex by Income Bracket in Zillah
The most common earnings brackets in Zillah are $75,000 to $99,999 for men (118 | 15.1%) and $30,000 to $34,999 for women (108 | 15.1%).
| Income | Male | Female |
| $2,499 or less | 33 (4.2%) | 20 (2.8%) |
| $2,500 to $4,999 | 6 (0.8%) | 91 (12.8%) |
| $5,000 to $7,499 | 20 (2.5%) | 11 (1.5%) |
| $7,500 to $9,999 | 0 (0.0%) | 3 (0.4%) |
| $10,000 to $12,499 | 7 (0.9%) | 32 (4.5%) |
| $12,500 to $14,999 | 19 (2.4%) | 4 (0.6%) |
| $15,000 to $17,499 | 41 (5.2%) | 31 (4.3%) |
| $17,500 to $19,999 | 11 (1.4%) | 29 (4.1%) |
| $20,000 to $22,499 | 16 (2.0%) | 18 (2.5%) |
| $22,500 to $24,999 | 27 (3.5%) | 19 (2.7%) |
| $25,000 to $29,999 | 40 (5.1%) | 46 (6.5%) |
| $30,000 to $34,999 | 75 (9.6%) | 108 (15.1%) |
| $35,000 to $39,999 | 78 (10.0%) | 77 (10.8%) |
| $40,000 to $44,999 | 25 (3.2%) | 34 (4.8%) |
| $45,000 to $49,999 | 51 (6.5%) | 44 (6.2%) |
| $50,000 to $54,999 | 56 (7.1%) | 0 (0.0%) |
| $55,000 to $64,999 | 11 (1.4%) | 24 (3.4%) |
| $65,000 to $74,999 | 44 (5.6%) | 12 (1.7%) |
| $75,000 to $99,999 | 118 (15.1%) | 98 (13.7%) |
| $100,000+ | 105 (13.4%) | 12 (1.7%) |
| Total | 783 (100.0%) | 713 (100.0%) |
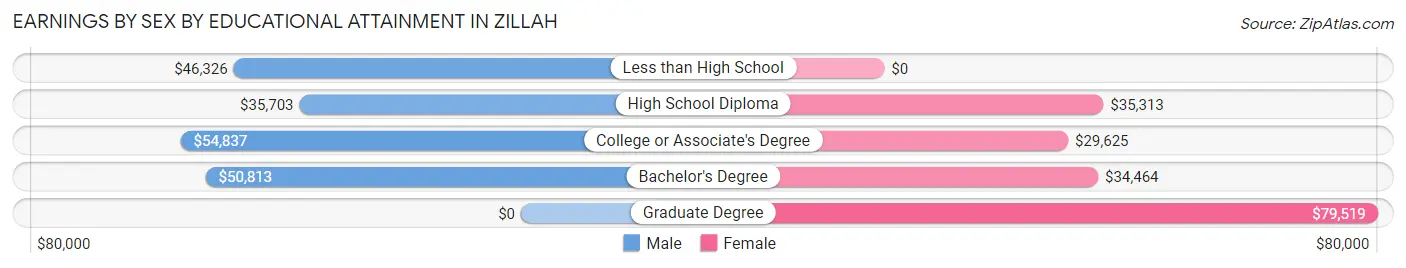
Earnings by Sex by Educational Attainment in Zillah
Average earnings in Zillah are $47,778 for men and $32,743 for women, a difference of 31.5%. Men with an educational attainment of college or associate's degree enjoy the highest average annual earnings of $54,837, while those with high school diploma education earn the least with $35,703. Women with an educational attainment of graduate degree earn the most with the average annual earnings of $79,519, while those with college or associate's degree education have the smallest earnings of $29,625.
| Educational Attainment | Male Income | Female Income |
| Less than High School | $46,326 | $0 |
| High School Diploma | $35,703 | $35,313 |
| College or Associate's Degree | $54,837 | $29,625 |
| Bachelor's Degree | $50,813 | $34,464 |
| Graduate Degree | - | - |
| Total | $47,778 | $32,743 |
Family Income in Zillah
Family Income Brackets in Zillah
According to the Zillah family income data, there are 183 families falling into the $50,000 to $74,999 income range, which is the most common income bracket and makes up 25.4% of all families. Conversely, the $10,000 to $14,999 income bracket is the least frequent group with only 16 families (2.2%) belonging to this category.
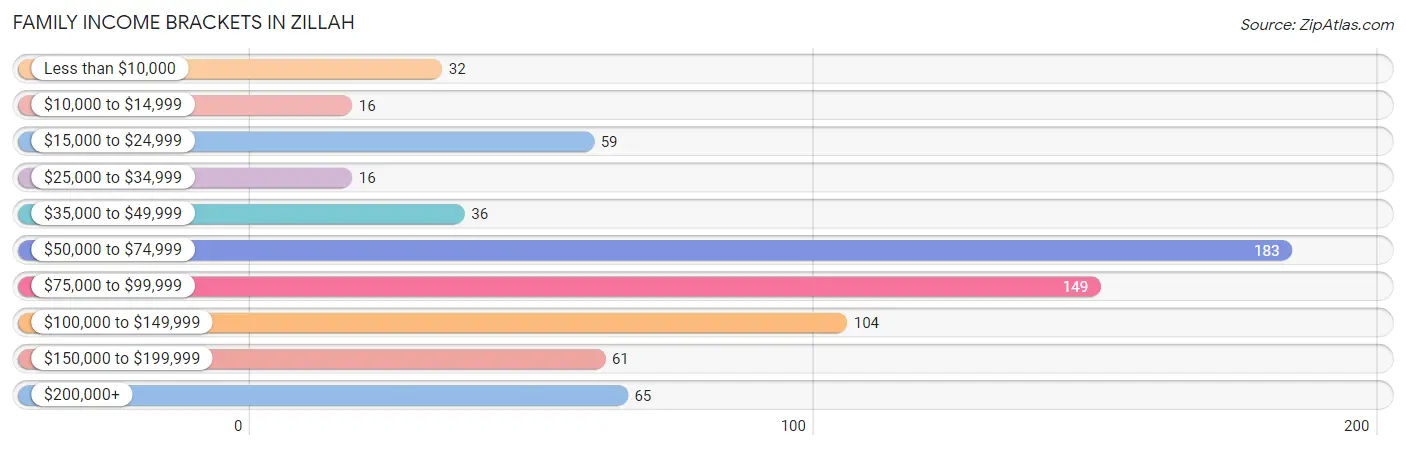
| Income Bracket | # Families | % Families |
| Less than $10,000 | 32 | 4.4% |
| $10,000 to $14,999 | 16 | 2.2% |
| $15,000 to $24,999 | 59 | 8.2% |
| $25,000 to $34,999 | 16 | 2.2% |
| $35,000 to $49,999 | 36 | 5.0% |
| $50,000 to $74,999 | 183 | 25.4% |
| $75,000 to $99,999 | 149 | 20.7% |
| $100,000 to $149,999 | 104 | 14.4% |
| $150,000 to $199,999 | 61 | 8.5% |
| $200,000+ | 65 | 9.0% |
Family Income by Famaliy Size in Zillah
5-person families (127 | 17.6%) account for the highest median family income in Zillah with $97,188 per family, while 2-person families (301 | 41.7%) have the highest median income of $39,732 per family member.
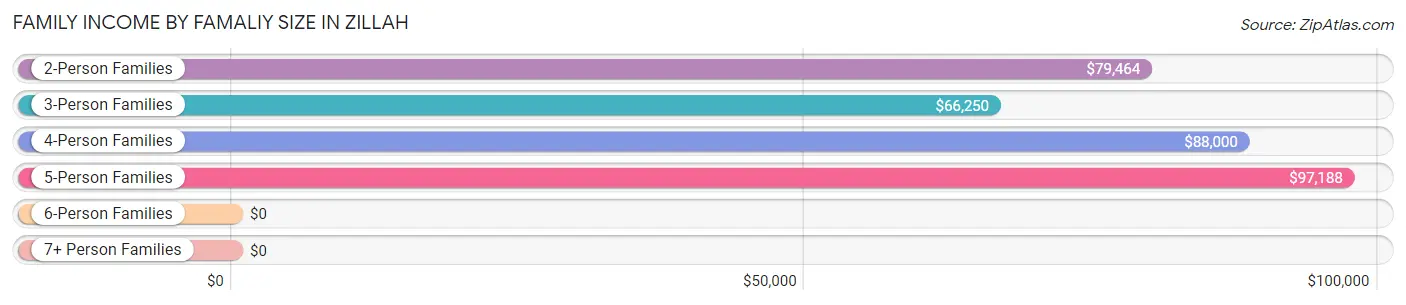
| Income Bracket | # Families | Median Income |
| 2-Person Families | 301 (41.7%) | $79,464 |
| 3-Person Families | 174 (24.1%) | $66,250 |
| 4-Person Families | 102 (14.1%) | $88,000 |
| 5-Person Families | 127 (17.6%) | $97,188 |
| 6-Person Families | 8 (1.1%) | $0 |
| 7+ Person Families | 9 (1.3%) | $0 |
| Total | 721 (100.0%) | $77,102 |
Family Income by Number of Earners in Zillah
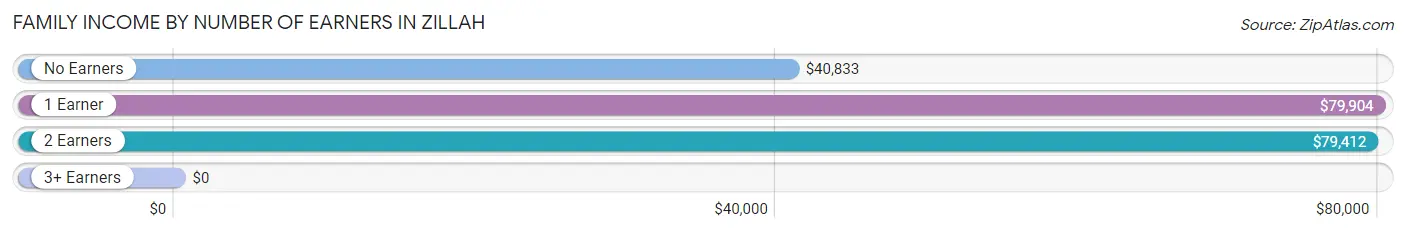
| Number of Earners | # Families | Median Income |
| No Earners | 138 (19.1%) | $40,833 |
| 1 Earner | 223 (30.9%) | $79,904 |
| 2 Earners | 316 (43.8%) | $79,412 |
| 3+ Earners | 44 (6.1%) | $0 |
| Total | 721 (100.0%) | $77,102 |
Household Income in Zillah
Household Income Brackets in Zillah
With 230 households falling in the category, the $50,000 to $74,999 income range is the most frequent in Zillah, accounting for 20.6% of all households. In contrast, only 44 households (3.9%) fall into the less than $10,000 income bracket, making it the least populous group.
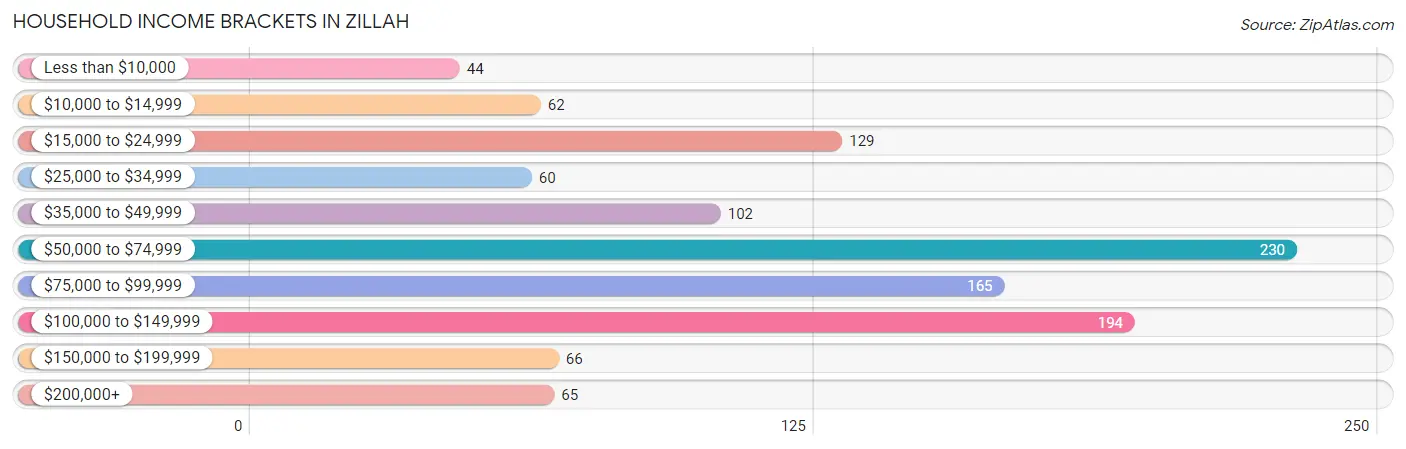
| Income Bracket | # Households | % Households |
| Less than $10,000 | 44 | 3.9% |
| $10,000 to $14,999 | 62 | 5.6% |
| $15,000 to $24,999 | 129 | 11.6% |
| $25,000 to $34,999 | 60 | 5.4% |
| $35,000 to $49,999 | 102 | 9.1% |
| $50,000 to $74,999 | 230 | 20.6% |
| $75,000 to $99,999 | 165 | 14.8% |
| $100,000 to $149,999 | 194 | 17.4% |
| $150,000 to $199,999 | 66 | 5.9% |
| $200,000+ | 65 | 5.8% |
Household Income by Householder Age in Zillah
The median household income in Zillah is $68,701, with the highest median household income of $94,375 found in the 45 to 64 years age bracket for the primary householder. A total of 249 households (22.3%) fall into this category. Meanwhile, the 15 to 24 years age bracket for the primary householder has the lowest median household income of $0, with 66 households (5.9%) in this group.
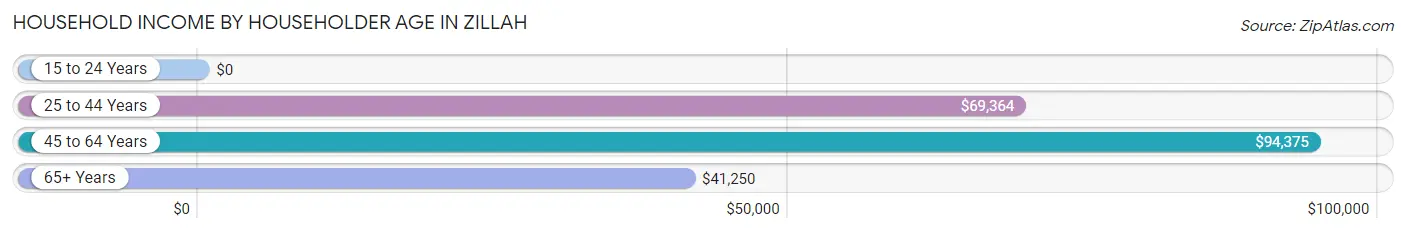
| Income Bracket | # Households | Median Income |
| 15 to 24 Years | 66 (5.9%) | $0 |
| 25 to 44 Years | 509 (45.6%) | $69,364 |
| 45 to 64 Years | 249 (22.3%) | $94,375 |
| 65+ Years | 292 (26.2%) | $41,250 |
| Total | 1,116 (100.0%) | $68,701 |
Poverty in Zillah
Income Below Poverty by Sex and Age in Zillah
With 9.1% poverty level for males and 17.7% for females among the residents of Zillah, 18 to 24 year old males and 35 to 44 year old females are the most vulnerable to poverty, with 44 males (31.4%) and 76 females (37.6%) in their respective age groups living below the poverty level.
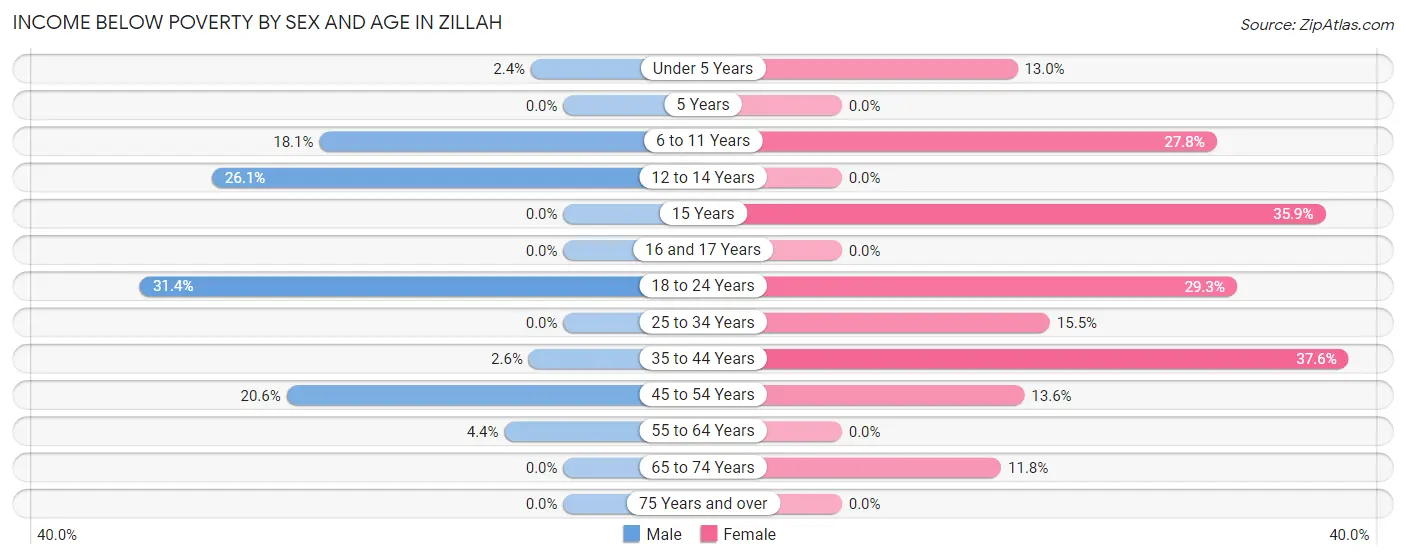
| Age Bracket | Male | Female |
| Under 5 Years | 2 (2.4%) | 21 (13.0%) |
| 5 Years | 0 (0.0%) | 0 (0.0%) |
| 6 to 11 Years | 25 (18.1%) | 69 (27.8%) |
| 12 to 14 Years | 18 (26.1%) | 0 (0.0%) |
| 15 Years | 0 (0.0%) | 14 (35.9%) |
| 16 and 17 Years | 0 (0.0%) | 0 (0.0%) |
| 18 to 24 Years | 44 (31.4%) | 39 (29.3%) |
| 25 to 34 Years | 0 (0.0%) | 34 (15.4%) |
| 35 to 44 Years | 8 (2.6%) | 76 (37.6%) |
| 45 to 54 Years | 30 (20.5%) | 16 (13.6%) |
| 55 to 64 Years | 6 (4.4%) | 0 (0.0%) |
| 65 to 74 Years | 0 (0.0%) | 20 (11.8%) |
| 75 Years and over | 0 (0.0%) | 0 (0.0%) |
| Total | 133 (9.1%) | 289 (17.7%) |
Income Above Poverty by Sex and Age in Zillah
According to the poverty statistics in Zillah, males aged 5 years and females aged 5 years are the age groups that are most secure financially, with 100.0% of males and 100.0% of females in these age groups living above the poverty line.
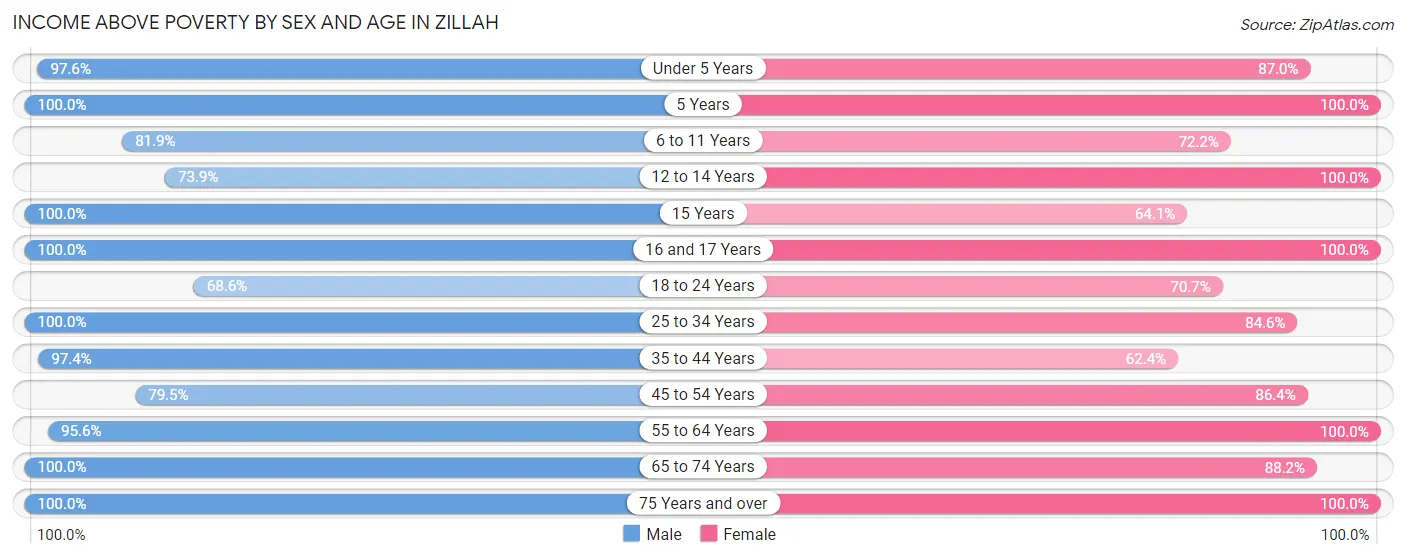
| Age Bracket | Male | Female |
| Under 5 Years | 81 (97.6%) | 140 (87.0%) |
| 5 Years | 5 (100.0%) | 5 (100.0%) |
| 6 to 11 Years | 113 (81.9%) | 179 (72.2%) |
| 12 to 14 Years | 51 (73.9%) | 50 (100.0%) |
| 15 Years | 4 (100.0%) | 25 (64.1%) |
| 16 and 17 Years | 75 (100.0%) | 51 (100.0%) |
| 18 to 24 Years | 96 (68.6%) | 94 (70.7%) |
| 25 to 34 Years | 154 (100.0%) | 186 (84.6%) |
| 35 to 44 Years | 303 (97.4%) | 126 (62.4%) |
| 45 to 54 Years | 116 (79.4%) | 102 (86.4%) |
| 55 to 64 Years | 131 (95.6%) | 123 (100.0%) |
| 65 to 74 Years | 131 (100.0%) | 149 (88.2%) |
| 75 Years and over | 60 (100.0%) | 112 (100.0%) |
| Total | 1,320 (90.8%) | 1,342 (82.3%) |
Income Below Poverty Among Married-Couple Families in Zillah
The poverty statistics for married-couple families in Zillah show that 4.8% or 24 of the total 505 families live below the poverty line. Families with 1 or 2 children have the highest poverty rate of 15.2%, comprising of 22 families. On the other hand, families with no children have the lowest poverty rate of 0.0%, which includes 0 families.
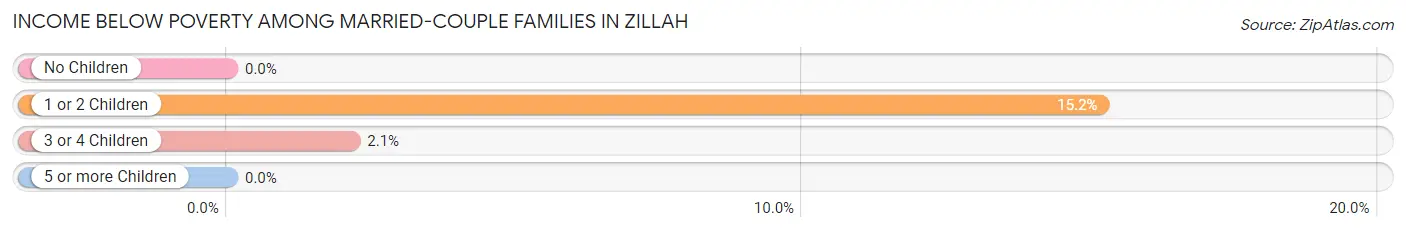
| Children | Above Poverty | Below Poverty |
| No Children | 266 (100.0%) | 0 (0.0%) |
| 1 or 2 Children | 123 (84.8%) | 22 (15.2%) |
| 3 or 4 Children | 92 (97.9%) | 2 (2.1%) |
| 5 or more Children | 0 (0.0%) | 0 (0.0%) |
| Total | 481 (95.3%) | 24 (4.8%) |
Income Below Poverty Among Single-Parent Households in Zillah
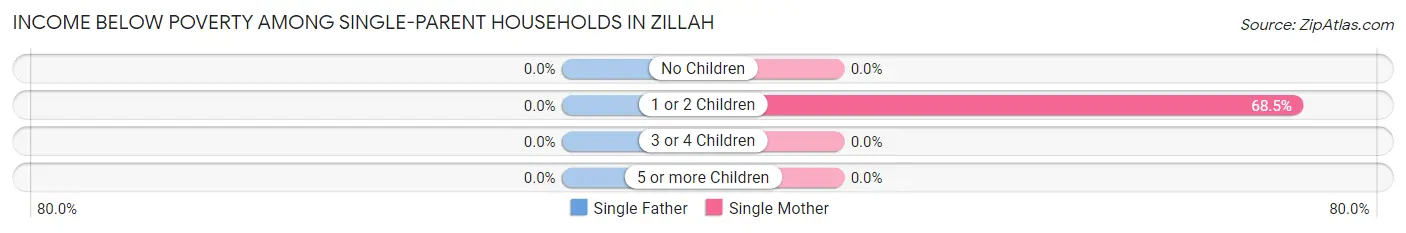
| Children | Single Father | Single Mother |
| No Children | 0 (0.0%) | 0 (0.0%) |
| 1 or 2 Children | 0 (0.0%) | 61 (68.5%) |
| 3 or 4 Children | 0 (0.0%) | 0 (0.0%) |
| 5 or more Children | 0 (0.0%) | 0 (0.0%) |
| Total | 0 (0.0%) | 61 (40.4%) |
Income Below Poverty Among Married-Couple vs Single-Parent Households in Zillah
The poverty data for Zillah shows that 24 of the married-couple family households (4.8%) and 61 of the single-parent households (28.2%) are living below the poverty level. Within the married-couple family households, those with 1 or 2 children have the highest poverty rate, with 22 households (15.2%) falling below the poverty line. Among the single-parent households, those with 1 or 2 children have the highest poverty rate, with 61 household (43.0%) living below poverty.
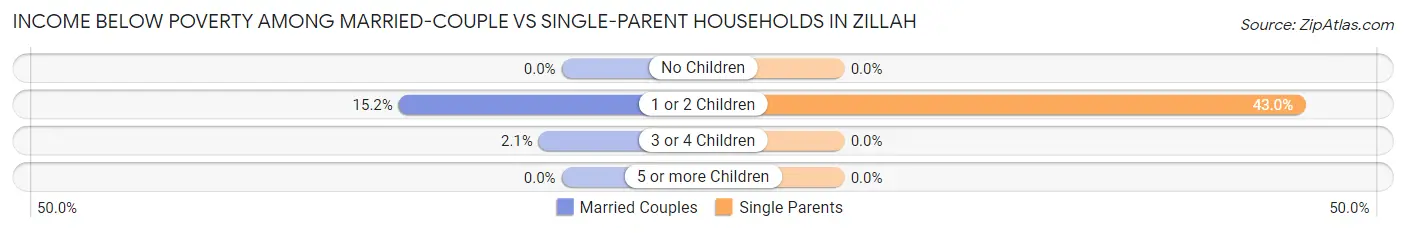
| Children | Married-Couple Families | Single-Parent Households |
| No Children | 0 (0.0%) | 0 (0.0%) |
| 1 or 2 Children | 22 (15.2%) | 61 (43.0%) |
| 3 or 4 Children | 2 (2.1%) | 0 (0.0%) |
| 5 or more Children | 0 (0.0%) | 0 (0.0%) |
| Total | 24 (4.8%) | 61 (28.2%) |
Race in Zillah
The most populous races in Zillah are White / Caucasian (1,891 | 60.0%), Hispanic or Latino (1,515 | 48.0%), and Two or more Races (790 | 25.1%).
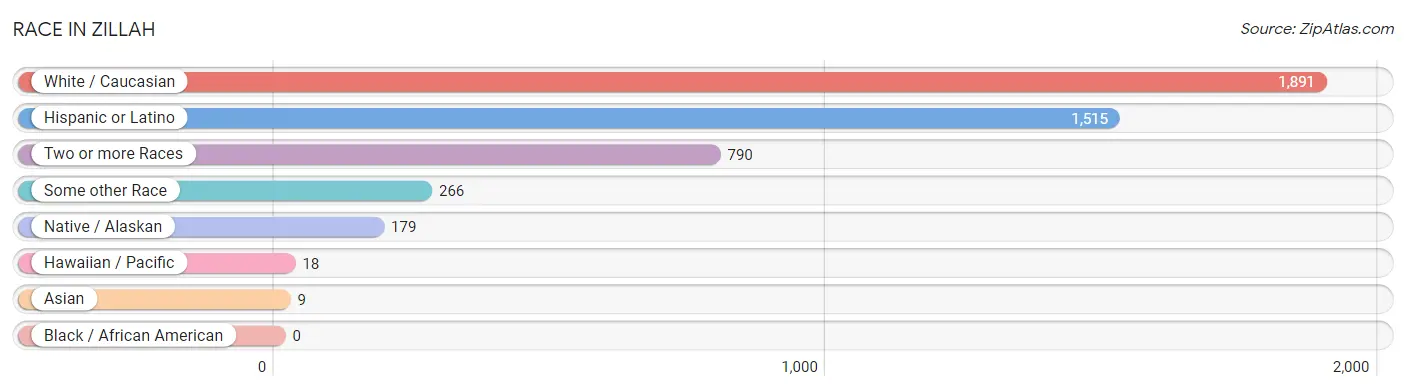
| Race | # Population | % Population |
| Asian | 9 | 0.3% |
| Black / African American | 0 | 0.0% |
| Hawaiian / Pacific | 18 | 0.6% |
| Hispanic or Latino | 1,515 | 48.0% |
| Native / Alaskan | 179 | 5.7% |
| White / Caucasian | 1,891 | 60.0% |
| Two or more Races | 790 | 25.1% |
| Some other Race | 266 | 8.4% |
| Total | 3,153 | 100.0% |
Ancestry in Zillah
The most populous ancestries reported in Zillah are Mexican (1,458 | 46.2%), German (414 | 13.1%), Korean (266 | 8.4%), English (200 | 6.3%), and Irish (157 | 5.0%), together accounting for 79.1% of all Zillah residents.
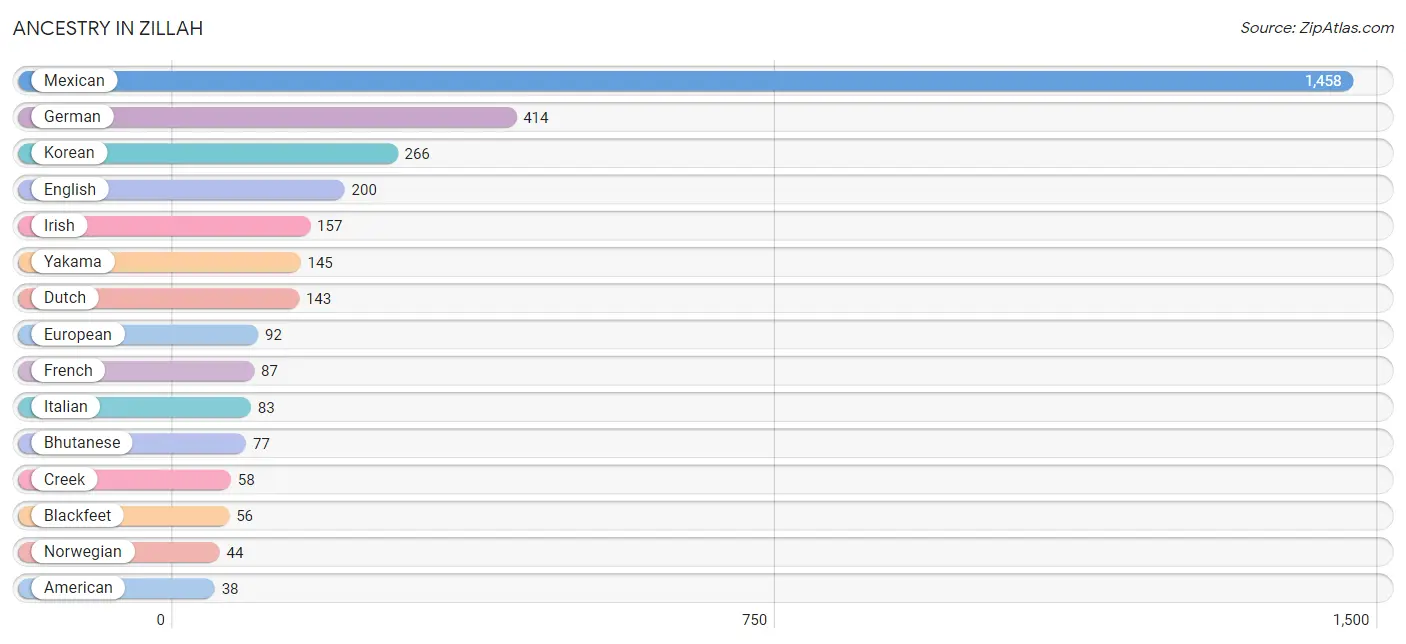
| Ancestry | # Population | % Population |
| American | 38 | 1.2% |
| Apache | 15 | 0.5% |
| Bhutanese | 77 | 2.4% |
| Blackfeet | 56 | 1.8% |
| British | 28 | 0.9% |
| Chickasaw | 5 | 0.2% |
| Creek | 58 | 1.8% |
| Danish | 18 | 0.6% |
| Delaware | 6 | 0.2% |
| Dutch | 143 | 4.5% |
| English | 200 | 6.3% |
| European | 92 | 2.9% |
| French | 87 | 2.8% |
| German | 414 | 13.1% |
| Irish | 157 | 5.0% |
| Italian | 83 | 2.6% |
| Jamaican | 5 | 0.2% |
| Korean | 266 | 8.4% |
| Mexican | 1,458 | 46.2% |
| Mexican American Indian | 5 | 0.2% |
| Native Hawaiian | 18 | 0.6% |
| Norwegian | 44 | 1.4% |
| Polish | 6 | 0.2% |
| Puerto Rican | 29 | 0.9% |
| Romanian | 4 | 0.1% |
| Scotch-Irish | 37 | 1.2% |
| Scottish | 15 | 0.5% |
| Spaniard | 1 | 0.0% |
| Spanish | 11 | 0.4% |
| Swedish | 16 | 0.5% |
| Swiss | 5 | 0.2% |
| Welsh | 21 | 0.7% |
| Yakama | 145 | 4.6% | View All 33 Rows |
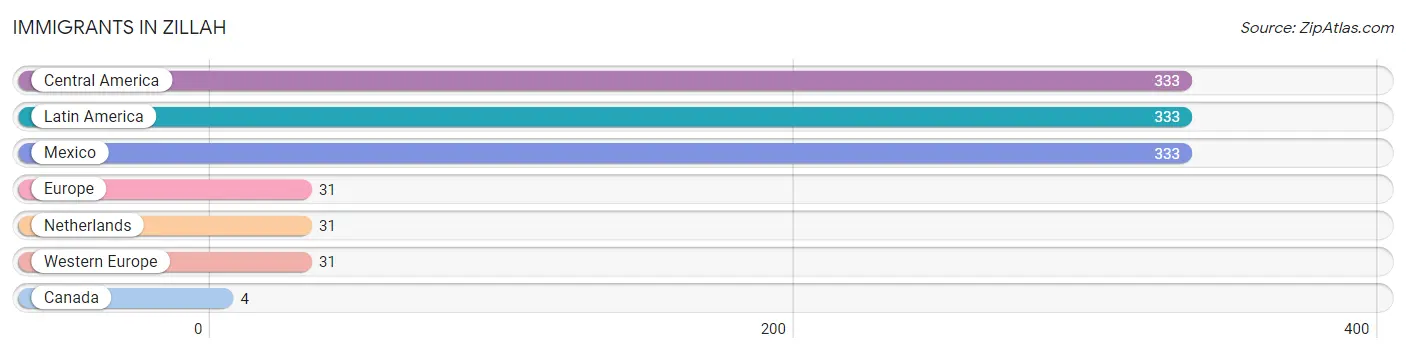
Immigrants in Zillah
The most numerous immigrant groups reported in Zillah came from Central America (333 | 10.6%), Latin America (333 | 10.6%), Mexico (333 | 10.6%), Europe (31 | 1.0%), and Netherlands (31 | 1.0%), together accounting for 33.6% of all Zillah residents.
| Immigration Origin | # Population | % Population |
| Canada | 4 | 0.1% |
| Central America | 333 | 10.6% |
| Europe | 31 | 1.0% |
| Latin America | 333 | 10.6% |
| Mexico | 333 | 10.6% |
| Netherlands | 31 | 1.0% |
| Western Europe | 31 | 1.0% | View All 7 Rows |
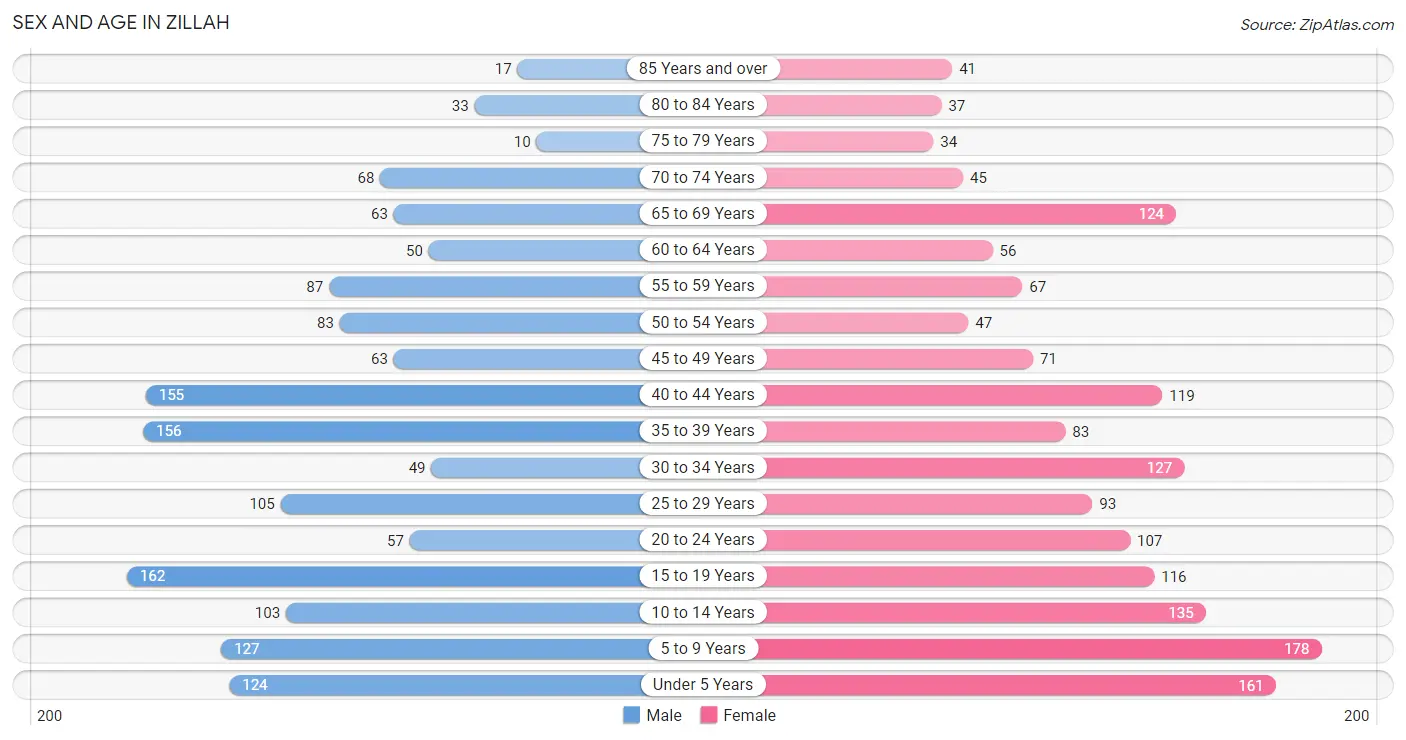
Sex and Age in Zillah
Sex and Age in Zillah
The most populous age groups in Zillah are 15 to 19 Years (162 | 10.7%) for men and 5 to 9 Years (178 | 10.8%) for women.
| Age Bracket | Male | Female |
| Under 5 Years | 124 (8.2%) | 161 (9.8%) |
| 5 to 9 Years | 127 (8.4%) | 178 (10.8%) |
| 10 to 14 Years | 103 (6.8%) | 135 (8.2%) |
| 15 to 19 Years | 162 (10.7%) | 116 (7.1%) |
| 20 to 24 Years | 57 (3.8%) | 107 (6.5%) |
| 25 to 29 Years | 105 (6.9%) | 93 (5.7%) |
| 30 to 34 Years | 49 (3.2%) | 127 (7.7%) |
| 35 to 39 Years | 156 (10.3%) | 83 (5.1%) |
| 40 to 44 Years | 155 (10.2%) | 119 (7.2%) |
| 45 to 49 Years | 63 (4.2%) | 71 (4.3%) |
| 50 to 54 Years | 83 (5.5%) | 47 (2.9%) |
| 55 to 59 Years | 87 (5.8%) | 67 (4.1%) |
| 60 to 64 Years | 50 (3.3%) | 56 (3.4%) |
| 65 to 69 Years | 63 (4.2%) | 124 (7.6%) |
| 70 to 74 Years | 68 (4.5%) | 45 (2.7%) |
| 75 to 79 Years | 10 (0.7%) | 34 (2.1%) |
| 80 to 84 Years | 33 (2.2%) | 37 (2.2%) |
| 85 Years and over | 17 (1.1%) | 41 (2.5%) |
| Total | 1,512 (100.0%) | 1,641 (100.0%) |
Families and Households in Zillah
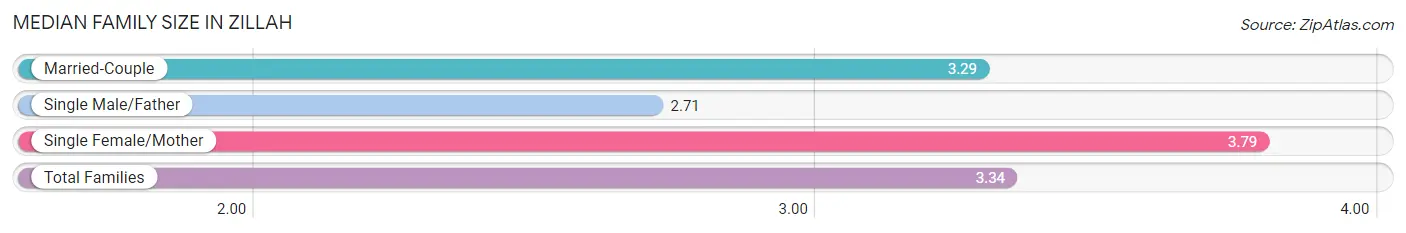
Median Family Size in Zillah
The median family size in Zillah is 3.34 persons per family, with single female/mother families (151 | 20.9%) accounting for the largest median family size of 3.79 persons per family. On the other hand, single male/father families (65 | 9.0%) represent the smallest median family size with 2.71 persons per family.
| Family Type | # Families | Family Size |
| Married-Couple | 505 (70.0%) | 3.29 |
| Single Male/Father | 65 (9.0%) | 2.71 |
| Single Female/Mother | 151 (20.9%) | 3.79 |
| Total Families | 721 (100.0%) | 3.34 |
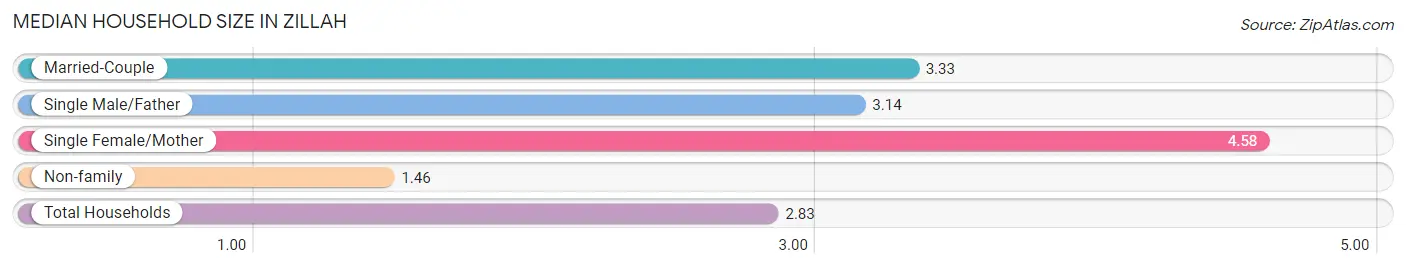
Median Household Size in Zillah
The median household size in Zillah is 2.83 persons per household, with single female/mother households (151 | 13.5%) accounting for the largest median household size of 4.58 persons per household. non-family households (395 | 35.4%) represent the smallest median household size with 1.46 persons per household.
| Household Type | # Households | Household Size |
| Married-Couple | 505 (45.3%) | 3.33 |
| Single Male/Father | 65 (5.8%) | 3.14 |
| Single Female/Mother | 151 (13.5%) | 4.58 |
| Non-family | 395 (35.4%) | 1.46 |
| Total Households | 1,116 (100.0%) | 2.83 |
Household Size by Marriage Status in Zillah
Out of a total of 1,116 households in Zillah, 721 (64.6%) are family households, while 395 (35.4%) are nonfamily households. The most numerous type of family households are 2-person households, comprising 272, and the most common type of nonfamily households are 1-person households, comprising 307.
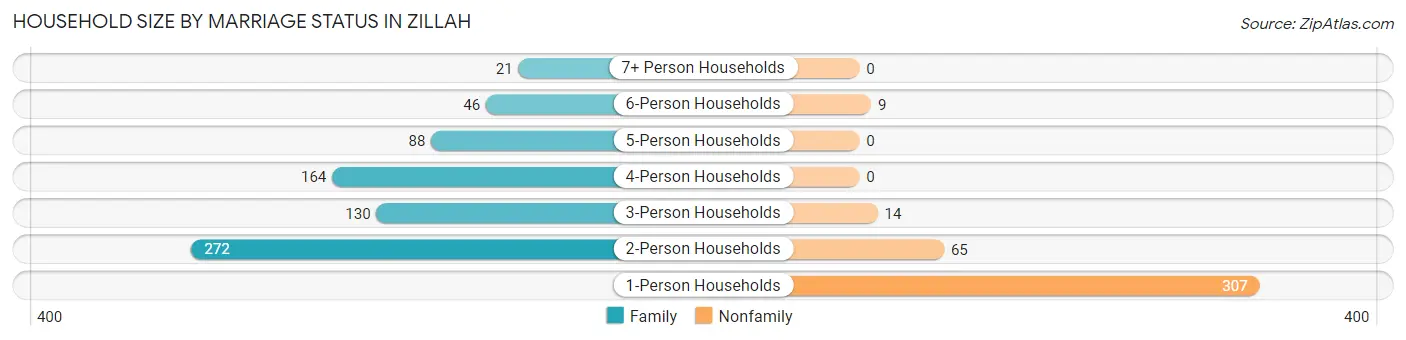
| Household Size | Family Households | Nonfamily Households |
| 1-Person Households | - | 307 (27.5%) |
| 2-Person Households | 272 (24.4%) | 65 (5.8%) |
| 3-Person Households | 130 (11.7%) | 14 (1.3%) |
| 4-Person Households | 164 (14.7%) | 0 (0.0%) |
| 5-Person Households | 88 (7.9%) | 0 (0.0%) |
| 6-Person Households | 46 (4.1%) | 9 (0.8%) |
| 7+ Person Households | 21 (1.9%) | 0 (0.0%) |
| Total | 721 (64.6%) | 395 (35.4%) |
Female Fertility in Zillah
Fertility by Age in Zillah
Average fertility rate in Zillah is 114.0 births per 1,000 women. Women in the age bracket of 20 to 34 years have the highest fertility rate with 187.0 births per 1,000 women. Women in the age bracket of 20 to 34 years acount for 72.6% of all women with births.
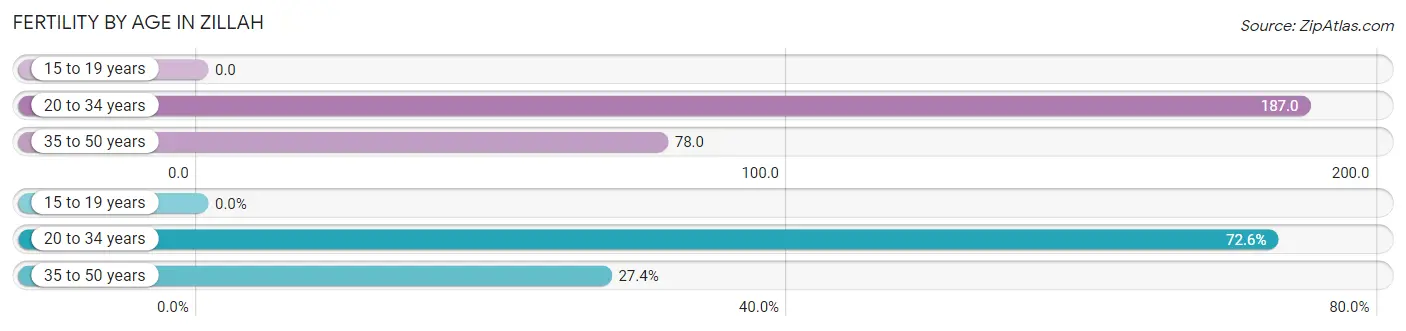
| Age Bracket | Women with Births | Births / 1,000 Women |
| 15 to 19 years | 0 (0.0%) | 0.0 |
| 20 to 34 years | 61 (72.6%) | 187.0 |
| 35 to 50 years | 23 (27.4%) | 78.0 |
| Total | 84 (100.0%) | 114.0 |
Fertility by Age by Marriage Status in Zillah
72.6% of women with births (84) in Zillah are married. The highest percentage of unmarried women with births falls into 35 to 50 years age bracket with 100.0% of them unmarried at the time of birth, while the lowest percentage of unmarried women with births belong to 20 to 34 years age bracket with 0.0% of them unmarried.
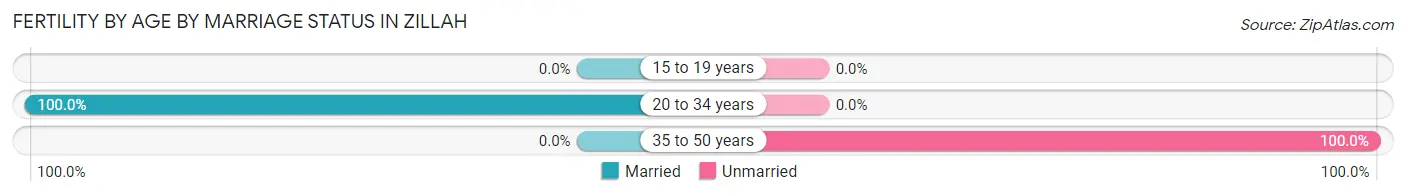
| Age Bracket | Married | Unmarried |
| 15 to 19 years | 0 (0.0%) | 0 (0.0%) |
| 20 to 34 years | 61 (100.0%) | 0 (0.0%) |
| 35 to 50 years | 0 (0.0%) | 23 (100.0%) |
| Total | 61 (72.6%) | 23 (27.4%) |
Fertility by Education in Zillah
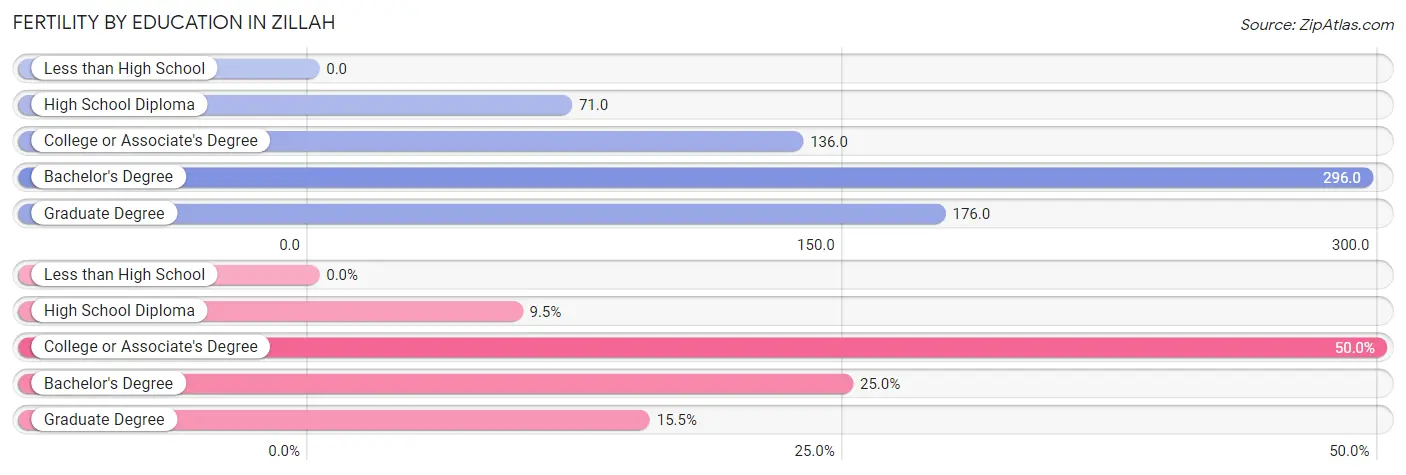
| Educational Attainment | Women with Births | Births / 1,000 Women |
| Less than High School | 0 (0.0%) | 0.0 |
| High School Diploma | 8 (9.5%) | 71.0 |
| College or Associate's Degree | 42 (50.0%) | 136.0 |
| Bachelor's Degree | 21 (25.0%) | 296.0 |
| Graduate Degree | 13 (15.5%) | 176.0 |
| Total | 84 (100.0%) | 114.0 |
Fertility by Education by Marriage Status in Zillah
27.4% of women with births in Zillah are unmarried. Women with the educational attainment of high school diploma are most likely to be married with 100.0% of them married at childbirth, while women with the educational attainment of graduate degree are least likely to be married with 100.0% of them unmarried at childbirth.
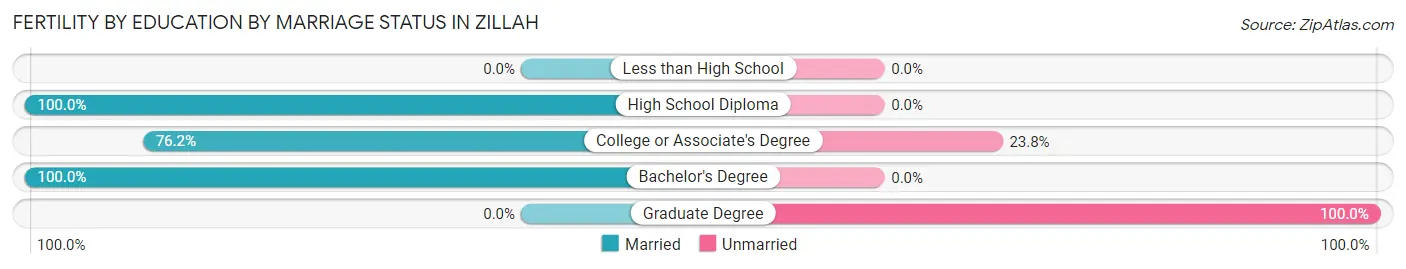
| Educational Attainment | Married | Unmarried |
| Less than High School | 0 (0.0%) | 0 (0.0%) |
| High School Diploma | 8 (100.0%) | 0 (0.0%) |
| College or Associate's Degree | 32 (76.2%) | 10 (23.8%) |
| Bachelor's Degree | 21 (100.0%) | 0 (0.0%) |
| Graduate Degree | 0 (0.0%) | 13 (100.0%) |
| Total | 61 (72.6%) | 23 (27.4%) |
Employment Characteristics in Zillah
Employment by Class of Employer in Zillah
Among the 1,347 employed individuals in Zillah, private company employees (748 | 55.5%), not-for-profit organizations (215 | 16.0%), and local government employees (170 | 12.6%) make up the most common classes of employment.
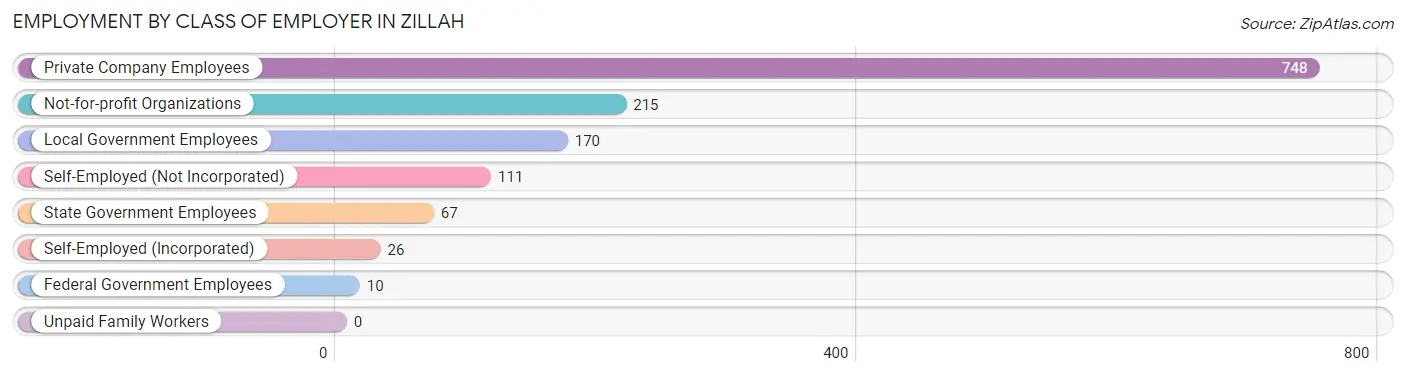
| Employer Class | # Employees | % Employees |
| Private Company Employees | 748 | 55.5% |
| Self-Employed (Incorporated) | 26 | 1.9% |
| Self-Employed (Not Incorporated) | 111 | 8.2% |
| Not-for-profit Organizations | 215 | 16.0% |
| Local Government Employees | 170 | 12.6% |
| State Government Employees | 67 | 5.0% |
| Federal Government Employees | 10 | 0.7% |
| Unpaid Family Workers | 0 | 0.0% |
| Total | 1,347 | 100.0% |
Employment Status by Age in Zillah
According to the labor force statistics for Zillah, out of the total population over 16 years of age (2,282), 62.1% or 1,417 individuals are in the labor force, with 3.1% or 44 of them unemployed. The age group with the highest labor force participation rate is 45 to 54 years, with 89.4% or 236 individuals in the labor force. Within the labor force, the 20 to 24 years age range has the highest percentage of unemployed individuals, with 14.8% or 18 of them being unemployed.
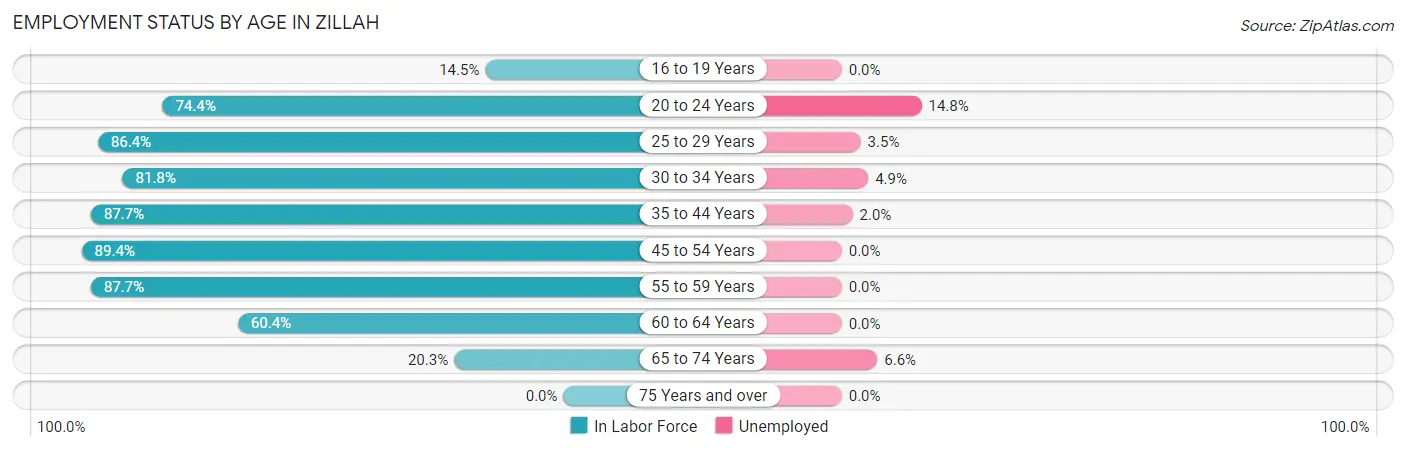
| Age Bracket | In Labor Force | Unemployed |
| 16 to 19 Years | 34 (14.5%) | 0 (0.0%) |
| 20 to 24 Years | 122 (74.4%) | 18 (14.8%) |
| 25 to 29 Years | 171 (86.4%) | 6 (3.5%) |
| 30 to 34 Years | 144 (81.8%) | 7 (4.9%) |
| 35 to 44 Years | 450 (87.7%) | 9 (2.0%) |
| 45 to 54 Years | 236 (89.4%) | 0 (0.0%) |
| 55 to 59 Years | 135 (87.7%) | 0 (0.0%) |
| 60 to 64 Years | 64 (60.4%) | 0 (0.0%) |
| 65 to 74 Years | 61 (20.3%) | 4 (6.6%) |
| 75 Years and over | 0 (0.0%) | 0 (0.0%) |
| Total | 1,417 (62.1%) | 44 (3.1%) |
Employment Status by Educational Attainment in Zillah
According to labor force statistics for Zillah, 85.0% of individuals (1,199) out of the total population between 25 and 64 years of age (1,411) are in the labor force, with 1.8% or 22 of them being unemployed. The group with the highest labor force participation rate are those with the educational attainment of bachelor's degree or higher, with 92.4% or 305 individuals in the labor force. Within the labor force, individuals with bachelor's degree or higher education have the highest percentage of unemployment, with 4.9% or 15 of them being unemployed.
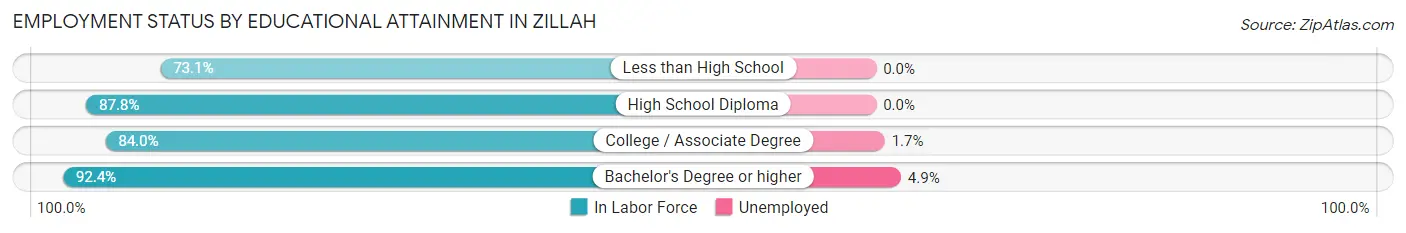
| Educational Attainment | In Labor Force | Unemployed |
| Less than High School | 174 (73.1%) | 0 (0.0%) |
| High School Diploma | 302 (87.8%) | 0 (0.0%) |
| College / Associate Degree | 419 (84.0%) | 8 (1.7%) |
| Bachelor's Degree or higher | 305 (92.4%) | 16 (4.9%) |
| Total | 1,199 (85.0%) | 25 (1.8%) |
Employment Occupations by Sex in Zillah
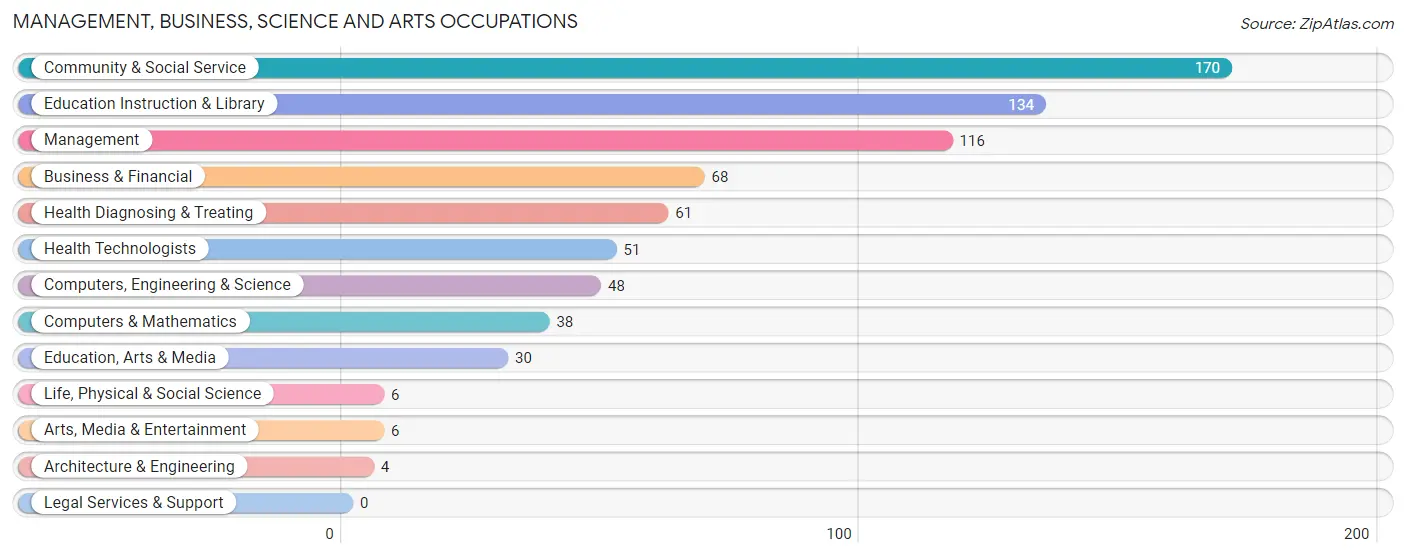
Management, Business, Science and Arts Occupations
The most common Management, Business, Science and Arts occupations in Zillah are Community & Social Service (170 | 12.4%), Education Instruction & Library (134 | 9.8%), Management (116 | 8.5%), Business & Financial (68 | 5.0%), and Health Diagnosing & Treating (61 | 4.4%).
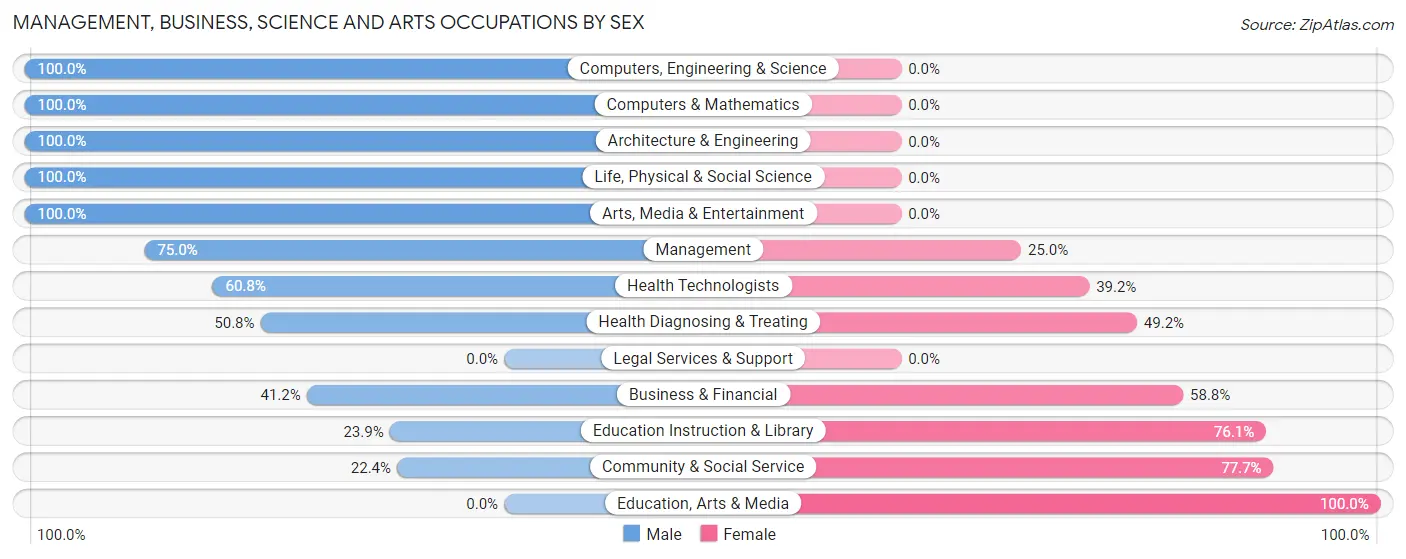
Management, Business, Science and Arts Occupations by Sex
Within the Management, Business, Science and Arts occupations in Zillah, the most male-oriented occupations are Computers, Engineering & Science (100.0%), Computers & Mathematics (100.0%), and Architecture & Engineering (100.0%), while the most female-oriented occupations are Education, Arts & Media (100.0%), Community & Social Service (77.6%), and Education Instruction & Library (76.1%).
| Occupation | Male | Female |
| Management | 87 (75.0%) | 29 (25.0%) |
| Business & Financial | 28 (41.2%) | 40 (58.8%) |
| Computers, Engineering & Science | 48 (100.0%) | 0 (0.0%) |
| Computers & Mathematics | 38 (100.0%) | 0 (0.0%) |
| Architecture & Engineering | 4 (100.0%) | 0 (0.0%) |
| Life, Physical & Social Science | 6 (100.0%) | 0 (0.0%) |
| Community & Social Service | 38 (22.4%) | 132 (77.6%) |
| Education, Arts & Media | 0 (0.0%) | 30 (100.0%) |
| Legal Services & Support | 0 (0.0%) | 0 (0.0%) |
| Education Instruction & Library | 32 (23.9%) | 102 (76.1%) |
| Arts, Media & Entertainment | 6 (100.0%) | 0 (0.0%) |
| Health Diagnosing & Treating | 31 (50.8%) | 30 (49.2%) |
| Health Technologists | 31 (60.8%) | 20 (39.2%) |
| Total (Category) | 232 (50.1%) | 231 (49.9%) |
| Total (Overall) | 712 (51.9%) | 661 (48.1%) |
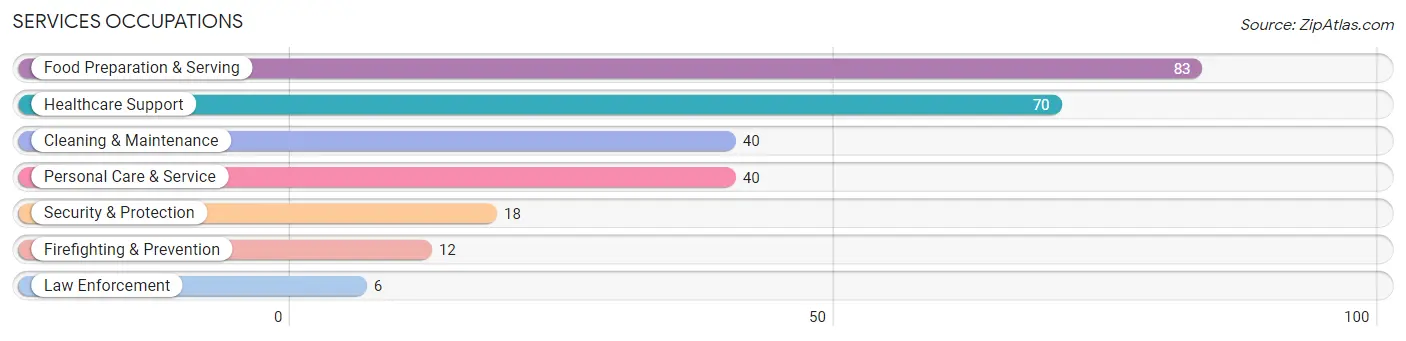
Services Occupations
The most common Services occupations in Zillah are Food Preparation & Serving (83 | 6.0%), Healthcare Support (70 | 5.1%), Cleaning & Maintenance (40 | 2.9%), Personal Care & Service (40 | 2.9%), and Security & Protection (18 | 1.3%).
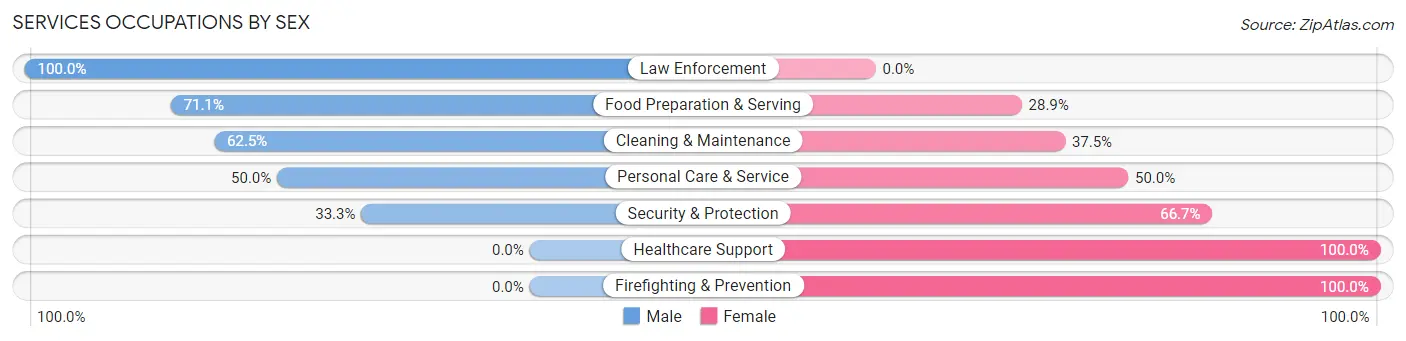
Services Occupations by Sex
Within the Services occupations in Zillah, the most male-oriented occupations are Law Enforcement (100.0%), Food Preparation & Serving (71.1%), and Cleaning & Maintenance (62.5%), while the most female-oriented occupations are Healthcare Support (100.0%), Firefighting & Prevention (100.0%), and Security & Protection (66.7%).
| Occupation | Male | Female |
| Healthcare Support | 0 (0.0%) | 70 (100.0%) |
| Security & Protection | 6 (33.3%) | 12 (66.7%) |
| Firefighting & Prevention | 0 (0.0%) | 12 (100.0%) |
| Law Enforcement | 6 (100.0%) | 0 (0.0%) |
| Food Preparation & Serving | 59 (71.1%) | 24 (28.9%) |
| Cleaning & Maintenance | 25 (62.5%) | 15 (37.5%) |
| Personal Care & Service | 20 (50.0%) | 20 (50.0%) |
| Total (Category) | 110 (43.8%) | 141 (56.2%) |
| Total (Overall) | 712 (51.9%) | 661 (48.1%) |
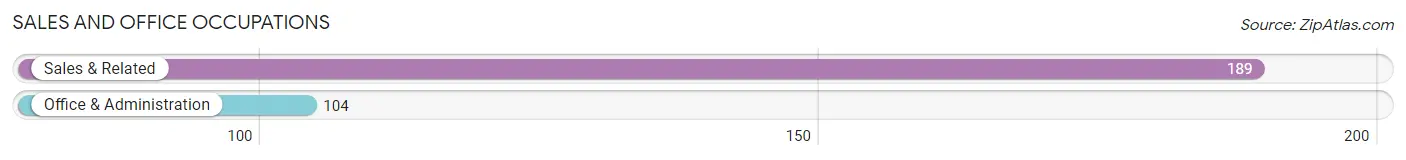
Sales and Office Occupations
The most common Sales and Office occupations in Zillah are Sales & Related (189 | 13.8%), and Office & Administration (104 | 7.6%).
Sales and Office Occupations by Sex
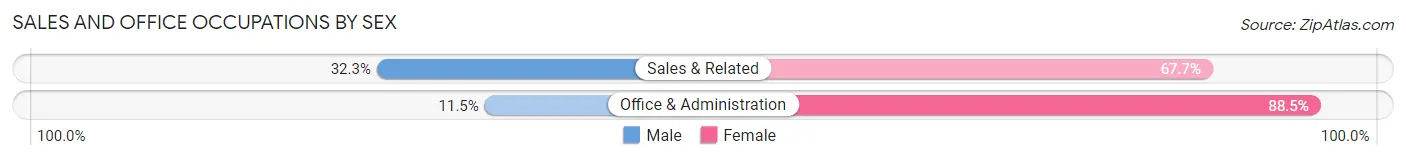
| Occupation | Male | Female |
| Sales & Related | 61 (32.3%) | 128 (67.7%) |
| Office & Administration | 12 (11.5%) | 92 (88.5%) |
| Total (Category) | 73 (24.9%) | 220 (75.1%) |
| Total (Overall) | 712 (51.9%) | 661 (48.1%) |
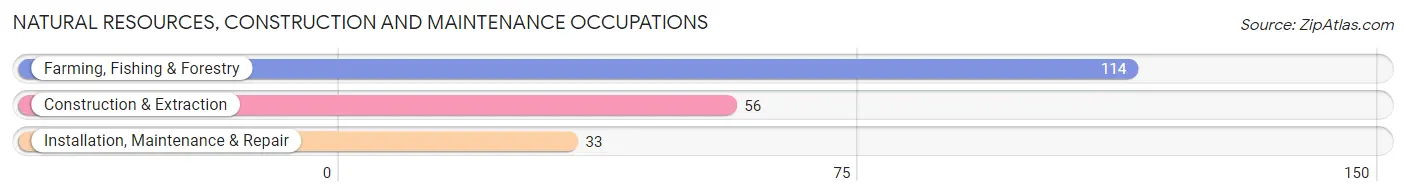
Natural Resources, Construction and Maintenance Occupations
The most common Natural Resources, Construction and Maintenance occupations in Zillah are Farming, Fishing & Forestry (114 | 8.3%), Construction & Extraction (56 | 4.1%), and Installation, Maintenance & Repair (33 | 2.4%).
Natural Resources, Construction and Maintenance Occupations by Sex
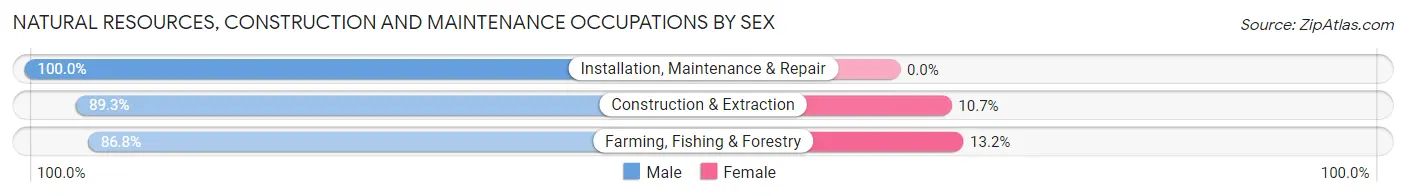
| Occupation | Male | Female |
| Farming, Fishing & Forestry | 99 (86.8%) | 15 (13.2%) |
| Construction & Extraction | 50 (89.3%) | 6 (10.7%) |
| Installation, Maintenance & Repair | 33 (100.0%) | 0 (0.0%) |
| Total (Category) | 182 (89.7%) | 21 (10.3%) |
| Total (Overall) | 712 (51.9%) | 661 (48.1%) |
Production, Transportation and Moving Occupations
The most common Production, Transportation and Moving occupations in Zillah are Transportation (86 | 6.3%), Production (54 | 3.9%), and Material Moving (23 | 1.7%).
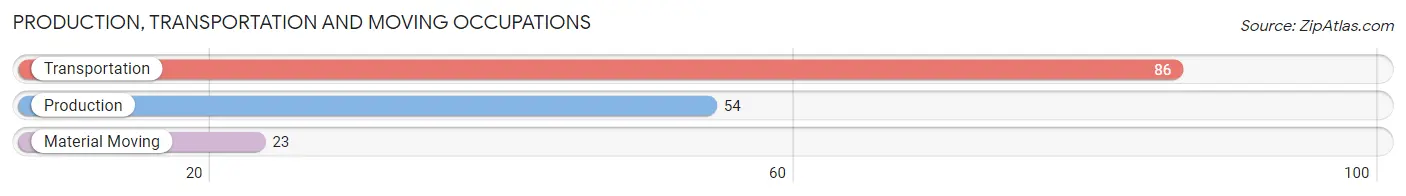
Production, Transportation and Moving Occupations by Sex
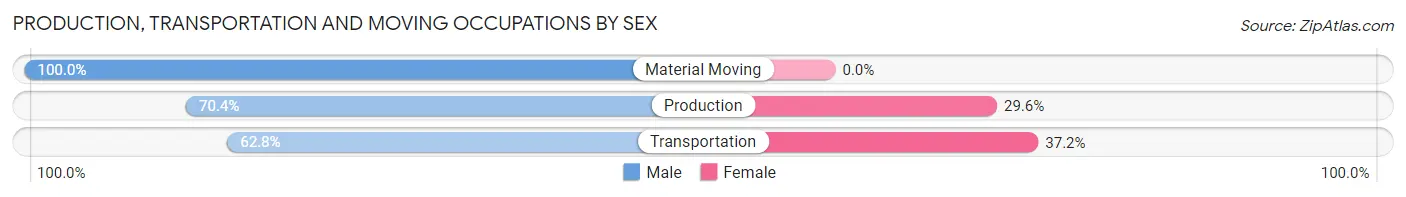
| Occupation | Male | Female |
| Production | 38 (70.4%) | 16 (29.6%) |
| Transportation | 54 (62.8%) | 32 (37.2%) |
| Material Moving | 23 (100.0%) | 0 (0.0%) |
| Total (Category) | 115 (70.6%) | 48 (29.4%) |
| Total (Overall) | 712 (51.9%) | 661 (48.1%) |
Employment Industries by Sex in Zillah
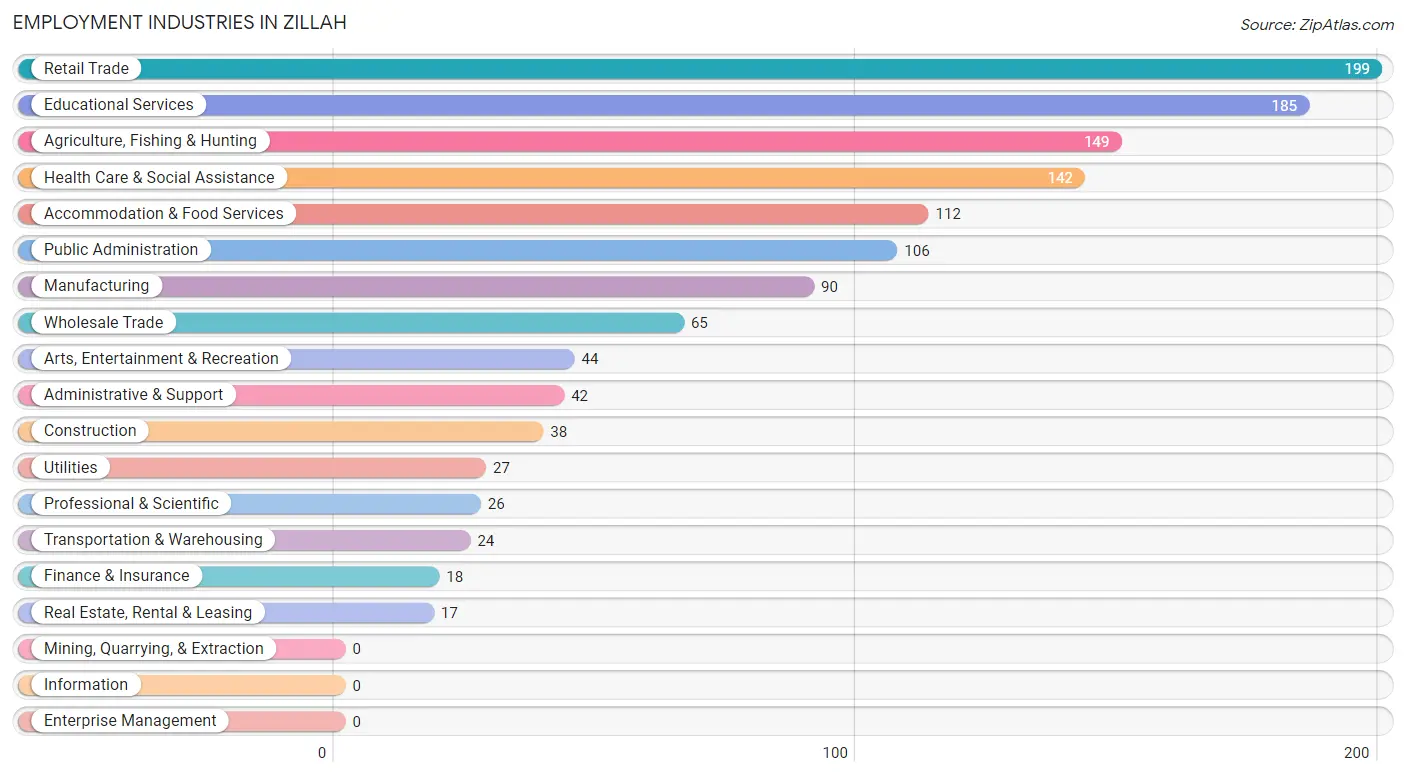
Employment Industries in Zillah
The major employment industries in Zillah include Retail Trade (199 | 14.5%), Educational Services (185 | 13.5%), Agriculture, Fishing & Hunting (149 | 10.8%), Health Care & Social Assistance (142 | 10.3%), and Accommodation & Food Services (112 | 8.2%).
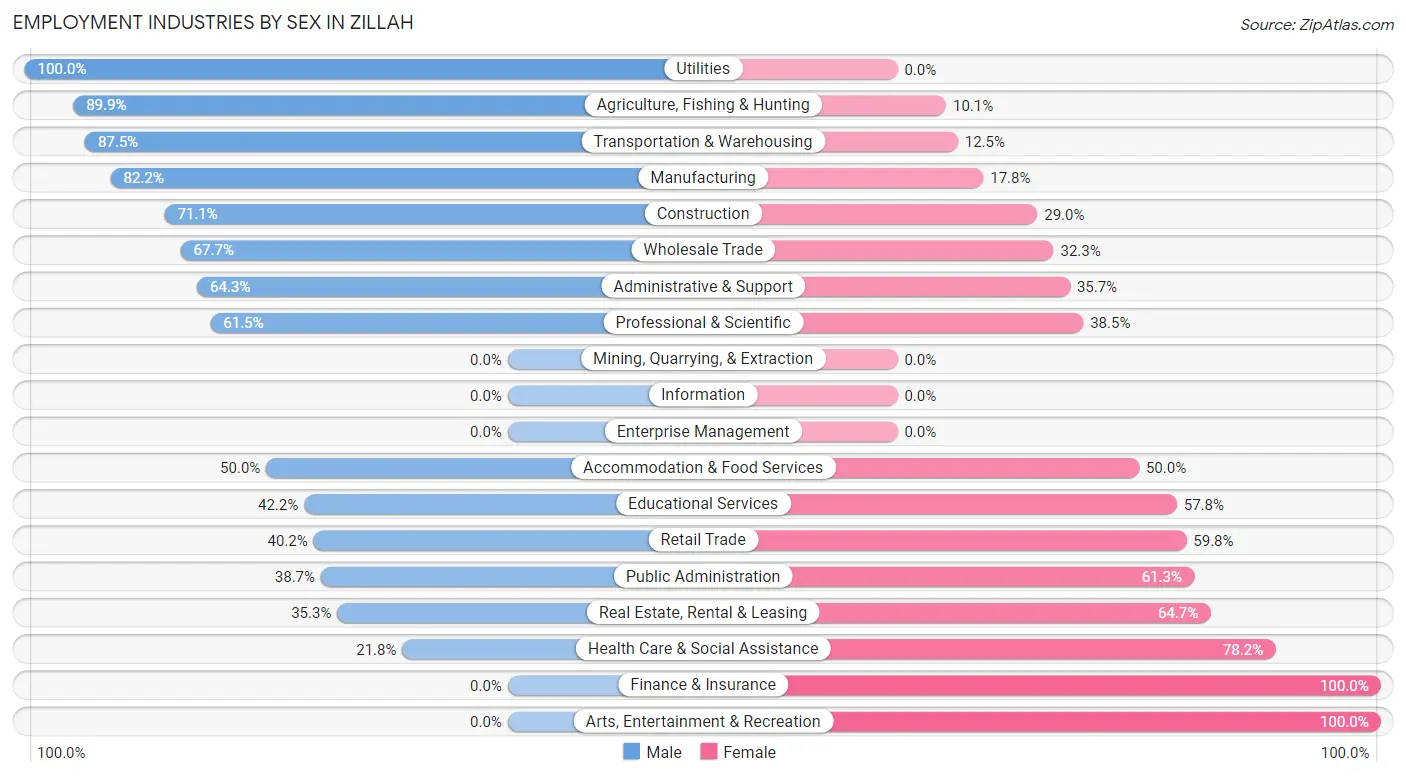
Employment Industries by Sex in Zillah
The Zillah industries that see more men than women are Utilities (100.0%), Agriculture, Fishing & Hunting (89.9%), and Transportation & Warehousing (87.5%), whereas the industries that tend to have a higher number of women are Finance & Insurance (100.0%), Arts, Entertainment & Recreation (100.0%), and Health Care & Social Assistance (78.2%).
| Industry | Male | Female |
| Agriculture, Fishing & Hunting | 134 (89.9%) | 15 (10.1%) |
| Mining, Quarrying, & Extraction | 0 (0.0%) | 0 (0.0%) |
| Construction | 27 (71.1%) | 11 (28.9%) |
| Manufacturing | 74 (82.2%) | 16 (17.8%) |
| Wholesale Trade | 44 (67.7%) | 21 (32.3%) |
| Retail Trade | 80 (40.2%) | 119 (59.8%) |
| Transportation & Warehousing | 21 (87.5%) | 3 (12.5%) |
| Utilities | 27 (100.0%) | 0 (0.0%) |
| Information | 0 (0.0%) | 0 (0.0%) |
| Finance & Insurance | 0 (0.0%) | 18 (100.0%) |
| Real Estate, Rental & Leasing | 6 (35.3%) | 11 (64.7%) |
| Professional & Scientific | 16 (61.5%) | 10 (38.5%) |
| Enterprise Management | 0 (0.0%) | 0 (0.0%) |
| Administrative & Support | 27 (64.3%) | 15 (35.7%) |
| Educational Services | 78 (42.2%) | 107 (57.8%) |
| Health Care & Social Assistance | 31 (21.8%) | 111 (78.2%) |
| Arts, Entertainment & Recreation | 0 (0.0%) | 44 (100.0%) |
| Accommodation & Food Services | 56 (50.0%) | 56 (50.0%) |
| Public Administration | 41 (38.7%) | 65 (61.3%) |
| Total | 712 (51.9%) | 661 (48.1%) |
Education in Zillah
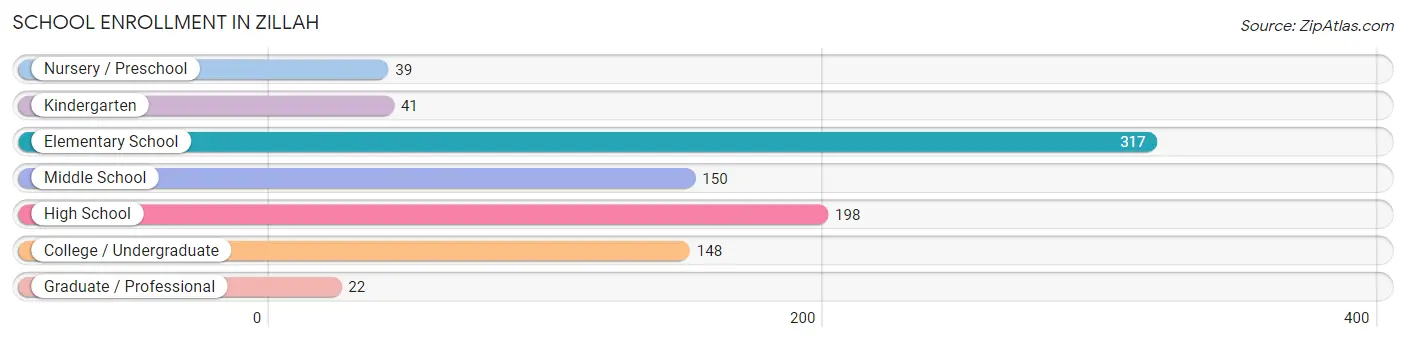
School Enrollment in Zillah
The most common levels of schooling among the 915 students in Zillah are elementary school (317 | 34.6%), high school (198 | 21.6%), and middle school (150 | 16.4%).
| School Level | # Students | % Students |
| Nursery / Preschool | 39 | 4.3% |
| Kindergarten | 41 | 4.5% |
| Elementary School | 317 | 34.6% |
| Middle School | 150 | 16.4% |
| High School | 198 | 21.6% |
| College / Undergraduate | 148 | 16.2% |
| Graduate / Professional | 22 | 2.4% |
| Total | 915 | 100.0% |
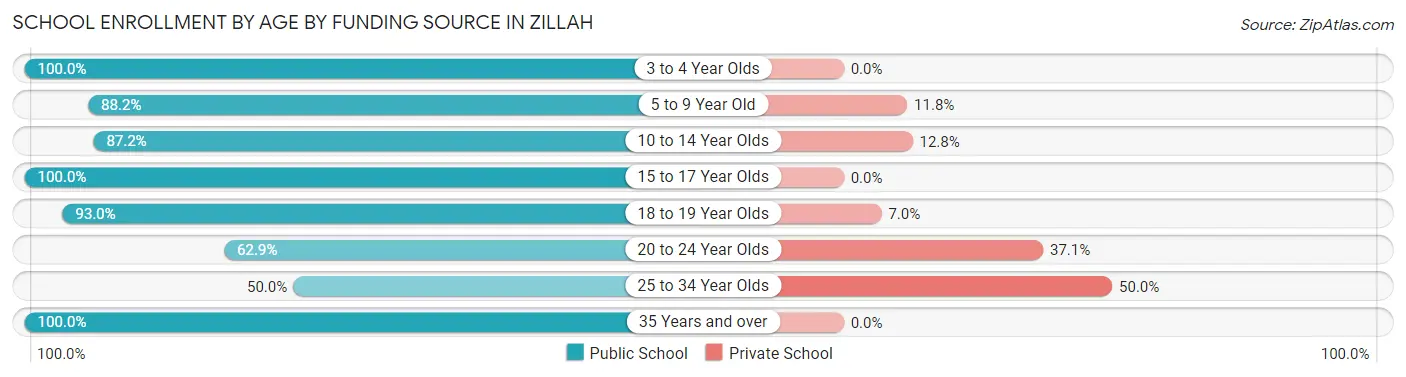
School Enrollment by Age by Funding Source in Zillah
Out of a total of 915 students who are enrolled in schools in Zillah, 109 (11.9%) attend a private institution, while the remaining 806 (88.1%) are enrolled in public schools. The age group of 25 to 34 year olds has the highest likelihood of being enrolled in private schools, with 27 (50.0% in the age bracket) enrolled. Conversely, the age group of 3 to 4 year olds has the lowest likelihood of being enrolled in a private school, with 29 (100.0% in the age bracket) attending a public institution.
| Age Bracket | Public School | Private School |
| 3 to 4 Year Olds | 29 (100.0%) | 0 (0.0%) |
| 5 to 9 Year Old | 261 (88.2%) | 35 (11.8%) |
| 10 to 14 Year Olds | 197 (87.2%) | 29 (12.8%) |
| 15 to 17 Year Olds | 169 (100.0%) | 0 (0.0%) |
| 18 to 19 Year Olds | 66 (93.0%) | 5 (7.0%) |
| 20 to 24 Year Olds | 22 (62.9%) | 13 (37.1%) |
| 25 to 34 Year Olds | 27 (50.0%) | 27 (50.0%) |
| 35 Years and over | 35 (100.0%) | 0 (0.0%) |
| Total | 806 (88.1%) | 109 (11.9%) |
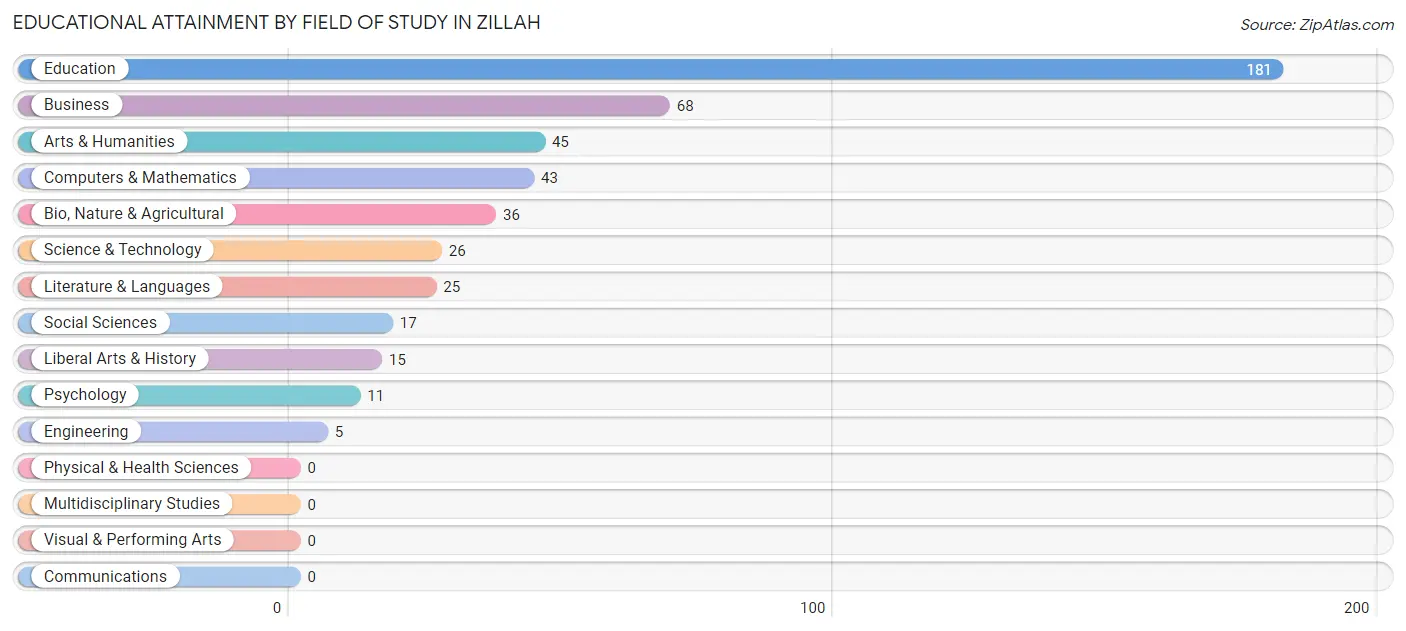
Educational Attainment by Field of Study in Zillah
Education (181 | 38.4%), business (68 | 14.4%), arts & humanities (45 | 9.5%), computers & mathematics (43 | 9.1%), and bio, nature & agricultural (36 | 7.6%) are the most common fields of study among 472 individuals in Zillah who have obtained a bachelor's degree or higher.
| Field of Study | # Graduates | % Graduates |
| Computers & Mathematics | 43 | 9.1% |
| Bio, Nature & Agricultural | 36 | 7.6% |
| Physical & Health Sciences | 0 | 0.0% |
| Psychology | 11 | 2.3% |
| Social Sciences | 17 | 3.6% |
| Engineering | 5 | 1.1% |
| Multidisciplinary Studies | 0 | 0.0% |
| Science & Technology | 26 | 5.5% |
| Business | 68 | 14.4% |
| Education | 181 | 38.4% |
| Literature & Languages | 25 | 5.3% |
| Liberal Arts & History | 15 | 3.2% |
| Visual & Performing Arts | 0 | 0.0% |
| Communications | 0 | 0.0% |
| Arts & Humanities | 45 | 9.5% |
| Total | 472 | 100.0% |
Transportation & Commute in Zillah
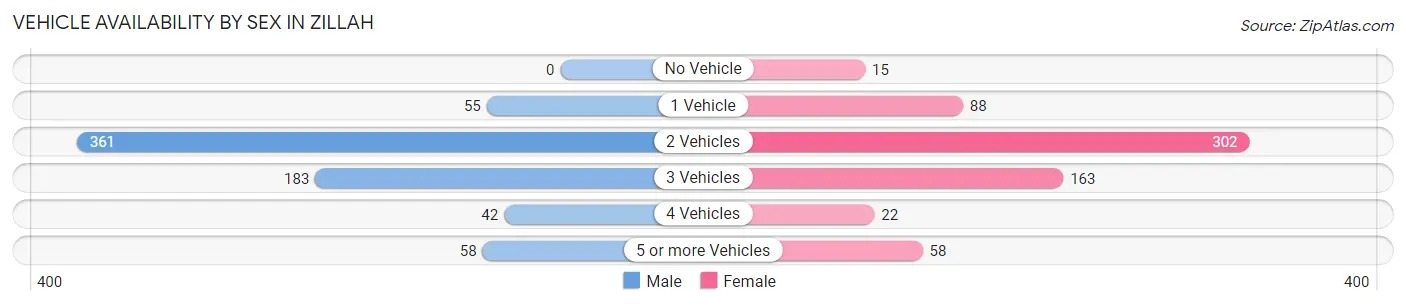
Vehicle Availability by Sex in Zillah
The most prevalent vehicle ownership categories in Zillah are males with 2 vehicles (361, accounting for 51.6%) and females with 2 vehicles (302, making up 55.7%).
| Vehicles Available | Male | Female |
| No Vehicle | 0 (0.0%) | 15 (2.3%) |
| 1 Vehicle | 55 (7.9%) | 88 (13.6%) |
| 2 Vehicles | 361 (51.6%) | 302 (46.6%) |
| 3 Vehicles | 183 (26.2%) | 163 (25.2%) |
| 4 Vehicles | 42 (6.0%) | 22 (3.4%) |
| 5 or more Vehicles | 58 (8.3%) | 58 (8.9%) |
| Total | 699 (100.0%) | 648 (100.0%) |
Commute Time in Zillah
The most frequently occuring commute durations in Zillah are 30 to 34 minutes (255 commuters, 19.8%), 5 to 9 minutes (232 commuters, 18.0%), and 15 to 19 minutes (210 commuters, 16.3%).
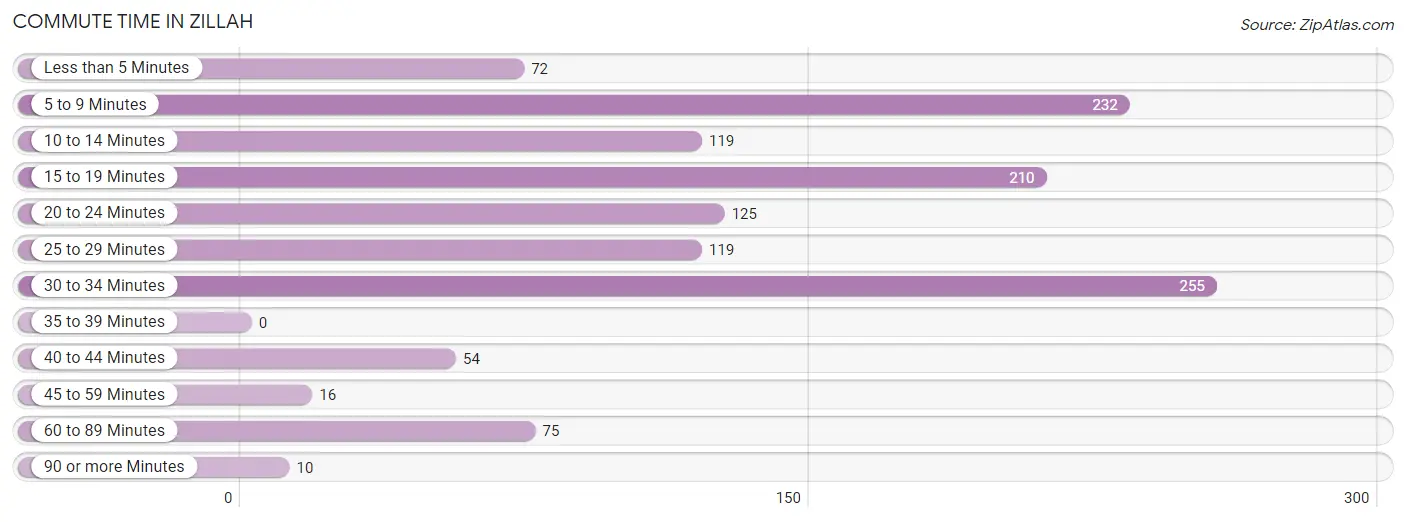
| Commute Time | # Commuters | % Commuters |
| Less than 5 Minutes | 72 | 5.6% |
| 5 to 9 Minutes | 232 | 18.0% |
| 10 to 14 Minutes | 119 | 9.2% |
| 15 to 19 Minutes | 210 | 16.3% |
| 20 to 24 Minutes | 125 | 9.7% |
| 25 to 29 Minutes | 119 | 9.2% |
| 30 to 34 Minutes | 255 | 19.8% |
| 35 to 39 Minutes | 0 | 0.0% |
| 40 to 44 Minutes | 54 | 4.2% |
| 45 to 59 Minutes | 16 | 1.2% |
| 60 to 89 Minutes | 75 | 5.8% |
| 90 or more Minutes | 10 | 0.8% |
Commute Time by Sex in Zillah
The most common commute times in Zillah are 15 to 19 minutes (124 commuters, 18.5%) for males and 30 to 34 minutes (150 commuters, 24.3%) for females.
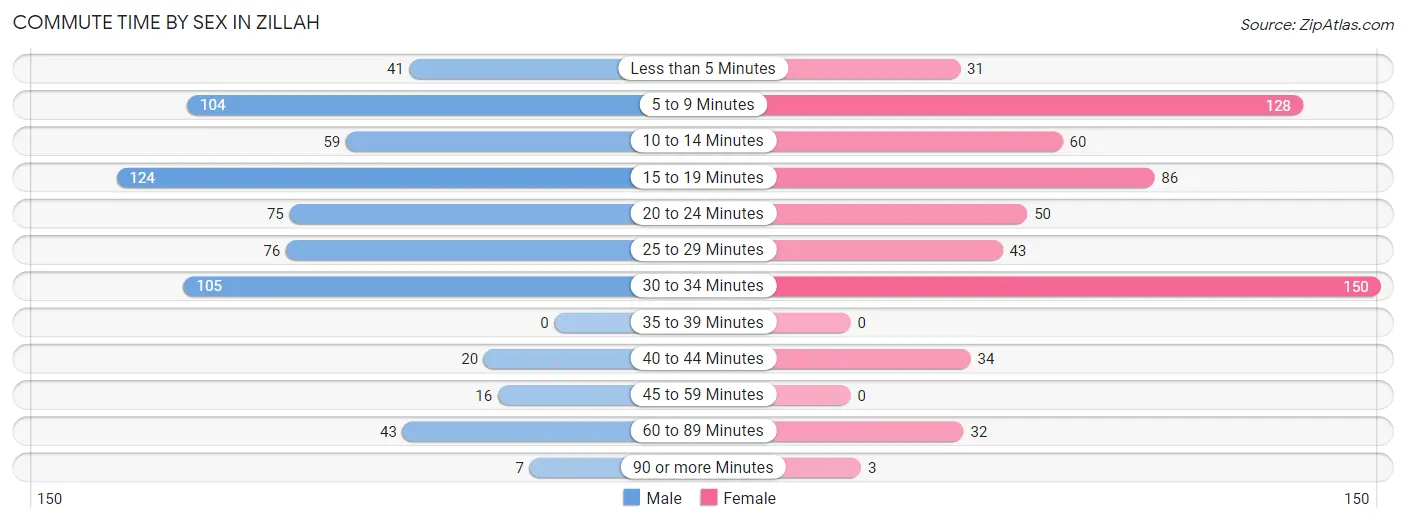
| Commute Time | Male | Female |
| Less than 5 Minutes | 41 (6.1%) | 31 (5.0%) |
| 5 to 9 Minutes | 104 (15.5%) | 128 (20.7%) |
| 10 to 14 Minutes | 59 (8.8%) | 60 (9.7%) |
| 15 to 19 Minutes | 124 (18.5%) | 86 (13.9%) |
| 20 to 24 Minutes | 75 (11.2%) | 50 (8.1%) |
| 25 to 29 Minutes | 76 (11.3%) | 43 (7.0%) |
| 30 to 34 Minutes | 105 (15.7%) | 150 (24.3%) |
| 35 to 39 Minutes | 0 (0.0%) | 0 (0.0%) |
| 40 to 44 Minutes | 20 (3.0%) | 34 (5.5%) |
| 45 to 59 Minutes | 16 (2.4%) | 0 (0.0%) |
| 60 to 89 Minutes | 43 (6.4%) | 32 (5.2%) |
| 90 or more Minutes | 7 (1.0%) | 3 (0.5%) |
Time of Departure to Work by Sex in Zillah
The most frequent times of departure to work in Zillah are 12:00 AM to 4:59 AM (111, 16.6%) for males and 7:00 AM to 7:29 AM (132, 21.4%) for females.
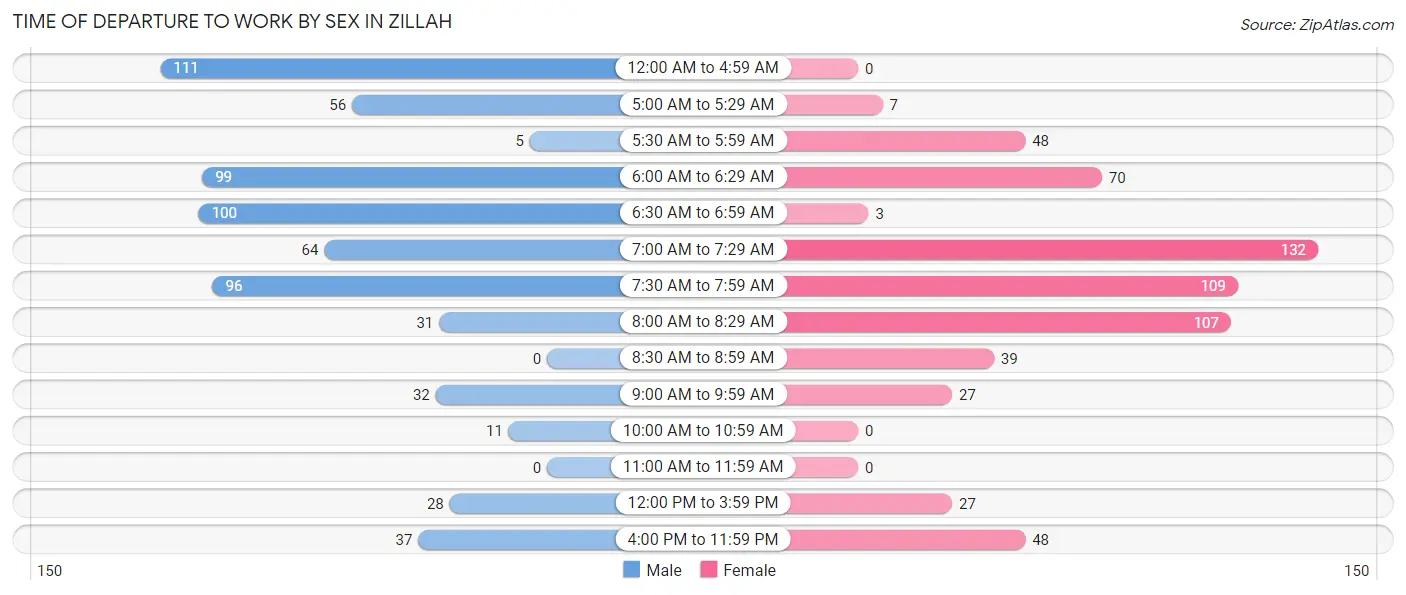
| Time of Departure | Male | Female |
| 12:00 AM to 4:59 AM | 111 (16.6%) | 0 (0.0%) |
| 5:00 AM to 5:29 AM | 56 (8.4%) | 7 (1.1%) |
| 5:30 AM to 5:59 AM | 5 (0.7%) | 48 (7.8%) |
| 6:00 AM to 6:29 AM | 99 (14.8%) | 70 (11.4%) |
| 6:30 AM to 6:59 AM | 100 (14.9%) | 3 (0.5%) |
| 7:00 AM to 7:29 AM | 64 (9.6%) | 132 (21.4%) |
| 7:30 AM to 7:59 AM | 96 (14.3%) | 109 (17.7%) |
| 8:00 AM to 8:29 AM | 31 (4.6%) | 107 (17.3%) |
| 8:30 AM to 8:59 AM | 0 (0.0%) | 39 (6.3%) |
| 9:00 AM to 9:59 AM | 32 (4.8%) | 27 (4.4%) |
| 10:00 AM to 10:59 AM | 11 (1.6%) | 0 (0.0%) |
| 11:00 AM to 11:59 AM | 0 (0.0%) | 0 (0.0%) |
| 12:00 PM to 3:59 PM | 28 (4.2%) | 27 (4.4%) |
| 4:00 PM to 11:59 PM | 37 (5.5%) | 48 (7.8%) |
| Total | 670 (100.0%) | 617 (100.0%) |
Housing Occupancy in Zillah
Occupancy by Ownership in Zillah
Of the total 1,116 dwellings in Zillah, owner-occupied units account for 712 (63.8%), while renter-occupied units make up 404 (36.2%).
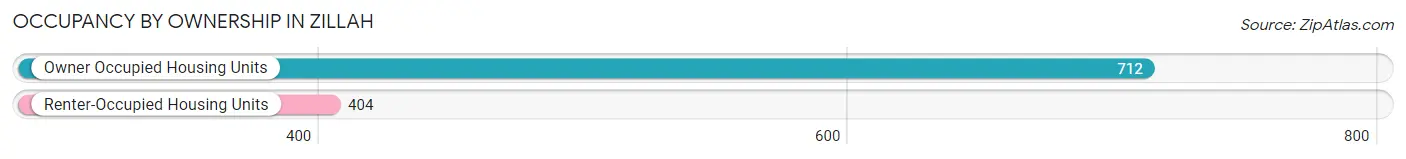
| Occupancy | # Housing Units | % Housing Units |
| Owner Occupied Housing Units | 712 | 63.8% |
| Renter-Occupied Housing Units | 404 | 36.2% |
| Total Occupied Housing Units | 1,116 | 100.0% |
Occupancy by Household Size in Zillah
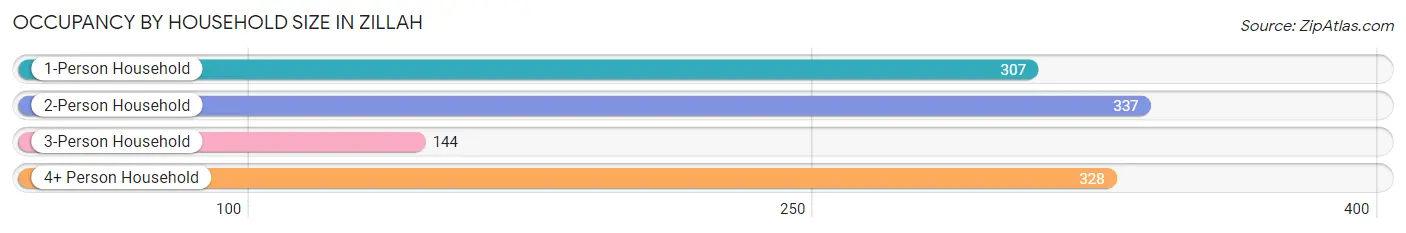
| Household Size | # Housing Units | % Housing Units |
| 1-Person Household | 307 | 27.5% |
| 2-Person Household | 337 | 30.2% |
| 3-Person Household | 144 | 12.9% |
| 4+ Person Household | 328 | 29.4% |
| Total Housing Units | 1,116 | 100.0% |
Occupancy by Ownership by Household Size in Zillah
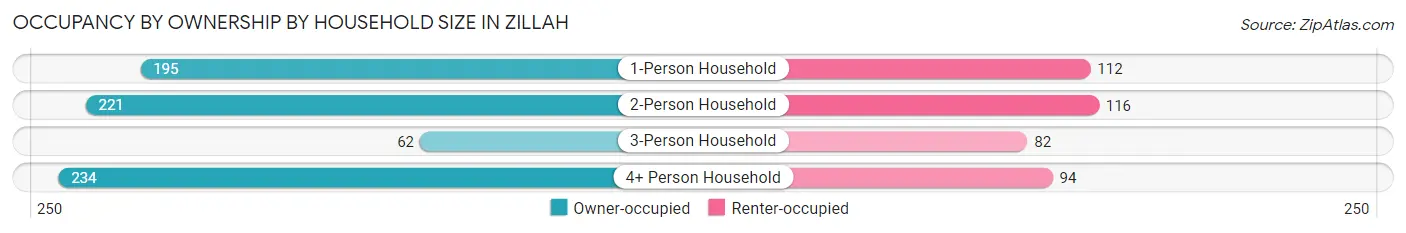
| Household Size | Owner-occupied | Renter-occupied |
| 1-Person Household | 195 (63.5%) | 112 (36.5%) |
| 2-Person Household | 221 (65.6%) | 116 (34.4%) |
| 3-Person Household | 62 (43.1%) | 82 (56.9%) |
| 4+ Person Household | 234 (71.3%) | 94 (28.7%) |
| Total Housing Units | 712 (63.8%) | 404 (36.2%) |
Occupancy by Educational Attainment in Zillah
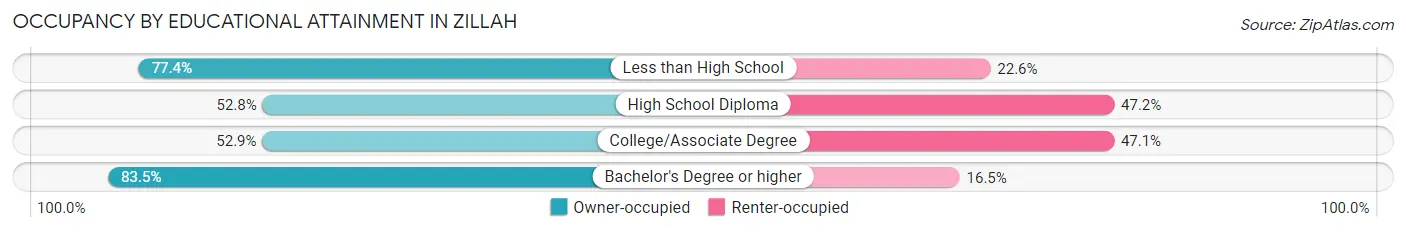
| Household Size | Owner-occupied | Renter-occupied |
| Less than High School | 123 (77.4%) | 36 (22.6%) |
| High School Diploma | 131 (52.8%) | 117 (47.2%) |
| College/Associate Degree | 231 (52.9%) | 206 (47.1%) |
| Bachelor's Degree or higher | 227 (83.5%) | 45 (16.5%) |
Occupancy by Age of Householder in Zillah
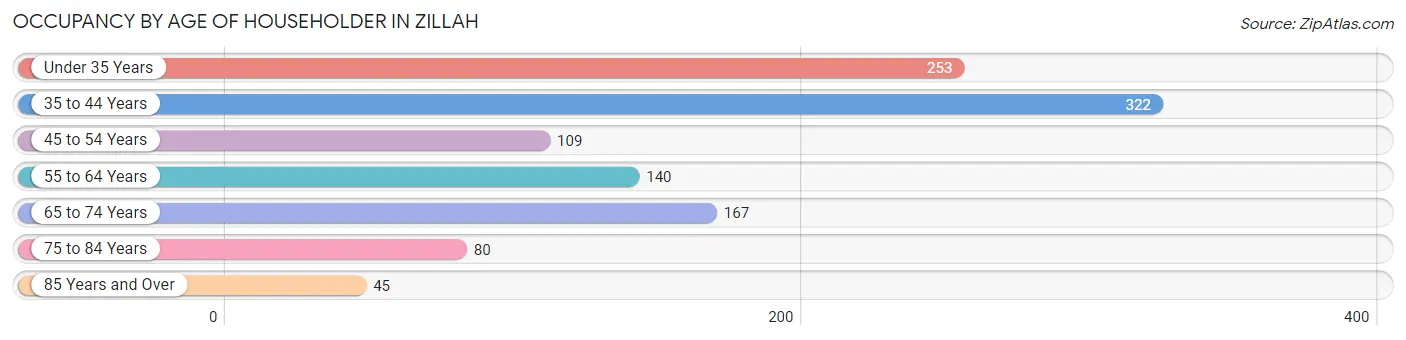
| Age Bracket | # Households | % Households |
| Under 35 Years | 253 | 22.7% |
| 35 to 44 Years | 322 | 28.8% |
| 45 to 54 Years | 109 | 9.8% |
| 55 to 64 Years | 140 | 12.5% |
| 65 to 74 Years | 167 | 15.0% |
| 75 to 84 Years | 80 | 7.2% |
| 85 Years and Over | 45 | 4.0% |
| Total | 1,116 | 100.0% |
Housing Finances in Zillah
Median Income by Occupancy in Zillah
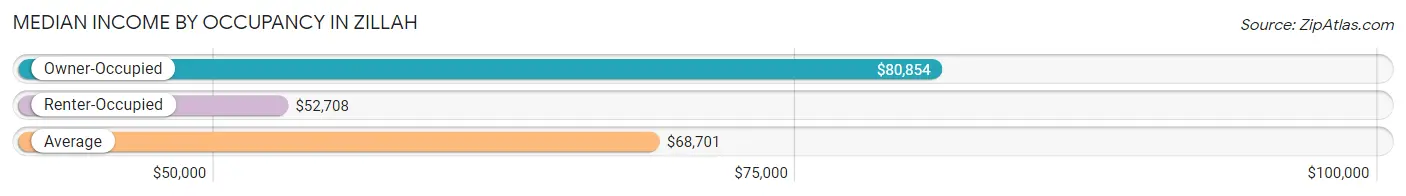
| Occupancy Type | # Households | Median Income |
| Owner-Occupied | 712 (63.8%) | $80,854 |
| Renter-Occupied | 404 (36.2%) | $52,708 |
| Average | 1,116 (100.0%) | $68,701 |
Occupancy by Householder Income Bracket in Zillah
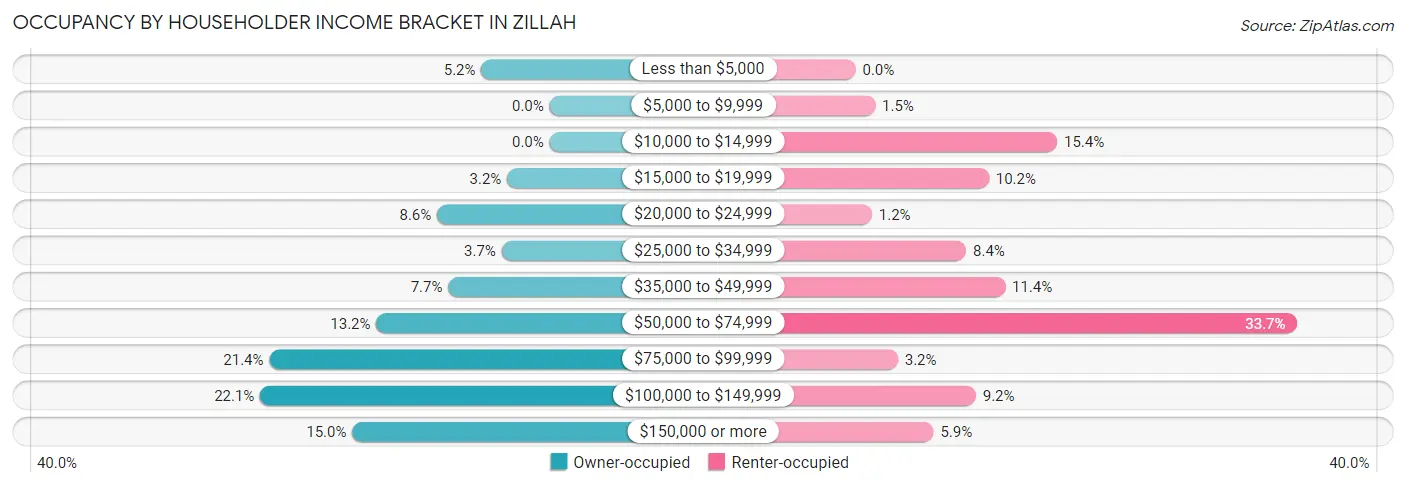
| Income Bracket | Owner-occupied | Renter-occupied |
| Less than $5,000 | 37 (5.2%) | 0 (0.0%) |
| $5,000 to $9,999 | 0 (0.0%) | 6 (1.5%) |
| $10,000 to $14,999 | 0 (0.0%) | 62 (15.3%) |
| $15,000 to $19,999 | 23 (3.2%) | 41 (10.2%) |
| $20,000 to $24,999 | 61 (8.6%) | 5 (1.2%) |
| $25,000 to $34,999 | 26 (3.6%) | 34 (8.4%) |
| $35,000 to $49,999 | 55 (7.7%) | 46 (11.4%) |
| $50,000 to $74,999 | 94 (13.2%) | 136 (33.7%) |
| $75,000 to $99,999 | 152 (21.3%) | 13 (3.2%) |
| $100,000 to $149,999 | 157 (22.1%) | 37 (9.2%) |
| $150,000 or more | 107 (15.0%) | 24 (5.9%) |
| Total | 712 (100.0%) | 404 (100.0%) |
Monthly Housing Cost Tiers in Zillah
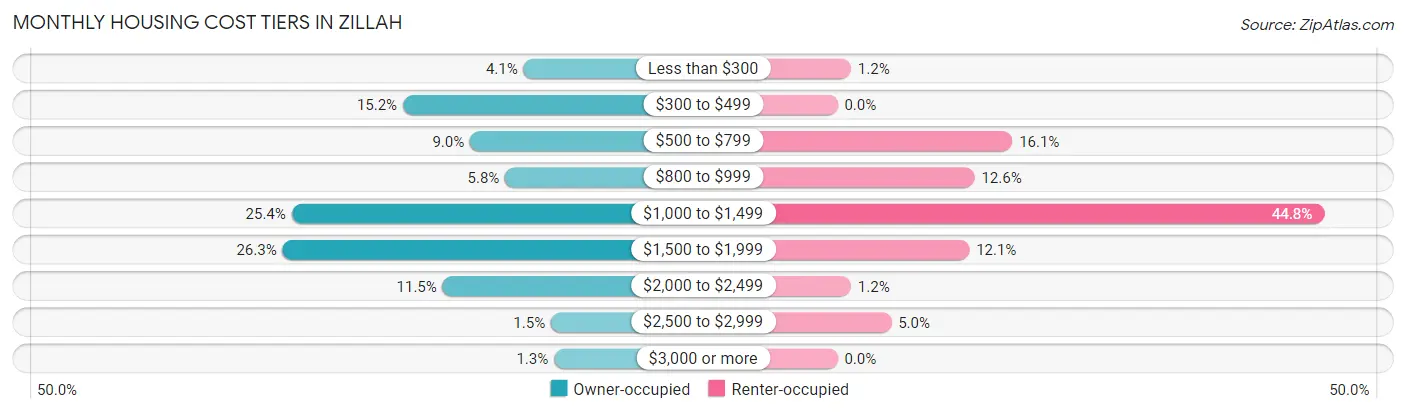
| Monthly Cost | Owner-occupied | Renter-occupied |
| Less than $300 | 29 (4.1%) | 5 (1.2%) |
| $300 to $499 | 108 (15.2%) | 0 (0.0%) |
| $500 to $799 | 64 (9.0%) | 65 (16.1%) |
| $800 to $999 | 41 (5.8%) | 51 (12.6%) |
| $1,000 to $1,499 | 181 (25.4%) | 181 (44.8%) |
| $1,500 to $1,999 | 187 (26.3%) | 49 (12.1%) |
| $2,000 to $2,499 | 82 (11.5%) | 5 (1.2%) |
| $2,500 to $2,999 | 11 (1.5%) | 20 (5.0%) |
| $3,000 or more | 9 (1.3%) | 0 (0.0%) |
| Total | 712 (100.0%) | 404 (100.0%) |
Physical Housing Characteristics in Zillah
Housing Structures in Zillah
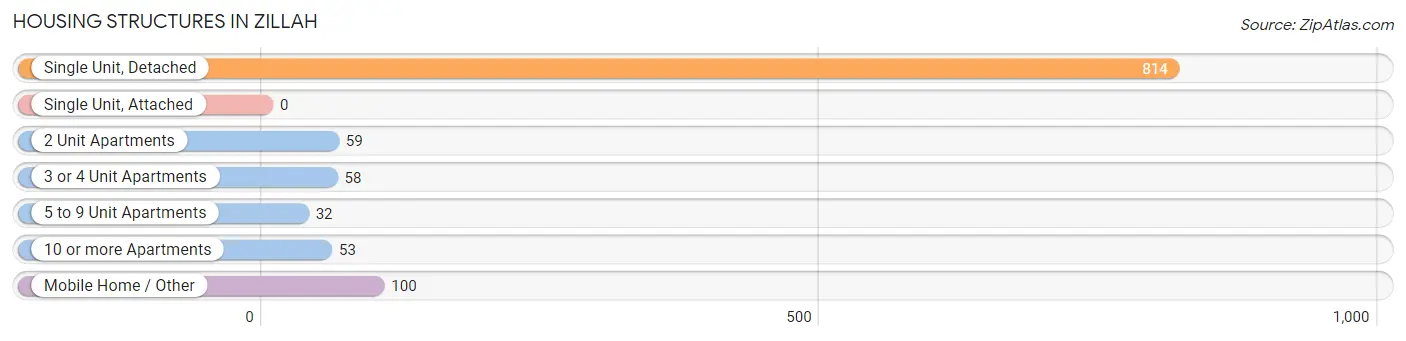
| Structure Type | # Housing Units | % Housing Units |
| Single Unit, Detached | 814 | 72.9% |
| Single Unit, Attached | 0 | 0.0% |
| 2 Unit Apartments | 59 | 5.3% |
| 3 or 4 Unit Apartments | 58 | 5.2% |
| 5 to 9 Unit Apartments | 32 | 2.9% |
| 10 or more Apartments | 53 | 4.8% |
| Mobile Home / Other | 100 | 9.0% |
| Total | 1,116 | 100.0% |
Housing Structures by Occupancy in Zillah
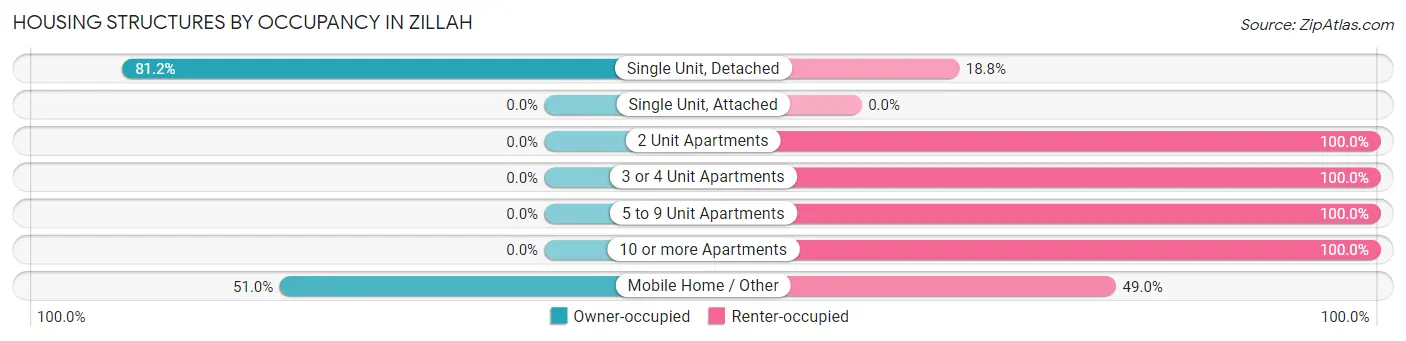
| Structure Type | Owner-occupied | Renter-occupied |
| Single Unit, Detached | 661 (81.2%) | 153 (18.8%) |
| Single Unit, Attached | 0 (0.0%) | 0 (0.0%) |
| 2 Unit Apartments | 0 (0.0%) | 59 (100.0%) |
| 3 or 4 Unit Apartments | 0 (0.0%) | 58 (100.0%) |
| 5 to 9 Unit Apartments | 0 (0.0%) | 32 (100.0%) |
| 10 or more Apartments | 0 (0.0%) | 53 (100.0%) |
| Mobile Home / Other | 51 (51.0%) | 49 (49.0%) |
| Total | 712 (63.8%) | 404 (36.2%) |
Housing Structures by Number of Rooms in Zillah
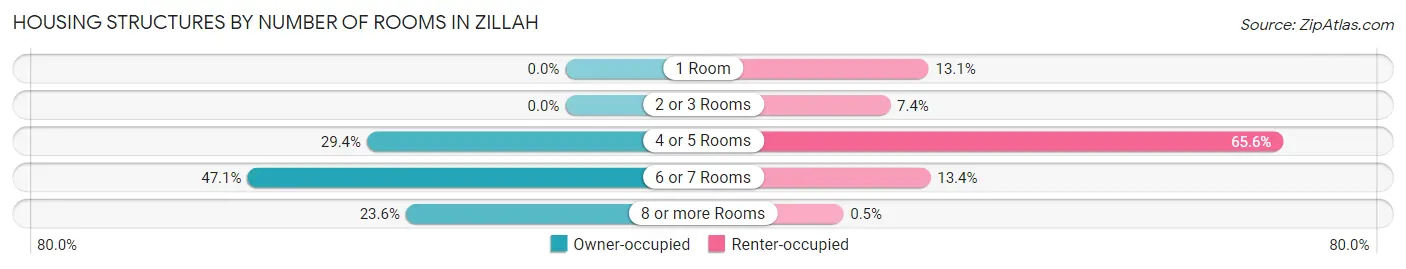
| Number of Rooms | Owner-occupied | Renter-occupied |
| 1 Room | 0 (0.0%) | 53 (13.1%) |
| 2 or 3 Rooms | 0 (0.0%) | 30 (7.4%) |
| 4 or 5 Rooms | 209 (29.3%) | 265 (65.6%) |
| 6 or 7 Rooms | 335 (47.0%) | 54 (13.4%) |
| 8 or more Rooms | 168 (23.6%) | 2 (0.5%) |
| Total | 712 (100.0%) | 404 (100.0%) |
Housing Structure by Heating Type in Zillah
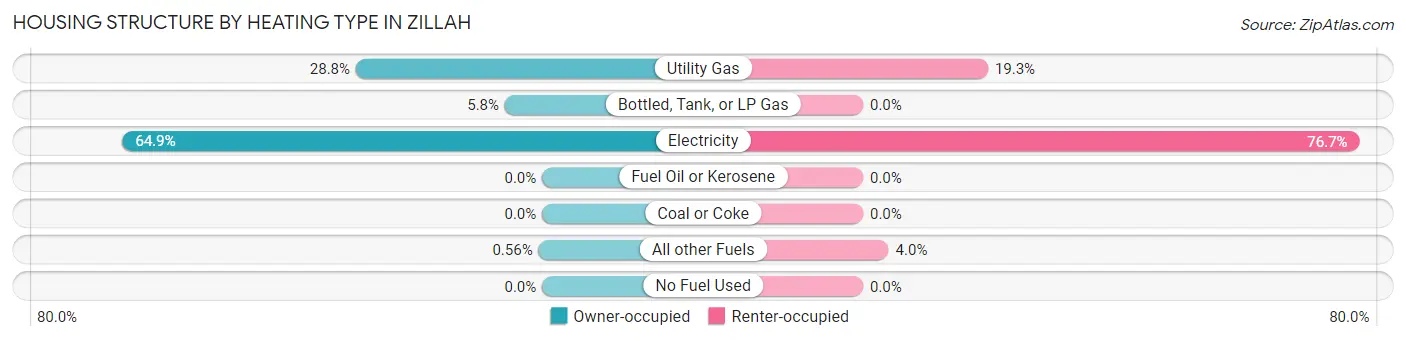
| Heating Type | Owner-occupied | Renter-occupied |
| Utility Gas | 205 (28.8%) | 78 (19.3%) |
| Bottled, Tank, or LP Gas | 41 (5.8%) | 0 (0.0%) |
| Electricity | 462 (64.9%) | 310 (76.7%) |
| Fuel Oil or Kerosene | 0 (0.0%) | 0 (0.0%) |
| Coal or Coke | 0 (0.0%) | 0 (0.0%) |
| All other Fuels | 4 (0.6%) | 16 (4.0%) |
| No Fuel Used | 0 (0.0%) | 0 (0.0%) |
| Total | 712 (100.0%) | 404 (100.0%) |
Household Vehicle Usage in Zillah
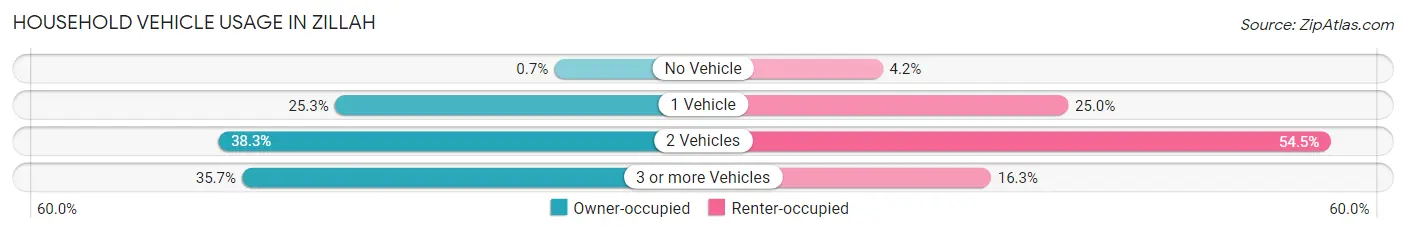
| Vehicles per Household | Owner-occupied | Renter-occupied |
| No Vehicle | 5 (0.7%) | 17 (4.2%) |
| 1 Vehicle | 180 (25.3%) | 101 (25.0%) |
| 2 Vehicles | 273 (38.3%) | 220 (54.5%) |
| 3 or more Vehicles | 254 (35.7%) | 66 (16.3%) |
| Total | 712 (100.0%) | 404 (100.0%) |
Real Estate & Mortgages in Zillah
Real Estate and Mortgage Overview in Zillah
| Characteristic | Without Mortgage | With Mortgage |
| Housing Units | 205 | 507 |
| Median Property Value | $222,400 | $296,900 |
| Median Household Income | $55,938 | $78 |
| Monthly Housing Costs | $449 | $9 |
| Real Estate Taxes | $1,673 | $17 |
Property Value by Mortgage Status in Zillah
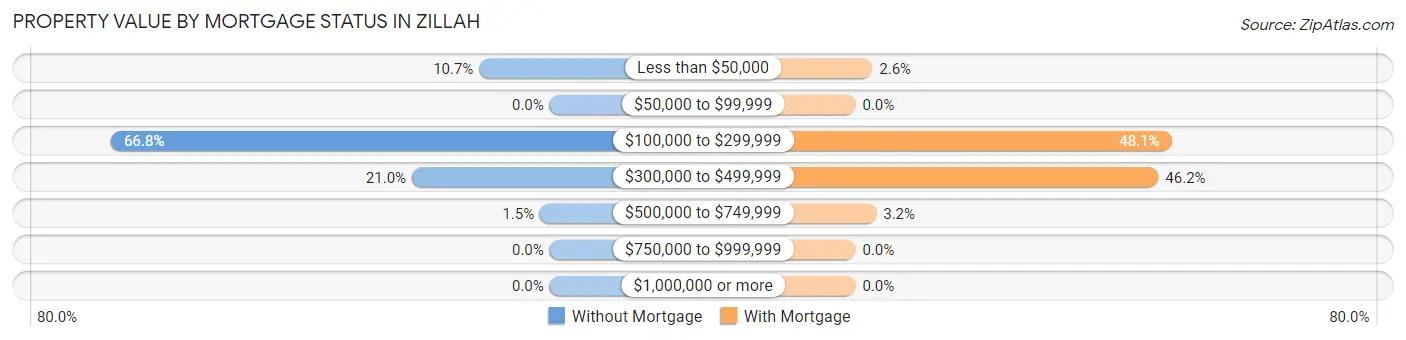
| Property Value | Without Mortgage | With Mortgage |
| Less than $50,000 | 22 (10.7%) | 13 (2.6%) |
| $50,000 to $99,999 | 0 (0.0%) | 0 (0.0%) |
| $100,000 to $299,999 | 137 (66.8%) | 244 (48.1%) |
| $300,000 to $499,999 | 43 (21.0%) | 234 (46.2%) |
| $500,000 to $749,999 | 3 (1.5%) | 16 (3.2%) |
| $750,000 to $999,999 | 0 (0.0%) | 0 (0.0%) |
| $1,000,000 or more | 0 (0.0%) | 0 (0.0%) |
| Total | 205 (100.0%) | 507 (100.0%) |
Household Income by Mortgage Status in Zillah
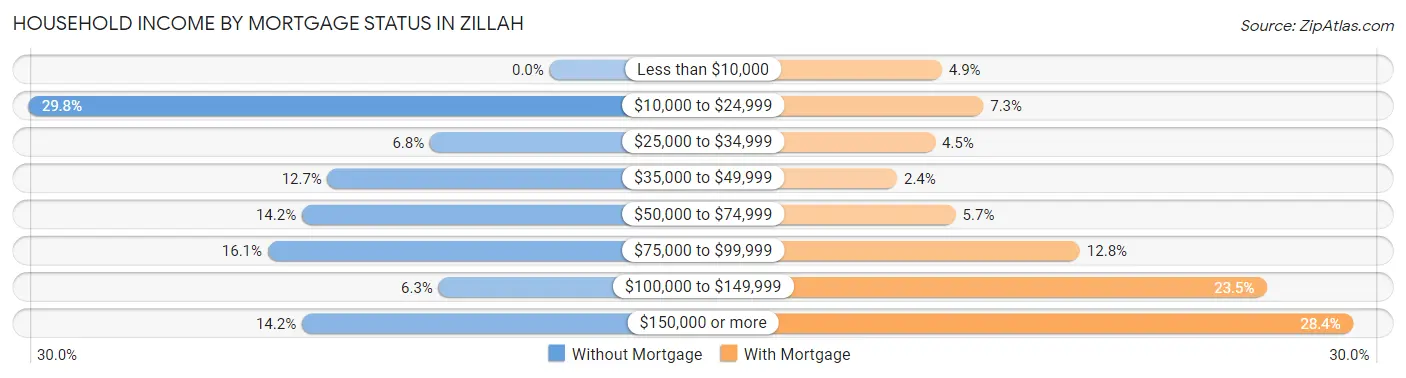
| Household Income | Without Mortgage | With Mortgage |
| Less than $10,000 | 0 (0.0%) | 25 (4.9%) |
| $10,000 to $24,999 | 61 (29.8%) | 37 (7.3%) |
| $25,000 to $34,999 | 14 (6.8%) | 23 (4.5%) |
| $35,000 to $49,999 | 26 (12.7%) | 12 (2.4%) |
| $50,000 to $74,999 | 29 (14.1%) | 29 (5.7%) |
| $75,000 to $99,999 | 33 (16.1%) | 65 (12.8%) |
| $100,000 to $149,999 | 13 (6.3%) | 119 (23.5%) |
| $150,000 or more | 29 (14.1%) | 144 (28.4%) |
| Total | 205 (100.0%) | 507 (100.0%) |
Property Value to Household Income Ratio in Zillah
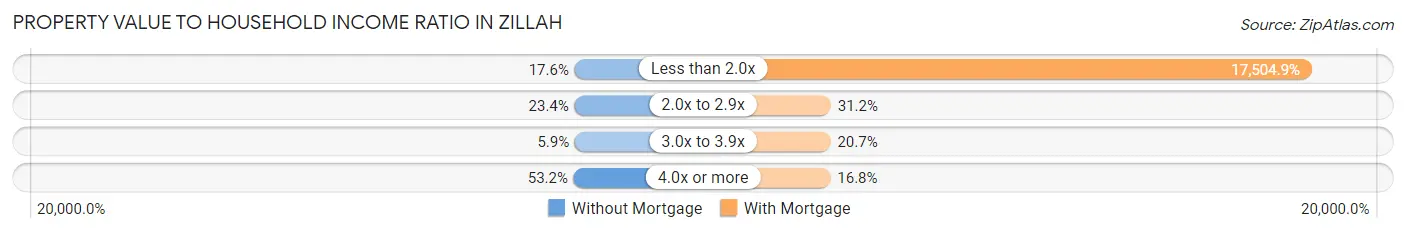
| Value-to-Income Ratio | Without Mortgage | With Mortgage |
| Less than 2.0x | 36 (17.6%) | 88,750 (17,504.9%) |
| 2.0x to 2.9x | 48 (23.4%) | 158 (31.2%) |
| 3.0x to 3.9x | 12 (5.9%) | 105 (20.7%) |
| 4.0x or more | 109 (53.2%) | 85 (16.8%) |
| Total | 205 (100.0%) | 507 (100.0%) |
Real Estate Taxes by Mortgage Status in Zillah
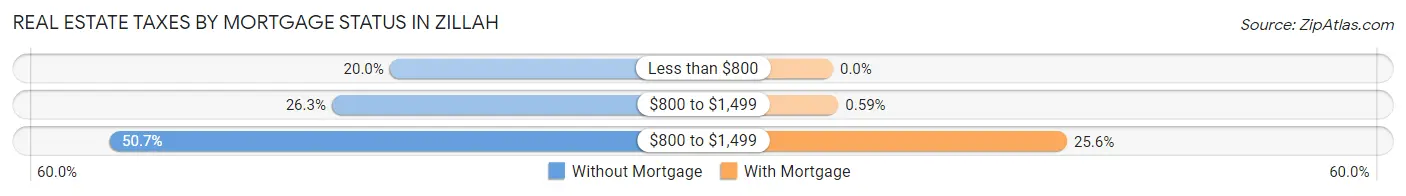
| Property Taxes | Without Mortgage | With Mortgage |
| Less than $800 | 41 (20.0%) | 0 (0.0%) |
| $800 to $1,499 | 54 (26.3%) | 3 (0.6%) |
| $800 to $1,499 | 104 (50.7%) | 130 (25.6%) |
| Total | 205 (100.0%) | 507 (100.0%) |
Health & Disability in Zillah
Health Insurance Coverage by Age in Zillah
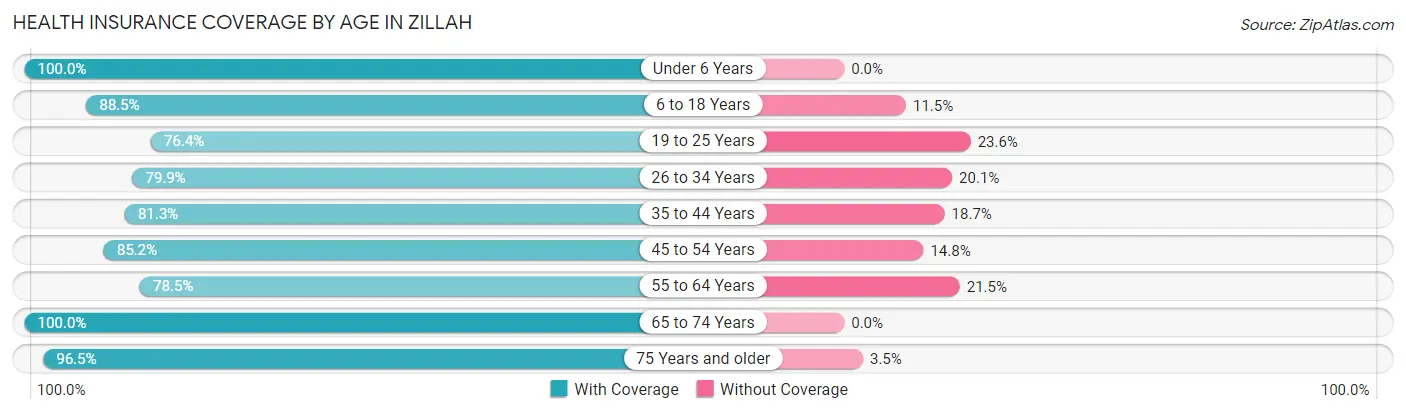
| Age Bracket | With Coverage | Without Coverage |
| Under 6 Years | 299 (100.0%) | 0 (0.0%) |
| 6 to 18 Years | 645 (88.5%) | 84 (11.5%) |
| 19 to 25 Years | 201 (76.4%) | 62 (23.6%) |
| 26 to 34 Years | 282 (79.9%) | 71 (20.1%) |
| 35 to 44 Years | 417 (81.3%) | 96 (18.7%) |
| 45 to 54 Years | 225 (85.2%) | 39 (14.8%) |
| 55 to 64 Years | 204 (78.5%) | 56 (21.5%) |
| 65 to 74 Years | 300 (100.0%) | 0 (0.0%) |
| 75 Years and older | 166 (96.5%) | 6 (3.5%) |
| Total | 2,739 (86.9%) | 414 (13.1%) |
Health Insurance Coverage by Citizenship Status in Zillah
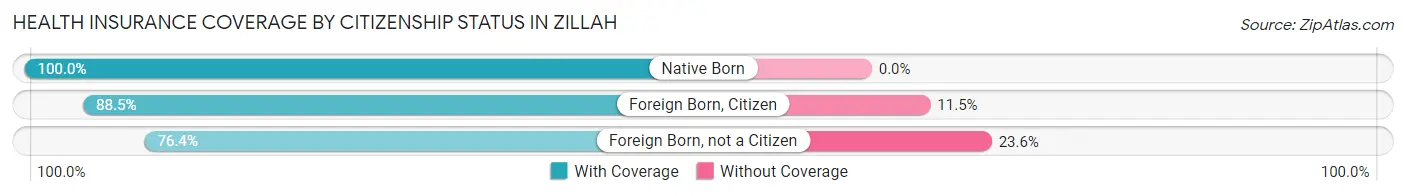
| Citizenship Status | With Coverage | Without Coverage |
| Native Born | 299 (100.0%) | 0 (0.0%) |
| Foreign Born, Citizen | 645 (88.5%) | 84 (11.5%) |
| Foreign Born, not a Citizen | 201 (76.4%) | 62 (23.6%) |
Health Insurance Coverage by Household Income in Zillah
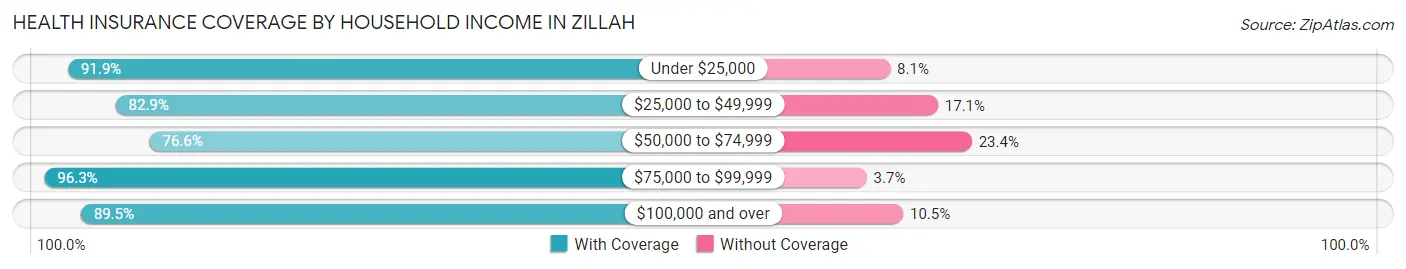
| Household Income | With Coverage | Without Coverage |
| Under $25,000 | 362 (91.9%) | 32 (8.1%) |
| $25,000 to $49,999 | 248 (82.9%) | 51 (17.1%) |
| $50,000 to $74,999 | 579 (76.6%) | 177 (23.4%) |
| $75,000 to $99,999 | 362 (96.3%) | 14 (3.7%) |
| $100,000 and over | 1,188 (89.5%) | 140 (10.5%) |
Public vs Private Health Insurance Coverage by Age in Zillah
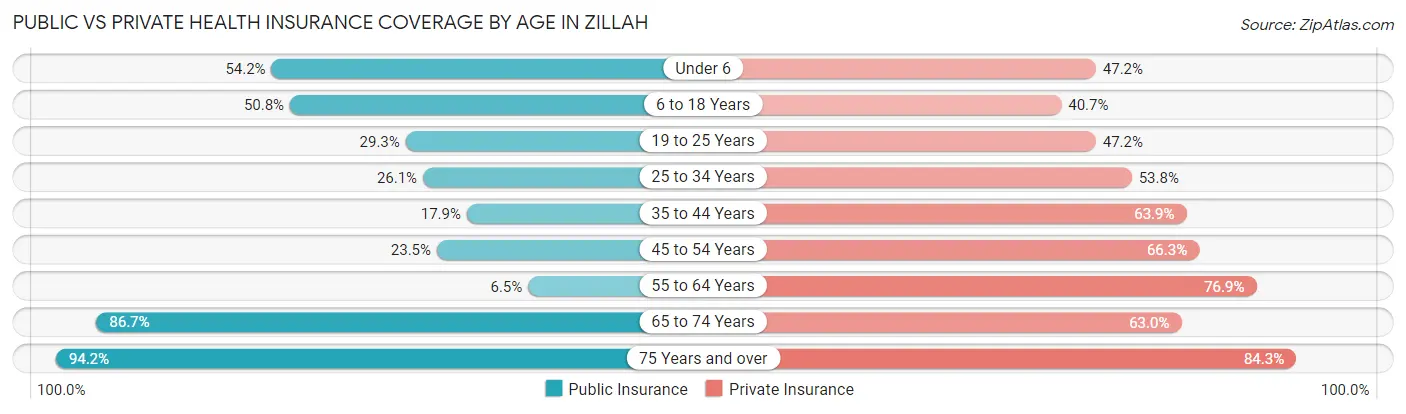
| Age Bracket | Public Insurance | Private Insurance |
| Under 6 | 162 (54.2%) | 141 (47.2%) |
| 6 to 18 Years | 370 (50.7%) | 297 (40.7%) |
| 19 to 25 Years | 77 (29.3%) | 124 (47.1%) |
| 25 to 34 Years | 92 (26.1%) | 190 (53.8%) |
| 35 to 44 Years | 92 (17.9%) | 328 (63.9%) |
| 45 to 54 Years | 62 (23.5%) | 175 (66.3%) |
| 55 to 64 Years | 17 (6.5%) | 200 (76.9%) |
| 65 to 74 Years | 260 (86.7%) | 189 (63.0%) |
| 75 Years and over | 162 (94.2%) | 145 (84.3%) |
| Total | 1,294 (41.0%) | 1,789 (56.7%) |
Disability Status by Sex by Age in Zillah
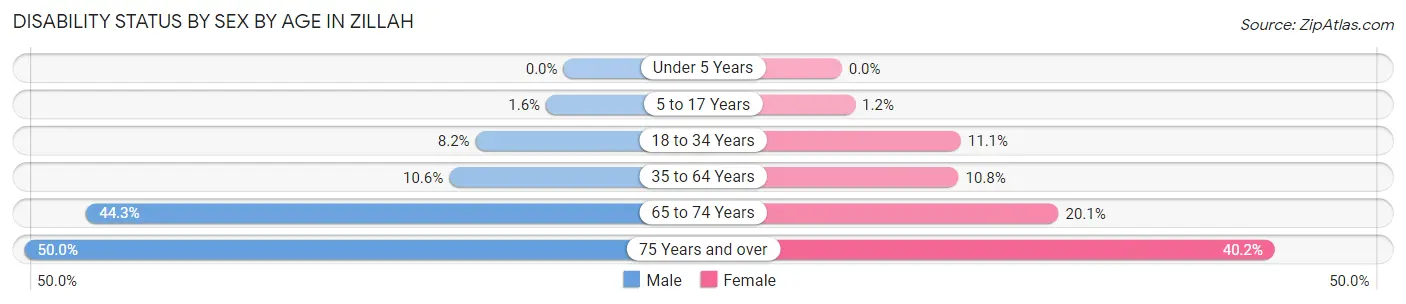
| Age Bracket | Male | Female |
| Under 5 Years | 0 (0.0%) | 0 (0.0%) |
| 5 to 17 Years | 5 (1.6%) | 5 (1.2%) |
| 18 to 34 Years | 24 (8.2%) | 39 (11.1%) |
| 35 to 64 Years | 63 (10.6%) | 48 (10.8%) |
| 65 to 74 Years | 58 (44.3%) | 34 (20.1%) |
| 75 Years and over | 30 (50.0%) | 45 (40.2%) |
Disability Class by Sex by Age in Zillah
Disability Class: Hearing Difficulty
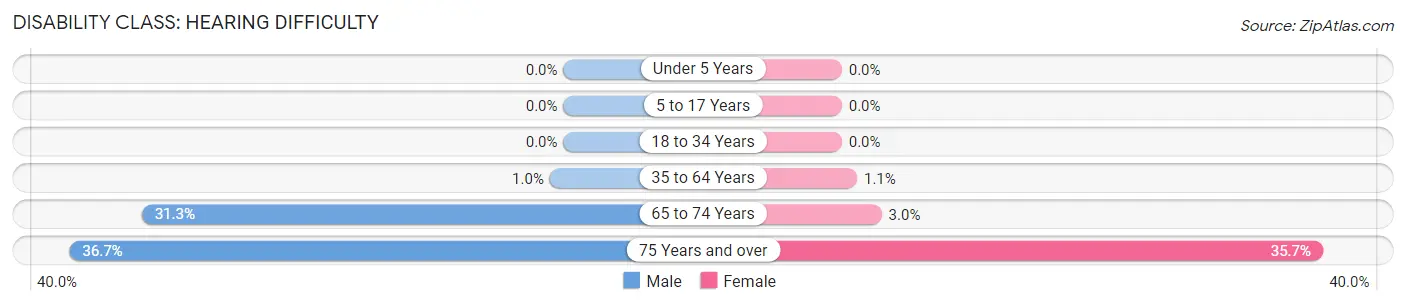
| Age Bracket | Male | Female |
| Under 5 Years | 0 (0.0%) | 0 (0.0%) |
| 5 to 17 Years | 0 (0.0%) | 0 (0.0%) |
| 18 to 34 Years | 0 (0.0%) | 0 (0.0%) |
| 35 to 64 Years | 6 (1.0%) | 5 (1.1%) |
| 65 to 74 Years | 41 (31.3%) | 5 (3.0%) |
| 75 Years and over | 22 (36.7%) | 40 (35.7%) |
Disability Class: Vision Difficulty
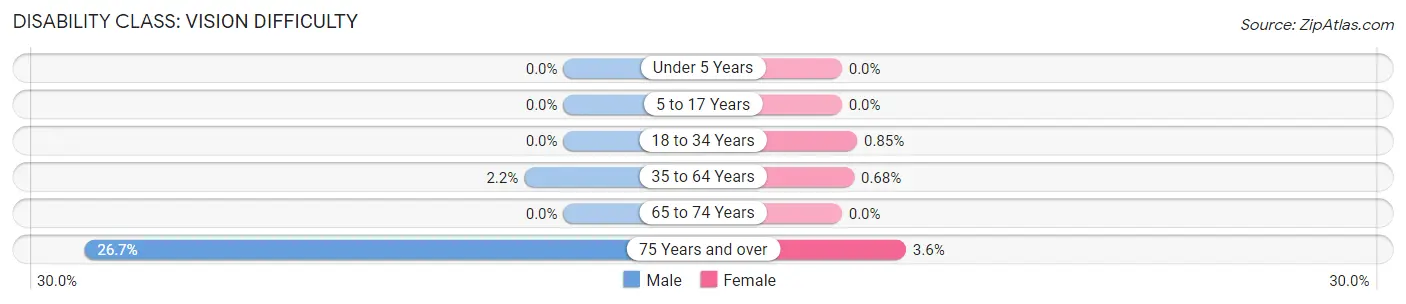
| Age Bracket | Male | Female |
| Under 5 Years | 0 (0.0%) | 0 (0.0%) |
| 5 to 17 Years | 0 (0.0%) | 0 (0.0%) |
| 18 to 34 Years | 0 (0.0%) | 3 (0.9%) |
| 35 to 64 Years | 13 (2.2%) | 3 (0.7%) |
| 65 to 74 Years | 0 (0.0%) | 0 (0.0%) |
| 75 Years and over | 16 (26.7%) | 4 (3.6%) |
Disability Class: Cognitive Difficulty

| Age Bracket | Male | Female |
| 5 to 17 Years | 5 (1.6%) | 5 (1.2%) |
| 18 to 34 Years | 24 (8.2%) | 7 (2.0%) |
| 35 to 64 Years | 17 (2.9%) | 40 (9.0%) |
| 65 to 74 Years | 36 (27.5%) | 0 (0.0%) |
| 75 Years and over | 11 (18.3%) | 7 (6.2%) |
Disability Class: Ambulatory Difficulty
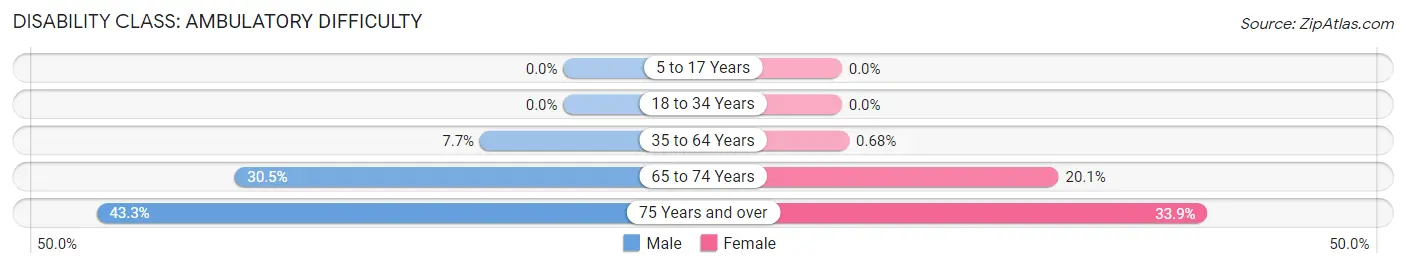
| Age Bracket | Male | Female |
| 5 to 17 Years | 0 (0.0%) | 0 (0.0%) |
| 18 to 34 Years | 0 (0.0%) | 0 (0.0%) |
| 35 to 64 Years | 46 (7.7%) | 3 (0.7%) |
| 65 to 74 Years | 40 (30.5%) | 34 (20.1%) |
| 75 Years and over | 26 (43.3%) | 38 (33.9%) |
Disability Class: Self-Care Difficulty
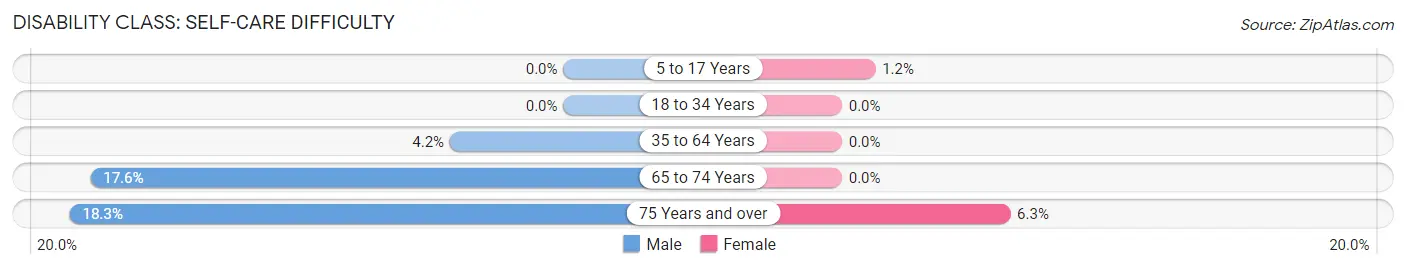
| Age Bracket | Male | Female |
| 5 to 17 Years | 0 (0.0%) | 5 (1.2%) |
| 18 to 34 Years | 0 (0.0%) | 0 (0.0%) |
| 35 to 64 Years | 25 (4.2%) | 0 (0.0%) |
| 65 to 74 Years | 23 (17.6%) | 0 (0.0%) |
| 75 Years and over | 11 (18.3%) | 7 (6.2%) |
Technology Access in Zillah
Computing Device Access in Zillah
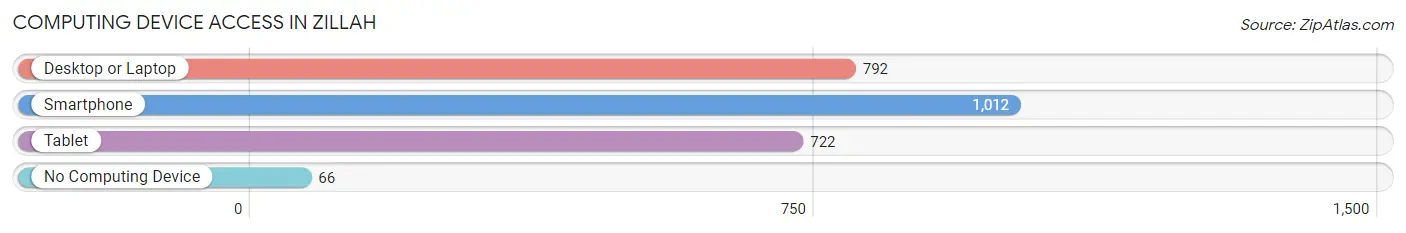
| Device Type | # Households | % Households |
| Desktop or Laptop | 792 | 71.0% |
| Smartphone | 1,012 | 90.7% |
| Tablet | 722 | 64.7% |
| No Computing Device | 66 | 5.9% |
| Total | 1,116 | 100.0% |
Internet Access in Zillah
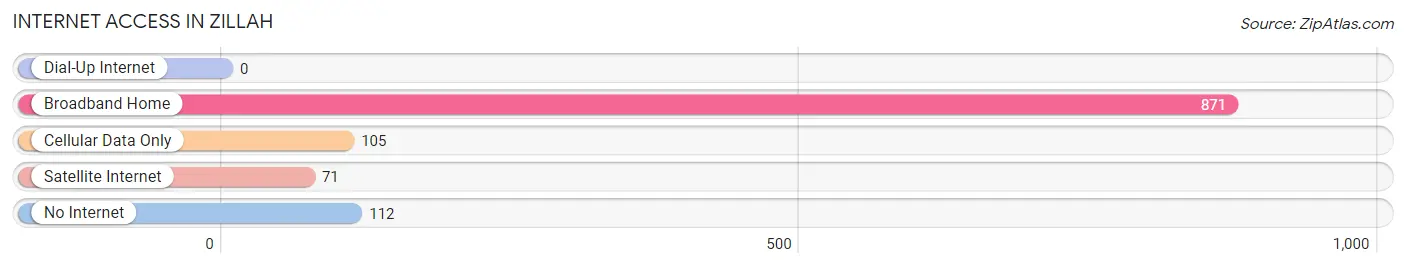
| Internet Type | # Households | % Households |
| Dial-Up Internet | 0 | 0.0% |
| Broadband Home | 871 | 78.0% |
| Cellular Data Only | 105 | 9.4% |
| Satellite Internet | 71 | 6.4% |
| No Internet | 112 | 10.0% |
| Total | 1,116 | 100.0% |
Zillah Summary
Zillah is a small city located in Yakima County, Washington, United States. It is situated in the Yakima Valley, approximately 20 miles south of Yakima and about 50 miles southeast of Mount Rainier National Park. The city is located at the intersection of Interstate 82 and U.S. Route 12. As of the 2010 census, the population of Zillah was 2,908.
History
The area that is now Zillah was first settled in the late 1800s by homesteaders. The town was originally known as "Fruitvale" due to the abundance of fruit orchards in the area. In 1902, the Northern Pacific Railway built a line through the area, and the town was renamed "Zillah" after the daughter of a railroad official. The town was officially incorporated in 1909.
Geography
Zillah is located in the Yakima Valley, which is part of the Columbia Plateau. The city is situated at an elevation of 1,068 feet (326 m) above sea level. The city is located at the intersection of Interstate 82 and U.S. Route 12. The city is bordered by the Yakima River to the north and the Naches River to the south.
Climate
Zillah has a semi-arid climate, with hot summers and cold winters. The average annual temperature is 54.3°F (12.4°C). The average annual precipitation is 8.7 inches (221 mm).
Economy
The economy of Zillah is largely based on agriculture. The city is home to several wineries and vineyards, as well as fruit orchards and other agricultural operations. The city is also home to several manufacturing and industrial businesses.
Demographics
As of the 2010 census, the population of Zillah was 2,908. The racial makeup of the city was 81.2% White, 0.7% African American, 0.9% Native American, 0.7% Asian, 0.1% Pacific Islander, 13.2% from other races, and 3.2% from two or more races. Hispanic or Latino of any race were 24.2% of the population.
The median income for a household in the city was $37,917, and the median income for a family was $45,938. The per capita income for the city was $17,945. About 16.2% of families and 20.2% of the population were below the poverty line, including 28.2% of those under age 18 and 8.2% of those age 65 or over.
Conclusion
Zillah is a small city located in Yakima County, Washington, United States. It is situated in the Yakima Valley, approximately 20 miles south of Yakima and about 50 miles southeast of Mount Rainier National Park. The city is located at the intersection of Interstate 82 and U.S. Route 12. As of the 2010 census, the population of Zillah was 2,908. The economy of Zillah is largely based on agriculture, with several wineries, vineyards, fruit orchards, and other agricultural operations. The city also has several manufacturing and industrial businesses. The racial makeup of the city was 81.2% White, 0.7% African American, 0.9% Native American, 0.7% Asian, 0.1% Pacific Islander, 13.2% from other races, and 3.2% from two or more races. Hispanic or Latino of any race were 24.2% of the population. The median income for a household in the city was $37,917, and the median income for a family was $45,938. About 16.2% of families and 20.2% of the population were below the poverty line.
Common Questions
What is Per Capita Income in Zillah?
Per Capita income in Zillah is $28,745.
What is the Median Family Income in Zillah?
Median Family Income in Zillah is $77,102.
What is the Median Household income in Zillah?
Median Household Income in Zillah is $68,701.
What is Income or Wage Gap in Zillah?
Income or Wage Gap in Zillah is 24.6%.
Women in Zillah earn 75.4 cents for every dollar earned by a man.
What is Family Income Deficit in Zillah?
Family Income Deficit in Zillah is $12,486.
Families that are below poverty line in Zillah earn $12,486 less on average than the poverty threshold level.
What is Inequality or Gini Index in Zillah?
Inequality or Gini Index in Zillah is 0.41.
What is the Total Population of Zillah?
Total Population of Zillah is 3,153.
What is the Total Male Population of Zillah?
Total Male Population of Zillah is 1,512.
What is the Total Female Population of Zillah?
Total Female Population of Zillah is 1,641.
What is the Ratio of Males per 100 Females in Zillah?
There are 92.14 Males per 100 Females in Zillah.
What is the Ratio of Females per 100 Males in Zillah?
There are 108.53 Females per 100 Males in Zillah.
What is the Median Population Age in Zillah?
Median Population Age in Zillah is 33.1 Years.
What is the Average Family Size in Zillah
Average Family Size in Zillah is 3.3 People.
What is the Average Household Size in Zillah
Average Household Size in Zillah is 2.8 People.
How Large is the Labor Force in Zillah?
There are 1,417 People in the Labor Forcein in Zillah.
What is the Percentage of People in the Labor Force in Zillah?
62.1% of People are in the Labor Force in Zillah.
What is the Unemployment Rate in Zillah?
Unemployment Rate in Zillah is 3.1%.