Oak Harbor, WA Map & Demographics
Oak Harbor Map
Oak Harbor Overview
$33,245
PER CAPITA INCOME
$82,652
AVG FAMILY INCOME
$68,039
AVG HOUSEHOLD INCOME
37.2%
WAGE / INCOME GAP [ % ]
62.8¢/ $1
WAGE / INCOME GAP [ $ ]
0.41
INEQUALITY / GINI INDEX
24,458
TOTAL POPULATION
12,018
MALE POPULATION
12,440
FEMALE POPULATION
96.61
MALES / 100 FEMALES
103.51
FEMALES / 100 MALES
31.7
MEDIAN AGE
3.1
AVG FAMILY SIZE
2.5
AVG HOUSEHOLD SIZE
12,453
LABOR FORCE [ PEOPLE ]
68.1%
PERCENT IN LABOR FORCE
6.9%
UNEMPLOYMENT RATE
Oak Harbor Area Codes
Income in Oak Harbor
Income Overview in Oak Harbor
Per Capita Income in Oak Harbor is $33,245, while median incomes of families and households are $82,652 and $68,039 respectively.
| Characteristic | Number | Measure |
| Per Capita Income | 24,458 | $33,245 |
| Median Family Income | 6,498 | $82,652 |
| Mean Family Income | 6,498 | $103,885 |
| Median Household Income | 9,852 | $68,039 |
| Mean Household Income | 9,852 | $88,144 |
| Income Deficit | 6,498 | $0 |
| Wage / Income Gap (%) | 24,458 | 37.21% |
| Wage / Income Gap ($) | 24,458 | 62.79¢ per $1 |
| Gini / Inequality Index | 24,458 | 0.41 |
Earnings by Sex in Oak Harbor
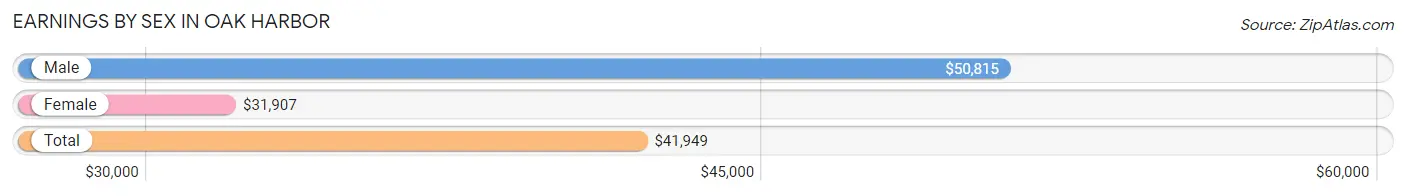
Average Earnings in Oak Harbor are $41,949, $50,815 for men and $31,907 for women, a difference of 37.2%.
| Sex | Number | Average Earnings |
| Male | 6,924 (53.6%) | $50,815 |
| Female | 5,995 (46.4%) | $31,907 |
| Total | 12,919 (100.0%) | $41,949 |
Earnings by Sex by Income Bracket in Oak Harbor
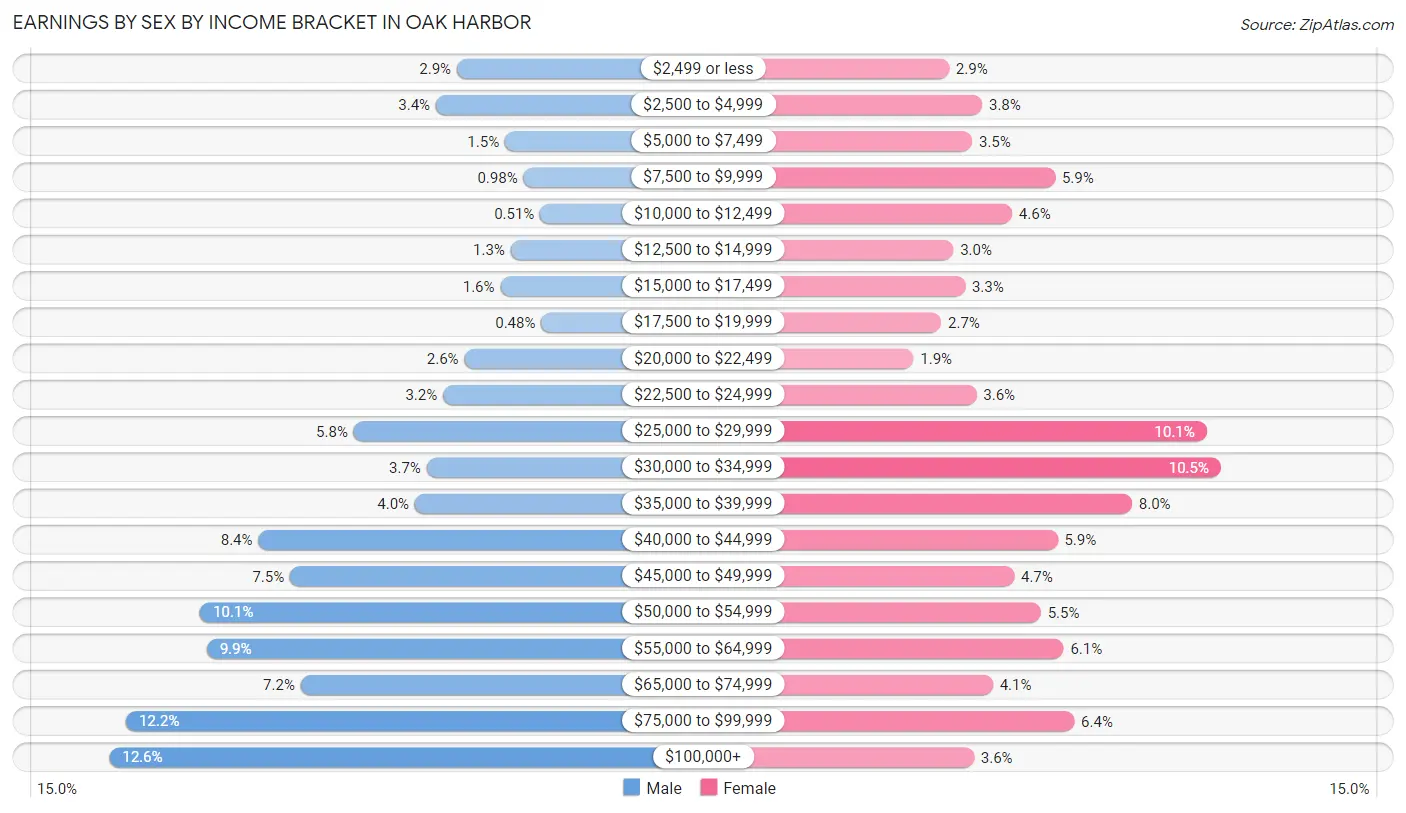
The most common earnings brackets in Oak Harbor are $100,000+ for men (874 | 12.6%) and $30,000 to $34,999 for women (630 | 10.5%).
| Income | Male | Female |
| $2,499 or less | 197 (2.9%) | 172 (2.9%) |
| $2,500 to $4,999 | 238 (3.4%) | 228 (3.8%) |
| $5,000 to $7,499 | 104 (1.5%) | 211 (3.5%) |
| $7,500 to $9,999 | 68 (1.0%) | 351 (5.9%) |
| $10,000 to $12,499 | 35 (0.5%) | 278 (4.6%) |
| $12,500 to $14,999 | 93 (1.3%) | 179 (3.0%) |
| $15,000 to $17,499 | 113 (1.6%) | 199 (3.3%) |
| $17,500 to $19,999 | 33 (0.5%) | 159 (2.6%) |
| $20,000 to $22,499 | 183 (2.6%) | 112 (1.9%) |
| $22,500 to $24,999 | 224 (3.2%) | 218 (3.6%) |
| $25,000 to $29,999 | 398 (5.8%) | 606 (10.1%) |
| $30,000 to $34,999 | 256 (3.7%) | 630 (10.5%) |
| $35,000 to $39,999 | 279 (4.0%) | 480 (8.0%) |
| $40,000 to $44,999 | 584 (8.4%) | 355 (5.9%) |
| $45,000 to $49,999 | 522 (7.5%) | 282 (4.7%) |
| $50,000 to $54,999 | 697 (10.1%) | 327 (5.4%) |
| $55,000 to $64,999 | 684 (9.9%) | 365 (6.1%) |
| $65,000 to $74,999 | 501 (7.2%) | 246 (4.1%) |
| $75,000 to $99,999 | 841 (12.1%) | 383 (6.4%) |
| $100,000+ | 874 (12.6%) | 214 (3.6%) |
| Total | 6,924 (100.0%) | 5,995 (100.0%) |
Earnings by Sex by Educational Attainment in Oak Harbor
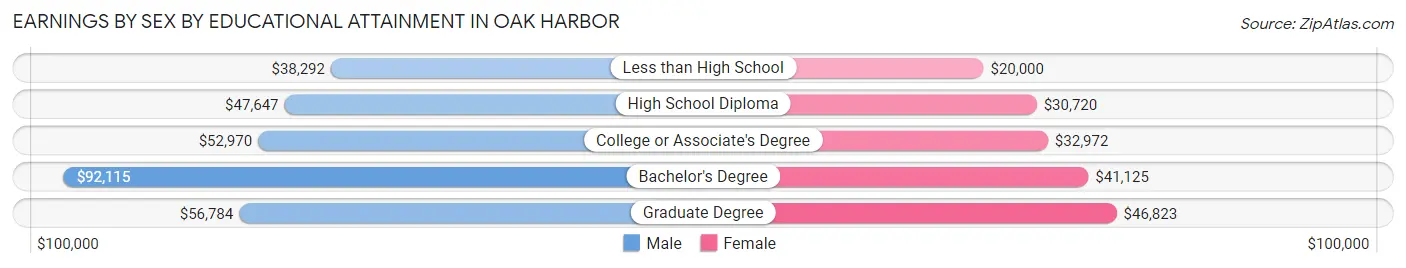
Average earnings in Oak Harbor are $53,657 for men and $33,398 for women, a difference of 37.8%. Men with an educational attainment of bachelor's degree enjoy the highest average annual earnings of $92,115, while those with less than high school education earn the least with $38,292. Women with an educational attainment of graduate degree earn the most with the average annual earnings of $46,823, while those with less than high school education have the smallest earnings of $20,000.
| Educational Attainment | Male Income | Female Income |
| Less than High School | $38,292 | $20,000 |
| High School Diploma | $47,647 | $30,720 |
| College or Associate's Degree | $52,970 | $32,972 |
| Bachelor's Degree | $92,115 | $41,125 |
| Graduate Degree | $56,784 | $46,823 |
| Total | $53,657 | $33,398 |
Family Income in Oak Harbor
Family Income Brackets in Oak Harbor
According to the Oak Harbor family income data, there are 1,722 families falling into the $50,000 to $74,999 income range, which is the most common income bracket and makes up 26.5% of all families. Conversely, the $10,000 to $14,999 income bracket is the least frequent group with only 110 families (1.7%) belonging to this category.
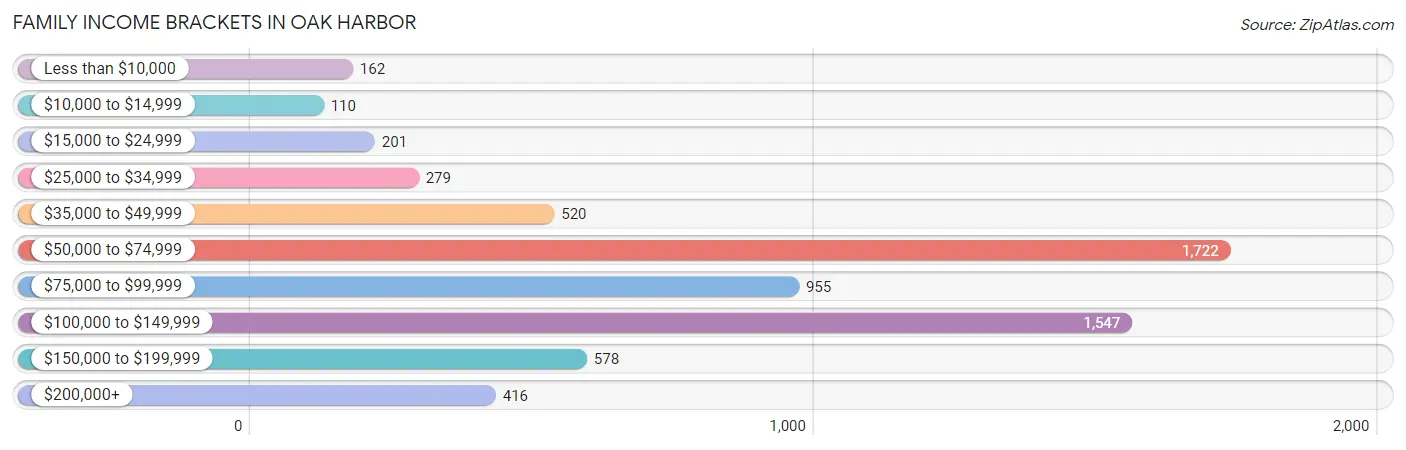
| Income Bracket | # Families | % Families |
| Less than $10,000 | 162 | 2.5% |
| $10,000 to $14,999 | 110 | 1.7% |
| $15,000 to $24,999 | 201 | 3.1% |
| $25,000 to $34,999 | 279 | 4.3% |
| $35,000 to $49,999 | 520 | 8.0% |
| $50,000 to $74,999 | 1,722 | 26.5% |
| $75,000 to $99,999 | 955 | 14.7% |
| $100,000 to $149,999 | 1,547 | 23.8% |
| $150,000 to $199,999 | 578 | 8.9% |
| $200,000+ | 416 | 6.4% |
Family Income by Famaliy Size in Oak Harbor
6-person families (224 | 3.5%) account for the highest median family income in Oak Harbor with $120,864 per family, while 2-person families (2,694 | 41.5%) have the highest median income of $44,408 per family member.
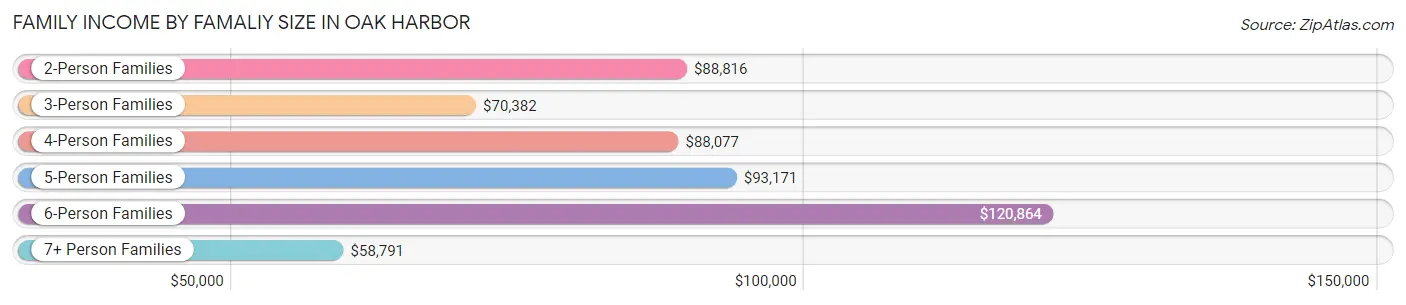
| Income Bracket | # Families | Median Income |
| 2-Person Families | 2,694 (41.5%) | $88,816 |
| 3-Person Families | 1,721 (26.5%) | $70,382 |
| 4-Person Families | 1,136 (17.5%) | $88,077 |
| 5-Person Families | 612 (9.4%) | $93,171 |
| 6-Person Families | 224 (3.5%) | $120,864 |
| 7+ Person Families | 111 (1.7%) | $58,791 |
| Total | 6,498 (100.0%) | $82,652 |
Family Income by Number of Earners in Oak Harbor
The median family income in Oak Harbor is $82,652, with families comprising 3+ earners (327) having the highest median family income of $162,212, while families with no earners (649) have the lowest median family income of $56,740, accounting for 5.0% and 10.0% of families, respectively.
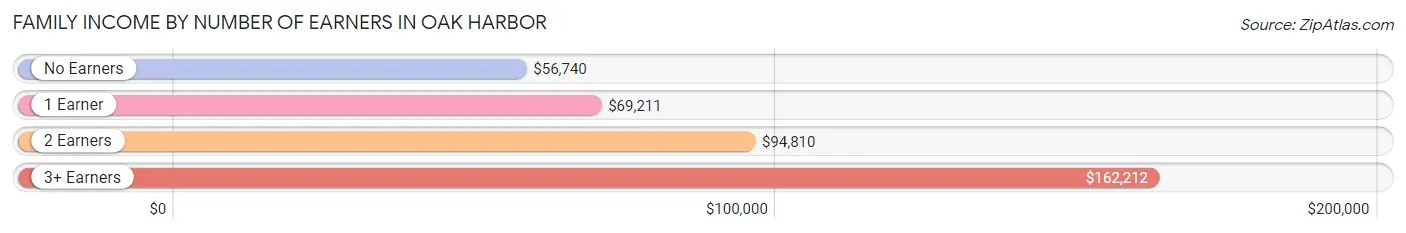
| Number of Earners | # Families | Median Income |
| No Earners | 649 (10.0%) | $56,740 |
| 1 Earner | 2,284 (35.1%) | $69,211 |
| 2 Earners | 3,238 (49.8%) | $94,810 |
| 3+ Earners | 327 (5.0%) | $162,212 |
| Total | 6,498 (100.0%) | $82,652 |
Household Income in Oak Harbor
Household Income Brackets in Oak Harbor
With 2,611 households falling in the category, the $50,000 to $74,999 income range is the most frequent in Oak Harbor, accounting for 26.5% of all households. In contrast, only 246 households (2.5%) fall into the $10,000 to $14,999 income bracket, making it the least populous group.
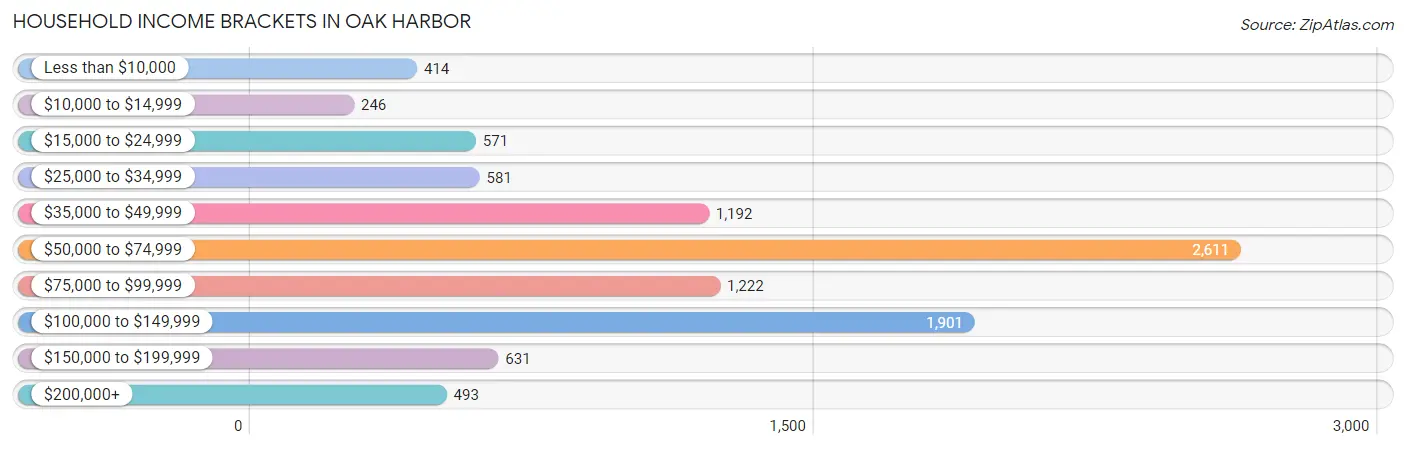
| Income Bracket | # Households | % Households |
| Less than $10,000 | 414 | 4.2% |
| $10,000 to $14,999 | 246 | 2.5% |
| $15,000 to $24,999 | 571 | 5.8% |
| $25,000 to $34,999 | 581 | 5.9% |
| $35,000 to $49,999 | 1,192 | 12.1% |
| $50,000 to $74,999 | 2,611 | 26.5% |
| $75,000 to $99,999 | 1,222 | 12.4% |
| $100,000 to $149,999 | 1,901 | 19.3% |
| $150,000 to $199,999 | 631 | 6.4% |
| $200,000+ | 493 | 5.0% |
Household Income by Householder Age in Oak Harbor
The median household income in Oak Harbor is $68,039, with the highest median household income of $105,200 found in the 45 to 64 years age bracket for the primary householder. A total of 2,076 households (21.1%) fall into this category. Meanwhile, the 65+ years age bracket for the primary householder has the lowest median household income of $56,890, with 1,898 households (19.3%) in this group.
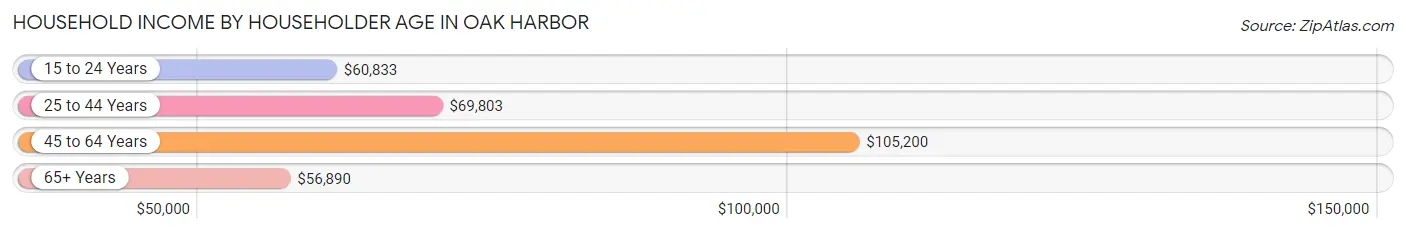
| Income Bracket | # Households | Median Income |
| 15 to 24 Years | 776 (7.9%) | $60,833 |
| 25 to 44 Years | 5,102 (51.8%) | $69,803 |
| 45 to 64 Years | 2,076 (21.1%) | $105,200 |
| 65+ Years | 1,898 (19.3%) | $56,890 |
| Total | 9,852 (100.0%) | $68,039 |
Poverty in Oak Harbor
Income Below Poverty by Sex and Age in Oak Harbor
With 7.6% poverty level for males and 9.2% for females among the residents of Oak Harbor, 55 to 64 year old males and 12 to 14 year old females are the most vulnerable to poverty, with 90 males (11.8%) and 169 females (27.0%) in their respective age groups living below the poverty level.
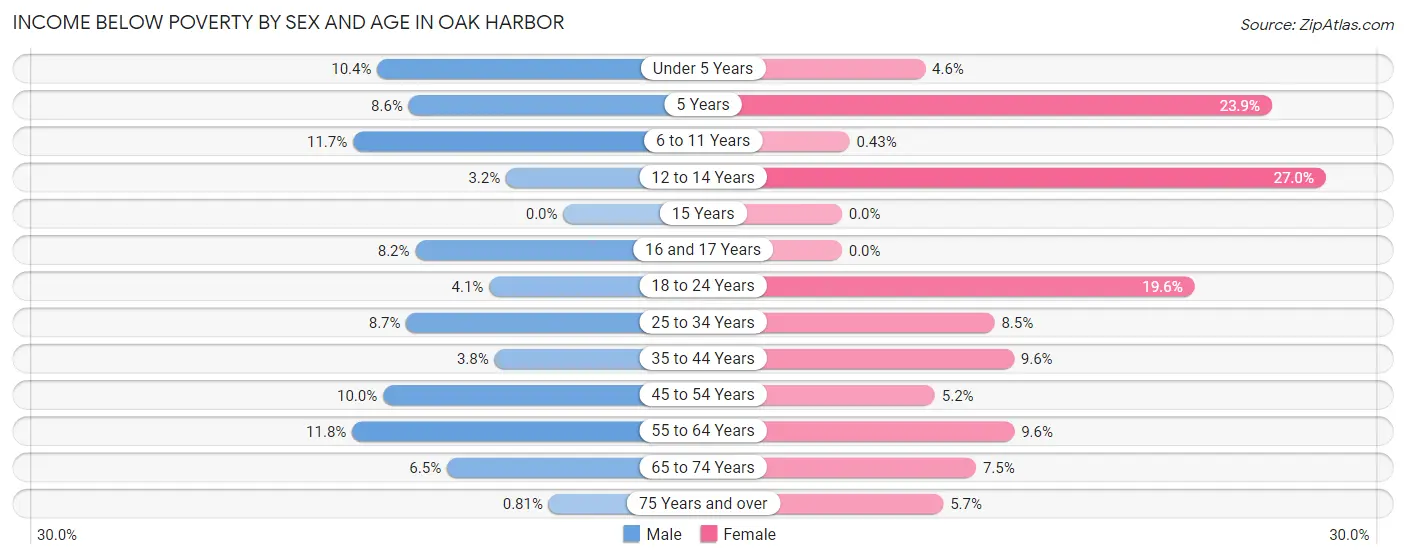
| Age Bracket | Male | Female |
| Under 5 Years | 134 (10.4%) | 56 (4.6%) |
| 5 Years | 23 (8.6%) | 51 (23.9%) |
| 6 to 11 Years | 139 (11.7%) | 4 (0.4%) |
| 12 to 14 Years | 9 (3.2%) | 169 (27.0%) |
| 15 Years | 0 (0.0%) | 0 (0.0%) |
| 16 and 17 Years | 22 (8.2%) | 0 (0.0%) |
| 18 to 24 Years | 38 (4.1%) | 205 (19.6%) |
| 25 to 34 Years | 239 (8.7%) | 205 (8.5%) |
| 35 to 44 Years | 76 (3.8%) | 194 (9.6%) |
| 45 to 54 Years | 86 (10.0%) | 45 (5.2%) |
| 55 to 64 Years | 90 (11.8%) | 107 (9.6%) |
| 65 to 74 Years | 51 (6.5%) | 69 (7.5%) |
| 75 Years and over | 4 (0.8%) | 42 (5.7%) |
| Total | 911 (7.6%) | 1,147 (9.2%) |
Income Above Poverty by Sex and Age in Oak Harbor
According to the poverty statistics in Oak Harbor, males aged 15 years and females aged 15 years are the age groups that are most secure financially, with 100.0% of males and 100.0% of females in these age groups living above the poverty line.
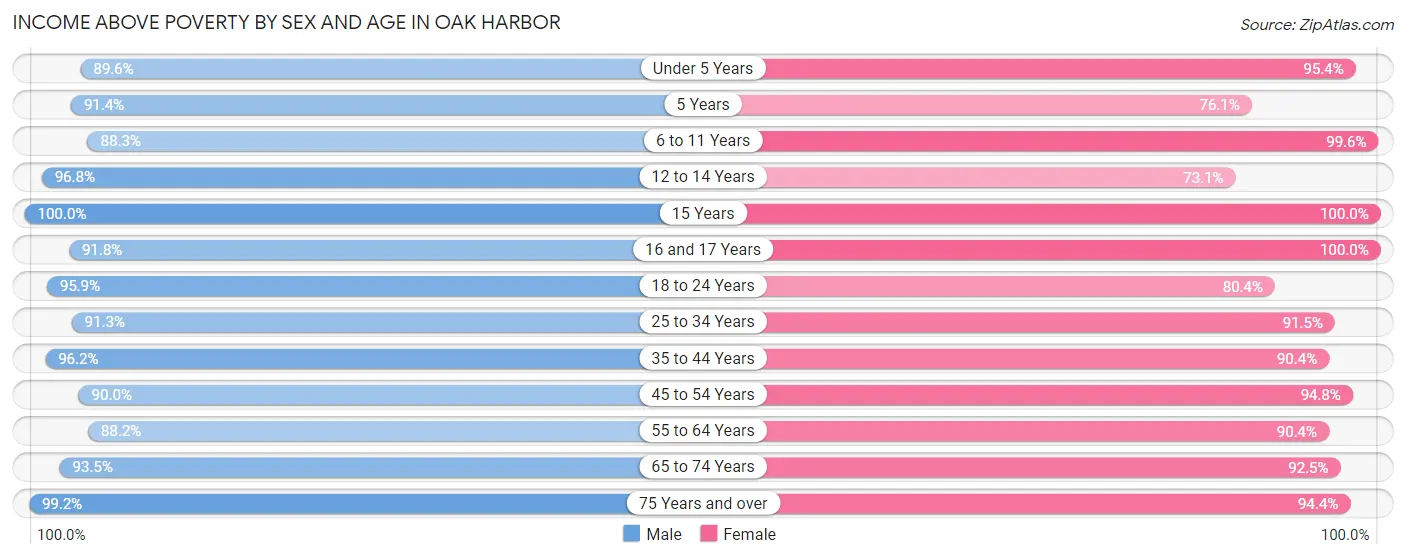
| Age Bracket | Male | Female |
| Under 5 Years | 1,159 (89.6%) | 1,151 (95.4%) |
| 5 Years | 244 (91.4%) | 162 (76.1%) |
| 6 to 11 Years | 1,048 (88.3%) | 922 (99.6%) |
| 12 to 14 Years | 273 (96.8%) | 458 (73.1%) |
| 15 Years | 123 (100.0%) | 47 (100.0%) |
| 16 and 17 Years | 245 (91.8%) | 250 (100.0%) |
| 18 to 24 Years | 883 (95.9%) | 839 (80.4%) |
| 25 to 34 Years | 2,497 (91.3%) | 2,206 (91.5%) |
| 35 to 44 Years | 1,910 (96.2%) | 1,832 (90.4%) |
| 45 to 54 Years | 771 (90.0%) | 823 (94.8%) |
| 55 to 64 Years | 675 (88.2%) | 1,008 (90.4%) |
| 65 to 74 Years | 736 (93.5%) | 855 (92.5%) |
| 75 Years and over | 487 (99.2%) | 701 (94.4%) |
| Total | 11,051 (92.4%) | 11,254 (90.7%) |
Income Below Poverty Among Married-Couple Families in Oak Harbor
The poverty statistics for married-couple families in Oak Harbor show that 2.3% or 117 of the total 5,056 families live below the poverty line. Families with 1 or 2 children have the highest poverty rate of 5.5%, comprising of 112 families. On the other hand, families with 3 or 4 children have the lowest poverty rate of 0.0%, which includes 0 families.
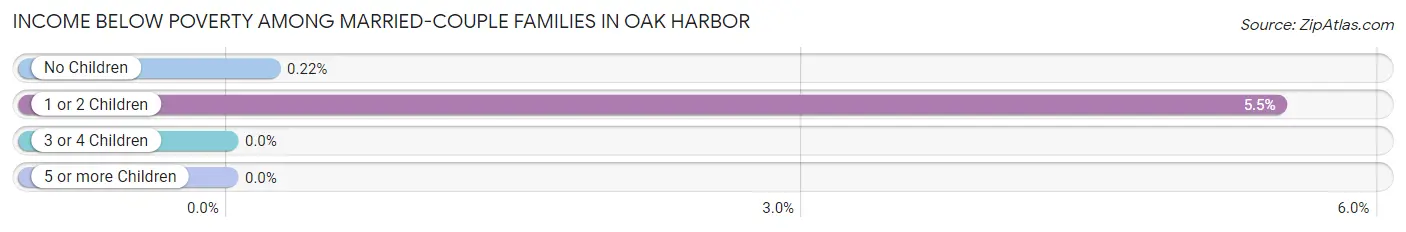
| Children | Above Poverty | Below Poverty |
| No Children | 2,311 (99.8%) | 5 (0.2%) |
| 1 or 2 Children | 1,931 (94.5%) | 112 (5.5%) |
| 3 or 4 Children | 697 (100.0%) | 0 (0.0%) |
| 5 or more Children | 0 (0.0%) | 0 (0.0%) |
| Total | 4,939 (97.7%) | 117 (2.3%) |
Income Below Poverty Among Single-Parent Households in Oak Harbor
According to the poverty data in Oak Harbor, 5.5% or 14 single-father households and 18.7% or 222 single-mother households are living below the poverty line. Among single-father households, those with 1 or 2 children have the highest poverty rate, with 10 households (6.3%) experiencing poverty. Likewise, among single-mother households, those with 5 or more children have the highest poverty rate, with 24 households (100.0%) falling below the poverty line.
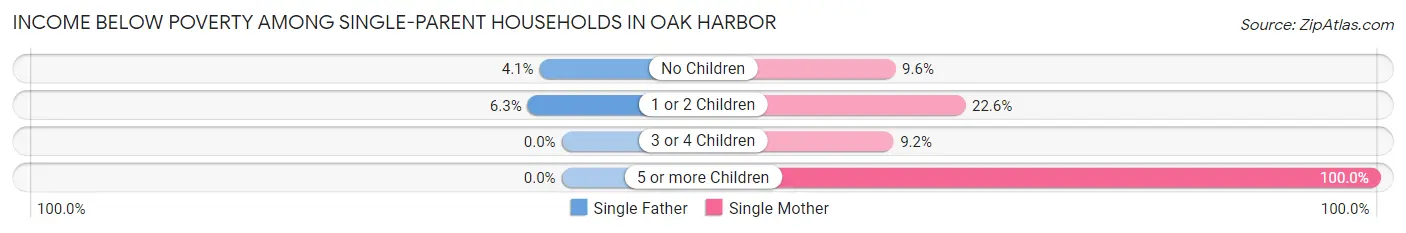
| Children | Single Father | Single Mother |
| No Children | 4 (4.1%) | 35 (9.6%) |
| 1 or 2 Children | 10 (6.3%) | 151 (22.6%) |
| 3 or 4 Children | 0 (0.0%) | 12 (9.2%) |
| 5 or more Children | 0 (0.0%) | 24 (100.0%) |
| Total | 14 (5.5%) | 222 (18.7%) |
Income Below Poverty Among Married-Couple vs Single-Parent Households in Oak Harbor
The poverty data for Oak Harbor shows that 117 of the married-couple family households (2.3%) and 236 of the single-parent households (16.4%) are living below the poverty level. Within the married-couple family households, those with 1 or 2 children have the highest poverty rate, with 112 households (5.5%) falling below the poverty line. Among the single-parent households, those with 5 or more children have the highest poverty rate, with 24 household (100.0%) living below poverty.
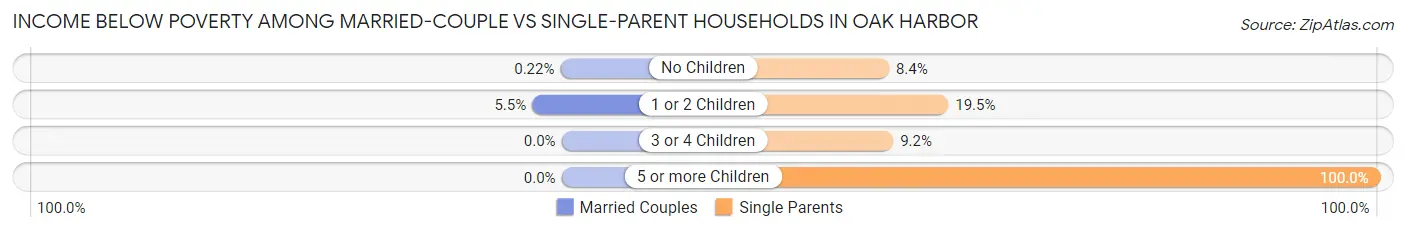
| Children | Married-Couple Families | Single-Parent Households |
| No Children | 5 (0.2%) | 39 (8.4%) |
| 1 or 2 Children | 112 (5.5%) | 161 (19.5%) |
| 3 or 4 Children | 0 (0.0%) | 12 (9.2%) |
| 5 or more Children | 0 (0.0%) | 24 (100.0%) |
| Total | 117 (2.3%) | 236 (16.4%) |
Race in Oak Harbor
The most populous races in Oak Harbor are White / Caucasian (16,471 | 67.3%), Hispanic or Latino (3,877 | 15.9%), and Two or more Races (3,403 | 13.9%).
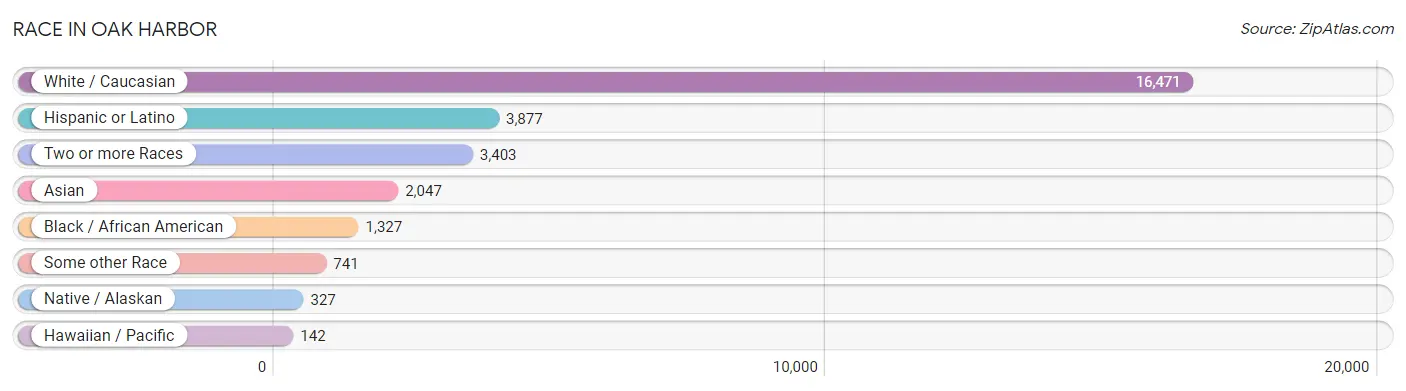
| Race | # Population | % Population |
| Asian | 2,047 | 8.4% |
| Black / African American | 1,327 | 5.4% |
| Hawaiian / Pacific | 142 | 0.6% |
| Hispanic or Latino | 3,877 | 15.9% |
| Native / Alaskan | 327 | 1.3% |
| White / Caucasian | 16,471 | 67.3% |
| Two or more Races | 3,403 | 13.9% |
| Some other Race | 741 | 3.0% |
| Total | 24,458 | 100.0% |
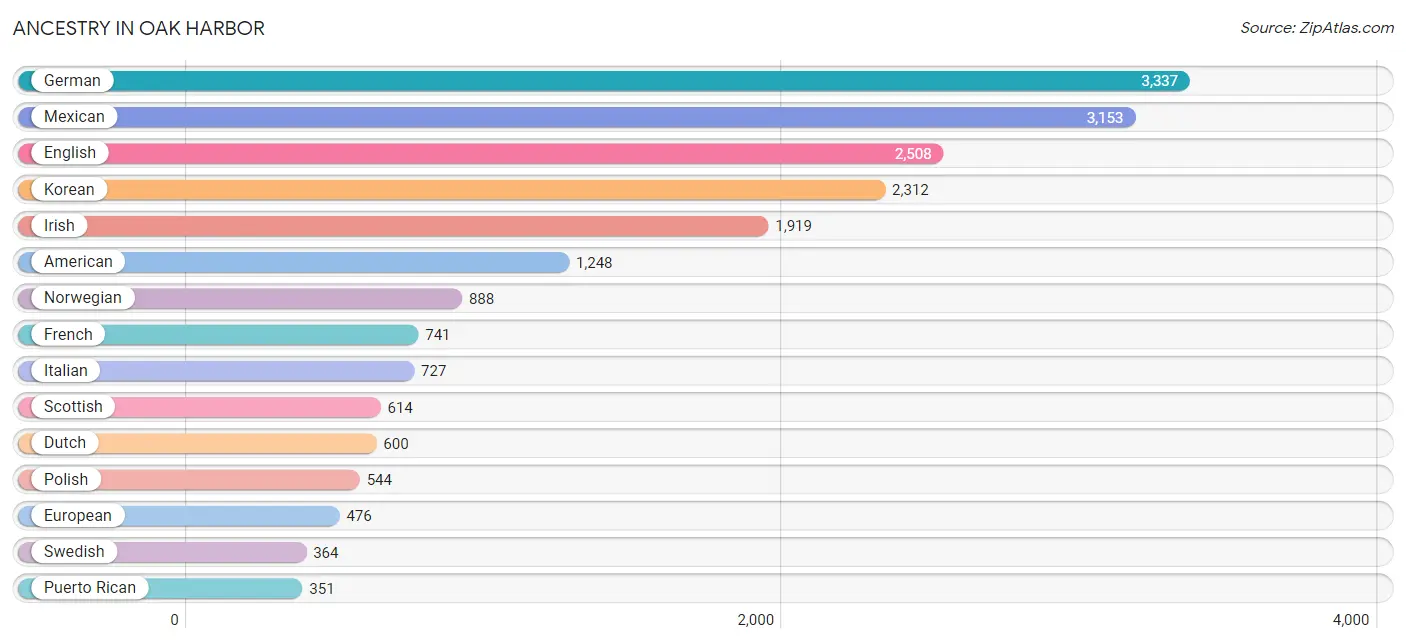
Ancestry in Oak Harbor
The most populous ancestries reported in Oak Harbor are German (3,337 | 13.6%), Mexican (3,153 | 12.9%), English (2,508 | 10.2%), Korean (2,312 | 9.5%), and Irish (1,919 | 7.9%), together accounting for 54.1% of all Oak Harbor residents.
| Ancestry | # Population | % Population |
| African | 13 | 0.1% |
| American | 1,248 | 5.1% |
| Apache | 21 | 0.1% |
| Arab | 24 | 0.1% |
| Armenian | 9 | 0.0% |
| Assyrian / Chaldean / Syriac | 9 | 0.0% |
| Australian | 39 | 0.2% |
| Austrian | 69 | 0.3% |
| Barbadian | 34 | 0.1% |
| Basque | 29 | 0.1% |
| Belgian | 18 | 0.1% |
| Belizean | 132 | 0.5% |
| Bhutanese | 285 | 1.2% |
| Blackfeet | 30 | 0.1% |
| British | 167 | 0.7% |
| Burmese | 73 | 0.3% |
| Canadian | 57 | 0.2% |
| Central American | 79 | 0.3% |
| Central American Indian | 32 | 0.1% |
| Cherokee | 160 | 0.6% |
| Chippewa | 20 | 0.1% |
| Choctaw | 25 | 0.1% |
| Colville | 1 | 0.0% |
| Czech | 60 | 0.3% |
| Czechoslovakian | 17 | 0.1% |
| Danish | 106 | 0.4% |
| Dominican | 51 | 0.2% |
| Dutch | 600 | 2.5% |
| Eastern European | 15 | 0.1% |
| Ecuadorian | 72 | 0.3% |
| English | 2,508 | 10.2% |
| European | 476 | 1.9% |
| Fijian | 69 | 0.3% |
| Finnish | 71 | 0.3% |
| French | 741 | 3.0% |
| French Canadian | 196 | 0.8% |
| German | 3,337 | 13.6% |
| German Russian | 13 | 0.1% |
| Greek | 217 | 0.9% |
| Guamanian / Chamorro | 114 | 0.5% |
| Guatemalan | 29 | 0.1% |
| Honduran | 7 | 0.0% |
| Hungarian | 54 | 0.2% |
| Indian (Asian) | 282 | 1.1% |
| Inupiat | 36 | 0.2% |
| Irish | 1,919 | 7.9% |
| Iroquois | 10 | 0.0% |
| Italian | 727 | 3.0% |
| Jamaican | 44 | 0.2% |
| Korean | 2,312 | 9.5% |
| Latvian | 24 | 0.1% |
| Lebanese | 15 | 0.1% |
| Lithuanian | 38 | 0.2% |
| Malaysian | 33 | 0.1% |
| Mexican | 3,153 | 12.9% |
| Mexican American Indian | 98 | 0.4% |
| Native Hawaiian | 140 | 0.6% |
| Northern European | 67 | 0.3% |
| Norwegian | 888 | 3.6% |
| Pakistani | 54 | 0.2% |
| Panamanian | 14 | 0.1% |
| Peruvian | 3 | 0.0% |
| Polish | 544 | 2.2% |
| Portuguese | 152 | 0.6% |
| Pueblo | 63 | 0.3% |
| Puerto Rican | 351 | 1.4% |
| Puget Sound Salish | 3 | 0.0% |
| Russian | 61 | 0.3% |
| Salvadoran | 29 | 0.1% |
| Samoan | 5 | 0.0% |
| Scandinavian | 146 | 0.6% |
| Scotch-Irish | 325 | 1.3% |
| Scottish | 614 | 2.5% |
| Seminole | 5 | 0.0% |
| Sioux | 40 | 0.2% |
| Slovak | 15 | 0.1% |
| South American | 75 | 0.3% |
| South American Indian | 20 | 0.1% |
| Spaniard | 66 | 0.3% |
| Spanish | 60 | 0.3% |
| Sri Lankan | 55 | 0.2% |
| Subsaharan African | 37 | 0.2% |
| Swedish | 364 | 1.5% |
| Swiss | 79 | 0.3% |
| Syrian | 9 | 0.0% |
| Thai | 10 | 0.0% |
| Tlingit-Haida | 3 | 0.0% |
| Turkish | 21 | 0.1% |
| Ukrainian | 34 | 0.1% |
| Welsh | 121 | 0.5% |
| Yaqui | 106 | 0.4% | View All 91 Rows |
Immigrants in Oak Harbor
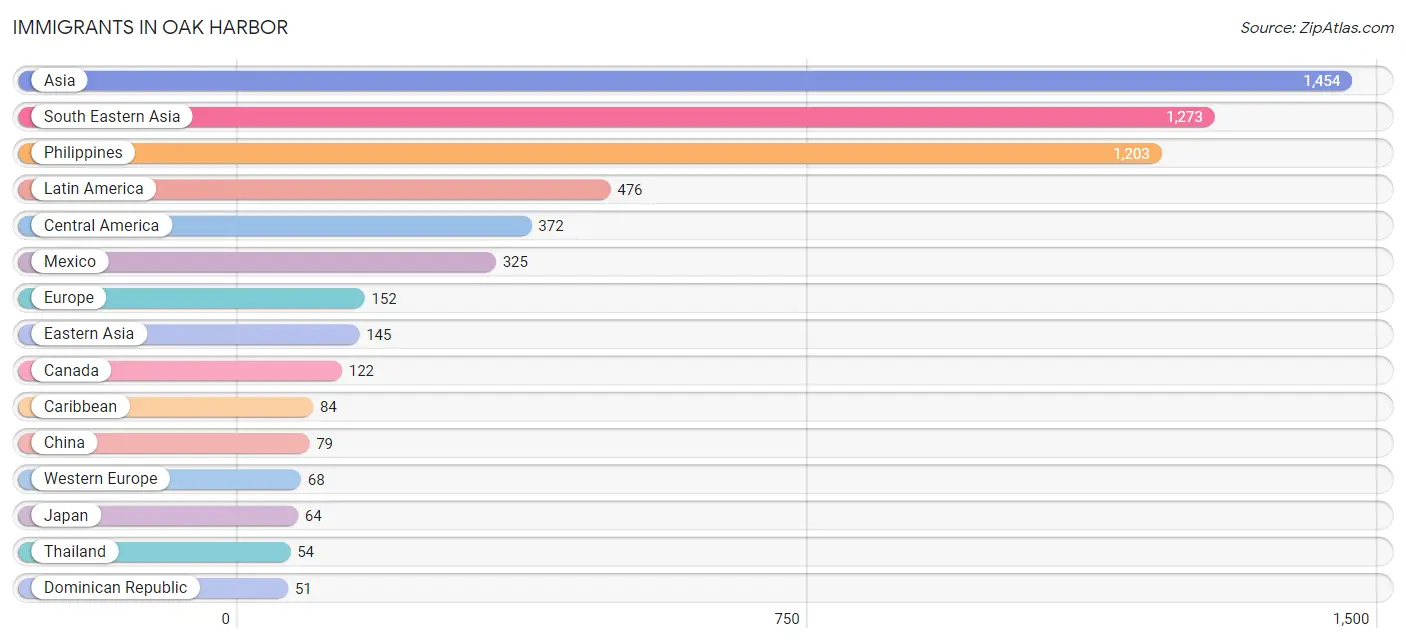
The most numerous immigrant groups reported in Oak Harbor came from Asia (1,454 | 5.9%), South Eastern Asia (1,273 | 5.2%), Philippines (1,203 | 4.9%), Latin America (476 | 1.9%), and Central America (372 | 1.5%), together accounting for 19.5% of all Oak Harbor residents.
| Immigration Origin | # Population | % Population |
| Africa | 13 | 0.1% |
| Asia | 1,454 | 5.9% |
| Belize | 47 | 0.2% |
| Canada | 122 | 0.5% |
| Caribbean | 84 | 0.3% |
| Central America | 372 | 1.5% |
| China | 79 | 0.3% |
| Dominica | 33 | 0.1% |
| Dominican Republic | 51 | 0.2% |
| Eastern Africa | 13 | 0.1% |
| Eastern Asia | 145 | 0.6% |
| Eastern Europe | 13 | 0.1% |
| Europe | 152 | 0.6% |
| France | 20 | 0.1% |
| Germany | 48 | 0.2% |
| Guyana | 20 | 0.1% |
| India | 10 | 0.0% |
| Italy | 31 | 0.1% |
| Japan | 64 | 0.3% |
| Korea | 2 | 0.0% |
| Latin America | 476 | 1.9% |
| Mexico | 325 | 1.3% |
| Nepal | 26 | 0.1% |
| Northern Europe | 26 | 0.1% |
| Oceania | 49 | 0.2% |
| Philippines | 1,203 | 4.9% |
| South America | 20 | 0.1% |
| South Central Asia | 36 | 0.2% |
| South Eastern Asia | 1,273 | 5.2% |
| Southern Europe | 45 | 0.2% |
| Spain | 14 | 0.1% |
| Thailand | 54 | 0.2% |
| Ukraine | 13 | 0.1% |
| Vietnam | 16 | 0.1% |
| Western Europe | 68 | 0.3% | View All 35 Rows |
Sex and Age in Oak Harbor
Sex and Age in Oak Harbor
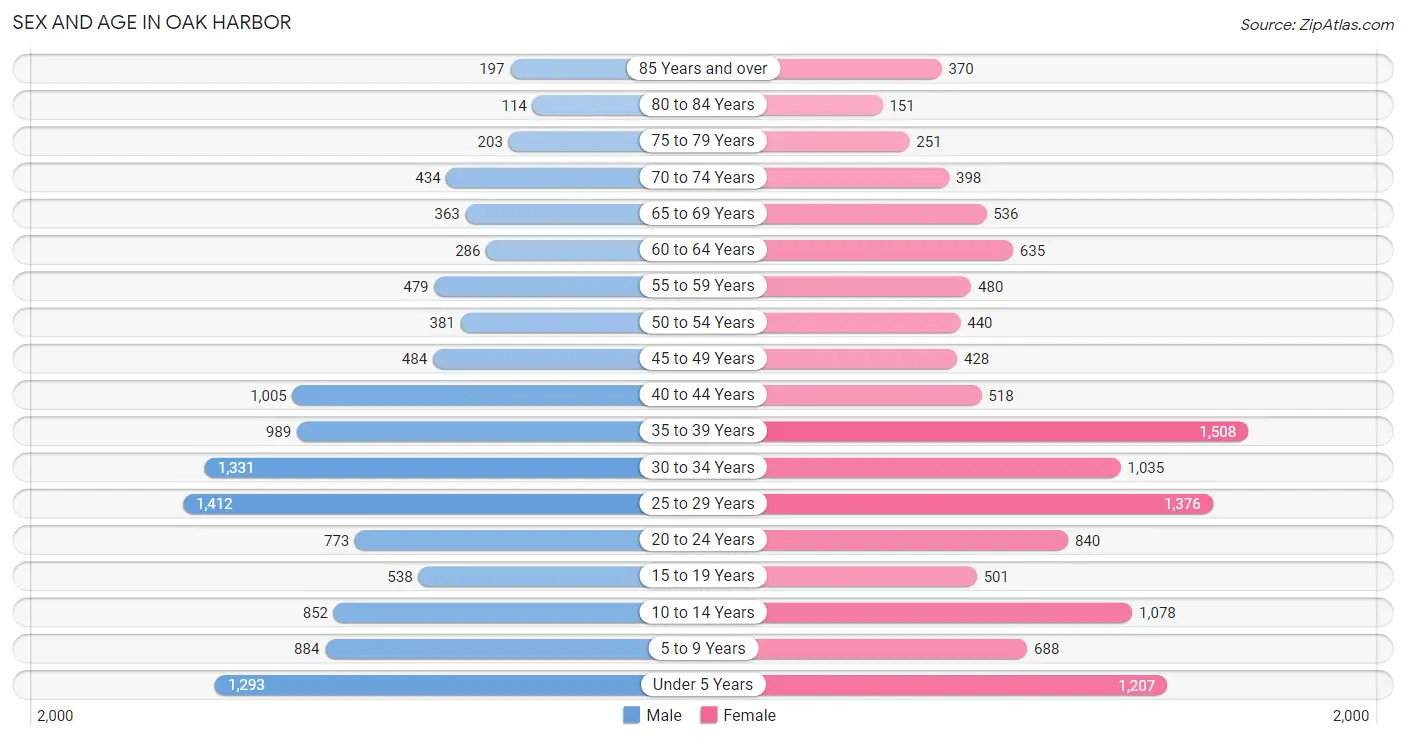
The most populous age groups in Oak Harbor are 25 to 29 Years (1,412 | 11.7%) for men and 35 to 39 Years (1,508 | 12.1%) for women.
| Age Bracket | Male | Female |
| Under 5 Years | 1,293 (10.8%) | 1,207 (9.7%) |
| 5 to 9 Years | 884 (7.4%) | 688 (5.5%) |
| 10 to 14 Years | 852 (7.1%) | 1,078 (8.7%) |
| 15 to 19 Years | 538 (4.5%) | 501 (4.0%) |
| 20 to 24 Years | 773 (6.4%) | 840 (6.8%) |
| 25 to 29 Years | 1,412 (11.7%) | 1,376 (11.1%) |
| 30 to 34 Years | 1,331 (11.1%) | 1,035 (8.3%) |
| 35 to 39 Years | 989 (8.2%) | 1,508 (12.1%) |
| 40 to 44 Years | 1,005 (8.4%) | 518 (4.2%) |
| 45 to 49 Years | 484 (4.0%) | 428 (3.4%) |
| 50 to 54 Years | 381 (3.2%) | 440 (3.5%) |
| 55 to 59 Years | 479 (4.0%) | 480 (3.9%) |
| 60 to 64 Years | 286 (2.4%) | 635 (5.1%) |
| 65 to 69 Years | 363 (3.0%) | 536 (4.3%) |
| 70 to 74 Years | 434 (3.6%) | 398 (3.2%) |
| 75 to 79 Years | 203 (1.7%) | 251 (2.0%) |
| 80 to 84 Years | 114 (0.9%) | 151 (1.2%) |
| 85 Years and over | 197 (1.6%) | 370 (3.0%) |
| Total | 12,018 (100.0%) | 12,440 (100.0%) |
Families and Households in Oak Harbor
Median Family Size in Oak Harbor
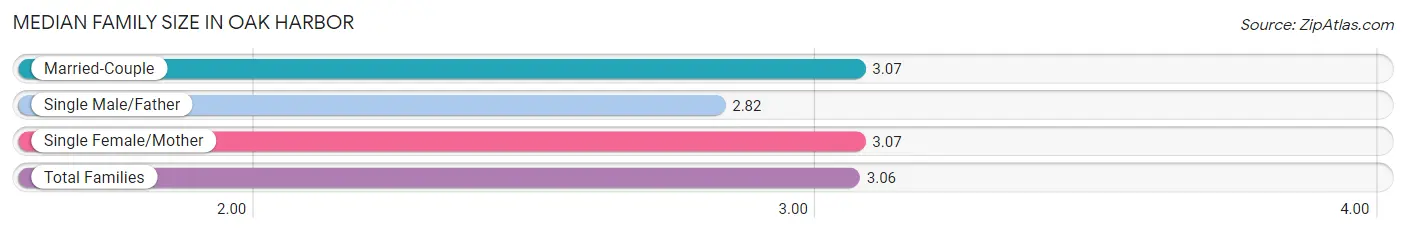
The median family size in Oak Harbor is 3.06 persons per family, with married-couple families (5,056 | 77.8%) accounting for the largest median family size of 3.07 persons per family. On the other hand, single male/father families (255 | 3.9%) represent the smallest median family size with 2.82 persons per family.
| Family Type | # Families | Family Size |
| Married-Couple | 5,056 (77.8%) | 3.07 |
| Single Male/Father | 255 (3.9%) | 2.82 |
| Single Female/Mother | 1,187 (18.3%) | 3.07 |
| Total Families | 6,498 (100.0%) | 3.06 |
Median Household Size in Oak Harbor
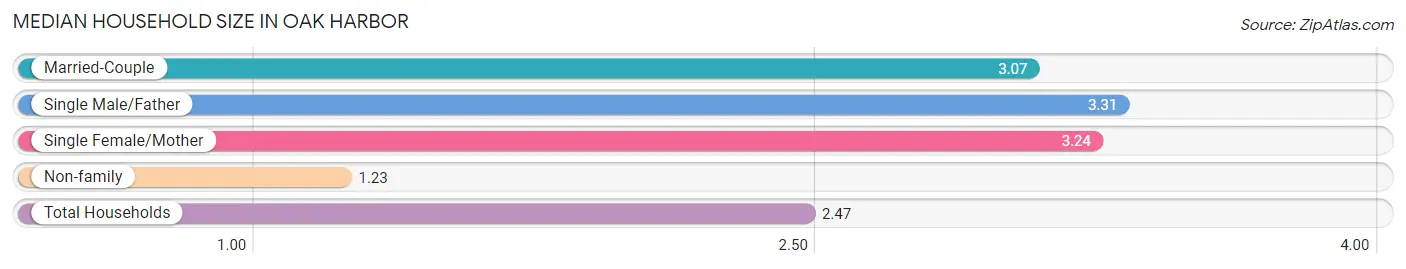
The median household size in Oak Harbor is 2.47 persons per household, with single male/father households (255 | 2.6%) accounting for the largest median household size of 3.31 persons per household. non-family households (3,354 | 34.0%) represent the smallest median household size with 1.23 persons per household.
| Household Type | # Households | Household Size |
| Married-Couple | 5,056 (51.3%) | 3.07 |
| Single Male/Father | 255 (2.6%) | 3.31 |
| Single Female/Mother | 1,187 (12.0%) | 3.24 |
| Non-family | 3,354 (34.0%) | 1.23 |
| Total Households | 9,852 (100.0%) | 2.47 |
Household Size by Marriage Status in Oak Harbor
Out of a total of 9,852 households in Oak Harbor, 6,498 (66.0%) are family households, while 3,354 (34.0%) are nonfamily households. The most numerous type of family households are 2-person households, comprising 2,600, and the most common type of nonfamily households are 1-person households, comprising 2,761.
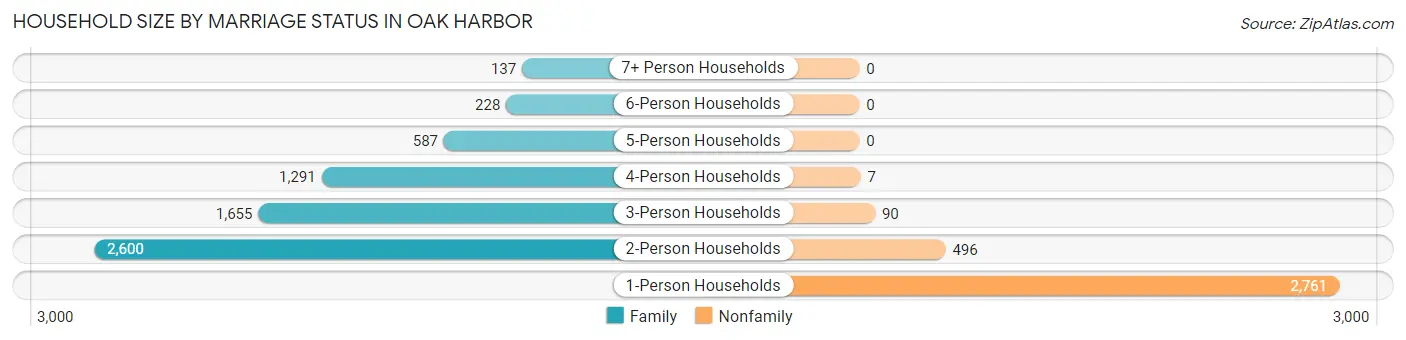
| Household Size | Family Households | Nonfamily Households |
| 1-Person Households | - | 2,761 (28.0%) |
| 2-Person Households | 2,600 (26.4%) | 496 (5.0%) |
| 3-Person Households | 1,655 (16.8%) | 90 (0.9%) |
| 4-Person Households | 1,291 (13.1%) | 7 (0.1%) |
| 5-Person Households | 587 (6.0%) | 0 (0.0%) |
| 6-Person Households | 228 (2.3%) | 0 (0.0%) |
| 7+ Person Households | 137 (1.4%) | 0 (0.0%) |
| Total | 6,498 (66.0%) | 3,354 (34.0%) |
Female Fertility in Oak Harbor
Fertility by Age in Oak Harbor
Average fertility rate in Oak Harbor is 113.0 births per 1,000 women. Women in the age bracket of 20 to 34 years have the highest fertility rate with 145.0 births per 1,000 women. Women in the age bracket of 20 to 34 years acount for 66.3% of all women with births.
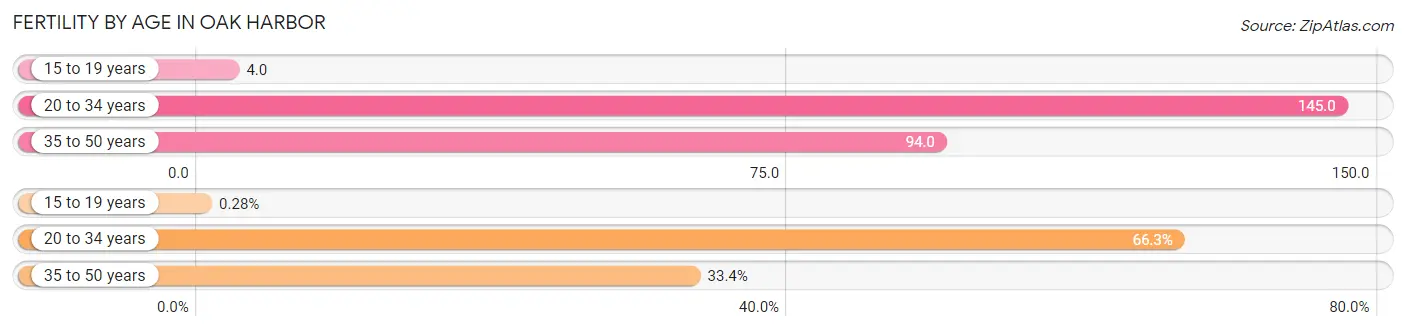
| Age Bracket | Women with Births | Births / 1,000 Women |
| 15 to 19 years | 2 (0.3%) | 4.0 |
| 20 to 34 years | 470 (66.3%) | 145.0 |
| 35 to 50 years | 237 (33.4%) | 94.0 |
| Total | 709 (100.0%) | 113.0 |
Fertility by Age by Marriage Status in Oak Harbor
83.8% of women with births (709) in Oak Harbor are married. The highest percentage of unmarried women with births falls into 35 to 50 years age bracket with 28.7% of them unmarried at the time of birth, while the lowest percentage of unmarried women with births belong to 15 to 19 years age bracket with 0.0% of them unmarried.
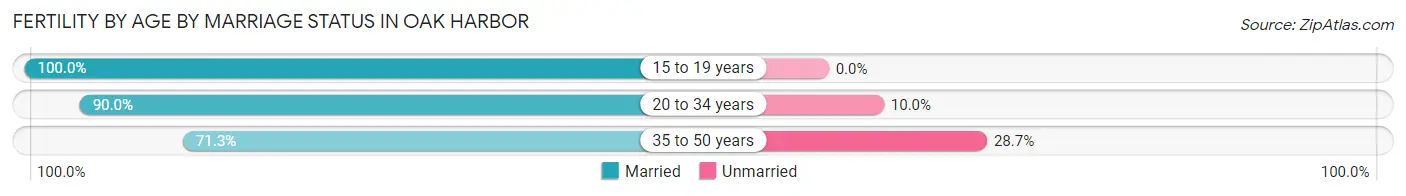
| Age Bracket | Married | Unmarried |
| 15 to 19 years | 2 (100.0%) | 0 (0.0%) |
| 20 to 34 years | 423 (90.0%) | 47 (10.0%) |
| 35 to 50 years | 169 (71.3%) | 68 (28.7%) |
| Total | 594 (83.8%) | 115 (16.2%) |
Fertility by Education in Oak Harbor
Average fertility rate in Oak Harbor is 113.0 births per 1,000 women. Women with the education attainment of bachelor's degree have the highest fertility rate of 211.0 births per 1,000 women, while women with the education attainment of less than high school have the lowest fertility at 25.0 births per 1,000 women. Women with the education attainment of bachelor's degree represent 35.5% of all women with births.
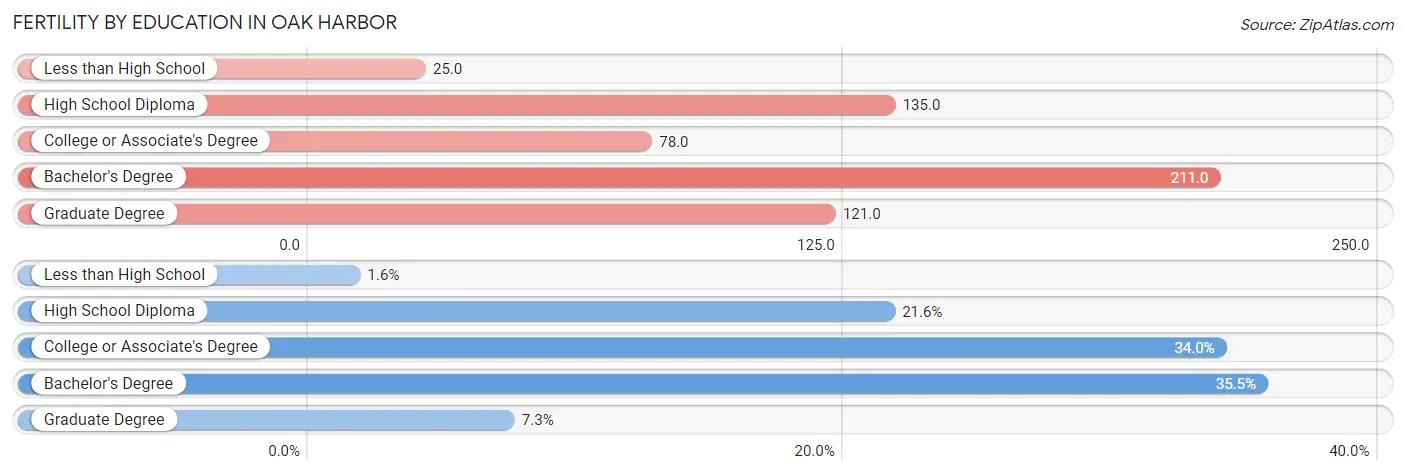
| Educational Attainment | Women with Births | Births / 1,000 Women |
| Less than High School | 11 (1.5%) | 25.0 |
| High School Diploma | 153 (21.6%) | 135.0 |
| College or Associate's Degree | 241 (34.0%) | 78.0 |
| Bachelor's Degree | 252 (35.5%) | 211.0 |
| Graduate Degree | 52 (7.3%) | 121.0 |
| Total | 709 (100.0%) | 113.0 |
Fertility by Education by Marriage Status in Oak Harbor
16.2% of women with births in Oak Harbor are unmarried. Women with the educational attainment of less than high school are most likely to be married with 100.0% of them married at childbirth, while women with the educational attainment of high school diploma are least likely to be married with 44.4% of them unmarried at childbirth.
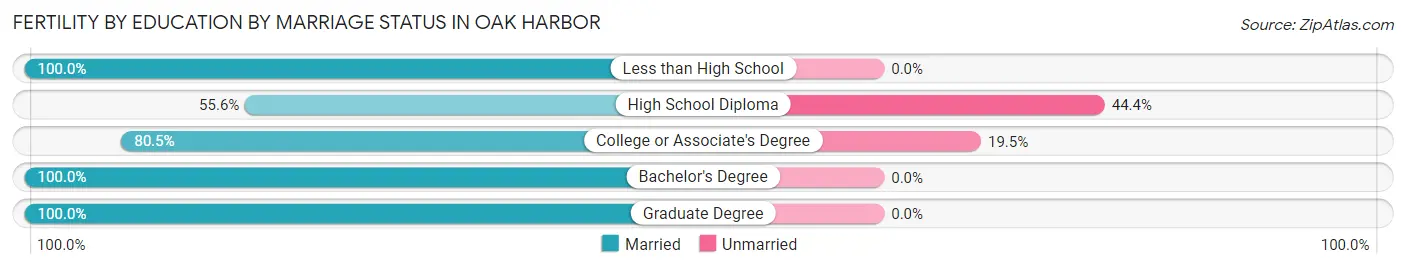
| Educational Attainment | Married | Unmarried |
| Less than High School | 11 (100.0%) | 0 (0.0%) |
| High School Diploma | 85 (55.6%) | 68 (44.4%) |
| College or Associate's Degree | 194 (80.5%) | 47 (19.5%) |
| Bachelor's Degree | 252 (100.0%) | 0 (0.0%) |
| Graduate Degree | 52 (100.0%) | 0 (0.0%) |
| Total | 594 (83.8%) | 115 (16.2%) |
Employment Characteristics in Oak Harbor
Employment by Class of Employer in Oak Harbor
Among the 11,404 employed individuals in Oak Harbor, private company employees (4,814 | 42.2%), federal government employees (4,586 | 40.2%), and local government employees (588 | 5.2%) make up the most common classes of employment.
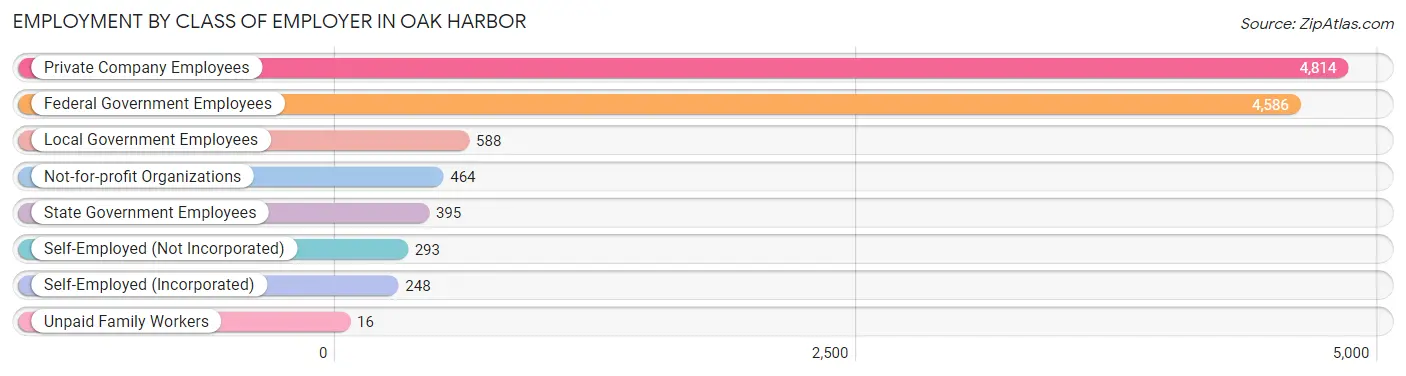
| Employer Class | # Employees | % Employees |
| Private Company Employees | 4,814 | 42.2% |
| Self-Employed (Incorporated) | 248 | 2.2% |
| Self-Employed (Not Incorporated) | 293 | 2.6% |
| Not-for-profit Organizations | 464 | 4.1% |
| Local Government Employees | 588 | 5.2% |
| State Government Employees | 395 | 3.5% |
| Federal Government Employees | 4,586 | 40.2% |
| Unpaid Family Workers | 16 | 0.1% |
| Total | 11,404 | 100.0% |
Employment Status by Age in Oak Harbor
According to the labor force statistics for Oak Harbor, out of the total population over 16 years of age (18,286), 68.1% or 12,453 individuals are in the labor force, with 6.9% or 859 of them unemployed. The age group with the highest labor force participation rate is 20 to 24 years, with 91.8% or 1,481 individuals in the labor force. Within the labor force, the 16 to 19 years age range has the highest percentage of unemployed individuals, with 20.1% or 70 of them being unemployed.
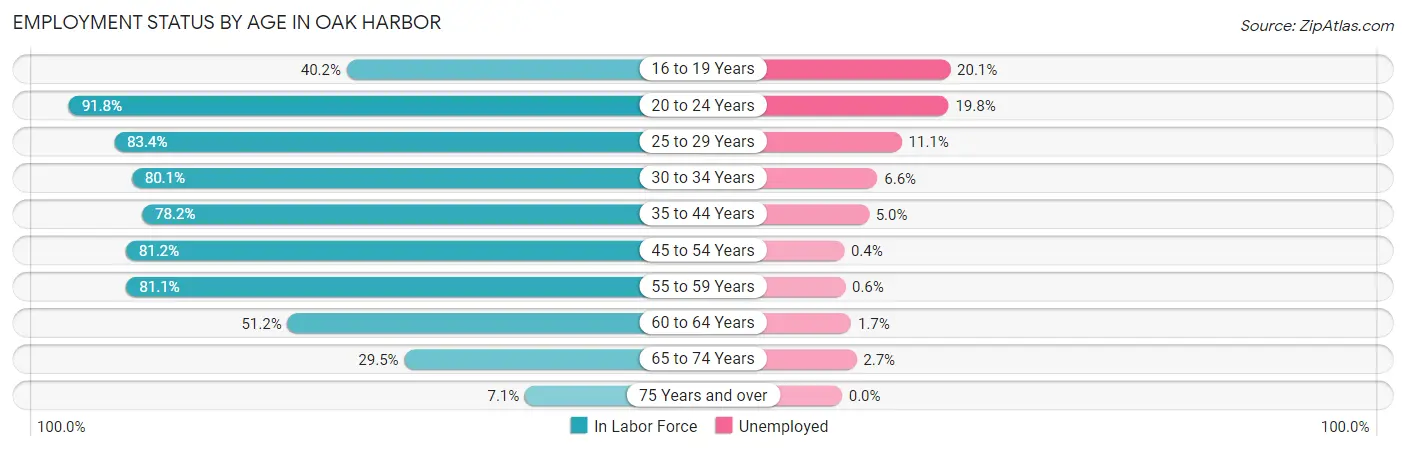
| Age Bracket | In Labor Force | Unemployed |
| 16 to 19 Years | 349 (40.2%) | 70 (20.1%) |
| 20 to 24 Years | 1,481 (91.8%) | 293 (19.8%) |
| 25 to 29 Years | 2,325 (83.4%) | 258 (11.1%) |
| 30 to 34 Years | 1,895 (80.1%) | 125 (6.6%) |
| 35 to 44 Years | 3,144 (78.2%) | 157 (5.0%) |
| 45 to 54 Years | 1,407 (81.2%) | 6 (0.4%) |
| 55 to 59 Years | 778 (81.1%) | 5 (0.6%) |
| 60 to 64 Years | 472 (51.2%) | 8 (1.7%) |
| 65 to 74 Years | 511 (29.5%) | 14 (2.7%) |
| 75 Years and over | 91 (7.1%) | 0 (0.0%) |
| Total | 12,453 (68.1%) | 859 (6.9%) |
Employment Status by Educational Attainment in Oak Harbor
According to labor force statistics for Oak Harbor, 78.4% of individuals (10,025) out of the total population between 25 and 64 years of age (12,787) are in the labor force, with 4.7% or 471 of them being unemployed. The group with the highest labor force participation rate are those with the educational attainment of bachelor's degree or higher, with 84.7% or 2,867 individuals in the labor force. Within the labor force, individuals with high school diploma education have the highest percentage of unemployment, with 5.2% or 117 of them being unemployed.
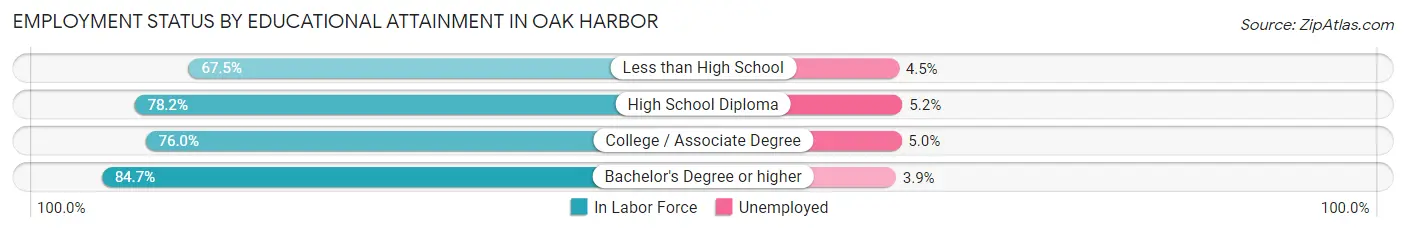
| Educational Attainment | In Labor Force | Unemployed |
| Less than High School | 446 (67.5%) | 30 (4.5%) |
| High School Diploma | 2,247 (78.2%) | 149 (5.2%) |
| College / Associate Degree | 4,460 (76.0%) | 293 (5.0%) |
| Bachelor's Degree or higher | 2,867 (84.7%) | 132 (3.9%) |
| Total | 10,025 (78.4%) | 601 (4.7%) |
Employment Occupations by Sex in Oak Harbor
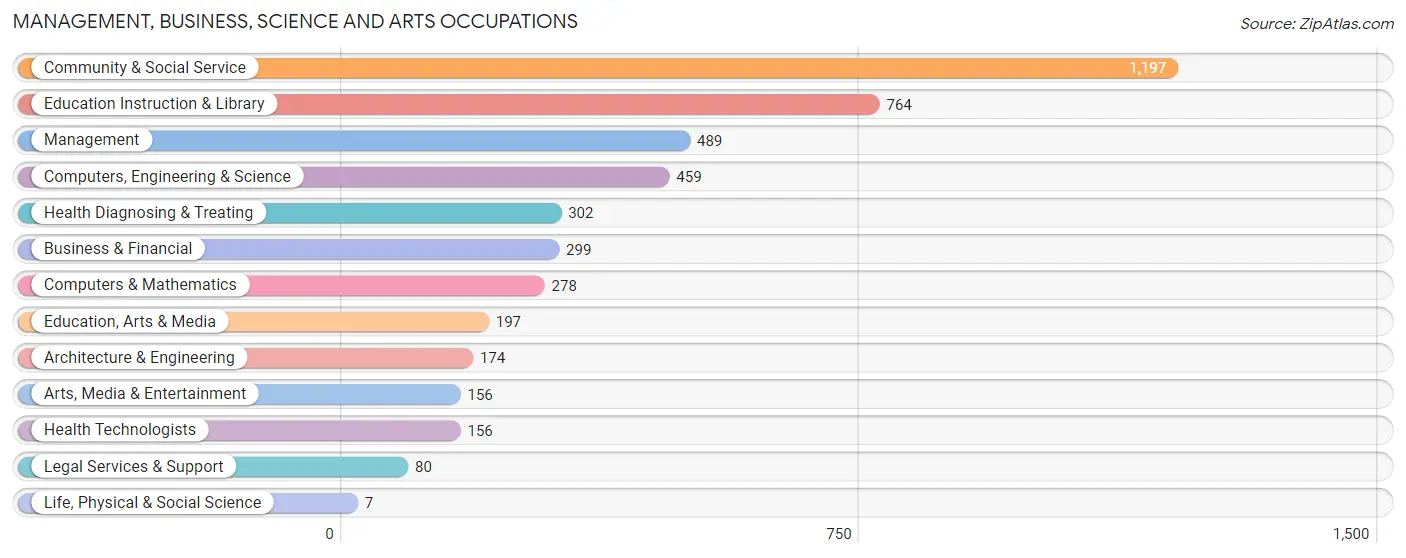
Management, Business, Science and Arts Occupations
The most common Management, Business, Science and Arts occupations in Oak Harbor are Community & Social Service (1,197 | 14.3%), Education Instruction & Library (764 | 9.1%), Management (489 | 5.9%), Computers, Engineering & Science (459 | 5.5%), and Health Diagnosing & Treating (302 | 3.6%).
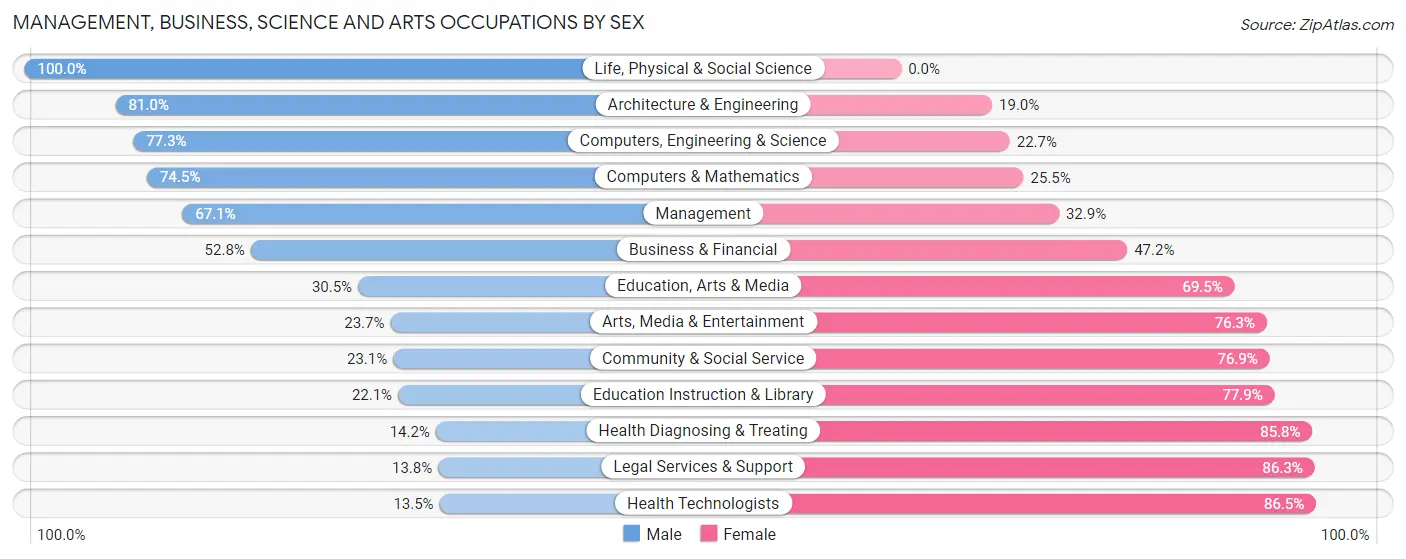
Management, Business, Science and Arts Occupations by Sex
Within the Management, Business, Science and Arts occupations in Oak Harbor, the most male-oriented occupations are Life, Physical & Social Science (100.0%), Architecture & Engineering (81.0%), and Computers, Engineering & Science (77.3%), while the most female-oriented occupations are Health Technologists (86.5%), Legal Services & Support (86.3%), and Health Diagnosing & Treating (85.8%).
| Occupation | Male | Female |
| Management | 328 (67.1%) | 161 (32.9%) |
| Business & Financial | 158 (52.8%) | 141 (47.2%) |
| Computers, Engineering & Science | 355 (77.3%) | 104 (22.7%) |
| Computers & Mathematics | 207 (74.5%) | 71 (25.5%) |
| Architecture & Engineering | 141 (81.0%) | 33 (19.0%) |
| Life, Physical & Social Science | 7 (100.0%) | 0 (0.0%) |
| Community & Social Service | 277 (23.1%) | 920 (76.9%) |
| Education, Arts & Media | 60 (30.5%) | 137 (69.5%) |
| Legal Services & Support | 11 (13.8%) | 69 (86.3%) |
| Education Instruction & Library | 169 (22.1%) | 595 (77.9%) |
| Arts, Media & Entertainment | 37 (23.7%) | 119 (76.3%) |
| Health Diagnosing & Treating | 43 (14.2%) | 259 (85.8%) |
| Health Technologists | 21 (13.5%) | 135 (86.5%) |
| Total (Category) | 1,161 (42.3%) | 1,585 (57.7%) |
| Total (Overall) | 3,704 (44.4%) | 4,647 (55.6%) |
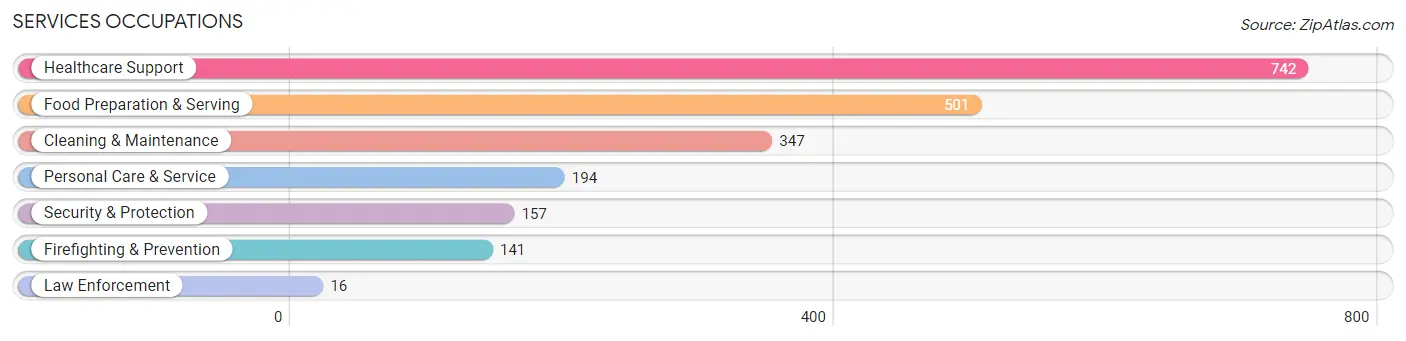
Services Occupations
The most common Services occupations in Oak Harbor are Healthcare Support (742 | 8.9%), Food Preparation & Serving (501 | 6.0%), Cleaning & Maintenance (347 | 4.2%), Personal Care & Service (194 | 2.3%), and Security & Protection (157 | 1.9%).
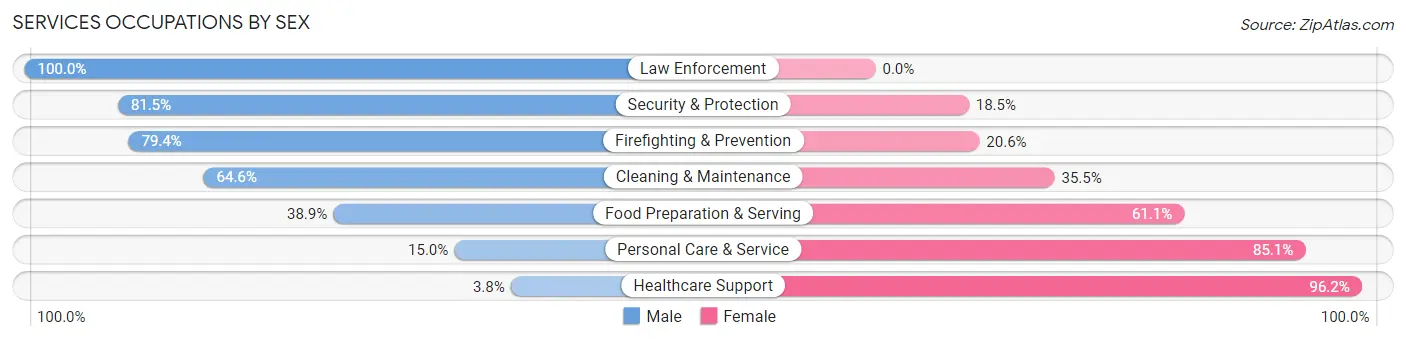
Services Occupations by Sex
Within the Services occupations in Oak Harbor, the most male-oriented occupations are Law Enforcement (100.0%), Security & Protection (81.5%), and Firefighting & Prevention (79.4%), while the most female-oriented occupations are Healthcare Support (96.2%), Personal Care & Service (85.1%), and Food Preparation & Serving (61.1%).
| Occupation | Male | Female |
| Healthcare Support | 28 (3.8%) | 714 (96.2%) |
| Security & Protection | 128 (81.5%) | 29 (18.5%) |
| Firefighting & Prevention | 112 (79.4%) | 29 (20.6%) |
| Law Enforcement | 16 (100.0%) | 0 (0.0%) |
| Food Preparation & Serving | 195 (38.9%) | 306 (61.1%) |
| Cleaning & Maintenance | 224 (64.5%) | 123 (35.4%) |
| Personal Care & Service | 29 (14.9%) | 165 (85.1%) |
| Total (Category) | 604 (31.1%) | 1,337 (68.9%) |
| Total (Overall) | 3,704 (44.4%) | 4,647 (55.6%) |
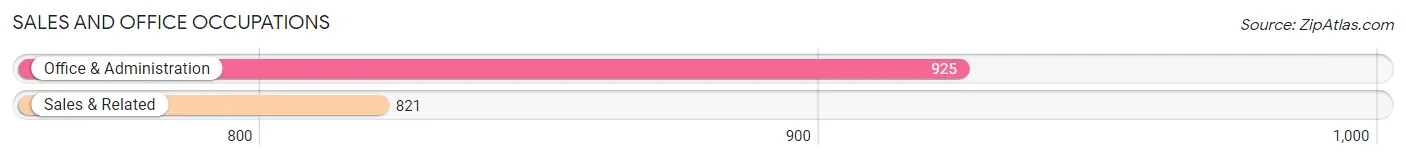
Sales and Office Occupations
The most common Sales and Office occupations in Oak Harbor are Office & Administration (925 | 11.1%), and Sales & Related (821 | 9.8%).
Sales and Office Occupations by Sex
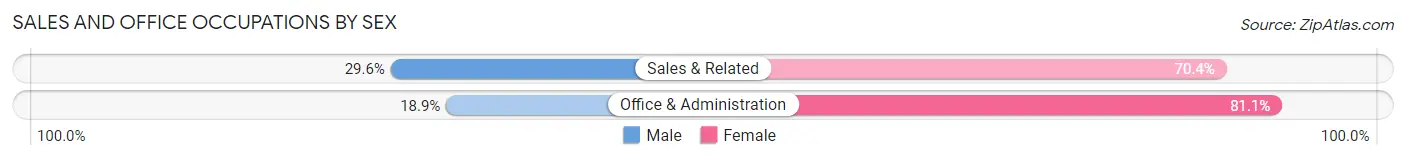
| Occupation | Male | Female |
| Sales & Related | 243 (29.6%) | 578 (70.4%) |
| Office & Administration | 175 (18.9%) | 750 (81.1%) |
| Total (Category) | 418 (23.9%) | 1,328 (76.1%) |
| Total (Overall) | 3,704 (44.4%) | 4,647 (55.6%) |
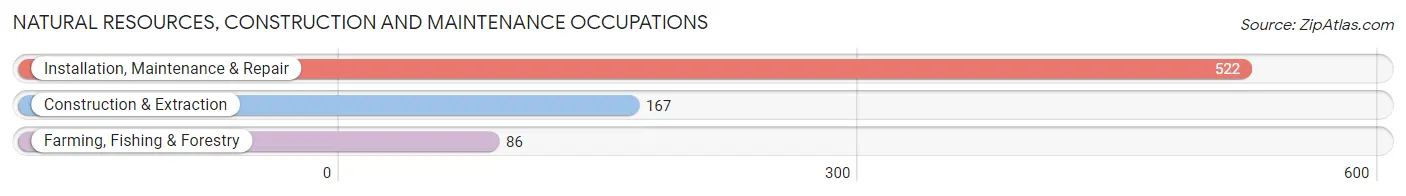
Natural Resources, Construction and Maintenance Occupations
The most common Natural Resources, Construction and Maintenance occupations in Oak Harbor are Installation, Maintenance & Repair (522 | 6.2%), Construction & Extraction (167 | 2.0%), and Farming, Fishing & Forestry (86 | 1.0%).
Natural Resources, Construction and Maintenance Occupations by Sex
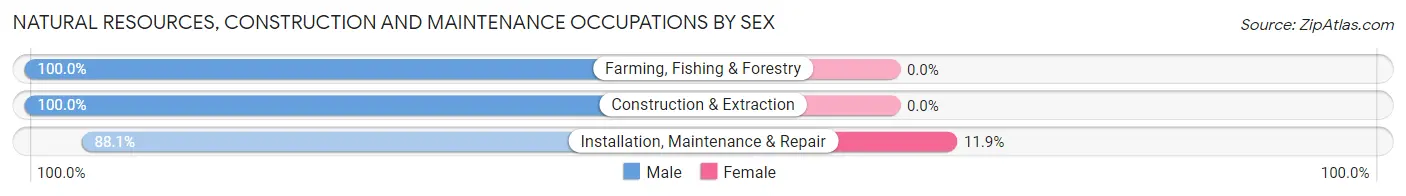
| Occupation | Male | Female |
| Farming, Fishing & Forestry | 86 (100.0%) | 0 (0.0%) |
| Construction & Extraction | 167 (100.0%) | 0 (0.0%) |
| Installation, Maintenance & Repair | 460 (88.1%) | 62 (11.9%) |
| Total (Category) | 713 (92.0%) | 62 (8.0%) |
| Total (Overall) | 3,704 (44.4%) | 4,647 (55.6%) |
Production, Transportation and Moving Occupations
The most common Production, Transportation and Moving occupations in Oak Harbor are Production (436 | 5.2%), Material Moving (376 | 4.5%), and Transportation (331 | 4.0%).
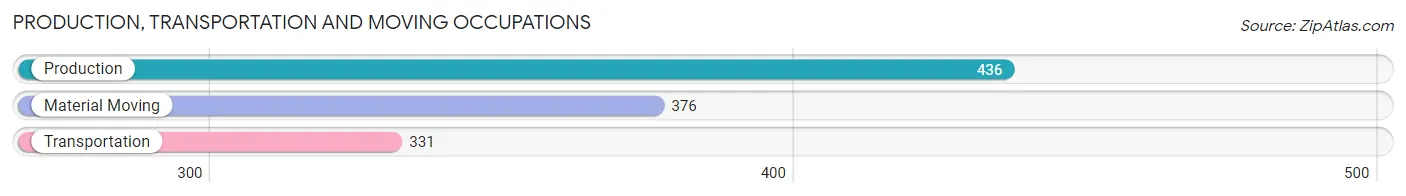
Production, Transportation and Moving Occupations by Sex
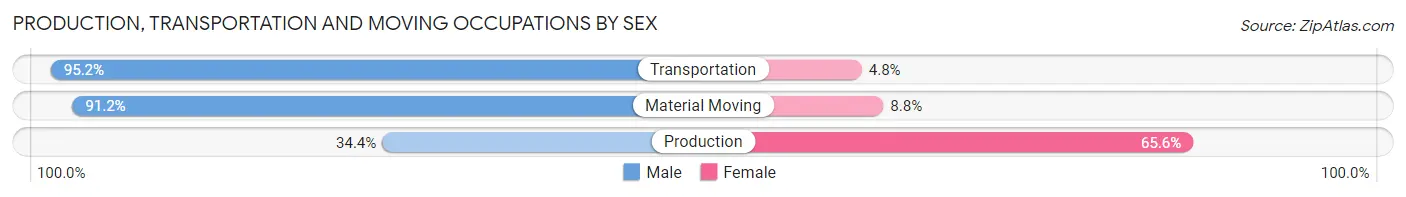
| Occupation | Male | Female |
| Production | 150 (34.4%) | 286 (65.6%) |
| Transportation | 315 (95.2%) | 16 (4.8%) |
| Material Moving | 343 (91.2%) | 33 (8.8%) |
| Total (Category) | 808 (70.7%) | 335 (29.3%) |
| Total (Overall) | 3,704 (44.4%) | 4,647 (55.6%) |
Employment Industries by Sex in Oak Harbor
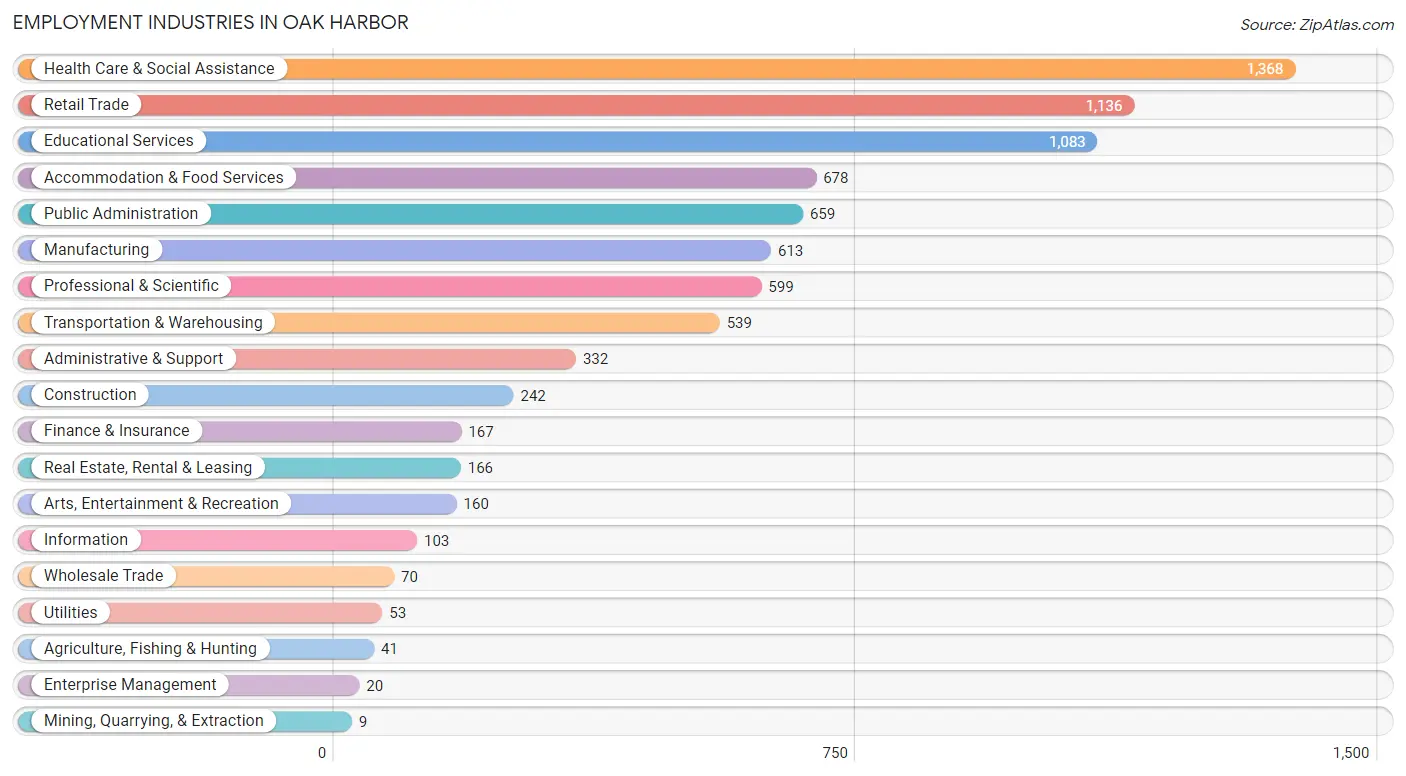
Employment Industries in Oak Harbor
The major employment industries in Oak Harbor include Health Care & Social Assistance (1,368 | 16.4%), Retail Trade (1,136 | 13.6%), Educational Services (1,083 | 13.0%), Accommodation & Food Services (678 | 8.1%), and Public Administration (659 | 7.9%).
Employment Industries by Sex in Oak Harbor
The Oak Harbor industries that see more men than women are Agriculture, Fishing & Hunting (100.0%), Mining, Quarrying, & Extraction (100.0%), and Public Administration (81.3%), whereas the industries that tend to have a higher number of women are Enterprise Management (100.0%), Finance & Insurance (90.4%), and Health Care & Social Assistance (81.6%).
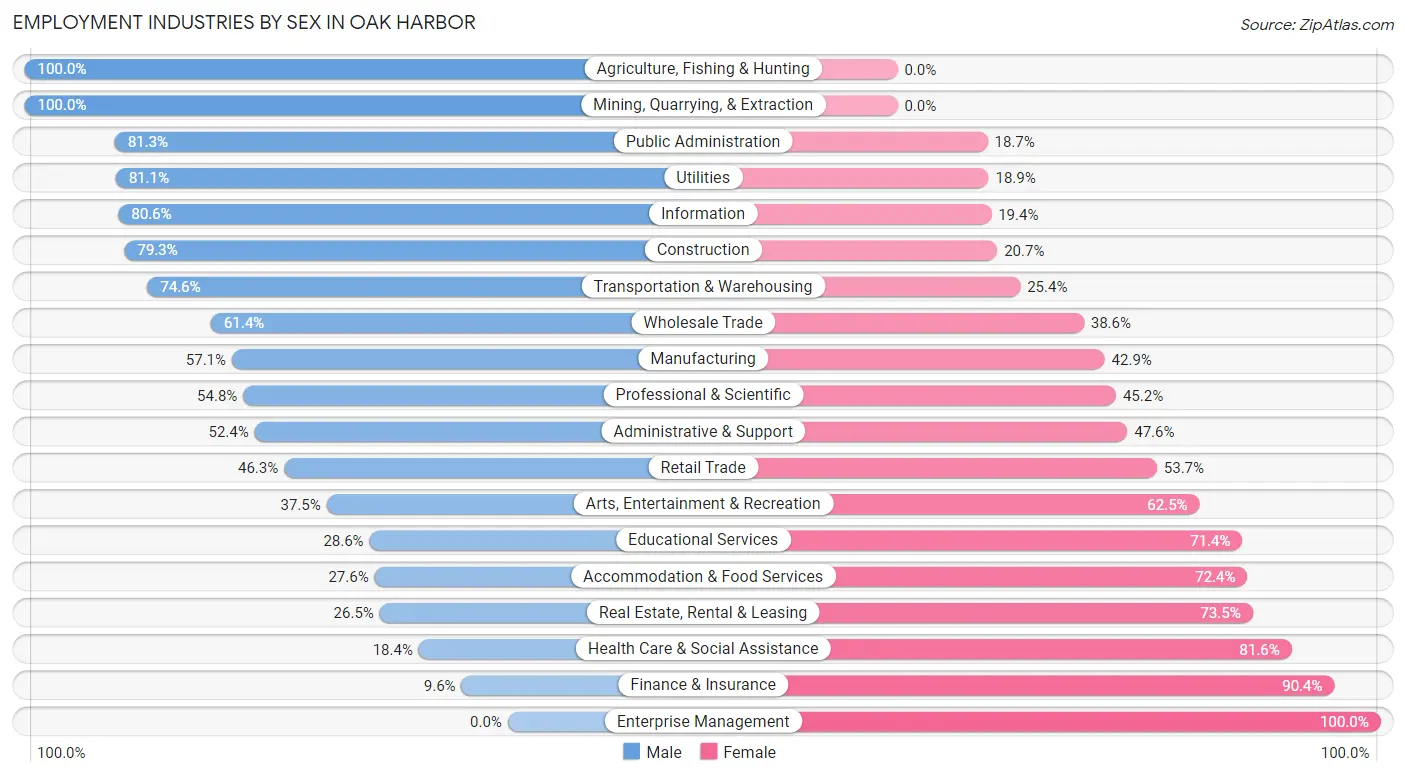
| Industry | Male | Female |
| Agriculture, Fishing & Hunting | 41 (100.0%) | 0 (0.0%) |
| Mining, Quarrying, & Extraction | 9 (100.0%) | 0 (0.0%) |
| Construction | 192 (79.3%) | 50 (20.7%) |
| Manufacturing | 350 (57.1%) | 263 (42.9%) |
| Wholesale Trade | 43 (61.4%) | 27 (38.6%) |
| Retail Trade | 526 (46.3%) | 610 (53.7%) |
| Transportation & Warehousing | 402 (74.6%) | 137 (25.4%) |
| Utilities | 43 (81.1%) | 10 (18.9%) |
| Information | 83 (80.6%) | 20 (19.4%) |
| Finance & Insurance | 16 (9.6%) | 151 (90.4%) |
| Real Estate, Rental & Leasing | 44 (26.5%) | 122 (73.5%) |
| Professional & Scientific | 328 (54.8%) | 271 (45.2%) |
| Enterprise Management | 0 (0.0%) | 20 (100.0%) |
| Administrative & Support | 174 (52.4%) | 158 (47.6%) |
| Educational Services | 310 (28.6%) | 773 (71.4%) |
| Health Care & Social Assistance | 252 (18.4%) | 1,116 (81.6%) |
| Arts, Entertainment & Recreation | 60 (37.5%) | 100 (62.5%) |
| Accommodation & Food Services | 187 (27.6%) | 491 (72.4%) |
| Public Administration | 536 (81.3%) | 123 (18.7%) |
| Total | 3,704 (44.4%) | 4,647 (55.6%) |
Education in Oak Harbor
School Enrollment in Oak Harbor
The most common levels of schooling among the 6,466 students in Oak Harbor are college / undergraduate (1,583 | 24.5%), middle school (1,382 | 21.4%), and elementary school (1,215 | 18.8%).
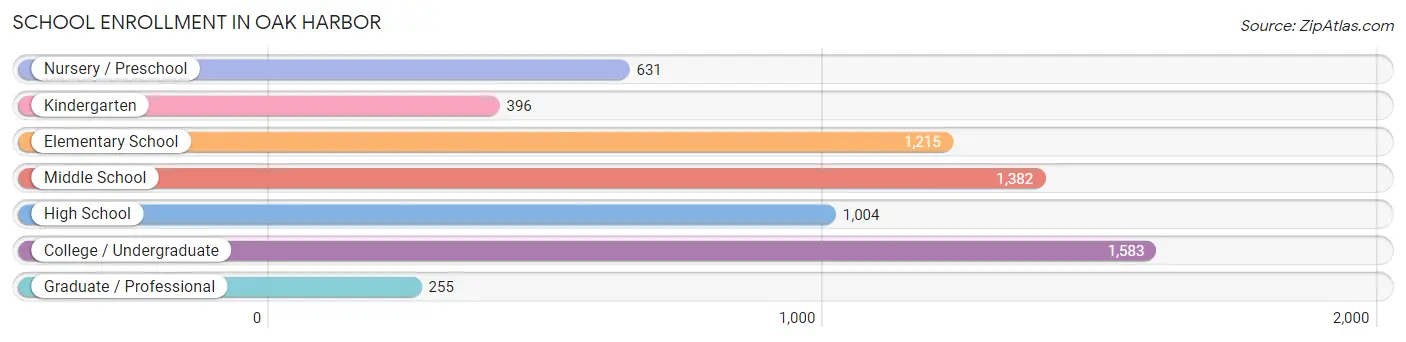
| School Level | # Students | % Students |
| Nursery / Preschool | 631 | 9.8% |
| Kindergarten | 396 | 6.1% |
| Elementary School | 1,215 | 18.8% |
| Middle School | 1,382 | 21.4% |
| High School | 1,004 | 15.5% |
| College / Undergraduate | 1,583 | 24.5% |
| Graduate / Professional | 255 | 3.9% |
| Total | 6,466 | 100.0% |
School Enrollment by Age by Funding Source in Oak Harbor
Out of a total of 6,466 students who are enrolled in schools in Oak Harbor, 912 (14.1%) attend a private institution, while the remaining 5,554 (85.9%) are enrolled in public schools. The age group of 3 to 4 year olds has the highest likelihood of being enrolled in private schools, with 280 (56.7% in the age bracket) enrolled. Conversely, the age group of 18 to 19 year olds has the lowest likelihood of being enrolled in a private school, with 212 (98.2% in the age bracket) attending a public institution.
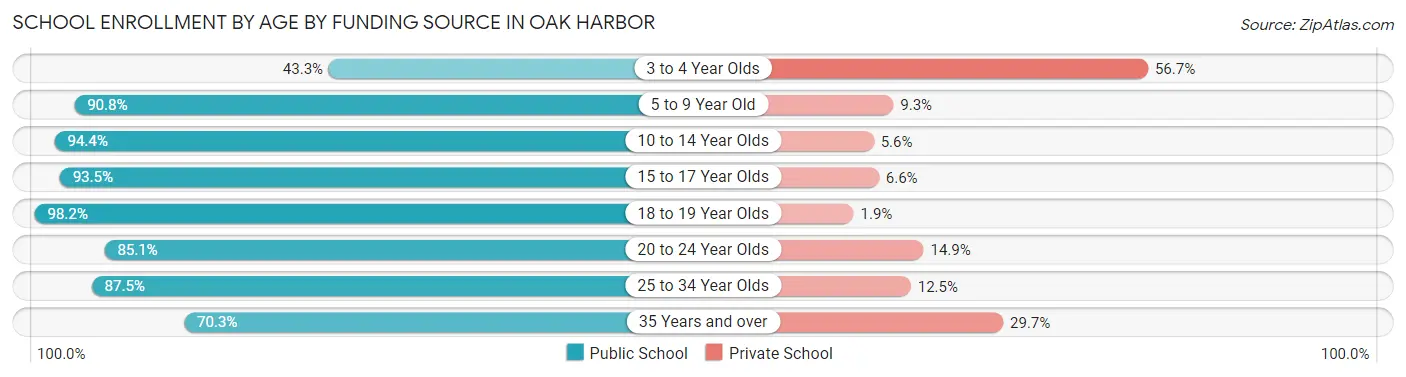
| Age Bracket | Public School | Private School |
| 3 to 4 Year Olds | 214 (43.3%) | 280 (56.7%) |
| 5 to 9 Year Old | 1,314 (90.7%) | 134 (9.2%) |
| 10 to 14 Year Olds | 1,808 (94.4%) | 107 (5.6%) |
| 15 to 17 Year Olds | 642 (93.4%) | 45 (6.6%) |
| 18 to 19 Year Olds | 212 (98.2%) | 4 (1.8%) |
| 20 to 24 Year Olds | 246 (85.1%) | 43 (14.9%) |
| 25 to 34 Year Olds | 630 (87.5%) | 90 (12.5%) |
| 35 Years and over | 490 (70.3%) | 207 (29.7%) |
| Total | 5,554 (85.9%) | 912 (14.1%) |
Educational Attainment by Field of Study in Oak Harbor
Business (695 | 15.0%), arts & humanities (666 | 14.4%), education (499 | 10.8%), science & technology (458 | 9.9%), and bio, nature & agricultural (449 | 9.7%) are the most common fields of study among 4,631 individuals in Oak Harbor who have obtained a bachelor's degree or higher.
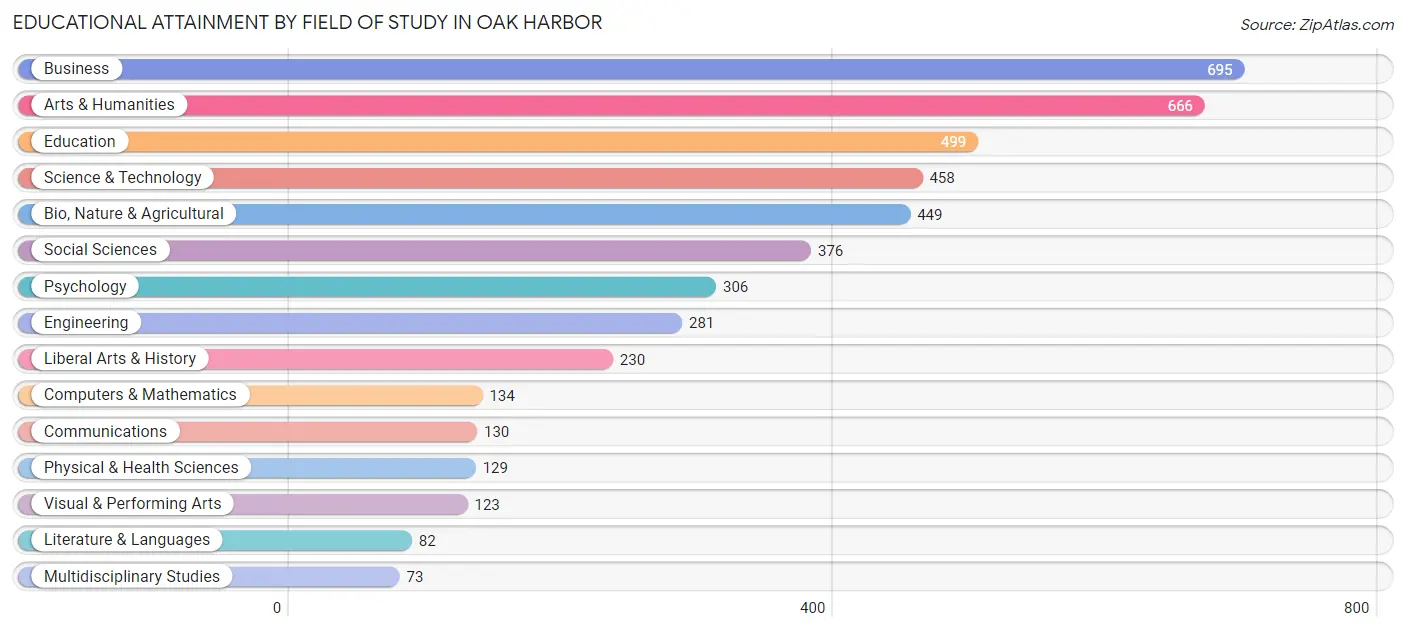
| Field of Study | # Graduates | % Graduates |
| Computers & Mathematics | 134 | 2.9% |
| Bio, Nature & Agricultural | 449 | 9.7% |
| Physical & Health Sciences | 129 | 2.8% |
| Psychology | 306 | 6.6% |
| Social Sciences | 376 | 8.1% |
| Engineering | 281 | 6.1% |
| Multidisciplinary Studies | 73 | 1.6% |
| Science & Technology | 458 | 9.9% |
| Business | 695 | 15.0% |
| Education | 499 | 10.8% |
| Literature & Languages | 82 | 1.8% |
| Liberal Arts & History | 230 | 5.0% |
| Visual & Performing Arts | 123 | 2.7% |
| Communications | 130 | 2.8% |
| Arts & Humanities | 666 | 14.4% |
| Total | 4,631 | 100.0% |
Transportation & Commute in Oak Harbor
Vehicle Availability by Sex in Oak Harbor
The most prevalent vehicle ownership categories in Oak Harbor are males with 2 vehicles (3,201, accounting for 51.2%) and females with 2 vehicles (2,404, making up 62.2%).
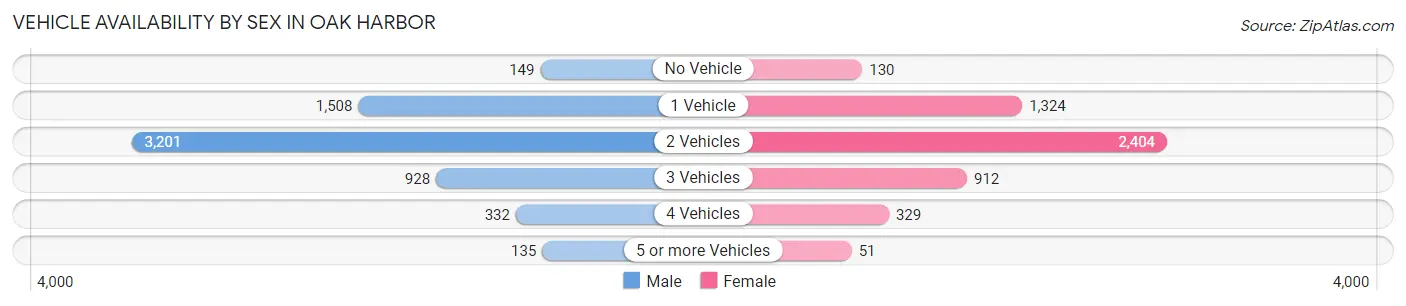
| Vehicles Available | Male | Female |
| No Vehicle | 149 (2.4%) | 130 (2.5%) |
| 1 Vehicle | 1,508 (24.1%) | 1,324 (25.7%) |
| 2 Vehicles | 3,201 (51.2%) | 2,404 (46.7%) |
| 3 Vehicles | 928 (14.8%) | 912 (17.7%) |
| 4 Vehicles | 332 (5.3%) | 329 (6.4%) |
| 5 or more Vehicles | 135 (2.2%) | 51 (1.0%) |
| Total | 6,253 (100.0%) | 5,150 (100.0%) |
Commute Time in Oak Harbor
The most frequently occuring commute durations in Oak Harbor are 10 to 14 minutes (2,779 commuters, 25.6%), 15 to 19 minutes (2,547 commuters, 23.5%), and 5 to 9 minutes (2,033 commuters, 18.8%).
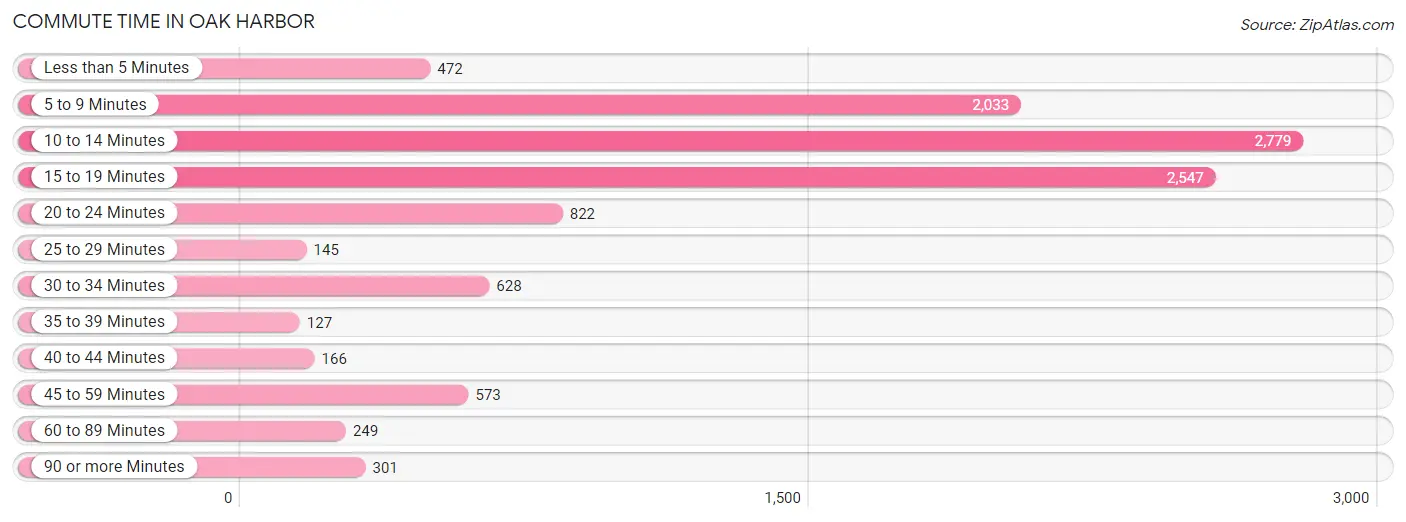
| Commute Time | # Commuters | % Commuters |
| Less than 5 Minutes | 472 | 4.3% |
| 5 to 9 Minutes | 2,033 | 18.8% |
| 10 to 14 Minutes | 2,779 | 25.6% |
| 15 to 19 Minutes | 2,547 | 23.5% |
| 20 to 24 Minutes | 822 | 7.6% |
| 25 to 29 Minutes | 145 | 1.3% |
| 30 to 34 Minutes | 628 | 5.8% |
| 35 to 39 Minutes | 127 | 1.2% |
| 40 to 44 Minutes | 166 | 1.5% |
| 45 to 59 Minutes | 573 | 5.3% |
| 60 to 89 Minutes | 249 | 2.3% |
| 90 or more Minutes | 301 | 2.8% |
Commute Time by Sex in Oak Harbor
The most common commute times in Oak Harbor are 10 to 14 minutes (1,782 commuters, 29.4%) for males and 5 to 9 minutes (1,096 commuters, 22.9%) for females.
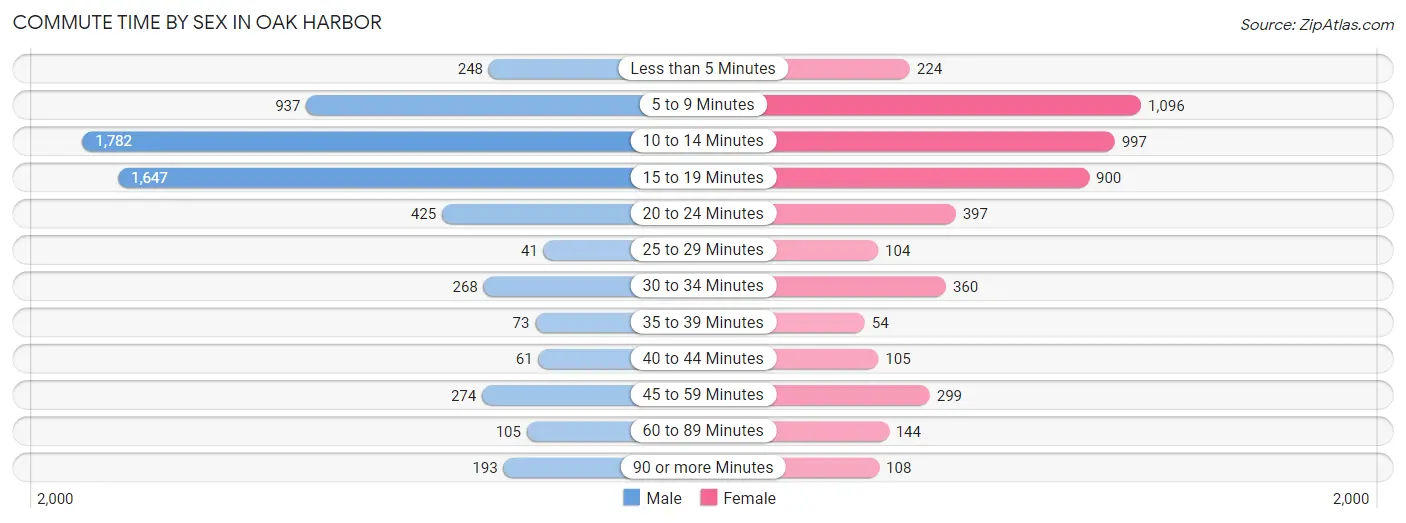
| Commute Time | Male | Female |
| Less than 5 Minutes | 248 (4.1%) | 224 (4.7%) |
| 5 to 9 Minutes | 937 (15.5%) | 1,096 (22.9%) |
| 10 to 14 Minutes | 1,782 (29.4%) | 997 (20.8%) |
| 15 to 19 Minutes | 1,647 (27.2%) | 900 (18.8%) |
| 20 to 24 Minutes | 425 (7.0%) | 397 (8.3%) |
| 25 to 29 Minutes | 41 (0.7%) | 104 (2.2%) |
| 30 to 34 Minutes | 268 (4.4%) | 360 (7.5%) |
| 35 to 39 Minutes | 73 (1.2%) | 54 (1.1%) |
| 40 to 44 Minutes | 61 (1.0%) | 105 (2.2%) |
| 45 to 59 Minutes | 274 (4.5%) | 299 (6.2%) |
| 60 to 89 Minutes | 105 (1.7%) | 144 (3.0%) |
| 90 or more Minutes | 193 (3.2%) | 108 (2.3%) |
Time of Departure to Work by Sex in Oak Harbor
The most frequent times of departure to work in Oak Harbor are 7:00 AM to 7:29 AM (863, 14.3%) for males and 7:00 AM to 7:29 AM (765, 16.0%) for females.
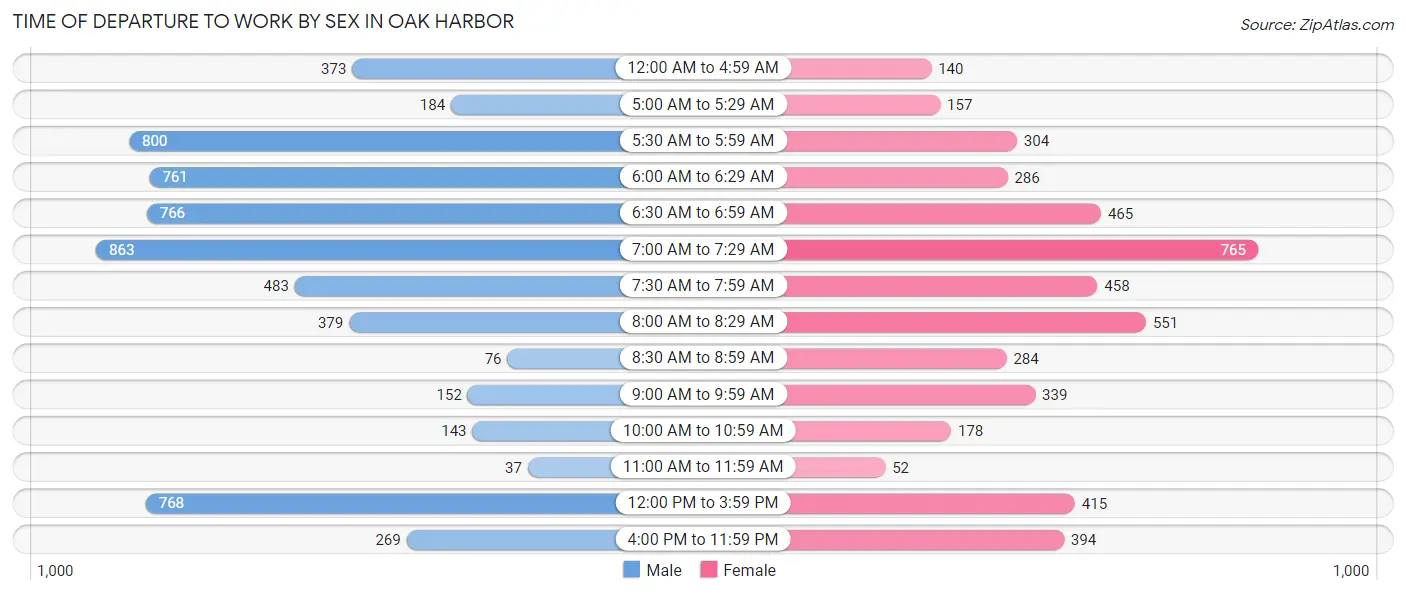
| Time of Departure | Male | Female |
| 12:00 AM to 4:59 AM | 373 (6.2%) | 140 (2.9%) |
| 5:00 AM to 5:29 AM | 184 (3.0%) | 157 (3.3%) |
| 5:30 AM to 5:59 AM | 800 (13.2%) | 304 (6.4%) |
| 6:00 AM to 6:29 AM | 761 (12.6%) | 286 (6.0%) |
| 6:30 AM to 6:59 AM | 766 (12.7%) | 465 (9.7%) |
| 7:00 AM to 7:29 AM | 863 (14.3%) | 765 (16.0%) |
| 7:30 AM to 7:59 AM | 483 (8.0%) | 458 (9.6%) |
| 8:00 AM to 8:29 AM | 379 (6.3%) | 551 (11.5%) |
| 8:30 AM to 8:59 AM | 76 (1.3%) | 284 (5.9%) |
| 9:00 AM to 9:59 AM | 152 (2.5%) | 339 (7.1%) |
| 10:00 AM to 10:59 AM | 143 (2.4%) | 178 (3.7%) |
| 11:00 AM to 11:59 AM | 37 (0.6%) | 52 (1.1%) |
| 12:00 PM to 3:59 PM | 768 (12.7%) | 415 (8.7%) |
| 4:00 PM to 11:59 PM | 269 (4.4%) | 394 (8.2%) |
| Total | 6,054 (100.0%) | 4,788 (100.0%) |
Housing Occupancy in Oak Harbor
Occupancy by Ownership in Oak Harbor
Of the total 9,852 dwellings in Oak Harbor, owner-occupied units account for 4,658 (47.3%), while renter-occupied units make up 5,194 (52.7%).
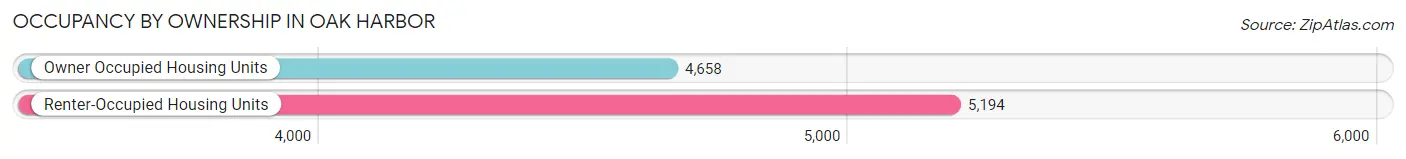
| Occupancy | # Housing Units | % Housing Units |
| Owner Occupied Housing Units | 4,658 | 47.3% |
| Renter-Occupied Housing Units | 5,194 | 52.7% |
| Total Occupied Housing Units | 9,852 | 100.0% |
Occupancy by Household Size in Oak Harbor
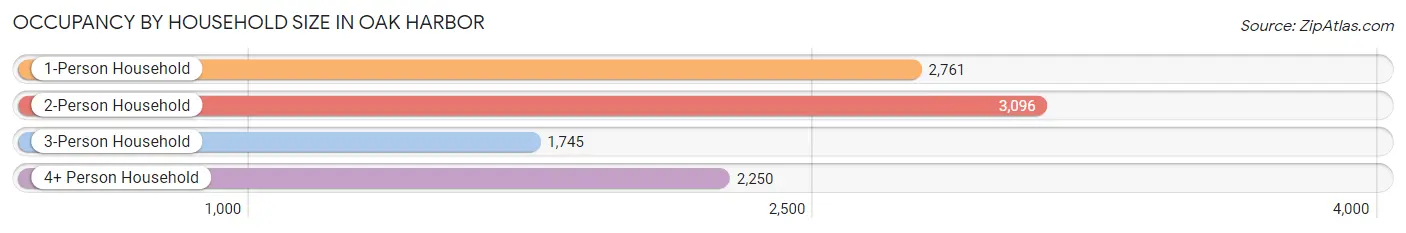
| Household Size | # Housing Units | % Housing Units |
| 1-Person Household | 2,761 | 28.0% |
| 2-Person Household | 3,096 | 31.4% |
| 3-Person Household | 1,745 | 17.7% |
| 4+ Person Household | 2,250 | 22.8% |
| Total Housing Units | 9,852 | 100.0% |
Occupancy by Ownership by Household Size in Oak Harbor
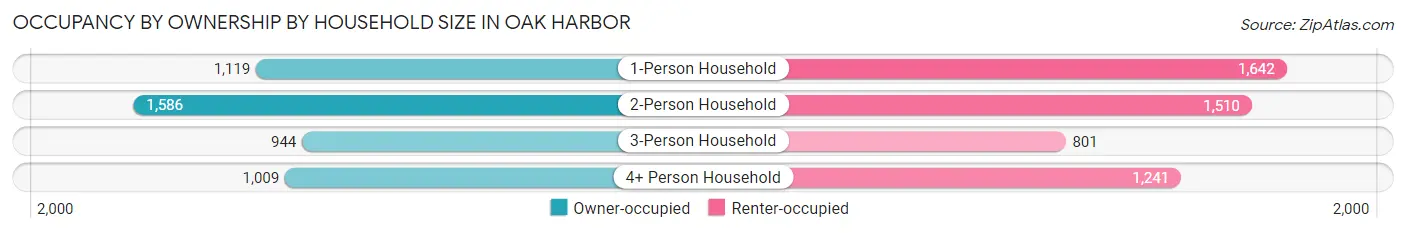
| Household Size | Owner-occupied | Renter-occupied |
| 1-Person Household | 1,119 (40.5%) | 1,642 (59.5%) |
| 2-Person Household | 1,586 (51.2%) | 1,510 (48.8%) |
| 3-Person Household | 944 (54.1%) | 801 (45.9%) |
| 4+ Person Household | 1,009 (44.8%) | 1,241 (55.2%) |
| Total Housing Units | 4,658 (47.3%) | 5,194 (52.7%) |
Occupancy by Educational Attainment in Oak Harbor
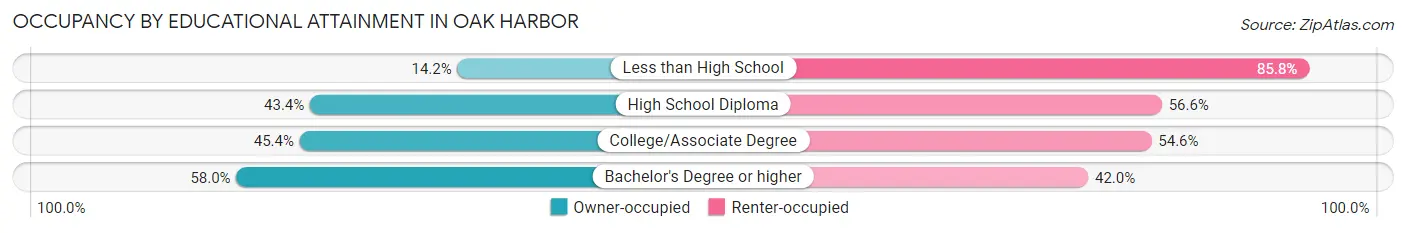
| Household Size | Owner-occupied | Renter-occupied |
| Less than High School | 47 (14.2%) | 285 (85.8%) |
| High School Diploma | 938 (43.4%) | 1,224 (56.6%) |
| College/Associate Degree | 2,150 (45.4%) | 2,582 (54.6%) |
| Bachelor's Degree or higher | 1,523 (58.0%) | 1,103 (42.0%) |
Occupancy by Age of Householder in Oak Harbor
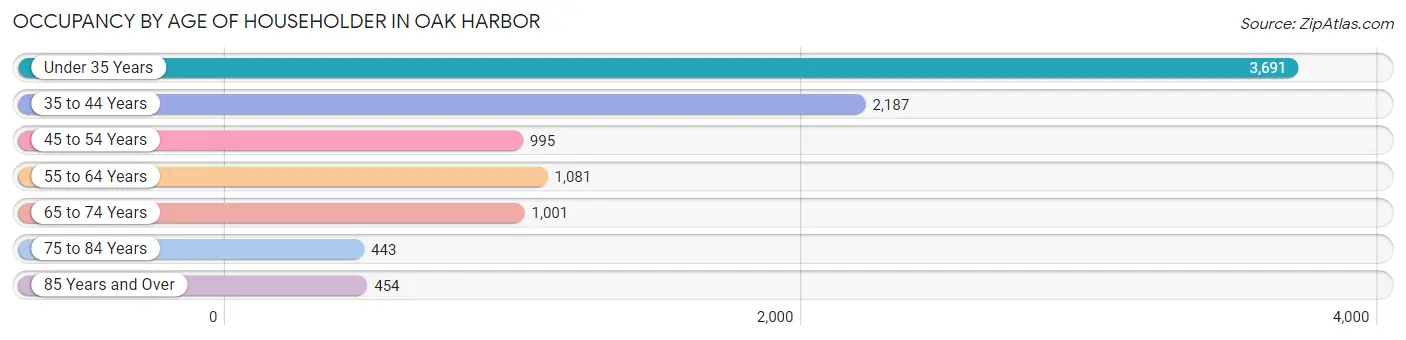
| Age Bracket | # Households | % Households |
| Under 35 Years | 3,691 | 37.5% |
| 35 to 44 Years | 2,187 | 22.2% |
| 45 to 54 Years | 995 | 10.1% |
| 55 to 64 Years | 1,081 | 11.0% |
| 65 to 74 Years | 1,001 | 10.2% |
| 75 to 84 Years | 443 | 4.5% |
| 85 Years and Over | 454 | 4.6% |
| Total | 9,852 | 100.0% |
Housing Finances in Oak Harbor
Median Income by Occupancy in Oak Harbor
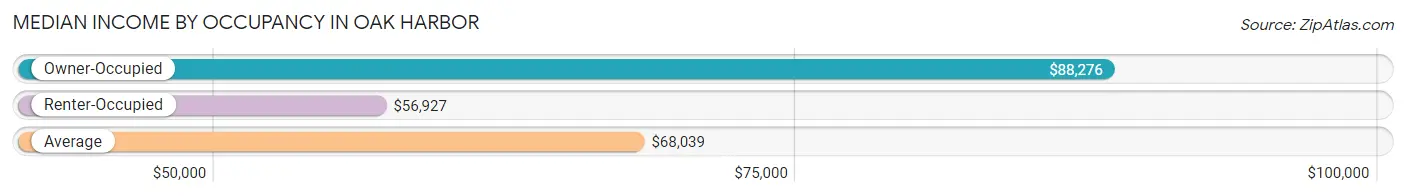
| Occupancy Type | # Households | Median Income |
| Owner-Occupied | 4,658 (47.3%) | $88,276 |
| Renter-Occupied | 5,194 (52.7%) | $56,927 |
| Average | 9,852 (100.0%) | $68,039 |
Occupancy by Householder Income Bracket in Oak Harbor
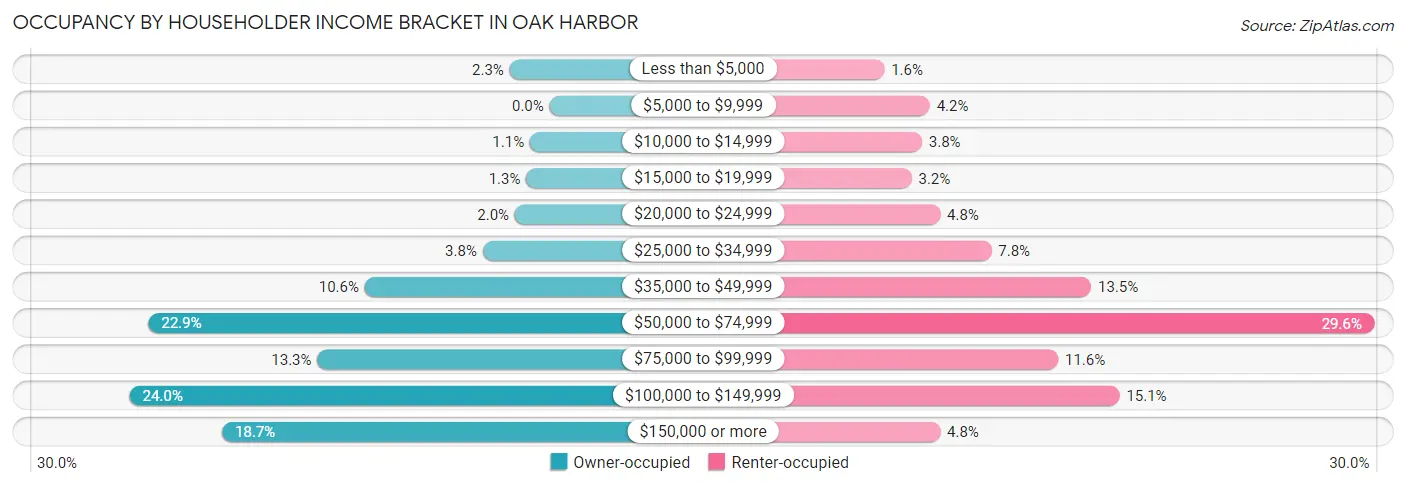
| Income Bracket | Owner-occupied | Renter-occupied |
| Less than $5,000 | 106 (2.3%) | 85 (1.6%) |
| $5,000 to $9,999 | 0 (0.0%) | 220 (4.2%) |
| $10,000 to $14,999 | 52 (1.1%) | 197 (3.8%) |
| $15,000 to $19,999 | 62 (1.3%) | 166 (3.2%) |
| $20,000 to $24,999 | 92 (2.0%) | 251 (4.8%) |
| $25,000 to $34,999 | 178 (3.8%) | 403 (7.8%) |
| $35,000 to $49,999 | 492 (10.6%) | 699 (13.5%) |
| $50,000 to $74,999 | 1,068 (22.9%) | 1,538 (29.6%) |
| $75,000 to $99,999 | 618 (13.3%) | 601 (11.6%) |
| $100,000 to $149,999 | 1,118 (24.0%) | 783 (15.1%) |
| $150,000 or more | 872 (18.7%) | 251 (4.8%) |
| Total | 4,658 (100.0%) | 5,194 (100.0%) |
Monthly Housing Cost Tiers in Oak Harbor
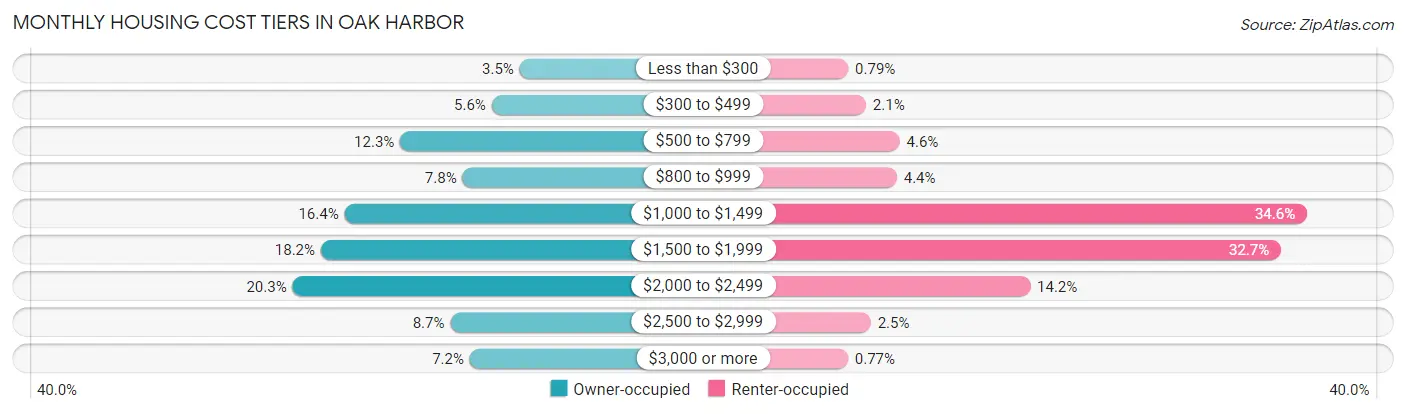
| Monthly Cost | Owner-occupied | Renter-occupied |
| Less than $300 | 165 (3.5%) | 41 (0.8%) |
| $300 to $499 | 261 (5.6%) | 109 (2.1%) |
| $500 to $799 | 575 (12.3%) | 238 (4.6%) |
| $800 to $999 | 361 (7.7%) | 227 (4.4%) |
| $1,000 to $1,499 | 766 (16.4%) | 1,796 (34.6%) |
| $1,500 to $1,999 | 847 (18.2%) | 1,697 (32.7%) |
| $2,000 to $2,499 | 944 (20.3%) | 737 (14.2%) |
| $2,500 to $2,999 | 403 (8.6%) | 127 (2.5%) |
| $3,000 or more | 336 (7.2%) | 40 (0.8%) |
| Total | 4,658 (100.0%) | 5,194 (100.0%) |
Physical Housing Characteristics in Oak Harbor
Housing Structures in Oak Harbor
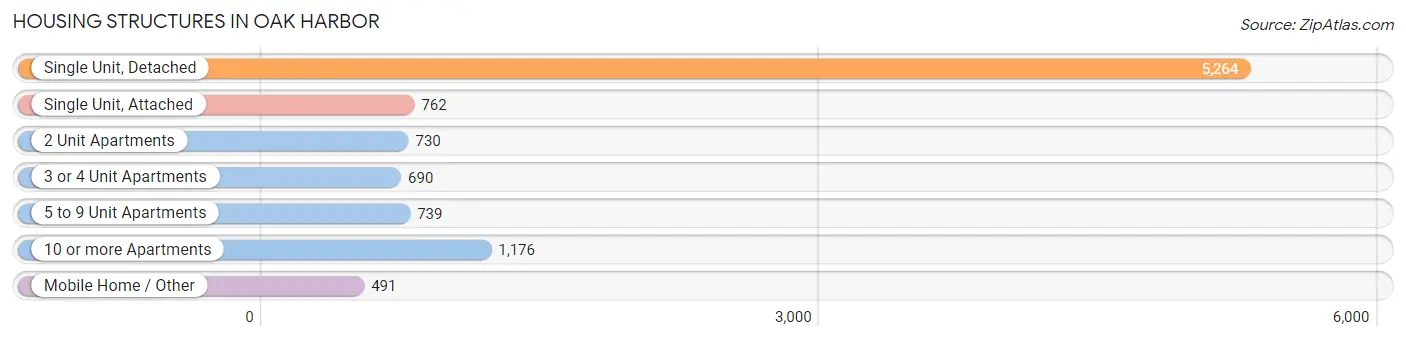
| Structure Type | # Housing Units | % Housing Units |
| Single Unit, Detached | 5,264 | 53.4% |
| Single Unit, Attached | 762 | 7.7% |
| 2 Unit Apartments | 730 | 7.4% |
| 3 or 4 Unit Apartments | 690 | 7.0% |
| 5 to 9 Unit Apartments | 739 | 7.5% |
| 10 or more Apartments | 1,176 | 11.9% |
| Mobile Home / Other | 491 | 5.0% |
| Total | 9,852 | 100.0% |
Housing Structures by Occupancy in Oak Harbor
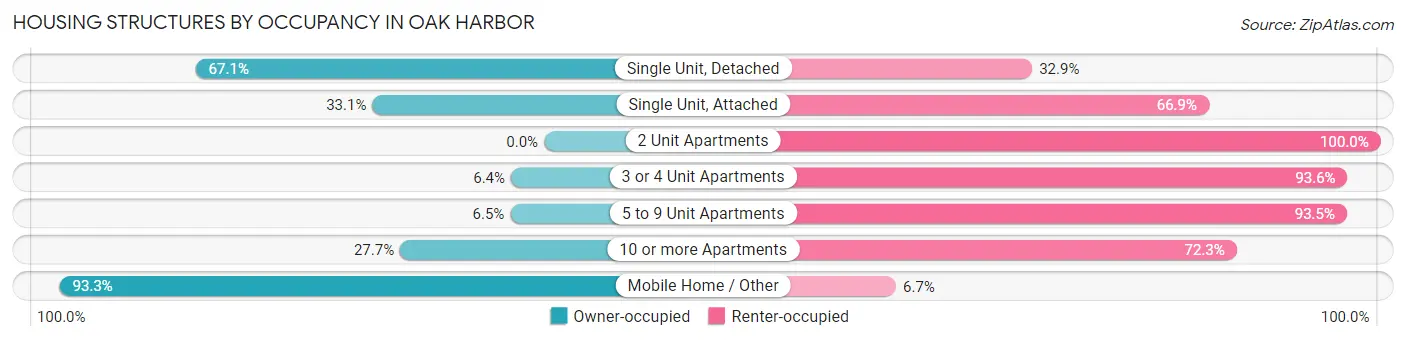
| Structure Type | Owner-occupied | Renter-occupied |
| Single Unit, Detached | 3,530 (67.1%) | 1,734 (32.9%) |
| Single Unit, Attached | 252 (33.1%) | 510 (66.9%) |
| 2 Unit Apartments | 0 (0.0%) | 730 (100.0%) |
| 3 or 4 Unit Apartments | 44 (6.4%) | 646 (93.6%) |
| 5 to 9 Unit Apartments | 48 (6.5%) | 691 (93.5%) |
| 10 or more Apartments | 326 (27.7%) | 850 (72.3%) |
| Mobile Home / Other | 458 (93.3%) | 33 (6.7%) |
| Total | 4,658 (47.3%) | 5,194 (52.7%) |
Housing Structures by Number of Rooms in Oak Harbor
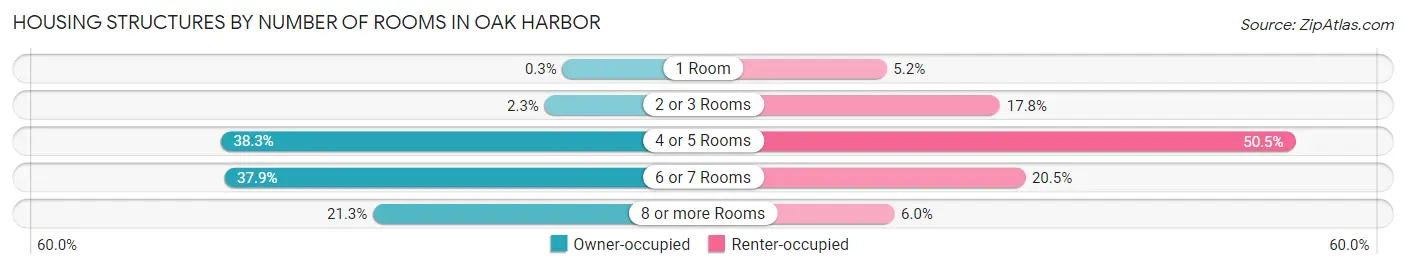
| Number of Rooms | Owner-occupied | Renter-occupied |
| 1 Room | 14 (0.3%) | 268 (5.2%) |
| 2 or 3 Rooms | 106 (2.3%) | 922 (17.7%) |
| 4 or 5 Rooms | 1,782 (38.3%) | 2,625 (50.5%) |
| 6 or 7 Rooms | 1,763 (37.9%) | 1,067 (20.5%) |
| 8 or more Rooms | 993 (21.3%) | 312 (6.0%) |
| Total | 4,658 (100.0%) | 5,194 (100.0%) |
Housing Structure by Heating Type in Oak Harbor
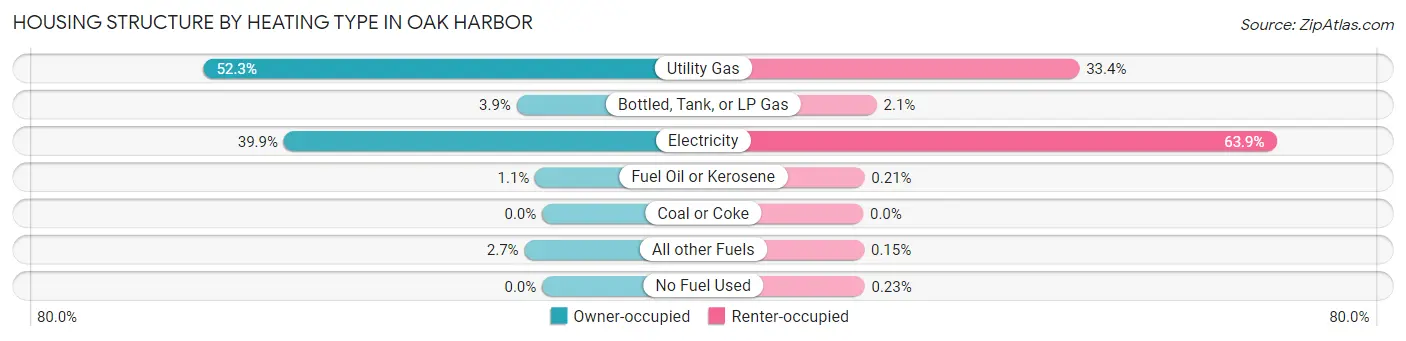
| Heating Type | Owner-occupied | Renter-occupied |
| Utility Gas | 2,438 (52.3%) | 1,736 (33.4%) |
| Bottled, Tank, or LP Gas | 183 (3.9%) | 109 (2.1%) |
| Electricity | 1,860 (39.9%) | 3,318 (63.9%) |
| Fuel Oil or Kerosene | 50 (1.1%) | 11 (0.2%) |
| Coal or Coke | 0 (0.0%) | 0 (0.0%) |
| All other Fuels | 127 (2.7%) | 8 (0.2%) |
| No Fuel Used | 0 (0.0%) | 12 (0.2%) |
| Total | 4,658 (100.0%) | 5,194 (100.0%) |
Household Vehicle Usage in Oak Harbor
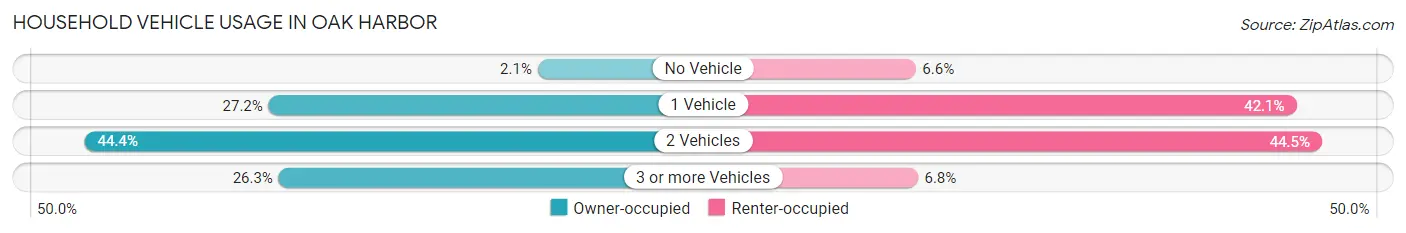
| Vehicles per Household | Owner-occupied | Renter-occupied |
| No Vehicle | 98 (2.1%) | 342 (6.6%) |
| 1 Vehicle | 1,268 (27.2%) | 2,188 (42.1%) |
| 2 Vehicles | 2,068 (44.4%) | 2,312 (44.5%) |
| 3 or more Vehicles | 1,224 (26.3%) | 352 (6.8%) |
| Total | 4,658 (100.0%) | 5,194 (100.0%) |
Real Estate & Mortgages in Oak Harbor
Real Estate and Mortgage Overview in Oak Harbor
| Characteristic | Without Mortgage | With Mortgage |
| Housing Units | 1,384 | 3,274 |
| Median Property Value | $360,400 | $387,900 |
| Median Household Income | $65,658 | $636 |
| Monthly Housing Costs | $704 | $336 |
| Real Estate Taxes | $2,862 | $56 |
Property Value by Mortgage Status in Oak Harbor
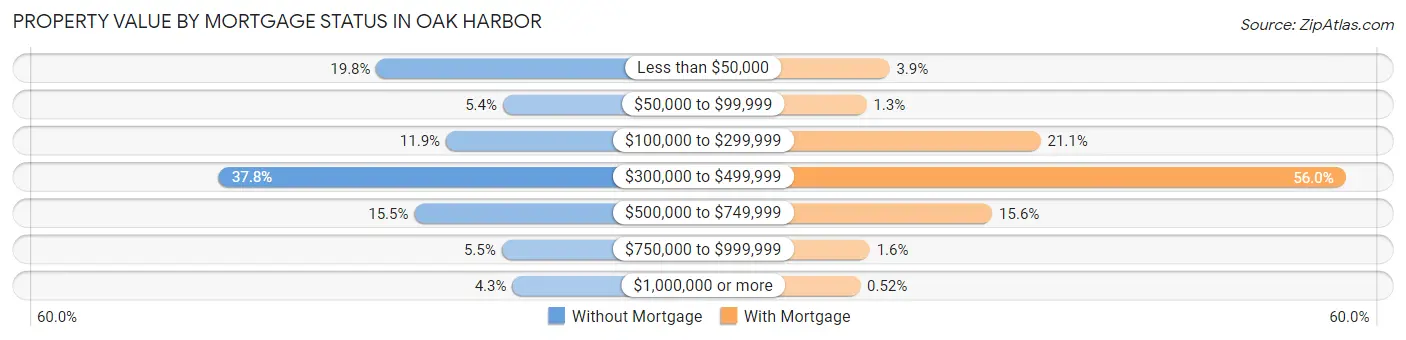
| Property Value | Without Mortgage | With Mortgage |
| Less than $50,000 | 274 (19.8%) | 127 (3.9%) |
| $50,000 to $99,999 | 74 (5.3%) | 41 (1.3%) |
| $100,000 to $299,999 | 164 (11.8%) | 692 (21.1%) |
| $300,000 to $499,999 | 523 (37.8%) | 1,833 (56.0%) |
| $500,000 to $749,999 | 214 (15.5%) | 511 (15.6%) |
| $750,000 to $999,999 | 76 (5.5%) | 53 (1.6%) |
| $1,000,000 or more | 59 (4.3%) | 17 (0.5%) |
| Total | 1,384 (100.0%) | 3,274 (100.0%) |
Household Income by Mortgage Status in Oak Harbor
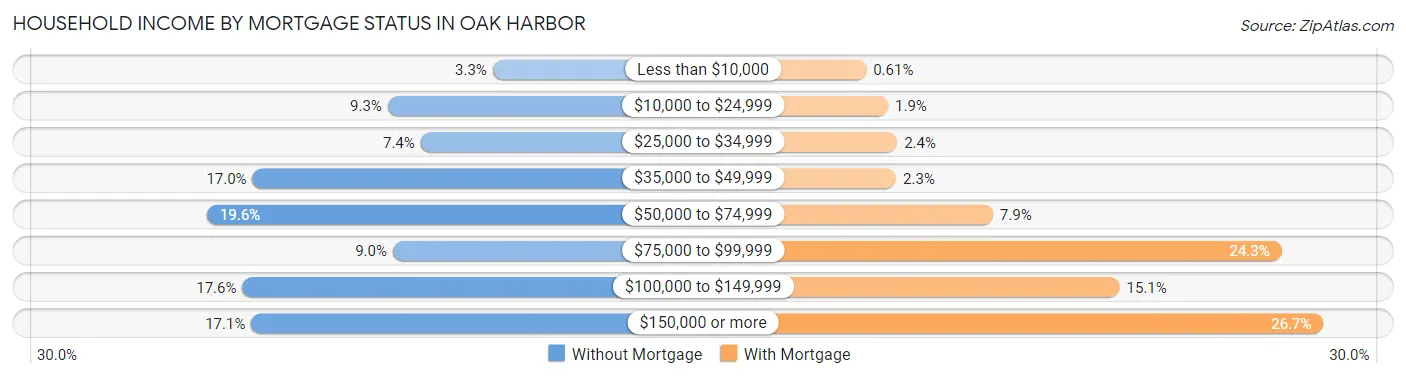
| Household Income | Without Mortgage | With Mortgage |
| Less than $10,000 | 45 (3.3%) | 20 (0.6%) |
| $10,000 to $24,999 | 128 (9.2%) | 61 (1.9%) |
| $25,000 to $34,999 | 102 (7.4%) | 78 (2.4%) |
| $35,000 to $49,999 | 235 (17.0%) | 76 (2.3%) |
| $50,000 to $74,999 | 271 (19.6%) | 257 (7.9%) |
| $75,000 to $99,999 | 124 (9.0%) | 797 (24.3%) |
| $100,000 to $149,999 | 243 (17.6%) | 494 (15.1%) |
| $150,000 or more | 236 (17.1%) | 875 (26.7%) |
| Total | 1,384 (100.0%) | 3,274 (100.0%) |
Property Value to Household Income Ratio in Oak Harbor

| Value-to-Income Ratio | Without Mortgage | With Mortgage |
| Less than 2.0x | 432 (31.2%) | 94,450 (2,884.9%) |
| 2.0x to 2.9x | 190 (13.7%) | 337 (10.3%) |
| 3.0x to 3.9x | 177 (12.8%) | 712 (21.7%) |
| 4.0x or more | 585 (42.3%) | 675 (20.6%) |
| Total | 1,384 (100.0%) | 3,274 (100.0%) |
Real Estate Taxes by Mortgage Status in Oak Harbor
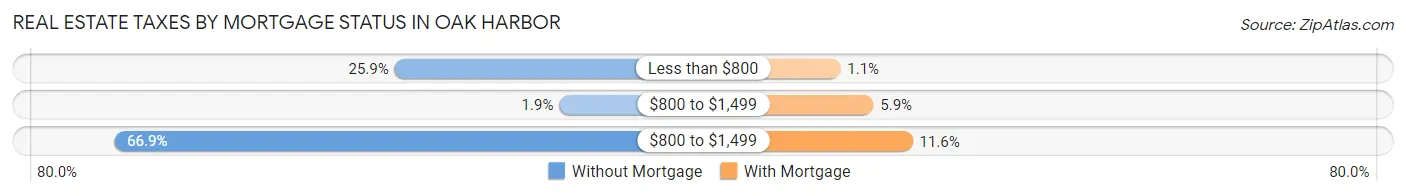
| Property Taxes | Without Mortgage | With Mortgage |
| Less than $800 | 359 (25.9%) | 35 (1.1%) |
| $800 to $1,499 | 26 (1.9%) | 193 (5.9%) |
| $800 to $1,499 | 926 (66.9%) | 380 (11.6%) |
| Total | 1,384 (100.0%) | 3,274 (100.0%) |
Health & Disability in Oak Harbor
Health Insurance Coverage by Age in Oak Harbor
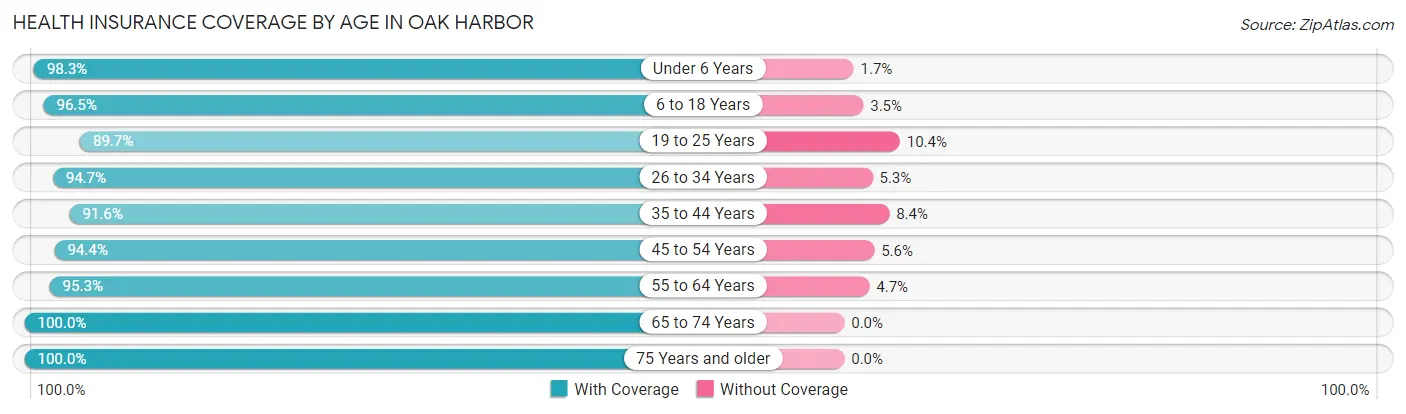
| Age Bracket | With Coverage | Without Coverage |
| Under 6 Years | 2,928 (98.3%) | 52 (1.7%) |
| 6 to 18 Years | 3,738 (96.5%) | 137 (3.5%) |
| 19 to 25 Years | 1,542 (89.6%) | 178 (10.3%) |
| 26 to 34 Years | 2,662 (94.7%) | 148 (5.3%) |
| 35 to 44 Years | 2,735 (91.6%) | 250 (8.4%) |
| 45 to 54 Years | 1,592 (94.4%) | 94 (5.6%) |
| 55 to 64 Years | 1,792 (95.3%) | 88 (4.7%) |
| 65 to 74 Years | 1,711 (100.0%) | 0 (0.0%) |
| 75 Years and older | 1,234 (100.0%) | 0 (0.0%) |
| Total | 19,934 (95.5%) | 947 (4.5%) |
Health Insurance Coverage by Citizenship Status in Oak Harbor
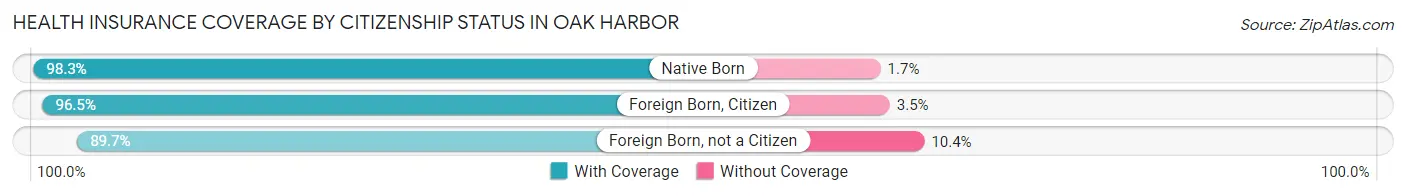
| Citizenship Status | With Coverage | Without Coverage |
| Native Born | 2,928 (98.3%) | 52 (1.7%) |
| Foreign Born, Citizen | 3,738 (96.5%) | 137 (3.5%) |
| Foreign Born, not a Citizen | 1,542 (89.6%) | 178 (10.3%) |
Health Insurance Coverage by Household Income in Oak Harbor
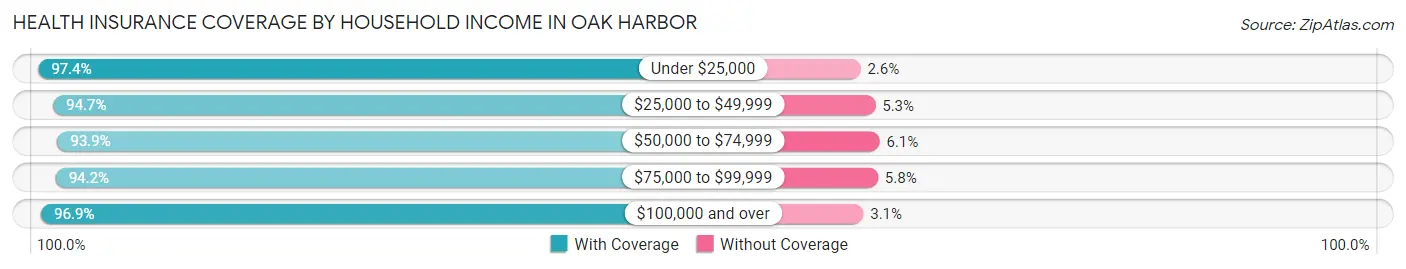
| Household Income | With Coverage | Without Coverage |
| Under $25,000 | 1,944 (97.4%) | 51 (2.6%) |
| $25,000 to $49,999 | 2,785 (94.7%) | 157 (5.3%) |
| $50,000 to $74,999 | 4,930 (93.9%) | 322 (6.1%) |
| $75,000 to $99,999 | 3,002 (94.2%) | 186 (5.8%) |
| $100,000 and over | 7,250 (96.9%) | 231 (3.1%) |
Public vs Private Health Insurance Coverage by Age in Oak Harbor
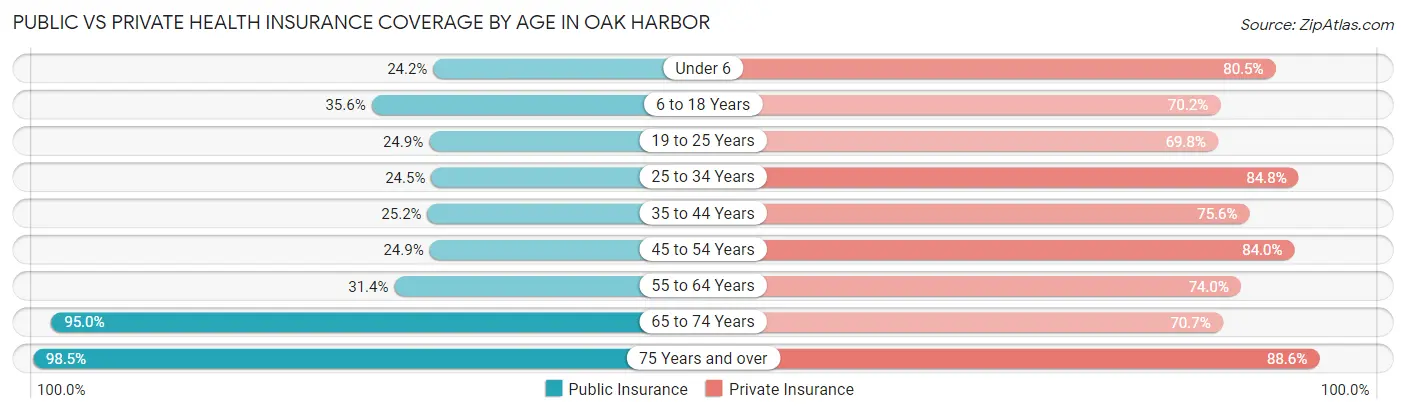
| Age Bracket | Public Insurance | Private Insurance |
| Under 6 | 720 (24.2%) | 2,398 (80.5%) |
| 6 to 18 Years | 1,380 (35.6%) | 2,721 (70.2%) |
| 19 to 25 Years | 429 (24.9%) | 1,200 (69.8%) |
| 25 to 34 Years | 689 (24.5%) | 2,382 (84.8%) |
| 35 to 44 Years | 753 (25.2%) | 2,258 (75.6%) |
| 45 to 54 Years | 419 (24.8%) | 1,416 (84.0%) |
| 55 to 64 Years | 590 (31.4%) | 1,392 (74.0%) |
| 65 to 74 Years | 1,626 (95.0%) | 1,209 (70.7%) |
| 75 Years and over | 1,215 (98.5%) | 1,093 (88.6%) |
| Total | 7,821 (37.5%) | 16,069 (77.0%) |
Disability Status by Sex by Age in Oak Harbor
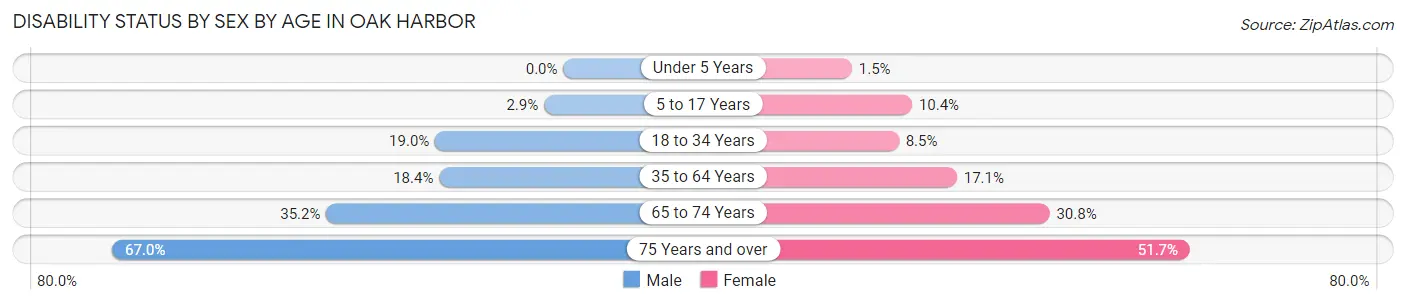
| Age Bracket | Male | Female |
| Under 5 Years | 0 (0.0%) | 18 (1.5%) |
| 5 to 17 Years | 61 (2.9%) | 215 (10.4%) |
| 18 to 34 Years | 340 (19.0%) | 246 (8.5%) |
| 35 to 64 Years | 508 (18.4%) | 648 (17.1%) |
| 65 to 74 Years | 277 (35.2%) | 285 (30.8%) |
| 75 Years and over | 329 (67.0%) | 384 (51.7%) |
Disability Class by Sex by Age in Oak Harbor
Disability Class: Hearing Difficulty
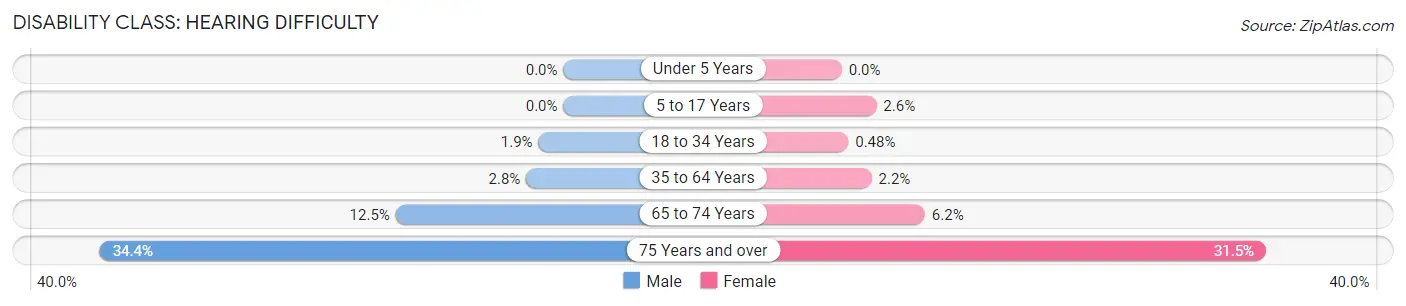
| Age Bracket | Male | Female |
| Under 5 Years | 0 (0.0%) | 0 (0.0%) |
| 5 to 17 Years | 0 (0.0%) | 53 (2.6%) |
| 18 to 34 Years | 33 (1.8%) | 14 (0.5%) |
| 35 to 64 Years | 76 (2.8%) | 84 (2.2%) |
| 65 to 74 Years | 98 (12.4%) | 57 (6.2%) |
| 75 Years and over | 169 (34.4%) | 234 (31.5%) |
Disability Class: Vision Difficulty
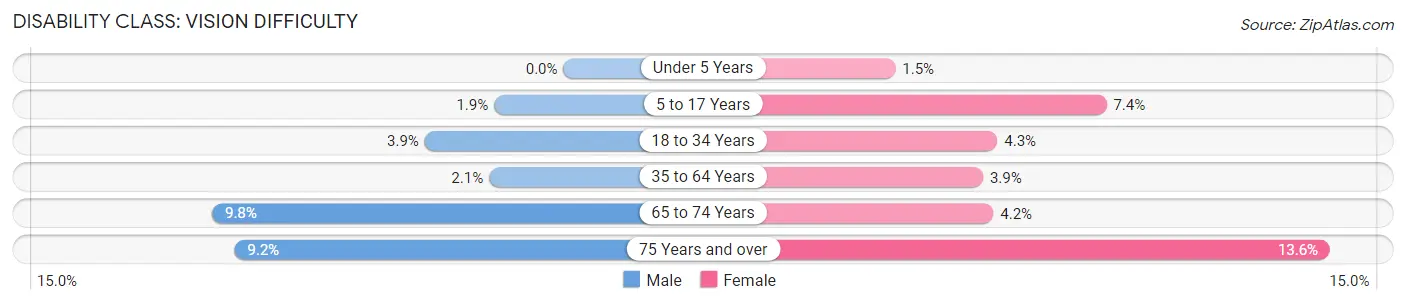
| Age Bracket | Male | Female |
| Under 5 Years | 0 (0.0%) | 18 (1.5%) |
| 5 to 17 Years | 41 (1.9%) | 152 (7.4%) |
| 18 to 34 Years | 69 (3.9%) | 126 (4.3%) |
| 35 to 64 Years | 57 (2.1%) | 149 (3.9%) |
| 65 to 74 Years | 77 (9.8%) | 39 (4.2%) |
| 75 Years and over | 45 (9.2%) | 101 (13.6%) |
Disability Class: Cognitive Difficulty
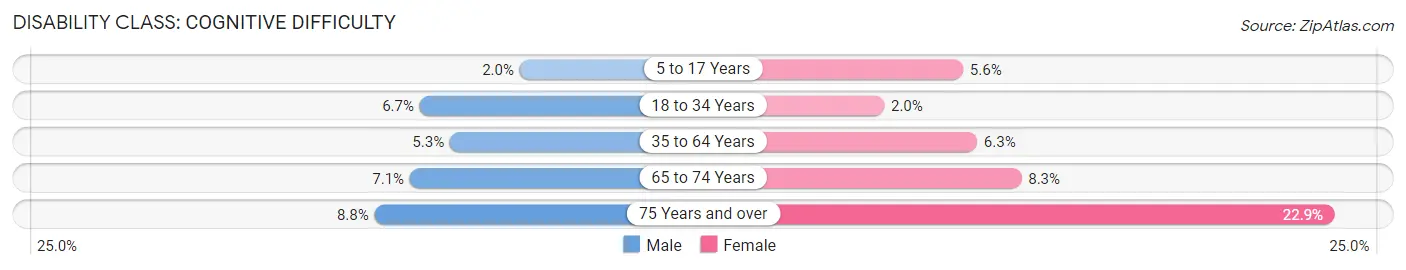
| Age Bracket | Male | Female |
| 5 to 17 Years | 43 (2.0%) | 116 (5.6%) |
| 18 to 34 Years | 119 (6.7%) | 57 (2.0%) |
| 35 to 64 Years | 145 (5.3%) | 238 (6.3%) |
| 65 to 74 Years | 56 (7.1%) | 77 (8.3%) |
| 75 Years and over | 43 (8.8%) | 170 (22.9%) |
Disability Class: Ambulatory Difficulty
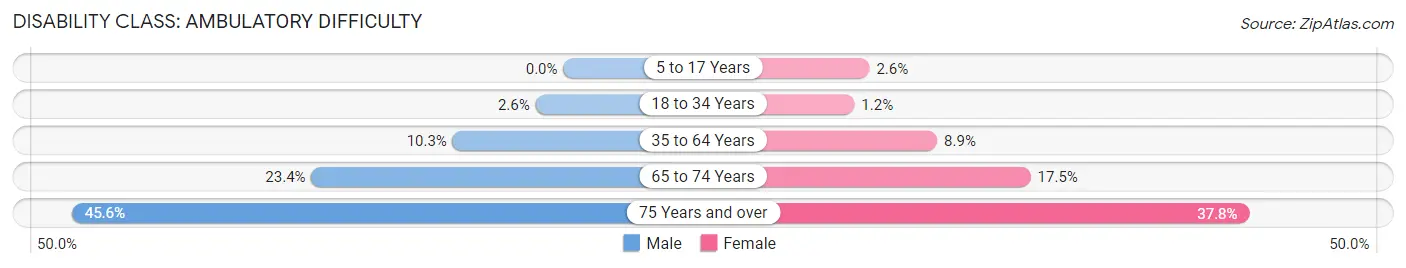
| Age Bracket | Male | Female |
| 5 to 17 Years | 0 (0.0%) | 53 (2.6%) |
| 18 to 34 Years | 46 (2.6%) | 34 (1.2%) |
| 35 to 64 Years | 283 (10.3%) | 336 (8.8%) |
| 65 to 74 Years | 184 (23.4%) | 162 (17.5%) |
| 75 Years and over | 224 (45.6%) | 281 (37.8%) |
Disability Class: Self-Care Difficulty
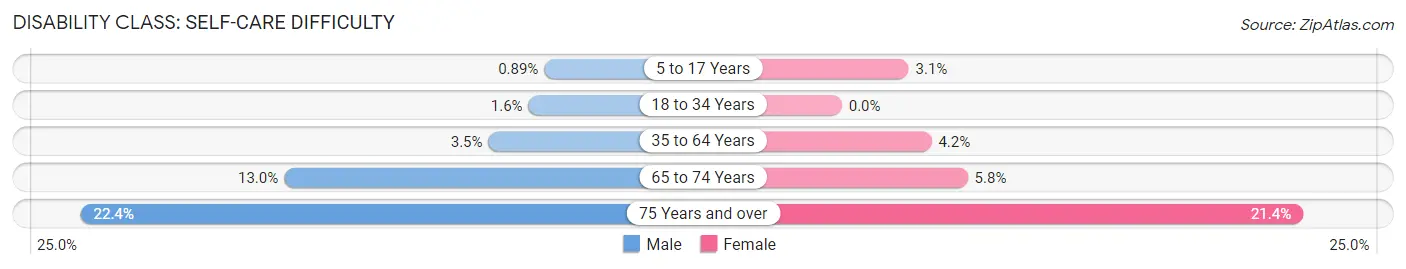
| Age Bracket | Male | Female |
| 5 to 17 Years | 19 (0.9%) | 64 (3.1%) |
| 18 to 34 Years | 29 (1.6%) | 0 (0.0%) |
| 35 to 64 Years | 96 (3.5%) | 158 (4.2%) |
| 65 to 74 Years | 102 (13.0%) | 54 (5.8%) |
| 75 Years and over | 110 (22.4%) | 159 (21.4%) |
Technology Access in Oak Harbor
Computing Device Access in Oak Harbor
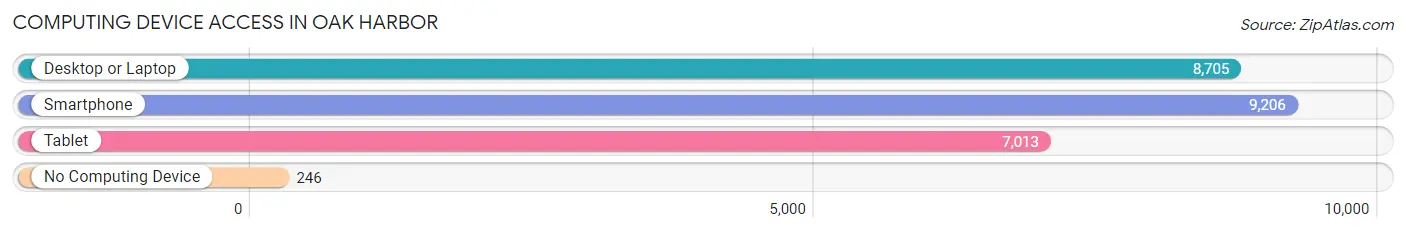
| Device Type | # Households | % Households |
| Desktop or Laptop | 8,705 | 88.4% |
| Smartphone | 9,206 | 93.4% |
| Tablet | 7,013 | 71.2% |
| No Computing Device | 246 | 2.5% |
| Total | 9,852 | 100.0% |
Internet Access in Oak Harbor
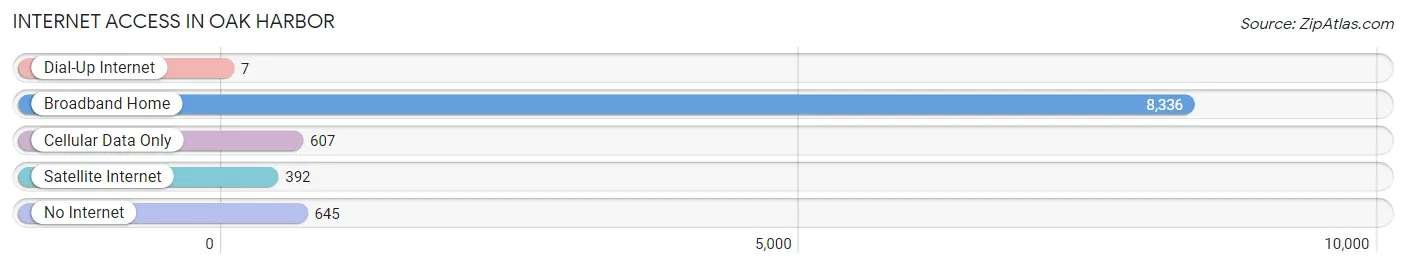
| Internet Type | # Households | % Households |
| Dial-Up Internet | 7 | 0.1% |
| Broadband Home | 8,336 | 84.6% |
| Cellular Data Only | 607 | 6.2% |
| Satellite Internet | 392 | 4.0% |
| No Internet | 645 | 6.6% |
| Total | 9,852 | 100.0% |
Oak Harbor Summary
History
The city of Oak Harbor, Washington is located on the northern tip of Whidbey Island in Island County. The area was first inhabited by the Snohomish and Skagit tribes, who lived off the abundant resources of the island. The first European settlers arrived in the area in the late 1800s, and the town was officially incorporated in 1915.
The city was named after the large oak trees that grew in the area, and the harbor was used as a safe haven for ships during storms. The city quickly grew as a commercial center, with a bustling fishing industry and a large lumber mill. The city also became a popular tourist destination, with many visitors coming to enjoy the beautiful scenery and the nearby beaches.
In the early 1900s, the city was home to a large military base, which was used by the US Navy during World War II. The base was decommissioned in the 1950s, but the city still has a strong military presence, with the Naval Air Station Whidbey Island located nearby.
Geography
Oak Harbor is located on the northern tip of Whidbey Island, which is part of the Puget Sound region of Washington State. The city is situated on the western shore of the island, and is surrounded by the waters of Saratoga Passage and Penn Cove. The city is located about 30 miles north of Seattle, and is accessible by ferry from the mainland.
The city has a total area of 8.3 square miles, with 6.3 square miles of land and 2.0 square miles of water. The terrain is mostly flat, with some rolling hills in the northern part of the city. The climate is mild, with temperatures ranging from the mid-30s in the winter to the mid-70s in the summer.
Economy
Oak Harbor’s economy is largely driven by the military, tourism, and the fishing industry. The Naval Air Station Whidbey Island is the largest employer in the city, with over 5,000 personnel. The base is home to a variety of military operations, including the Navy’s electronic attack squadron, the Navy’s electronic warfare squadron, and the Navy’s search and rescue squadron.
Tourism is also an important part of the city’s economy, with many visitors coming to enjoy the beautiful scenery and the nearby beaches. The city is home to a variety of attractions, including the Oak Harbor Marina, the Oak Harbor Historical Museum, and the Oak Harbor Wildlife Refuge.
The fishing industry is also an important part of the city’s economy, with many local fishermen harvesting salmon, crab, and other seafood from the waters of Saratoga Passage and Penn Cove.
Demographics
As of the 2010 census, the city of Oak Harbor had a population of 22,075. The population is fairly evenly split between males and females, with 50.7% male and 49.3% female. The median age of the population is 37.7 years, and the median household income is $50,945.
The racial makeup of the city is 87.2% White, 4.2% Hispanic or Latino, 2.7% Asian, 1.7% African American, and 0.7% Native American. The city is also home to a large military population, with over 5,000 personnel stationed at the Naval Air Station Whidbey Island.
Conclusion
Oak Harbor, Washington is a vibrant city located on the northern tip of Whidbey Island. The city has a long and rich history, and is home to a large military base, a bustling fishing industry, and a variety of tourist attractions. The city has a diverse population, with a median age of 37.7 years and a median household income of $50,945. Oak Harbor is a great place to live, work, and play, and is sure to continue to be a thriving community for years to come.
Common Questions
What is Per Capita Income in Oak Harbor?
Per Capita income in Oak Harbor is $33,245.
What is the Median Family Income in Oak Harbor?
Median Family Income in Oak Harbor is $82,652.
What is the Median Household income in Oak Harbor?
Median Household Income in Oak Harbor is $68,039.
What is Income or Wage Gap in Oak Harbor?
Income or Wage Gap in Oak Harbor is 37.2%.
Women in Oak Harbor earn 62.8 cents for every dollar earned by a man.
What is Inequality or Gini Index in Oak Harbor?
Inequality or Gini Index in Oak Harbor is 0.41.
What is the Total Population of Oak Harbor?
Total Population of Oak Harbor is 24,458.
What is the Total Male Population of Oak Harbor?
Total Male Population of Oak Harbor is 12,018.
What is the Total Female Population of Oak Harbor?
Total Female Population of Oak Harbor is 12,440.
What is the Ratio of Males per 100 Females in Oak Harbor?
There are 96.61 Males per 100 Females in Oak Harbor.
What is the Ratio of Females per 100 Males in Oak Harbor?
There are 103.51 Females per 100 Males in Oak Harbor.
What is the Median Population Age in Oak Harbor?
Median Population Age in Oak Harbor is 31.7 Years.
What is the Average Family Size in Oak Harbor
Average Family Size in Oak Harbor is 3.1 People.
What is the Average Household Size in Oak Harbor
Average Household Size in Oak Harbor is 2.5 People.
How Large is the Labor Force in Oak Harbor?
There are 12,453 People in the Labor Forcein in Oak Harbor.
What is the Percentage of People in the Labor Force in Oak Harbor?
68.1% of People are in the Labor Force in Oak Harbor.
What is the Unemployment Rate in Oak Harbor?
Unemployment Rate in Oak Harbor is 6.9%.