Lynden, WA Map & Demographics
Lynden Map
Lynden Overview
$39,677
PER CAPITA INCOME
$109,052
AVG FAMILY INCOME
$86,175
AVG HOUSEHOLD INCOME
59.6%
WAGE / INCOME GAP [ % ]
40.4¢/ $1
WAGE / INCOME GAP [ $ ]
0.39
INEQUALITY / GINI INDEX
15,723
TOTAL POPULATION
7,915
MALE POPULATION
7,808
FEMALE POPULATION
101.37
MALES / 100 FEMALES
98.65
FEMALES / 100 MALES
35.7
MEDIAN AGE
3.3
AVG FAMILY SIZE
2.7
AVG HOUSEHOLD SIZE
7,923
LABOR FORCE [ PEOPLE ]
66.0%
PERCENT IN LABOR FORCE
4.5%
UNEMPLOYMENT RATE
Lynden Zip Codes
Lynden Area Codes
Income in Lynden
Income Overview in Lynden
Per Capita Income in Lynden is $39,677, while median incomes of families and households are $109,052 and $86,175 respectively.
| Characteristic | Number | Measure |
| Per Capita Income | 15,723 | $39,677 |
| Median Family Income | 3,894 | $109,052 |
| Mean Family Income | 3,894 | $111,023 |
| Median Household Income | 5,786 | $86,175 |
| Mean Household Income | 5,786 | $106,005 |
| Income Deficit | 3,894 | $0 |
| Wage / Income Gap (%) | 15,723 | 59.64% |
| Wage / Income Gap ($) | 15,723 | 40.36¢ per $1 |
| Gini / Inequality Index | 15,723 | 0.39 |
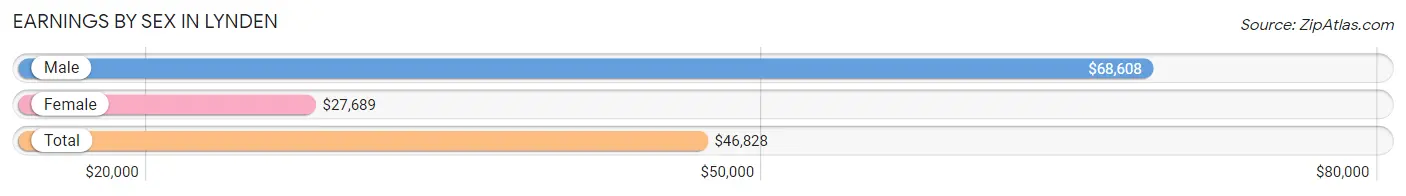
Earnings by Sex in Lynden
Average Earnings in Lynden are $46,828, $68,608 for men and $27,689 for women, a difference of 59.6%.
| Sex | Number | Average Earnings |
| Male | 4,576 (55.2%) | $68,608 |
| Female | 3,720 (44.8%) | $27,689 |
| Total | 8,296 (100.0%) | $46,828 |
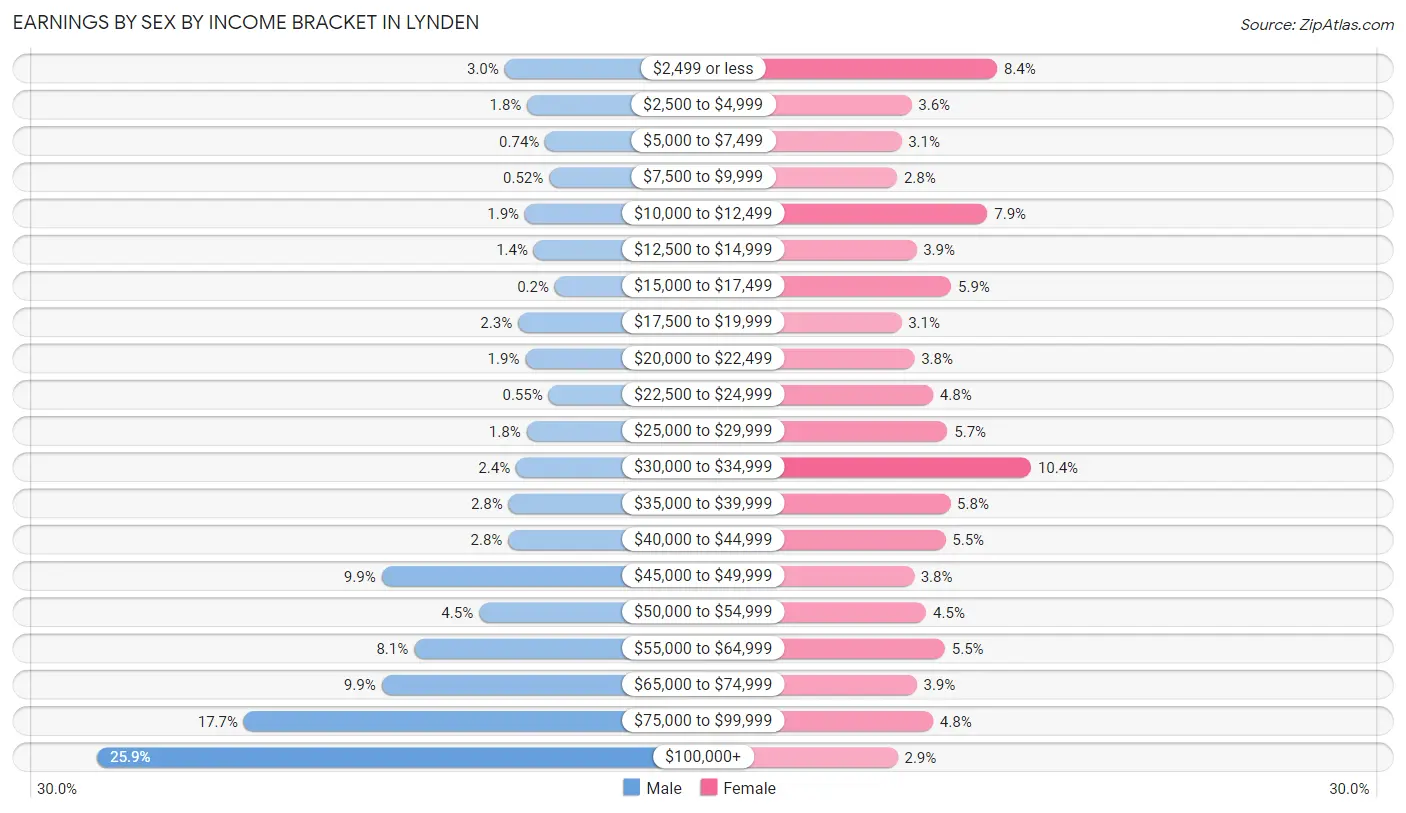
Earnings by Sex by Income Bracket in Lynden
The most common earnings brackets in Lynden are $100,000+ for men (1,186 | 25.9%) and $30,000 to $34,999 for women (385 | 10.3%).
| Income | Male | Female |
| $2,499 or less | 138 (3.0%) | 314 (8.4%) |
| $2,500 to $4,999 | 80 (1.8%) | 135 (3.6%) |
| $5,000 to $7,499 | 34 (0.7%) | 114 (3.1%) |
| $7,500 to $9,999 | 24 (0.5%) | 105 (2.8%) |
| $10,000 to $12,499 | 86 (1.9%) | 294 (7.9%) |
| $12,500 to $14,999 | 63 (1.4%) | 145 (3.9%) |
| $15,000 to $17,499 | 9 (0.2%) | 218 (5.9%) |
| $17,500 to $19,999 | 104 (2.3%) | 114 (3.1%) |
| $20,000 to $22,499 | 85 (1.9%) | 141 (3.8%) |
| $22,500 to $24,999 | 25 (0.5%) | 180 (4.8%) |
| $25,000 to $29,999 | 82 (1.8%) | 210 (5.7%) |
| $30,000 to $34,999 | 109 (2.4%) | 385 (10.3%) |
| $35,000 to $39,999 | 128 (2.8%) | 216 (5.8%) |
| $40,000 to $44,999 | 129 (2.8%) | 206 (5.5%) |
| $45,000 to $49,999 | 455 (9.9%) | 140 (3.8%) |
| $50,000 to $54,999 | 204 (4.5%) | 166 (4.5%) |
| $55,000 to $64,999 | 371 (8.1%) | 205 (5.5%) |
| $65,000 to $74,999 | 455 (9.9%) | 146 (3.9%) |
| $75,000 to $99,999 | 809 (17.7%) | 180 (4.8%) |
| $100,000+ | 1,186 (25.9%) | 106 (2.9%) |
| Total | 4,576 (100.0%) | 3,720 (100.0%) |
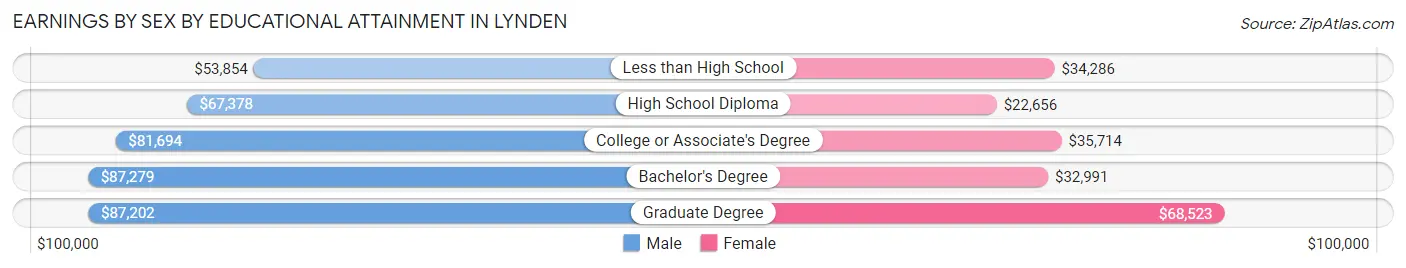
Earnings by Sex by Educational Attainment in Lynden
Average earnings in Lynden are $74,576 for men and $32,831 for women, a difference of 56.0%. Men with an educational attainment of bachelor's degree enjoy the highest average annual earnings of $87,279, while those with less than high school education earn the least with $53,854. Women with an educational attainment of graduate degree earn the most with the average annual earnings of $68,523, while those with high school diploma education have the smallest earnings of $22,656.
| Educational Attainment | Male Income | Female Income |
| Less than High School | $53,854 | $34,286 |
| High School Diploma | $67,378 | $22,656 |
| College or Associate's Degree | $81,694 | $35,714 |
| Bachelor's Degree | $87,279 | $32,991 |
| Graduate Degree | $87,202 | $68,523 |
| Total | $74,576 | $32,831 |
Family Income in Lynden
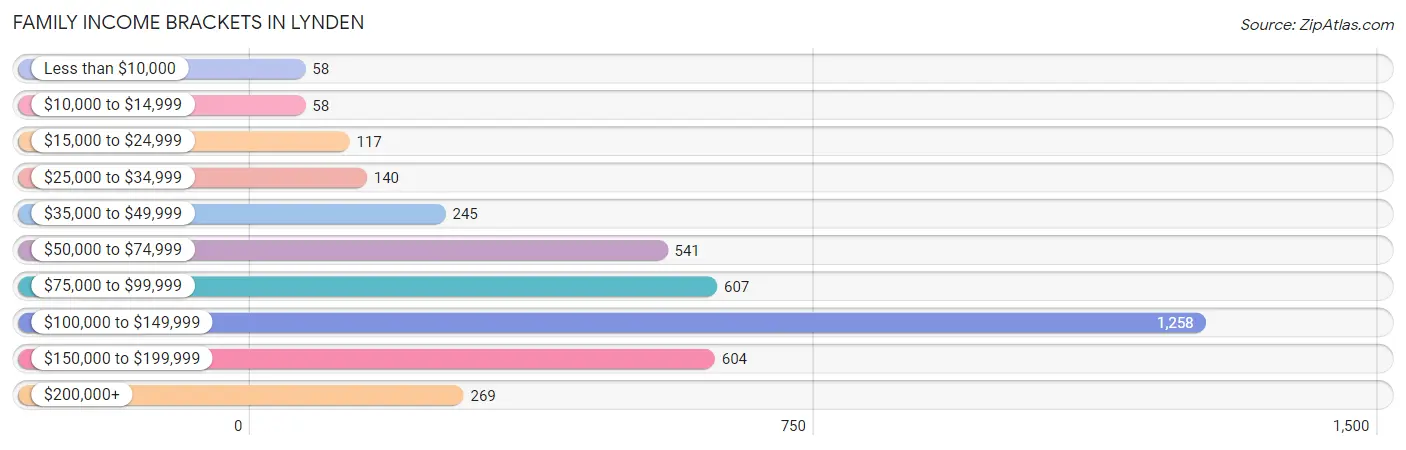
Family Income Brackets in Lynden
According to the Lynden family income data, there are 1,258 families falling into the $100,000 to $149,999 income range, which is the most common income bracket and makes up 32.3% of all families. Conversely, the less than $10,000 income bracket is the least frequent group with only 58 families (1.5%) belonging to this category.
| Income Bracket | # Families | % Families |
| Less than $10,000 | 58 | 1.5% |
| $10,000 to $14,999 | 58 | 1.5% |
| $15,000 to $24,999 | 117 | 3.0% |
| $25,000 to $34,999 | 140 | 3.6% |
| $35,000 to $49,999 | 245 | 6.3% |
| $50,000 to $74,999 | 541 | 13.9% |
| $75,000 to $99,999 | 607 | 15.6% |
| $100,000 to $149,999 | 1,258 | 32.3% |
| $150,000 to $199,999 | 604 | 15.5% |
| $200,000+ | 269 | 6.9% |
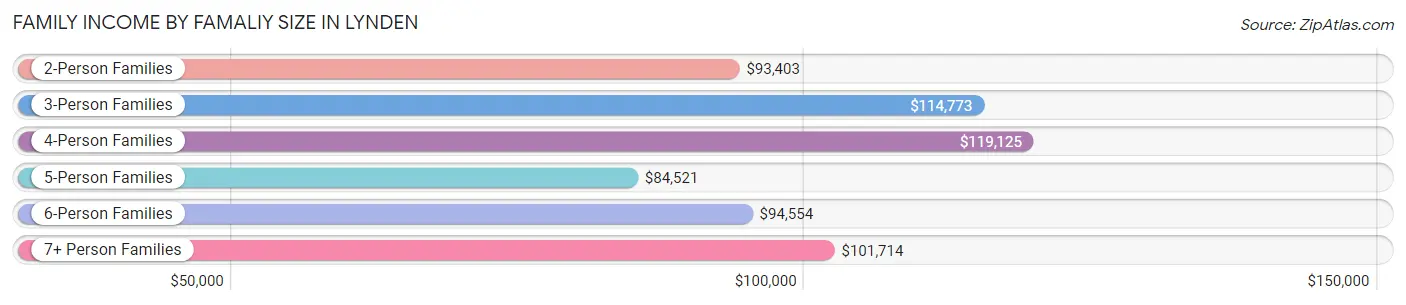
Family Income by Famaliy Size in Lynden
4-person families (671 | 17.2%) account for the highest median family income in Lynden with $119,125 per family, while 2-person families (1,686 | 43.3%) have the highest median income of $46,702 per family member.
| Income Bracket | # Families | Median Income |
| 2-Person Families | 1,686 (43.3%) | $93,403 |
| 3-Person Families | 784 (20.1%) | $114,773 |
| 4-Person Families | 671 (17.2%) | $119,125 |
| 5-Person Families | 350 (9.0%) | $84,521 |
| 6-Person Families | 293 (7.5%) | $94,554 |
| 7+ Person Families | 110 (2.8%) | $101,714 |
| Total | 3,894 (100.0%) | $109,052 |
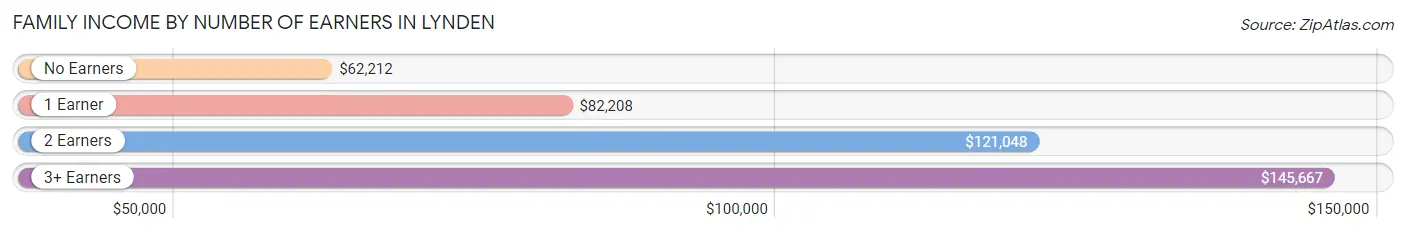
Family Income by Number of Earners in Lynden
The median family income in Lynden is $109,052, with families comprising 3+ earners (466) having the highest median family income of $145,667, while families with no earners (660) have the lowest median family income of $62,212, accounting for 12.0% and 17.0% of families, respectively.
| Number of Earners | # Families | Median Income |
| No Earners | 660 (17.0%) | $62,212 |
| 1 Earner | 965 (24.8%) | $82,208 |
| 2 Earners | 1,803 (46.3%) | $121,048 |
| 3+ Earners | 466 (12.0%) | $145,667 |
| Total | 3,894 (100.0%) | $109,052 |
Household Income in Lynden
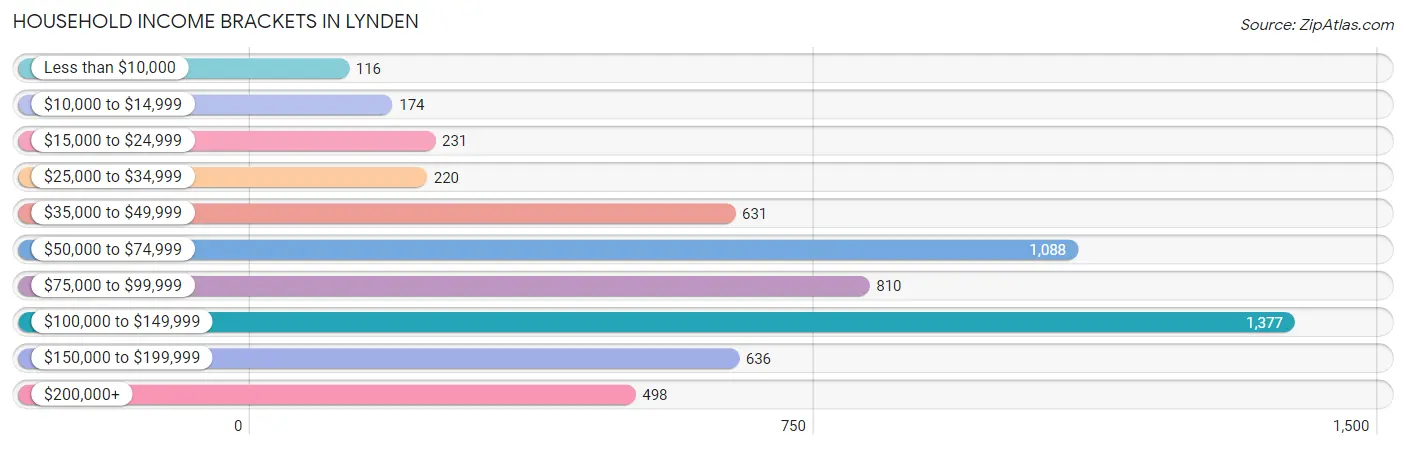
Household Income Brackets in Lynden
With 1,377 households falling in the category, the $100,000 to $149,999 income range is the most frequent in Lynden, accounting for 23.8% of all households. In contrast, only 116 households (2.0%) fall into the less than $10,000 income bracket, making it the least populous group.
| Income Bracket | # Households | % Households |
| Less than $10,000 | 116 | 2.0% |
| $10,000 to $14,999 | 174 | 3.0% |
| $15,000 to $24,999 | 231 | 4.0% |
| $25,000 to $34,999 | 220 | 3.8% |
| $35,000 to $49,999 | 631 | 10.9% |
| $50,000 to $74,999 | 1,088 | 18.8% |
| $75,000 to $99,999 | 810 | 14.0% |
| $100,000 to $149,999 | 1,377 | 23.8% |
| $150,000 to $199,999 | 636 | 11.0% |
| $200,000+ | 498 | 8.6% |
Household Income by Householder Age in Lynden
The median household income in Lynden is $86,175, with the highest median household income of $112,822 found in the 25 to 44 years age bracket for the primary householder. A total of 2,020 households (34.9%) fall into this category. Meanwhile, the 65+ years age bracket for the primary householder has the lowest median household income of $62,059, with 1,650 households (28.5%) in this group.
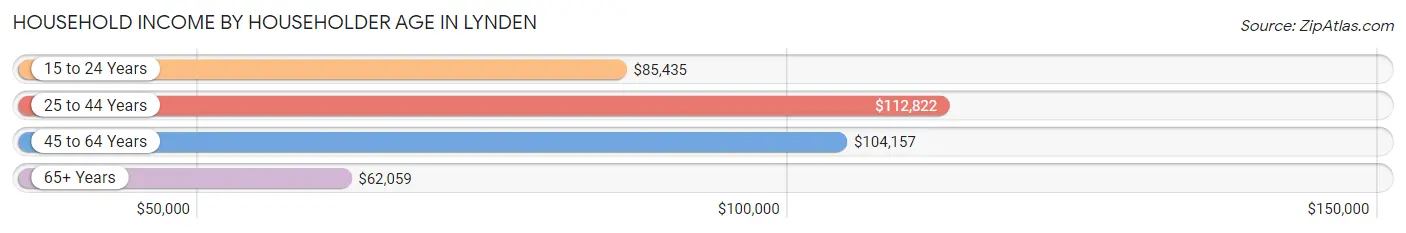
| Income Bracket | # Households | Median Income |
| 15 to 24 Years | 352 (6.1%) | $85,435 |
| 25 to 44 Years | 2,020 (34.9%) | $112,822 |
| 45 to 64 Years | 1,764 (30.5%) | $104,157 |
| 65+ Years | 1,650 (28.5%) | $62,059 |
| Total | 5,786 (100.0%) | $86,175 |
Poverty in Lynden
Income Below Poverty by Sex and Age in Lynden
With 6.3% poverty level for males and 8.0% for females among the residents of Lynden, 16 and 17 year old males and 5 year old females are the most vulnerable to poverty, with 84 males (60.0%) and 48 females (40.0%) in their respective age groups living below the poverty level.
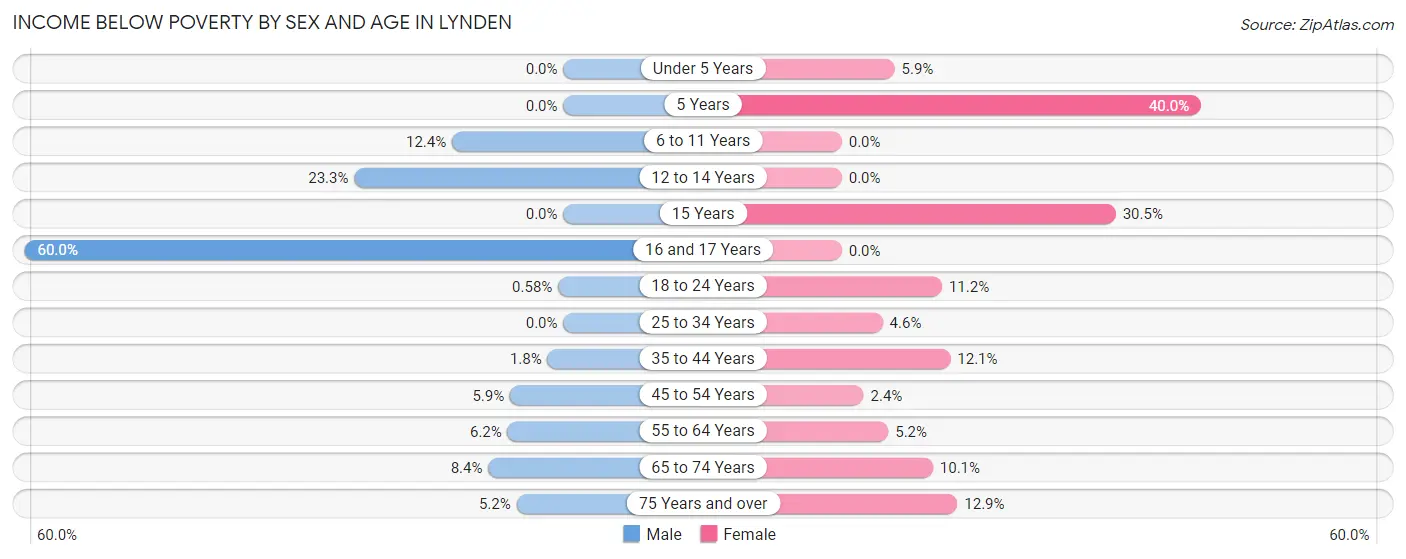
| Age Bracket | Male | Female |
| Under 5 Years | 0 (0.0%) | 43 (5.9%) |
| 5 Years | 0 (0.0%) | 48 (40.0%) |
| 6 to 11 Years | 92 (12.4%) | 0 (0.0%) |
| 12 to 14 Years | 105 (23.3%) | 0 (0.0%) |
| 15 Years | 0 (0.0%) | 36 (30.5%) |
| 16 and 17 Years | 84 (60.0%) | 0 (0.0%) |
| 18 to 24 Years | 4 (0.6%) | 98 (11.2%) |
| 25 to 34 Years | 0 (0.0%) | 45 (4.5%) |
| 35 to 44 Years | 20 (1.8%) | 119 (12.1%) |
| 45 to 54 Years | 37 (5.9%) | 15 (2.4%) |
| 55 to 64 Years | 55 (6.2%) | 48 (5.2%) |
| 65 to 74 Years | 71 (8.4%) | 66 (10.1%) |
| 75 Years and over | 28 (5.2%) | 95 (12.9%) |
| Total | 496 (6.3%) | 613 (8.0%) |
Income Above Poverty by Sex and Age in Lynden
According to the poverty statistics in Lynden, males aged under 5 years and females aged 6 to 11 years are the age groups that are most secure financially, with 100.0% of males and 100.0% of females in these age groups living above the poverty line.
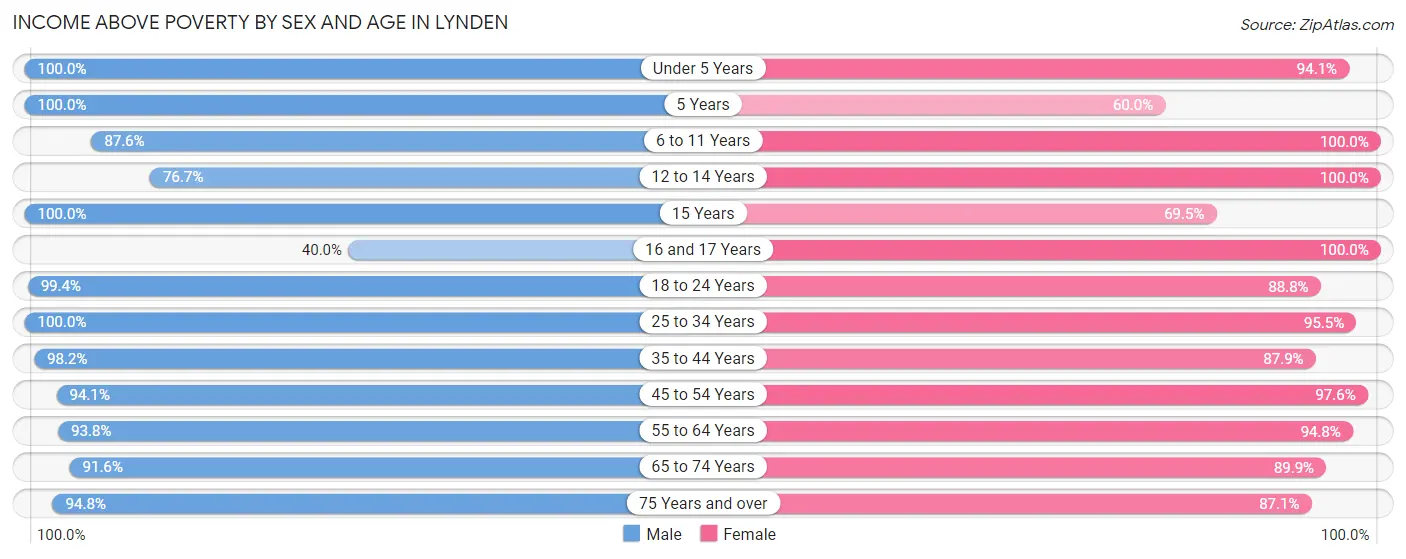
| Age Bracket | Male | Female |
| Under 5 Years | 618 (100.0%) | 688 (94.1%) |
| 5 Years | 86 (100.0%) | 72 (60.0%) |
| 6 to 11 Years | 650 (87.6%) | 594 (100.0%) |
| 12 to 14 Years | 346 (76.7%) | 153 (100.0%) |
| 15 Years | 93 (100.0%) | 82 (69.5%) |
| 16 and 17 Years | 56 (40.0%) | 210 (100.0%) |
| 18 to 24 Years | 689 (99.4%) | 780 (88.8%) |
| 25 to 34 Years | 1,002 (100.0%) | 945 (95.5%) |
| 35 to 44 Years | 1,117 (98.2%) | 865 (87.9%) |
| 45 to 54 Years | 586 (94.1%) | 602 (97.6%) |
| 55 to 64 Years | 830 (93.8%) | 879 (94.8%) |
| 65 to 74 Years | 778 (91.6%) | 585 (89.9%) |
| 75 Years and over | 509 (94.8%) | 643 (87.1%) |
| Total | 7,360 (93.7%) | 7,098 (92.0%) |
Income Below Poverty Among Married-Couple Families in Lynden
The poverty statistics for married-couple families in Lynden show that 2.3% or 80 of the total 3,439 families live below the poverty line. Families with 5 or more children have the highest poverty rate of 100.0%, comprising of 31 families. On the other hand, families with 1 or 2 children have the lowest poverty rate of 0.0%, which includes 0 families.
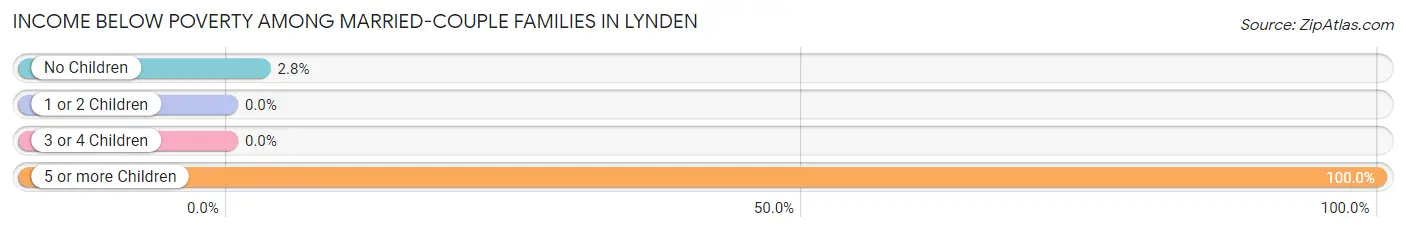
| Children | Above Poverty | Below Poverty |
| No Children | 1,678 (97.2%) | 49 (2.8%) |
| 1 or 2 Children | 1,169 (100.0%) | 0 (0.0%) |
| 3 or 4 Children | 512 (100.0%) | 0 (0.0%) |
| 5 or more Children | 0 (0.0%) | 31 (100.0%) |
| Total | 3,359 (97.7%) | 80 (2.3%) |
Income Below Poverty Among Single-Parent Households in Lynden
According to the poverty data in Lynden, 15.2% or 34 single-father households and 40.1% or 93 single-mother households are living below the poverty line. Among single-father households, those with 1 or 2 children have the highest poverty rate, with 34 households (28.6%) experiencing poverty. Likewise, among single-mother households, those with 3 or 4 children have the highest poverty rate, with 22 households (61.1%) falling below the poverty line.
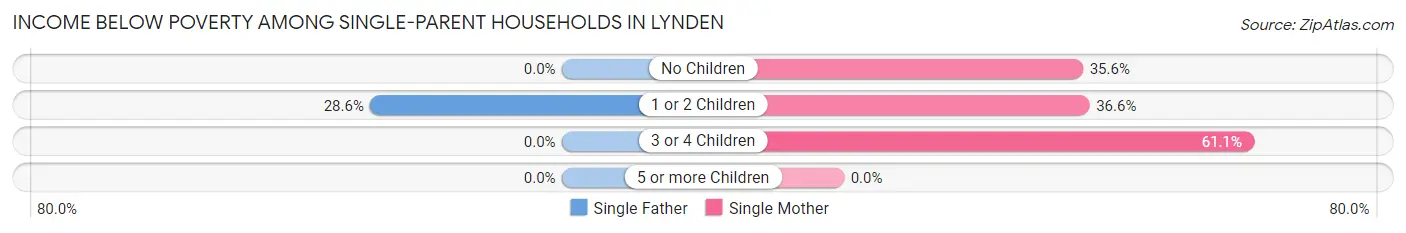
| Children | Single Father | Single Mother |
| No Children | 0 (0.0%) | 26 (35.6%) |
| 1 or 2 Children | 34 (28.6%) | 45 (36.6%) |
| 3 or 4 Children | 0 (0.0%) | 22 (61.1%) |
| 5 or more Children | 0 (0.0%) | 0 (0.0%) |
| Total | 34 (15.2%) | 93 (40.1%) |
Income Below Poverty Among Married-Couple vs Single-Parent Households in Lynden
The poverty data for Lynden shows that 80 of the married-couple family households (2.3%) and 127 of the single-parent households (27.9%) are living below the poverty level. Within the married-couple family households, those with 5 or more children have the highest poverty rate, with 31 households (100.0%) falling below the poverty line. Among the single-parent households, those with 3 or 4 children have the highest poverty rate, with 22 household (61.1%) living below poverty.
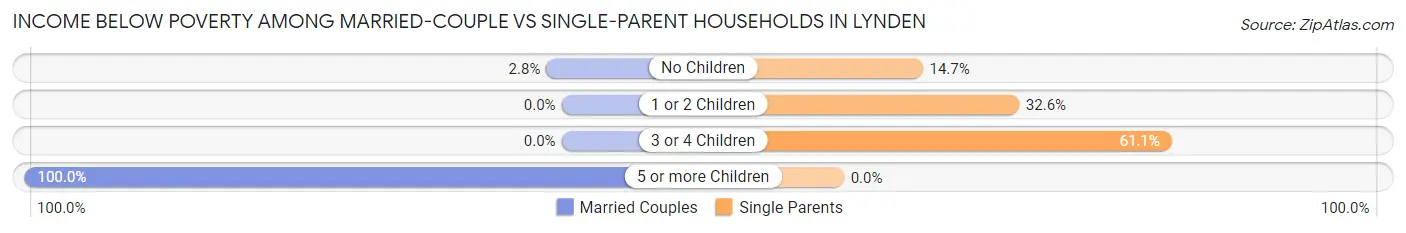
| Children | Married-Couple Families | Single-Parent Households |
| No Children | 49 (2.8%) | 26 (14.7%) |
| 1 or 2 Children | 0 (0.0%) | 79 (32.6%) |
| 3 or 4 Children | 0 (0.0%) | 22 (61.1%) |
| 5 or more Children | 31 (100.0%) | 0 (0.0%) |
| Total | 80 (2.3%) | 127 (27.9%) |
Race in Lynden
The most populous races in Lynden are White / Caucasian (12,596 | 80.1%), Hispanic or Latino (2,072 | 13.2%), and Some other Race (1,322 | 8.4%).
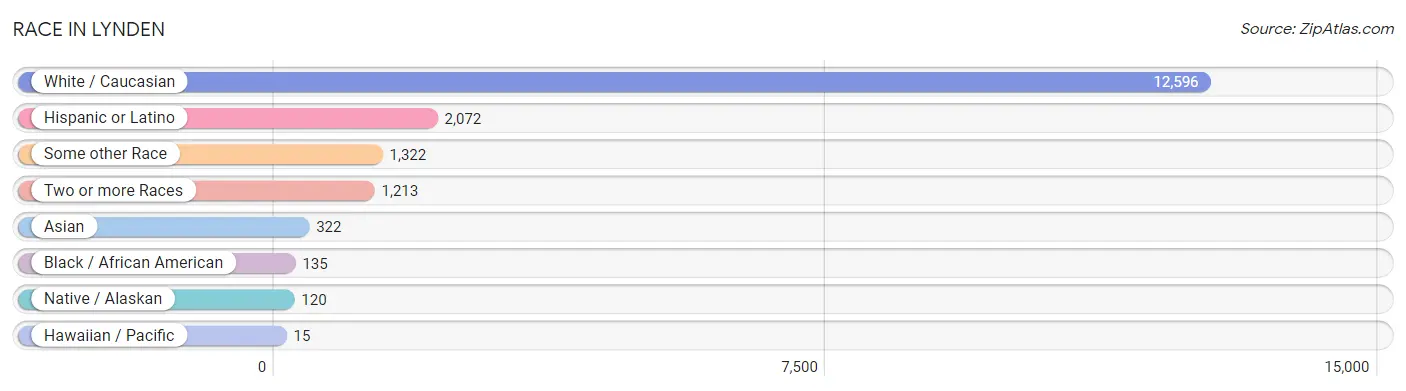
| Race | # Population | % Population |
| Asian | 322 | 2.1% |
| Black / African American | 135 | 0.9% |
| Hawaiian / Pacific | 15 | 0.1% |
| Hispanic or Latino | 2,072 | 13.2% |
| Native / Alaskan | 120 | 0.8% |
| White / Caucasian | 12,596 | 80.1% |
| Two or more Races | 1,213 | 7.7% |
| Some other Race | 1,322 | 8.4% |
| Total | 15,723 | 100.0% |
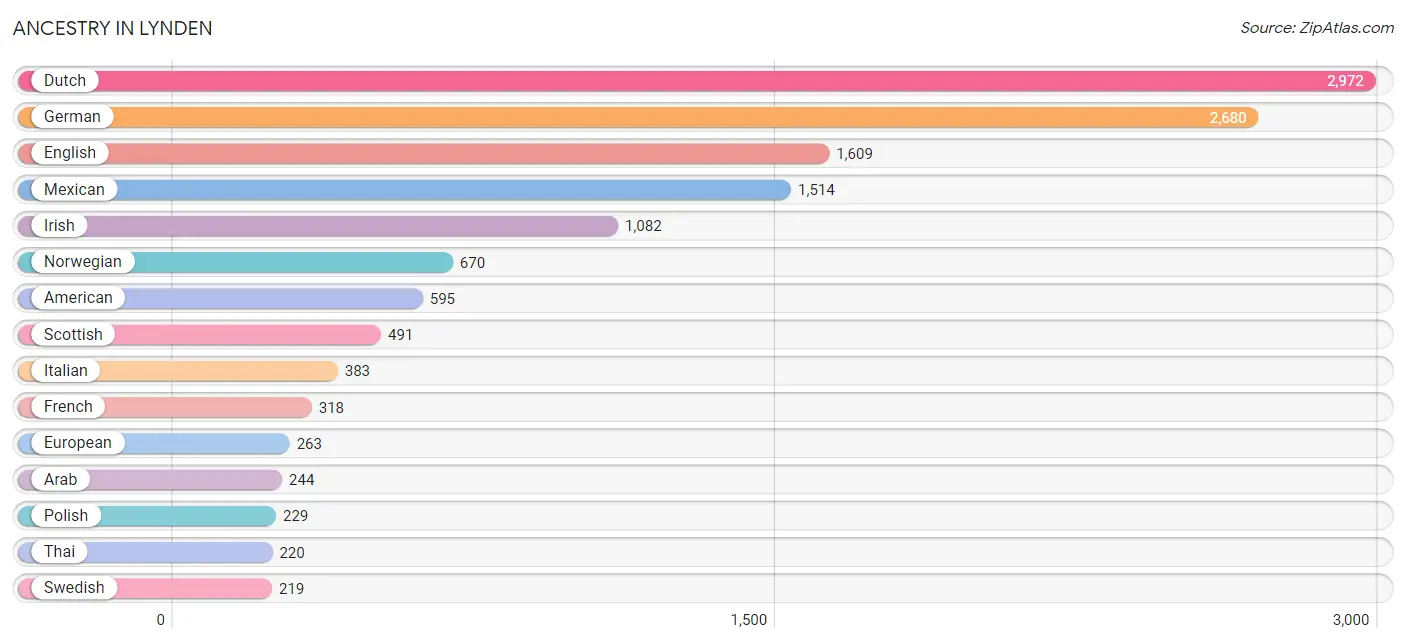
Ancestry in Lynden
The most populous ancestries reported in Lynden are Dutch (2,972 | 18.9%), German (2,680 | 17.1%), English (1,609 | 10.2%), Mexican (1,514 | 9.6%), and Irish (1,082 | 6.9%), together accounting for 62.7% of all Lynden residents.
| Ancestry | # Population | % Population |
| African | 46 | 0.3% |
| American | 595 | 3.8% |
| Arab | 244 | 1.5% |
| Austrian | 66 | 0.4% |
| Basque | 28 | 0.2% |
| Bhutanese | 193 | 1.2% |
| Blackfeet | 24 | 0.2% |
| British | 150 | 0.9% |
| Burmese | 97 | 0.6% |
| Canadian | 175 | 1.1% |
| Celtic | 22 | 0.1% |
| Central American | 46 | 0.3% |
| Central American Indian | 38 | 0.2% |
| Cherokee | 188 | 1.2% |
| Cheyenne | 58 | 0.4% |
| Chippewa | 23 | 0.2% |
| Choctaw | 73 | 0.5% |
| Colville | 8 | 0.1% |
| Costa Rican | 15 | 0.1% |
| Cuban | 68 | 0.4% |
| Czech | 31 | 0.2% |
| Danish | 121 | 0.8% |
| Dutch | 2,972 | 18.9% |
| Eastern European | 20 | 0.1% |
| Ecuadorian | 10 | 0.1% |
| English | 1,609 | 10.2% |
| European | 263 | 1.7% |
| Finnish | 35 | 0.2% |
| French | 318 | 2.0% |
| French American Indian | 35 | 0.2% |
| French Canadian | 5 | 0.0% |
| German | 2,680 | 17.1% |
| Greek | 12 | 0.1% |
| Honduran | 8 | 0.1% |
| Indian (Asian) | 37 | 0.2% |
| Irish | 1,082 | 6.9% |
| Italian | 383 | 2.4% |
| Jamaican | 3 | 0.0% |
| Korean | 8 | 0.1% |
| Latvian | 11 | 0.1% |
| Lithuanian | 48 | 0.3% |
| Mexican | 1,514 | 9.6% |
| Mexican American Indian | 32 | 0.2% |
| Native Hawaiian | 76 | 0.5% |
| Navajo | 12 | 0.1% |
| Northern European | 9 | 0.1% |
| Norwegian | 670 | 4.3% |
| Polish | 229 | 1.5% |
| Portuguese | 9 | 0.1% |
| Puerto Rican | 51 | 0.3% |
| Puget Sound Salish | 10 | 0.1% |
| Russian | 32 | 0.2% |
| Salvadoran | 23 | 0.2% |
| Samoan | 15 | 0.1% |
| Scandinavian | 75 | 0.5% |
| Scotch-Irish | 110 | 0.7% |
| Scottish | 491 | 3.1% |
| South African | 17 | 0.1% |
| South American | 10 | 0.1% |
| Spaniard | 58 | 0.4% |
| Spanish | 4 | 0.0% |
| Sri Lankan | 10 | 0.1% |
| Subsaharan African | 97 | 0.6% |
| Swedish | 219 | 1.4% |
| Swiss | 72 | 0.5% |
| Thai | 220 | 1.4% |
| Trinidadian and Tobagonian | 7 | 0.0% |
| Ukrainian | 125 | 0.8% |
| Welsh | 44 | 0.3% |
| Yuman | 33 | 0.2% |
| Yup'ik | 65 | 0.4% | View All 71 Rows |
Immigrants in Lynden
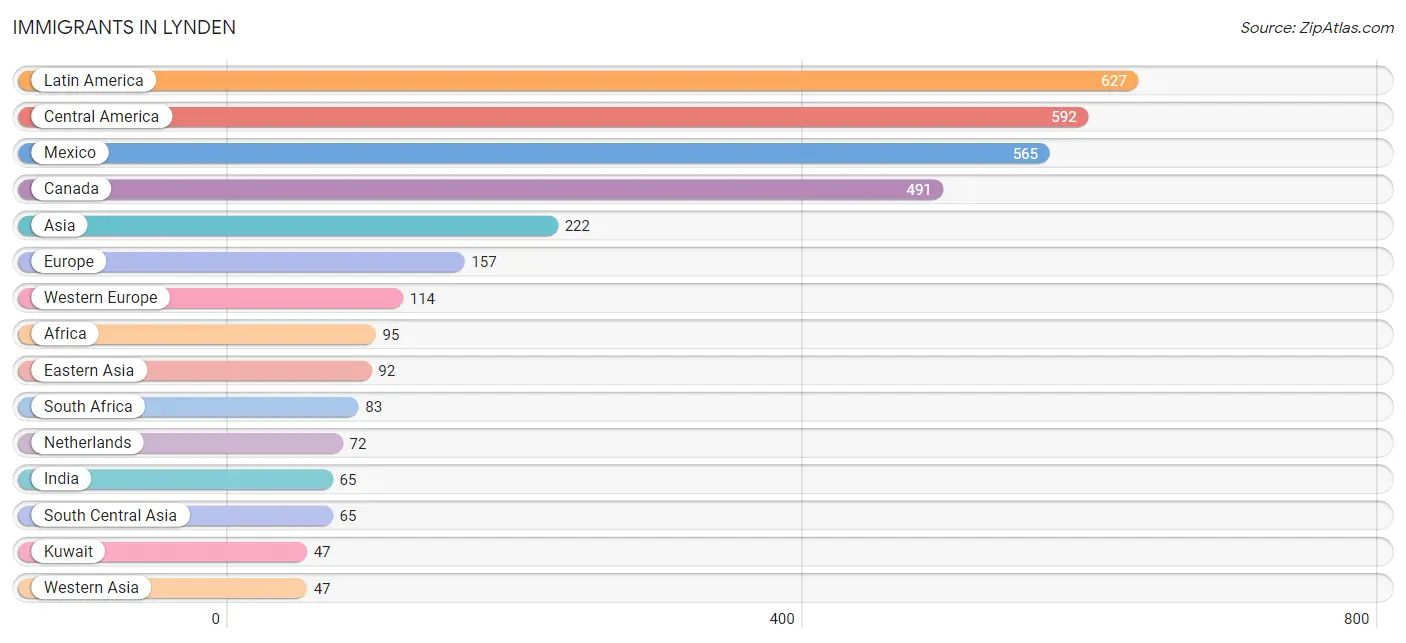
The most numerous immigrant groups reported in Lynden came from Latin America (627 | 4.0%), Central America (592 | 3.8%), Mexico (565 | 3.6%), Canada (491 | 3.1%), and Asia (222 | 1.4%), together accounting for 15.9% of all Lynden residents.
| Immigration Origin | # Population | % Population |
| Africa | 95 | 0.6% |
| Asia | 222 | 1.4% |
| Australia | 15 | 0.1% |
| Canada | 491 | 3.1% |
| Caribbean | 10 | 0.1% |
| Central America | 592 | 3.8% |
| China | 37 | 0.2% |
| Costa Rica | 15 | 0.1% |
| Eastern Africa | 12 | 0.1% |
| Eastern Asia | 92 | 0.6% |
| Eastern Europe | 25 | 0.2% |
| England | 18 | 0.1% |
| Europe | 157 | 1.0% |
| France | 9 | 0.1% |
| Germany | 33 | 0.2% |
| Guatemala | 12 | 0.1% |
| India | 65 | 0.4% |
| Jamaica | 3 | 0.0% |
| Japan | 34 | 0.2% |
| Korea | 21 | 0.1% |
| Kuwait | 47 | 0.3% |
| Latin America | 627 | 4.0% |
| Mexico | 565 | 3.6% |
| Netherlands | 72 | 0.5% |
| Northern Europe | 18 | 0.1% |
| Oceania | 30 | 0.2% |
| Philippines | 8 | 0.1% |
| Poland | 5 | 0.0% |
| South Africa | 83 | 0.5% |
| South America | 25 | 0.2% |
| South Central Asia | 65 | 0.4% |
| South Eastern Asia | 18 | 0.1% |
| Trinidad and Tobago | 7 | 0.0% |
| Ukraine | 20 | 0.1% |
| Vietnam | 10 | 0.1% |
| Western Asia | 47 | 0.3% |
| Western Europe | 114 | 0.7% | View All 37 Rows |
Sex and Age in Lynden
Sex and Age in Lynden
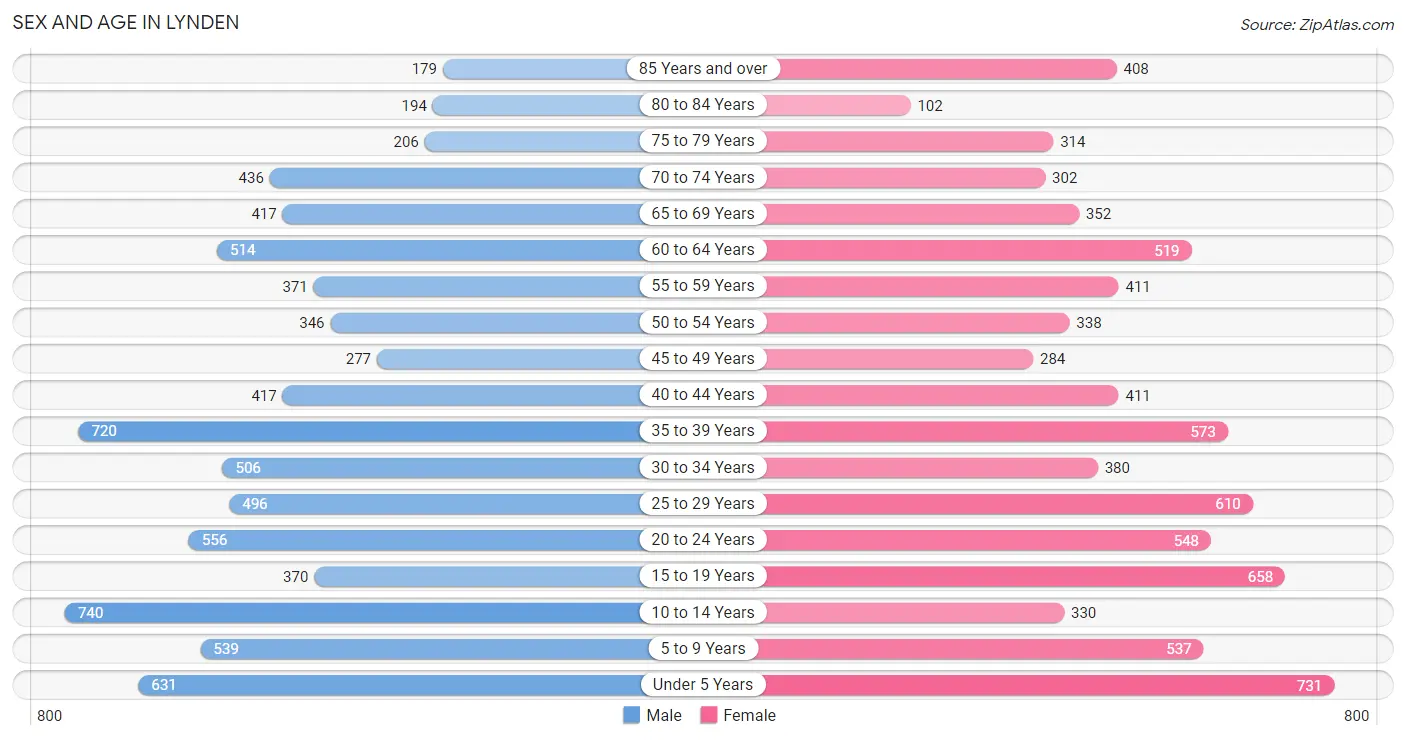
The most populous age groups in Lynden are 10 to 14 Years (740 | 9.3%) for men and Under 5 Years (731 | 9.4%) for women.
| Age Bracket | Male | Female |
| Under 5 Years | 631 (8.0%) | 731 (9.4%) |
| 5 to 9 Years | 539 (6.8%) | 537 (6.9%) |
| 10 to 14 Years | 740 (9.3%) | 330 (4.2%) |
| 15 to 19 Years | 370 (4.7%) | 658 (8.4%) |
| 20 to 24 Years | 556 (7.0%) | 548 (7.0%) |
| 25 to 29 Years | 496 (6.3%) | 610 (7.8%) |
| 30 to 34 Years | 506 (6.4%) | 380 (4.9%) |
| 35 to 39 Years | 720 (9.1%) | 573 (7.3%) |
| 40 to 44 Years | 417 (5.3%) | 411 (5.3%) |
| 45 to 49 Years | 277 (3.5%) | 284 (3.6%) |
| 50 to 54 Years | 346 (4.4%) | 338 (4.3%) |
| 55 to 59 Years | 371 (4.7%) | 411 (5.3%) |
| 60 to 64 Years | 514 (6.5%) | 519 (6.7%) |
| 65 to 69 Years | 417 (5.3%) | 352 (4.5%) |
| 70 to 74 Years | 436 (5.5%) | 302 (3.9%) |
| 75 to 79 Years | 206 (2.6%) | 314 (4.0%) |
| 80 to 84 Years | 194 (2.5%) | 102 (1.3%) |
| 85 Years and over | 179 (2.3%) | 408 (5.2%) |
| Total | 7,915 (100.0%) | 7,808 (100.0%) |
Families and Households in Lynden
Median Family Size in Lynden
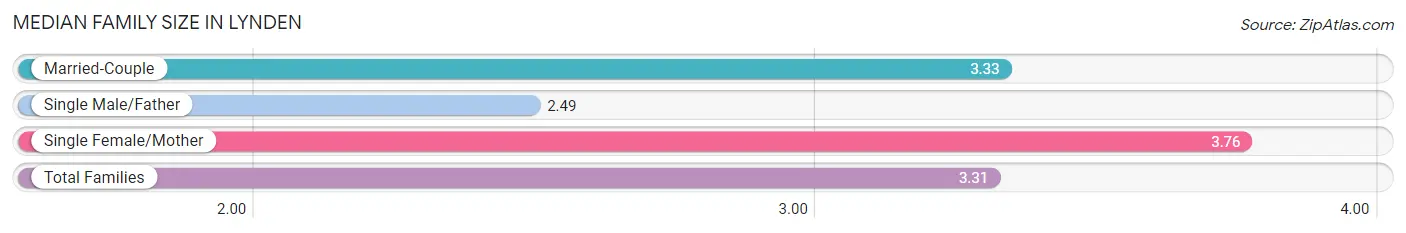
The median family size in Lynden is 3.31 persons per family, with single female/mother families (232 | 6.0%) accounting for the largest median family size of 3.76 persons per family. On the other hand, single male/father families (223 | 5.7%) represent the smallest median family size with 2.49 persons per family.
| Family Type | # Families | Family Size |
| Married-Couple | 3,439 (88.3%) | 3.33 |
| Single Male/Father | 223 (5.7%) | 2.49 |
| Single Female/Mother | 232 (6.0%) | 3.76 |
| Total Families | 3,894 (100.0%) | 3.31 |
Median Household Size in Lynden
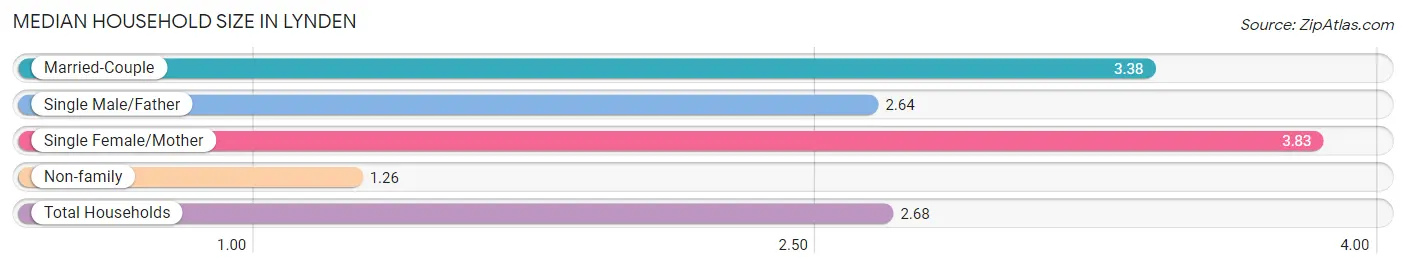
The median household size in Lynden is 2.68 persons per household, with single female/mother households (232 | 4.0%) accounting for the largest median household size of 3.83 persons per household. non-family households (1,892 | 32.7%) represent the smallest median household size with 1.26 persons per household.
| Household Type | # Households | Household Size |
| Married-Couple | 3,439 (59.4%) | 3.38 |
| Single Male/Father | 223 (3.8%) | 2.64 |
| Single Female/Mother | 232 (4.0%) | 3.83 |
| Non-family | 1,892 (32.7%) | 1.26 |
| Total Households | 5,786 (100.0%) | 2.68 |
Household Size by Marriage Status in Lynden
Out of a total of 5,786 households in Lynden, 3,894 (67.3%) are family households, while 1,892 (32.7%) are nonfamily households. The most numerous type of family households are 2-person households, comprising 1,617, and the most common type of nonfamily households are 1-person households, comprising 1,505.
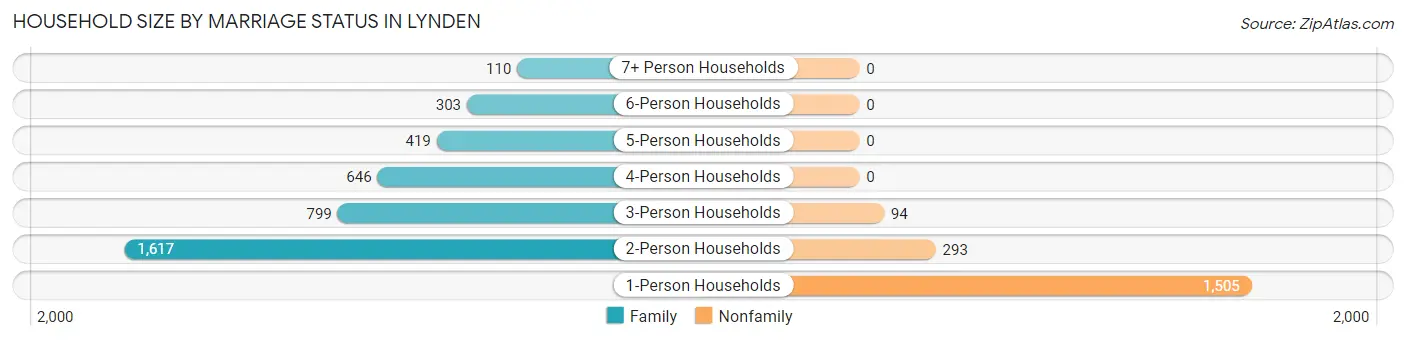
| Household Size | Family Households | Nonfamily Households |
| 1-Person Households | - | 1,505 (26.0%) |
| 2-Person Households | 1,617 (28.0%) | 293 (5.1%) |
| 3-Person Households | 799 (13.8%) | 94 (1.6%) |
| 4-Person Households | 646 (11.2%) | 0 (0.0%) |
| 5-Person Households | 419 (7.2%) | 0 (0.0%) |
| 6-Person Households | 303 (5.2%) | 0 (0.0%) |
| 7+ Person Households | 110 (1.9%) | 0 (0.0%) |
| Total | 3,894 (67.3%) | 1,892 (32.7%) |
Female Fertility in Lynden
Fertility by Age in Lynden
Average fertility rate in Lynden is 82.0 births per 1,000 women. Women in the age bracket of 20 to 34 years have the highest fertility rate with 174.0 births per 1,000 women. Women in the age bracket of 20 to 34 years acount for 91.8% of all women with births.
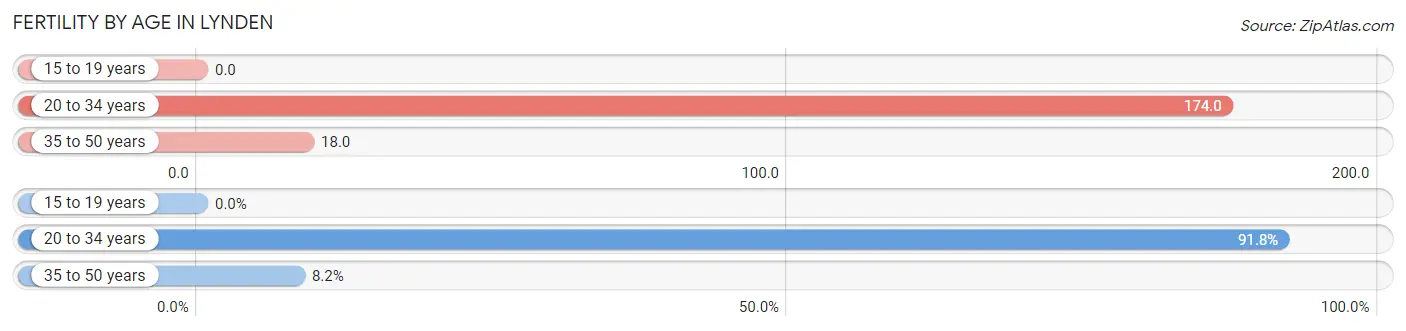
| Age Bracket | Women with Births | Births / 1,000 Women |
| 15 to 19 years | 0 (0.0%) | 0.0 |
| 20 to 34 years | 268 (91.8%) | 174.0 |
| 35 to 50 years | 24 (8.2%) | 18.0 |
| Total | 292 (100.0%) | 82.0 |
Fertility by Age by Marriage Status in Lynden
91.1% of women with births (292) in Lynden are married. The highest percentage of unmarried women with births falls into 20 to 34 years age bracket with 9.7% of them unmarried at the time of birth, while the lowest percentage of unmarried women with births belong to 35 to 50 years age bracket with 0.0% of them unmarried.
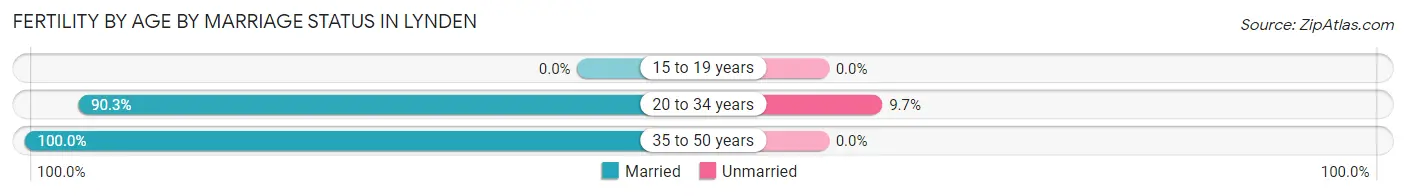
| Age Bracket | Married | Unmarried |
| 15 to 19 years | 0 (0.0%) | 0 (0.0%) |
| 20 to 34 years | 242 (90.3%) | 26 (9.7%) |
| 35 to 50 years | 24 (100.0%) | 0 (0.0%) |
| Total | 266 (91.1%) | 26 (8.9%) |
Fertility by Education in Lynden
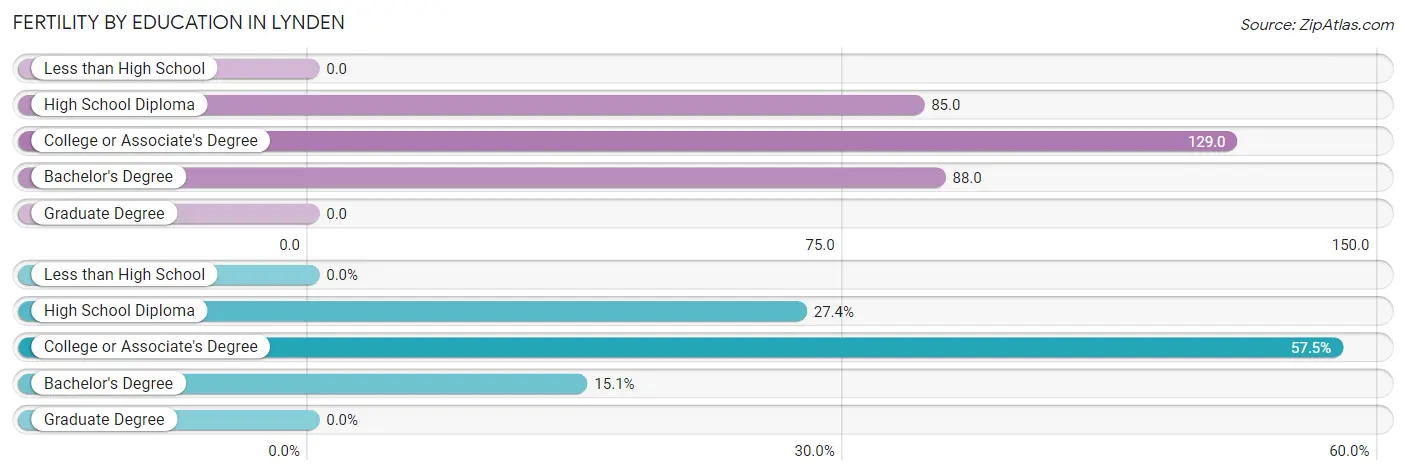
| Educational Attainment | Women with Births | Births / 1,000 Women |
| Less than High School | 0 (0.0%) | 0.0 |
| High School Diploma | 80 (27.4%) | 85.0 |
| College or Associate's Degree | 168 (57.5%) | 129.0 |
| Bachelor's Degree | 44 (15.1%) | 88.0 |
| Graduate Degree | 0 (0.0%) | 0.0 |
| Total | 292 (100.0%) | 82.0 |
Fertility by Education by Marriage Status in Lynden
8.9% of women with births in Lynden are unmarried. Women with the educational attainment of high school diploma are most likely to be married with 100.0% of them married at childbirth, while women with the educational attainment of college or associate's degree are least likely to be married with 15.5% of them unmarried at childbirth.
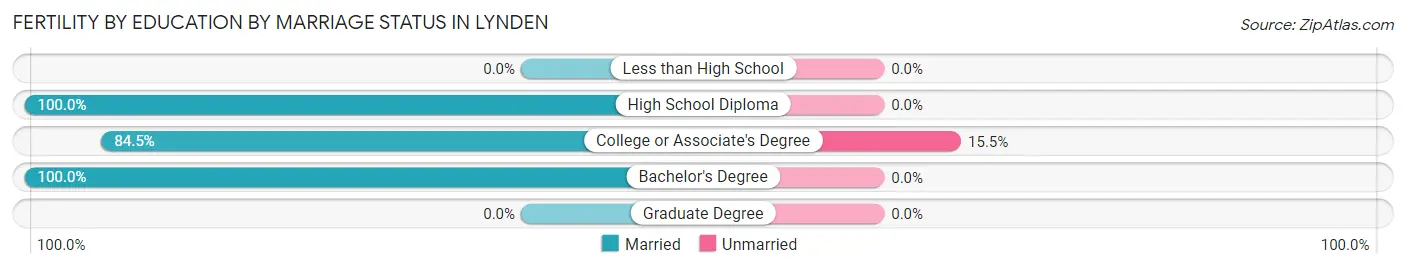
| Educational Attainment | Married | Unmarried |
| Less than High School | 0 (0.0%) | 0 (0.0%) |
| High School Diploma | 80 (100.0%) | 0 (0.0%) |
| College or Associate's Degree | 142 (84.5%) | 26 (15.5%) |
| Bachelor's Degree | 44 (100.0%) | 0 (0.0%) |
| Graduate Degree | 0 (0.0%) | 0 (0.0%) |
| Total | 266 (91.1%) | 26 (8.9%) |
Employment Characteristics in Lynden
Employment by Class of Employer in Lynden
Among the 7,300 employed individuals in Lynden, private company employees (5,004 | 68.5%), not-for-profit organizations (600 | 8.2%), and federal government employees (464 | 6.4%) make up the most common classes of employment.
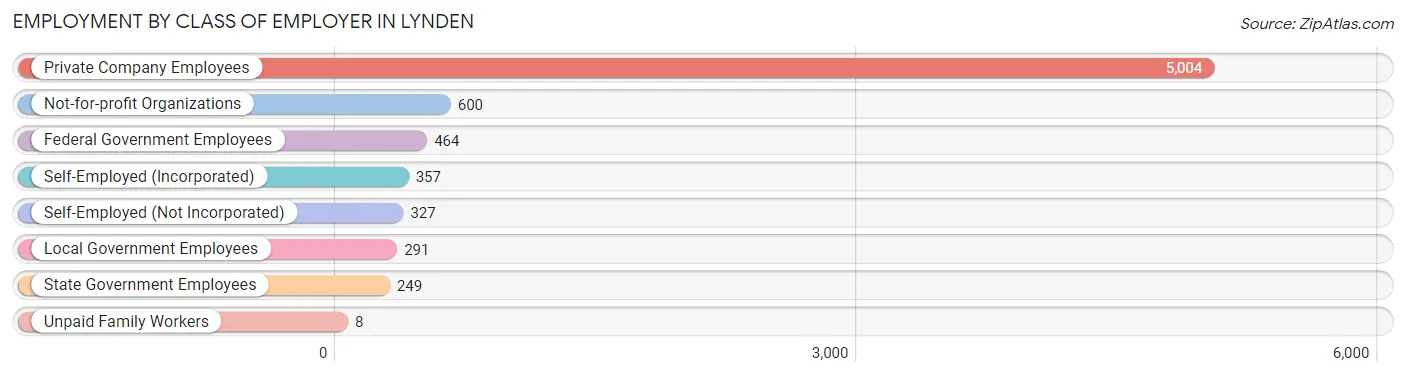
| Employer Class | # Employees | % Employees |
| Private Company Employees | 5,004 | 68.5% |
| Self-Employed (Incorporated) | 357 | 4.9% |
| Self-Employed (Not Incorporated) | 327 | 4.5% |
| Not-for-profit Organizations | 600 | 8.2% |
| Local Government Employees | 291 | 4.0% |
| State Government Employees | 249 | 3.4% |
| Federal Government Employees | 464 | 6.4% |
| Unpaid Family Workers | 8 | 0.1% |
| Total | 7,300 | 100.0% |
Employment Status by Age in Lynden
According to the labor force statistics for Lynden, out of the total population over 16 years of age (12,004), 66.0% or 7,923 individuals are in the labor force, with 4.5% or 357 of them unemployed. The age group with the highest labor force participation rate is 20 to 24 years, with 94.6% or 1,044 individuals in the labor force. Within the labor force, the 16 to 19 years age range has the highest percentage of unemployed individuals, with 16.4% or 93 of them being unemployed.
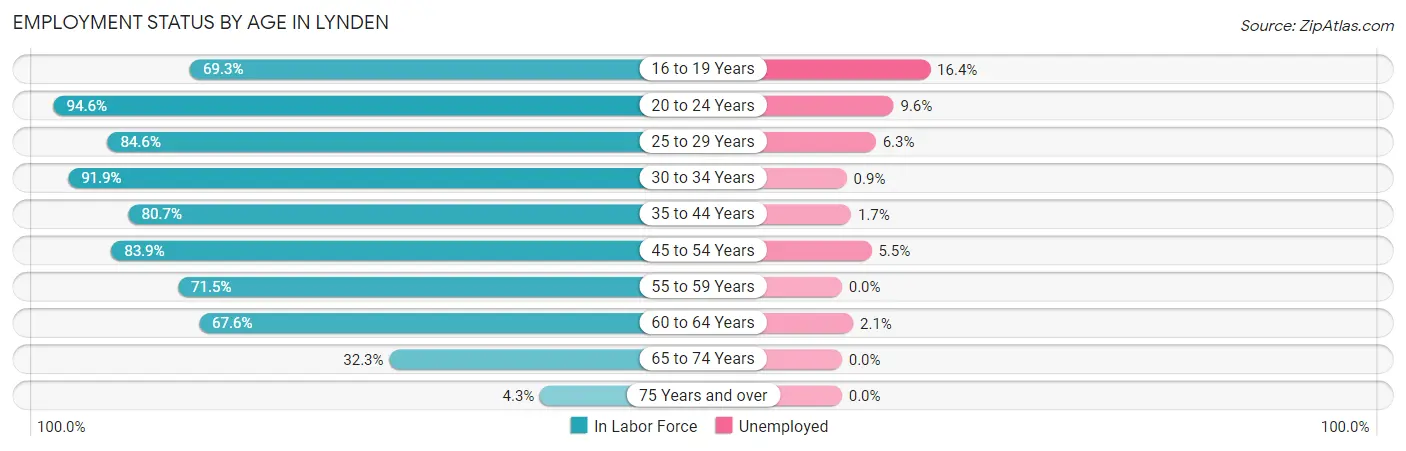
| Age Bracket | In Labor Force | Unemployed |
| 16 to 19 Years | 566 (69.3%) | 93 (16.4%) |
| 20 to 24 Years | 1,044 (94.6%) | 100 (9.6%) |
| 25 to 29 Years | 936 (84.6%) | 59 (6.3%) |
| 30 to 34 Years | 814 (91.9%) | 7 (0.9%) |
| 35 to 44 Years | 1,712 (80.7%) | 29 (1.7%) |
| 45 to 54 Years | 1,045 (83.9%) | 57 (5.5%) |
| 55 to 59 Years | 559 (71.5%) | 0 (0.0%) |
| 60 to 64 Years | 698 (67.6%) | 15 (2.1%) |
| 65 to 74 Years | 487 (32.3%) | 0 (0.0%) |
| 75 Years and over | 60 (4.3%) | 0 (0.0%) |
| Total | 7,923 (66.0%) | 357 (4.5%) |
Employment Status by Educational Attainment in Lynden
According to labor force statistics for Lynden, 80.3% of individuals (5,760) out of the total population between 25 and 64 years of age (7,173) are in the labor force, with 2.9% or 167 of them being unemployed. The group with the highest labor force participation rate are those with the educational attainment of bachelor's degree or higher, with 83.8% or 1,619 individuals in the labor force. Within the labor force, individuals with college / associate degree education have the highest percentage of unemployment, with 6.5% or 143 of them being unemployed.
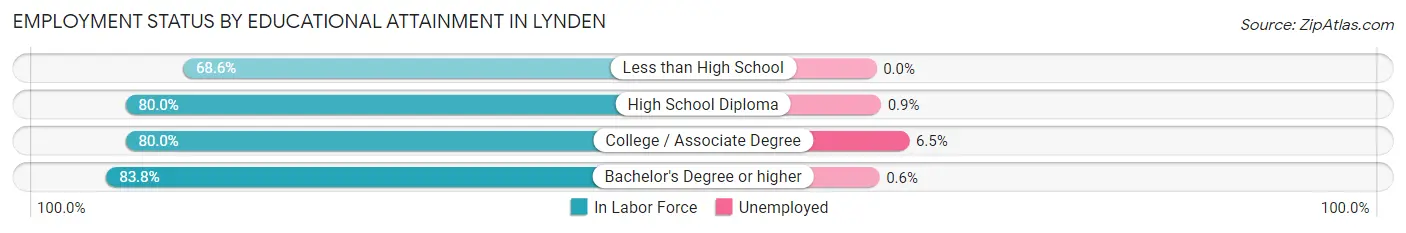
| Educational Attainment | In Labor Force | Unemployed |
| Less than High School | 282 (68.6%) | 0 (0.0%) |
| High School Diploma | 1,661 (80.0%) | 19 (0.9%) |
| College / Associate Degree | 2,203 (80.0%) | 179 (6.5%) |
| Bachelor's Degree or higher | 1,619 (83.8%) | 12 (0.6%) |
| Total | 5,760 (80.3%) | 208 (2.9%) |
Employment Occupations by Sex in Lynden
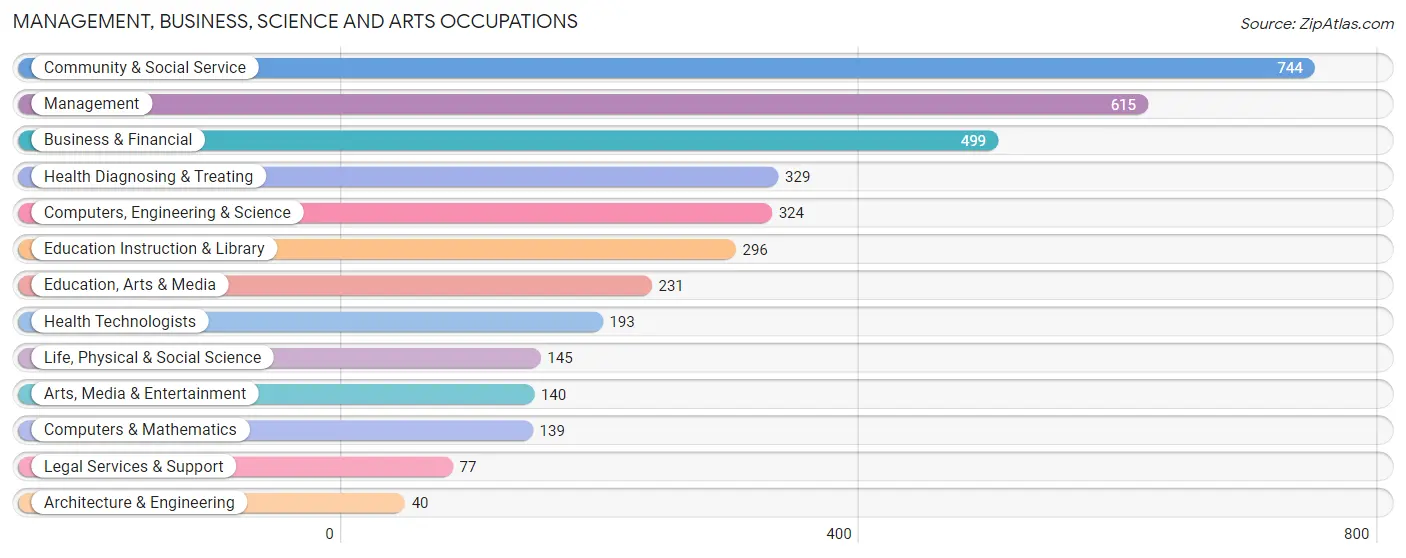
Management, Business, Science and Arts Occupations
The most common Management, Business, Science and Arts occupations in Lynden are Community & Social Service (744 | 9.8%), Management (615 | 8.1%), Business & Financial (499 | 6.6%), Health Diagnosing & Treating (329 | 4.3%), and Computers, Engineering & Science (324 | 4.3%).
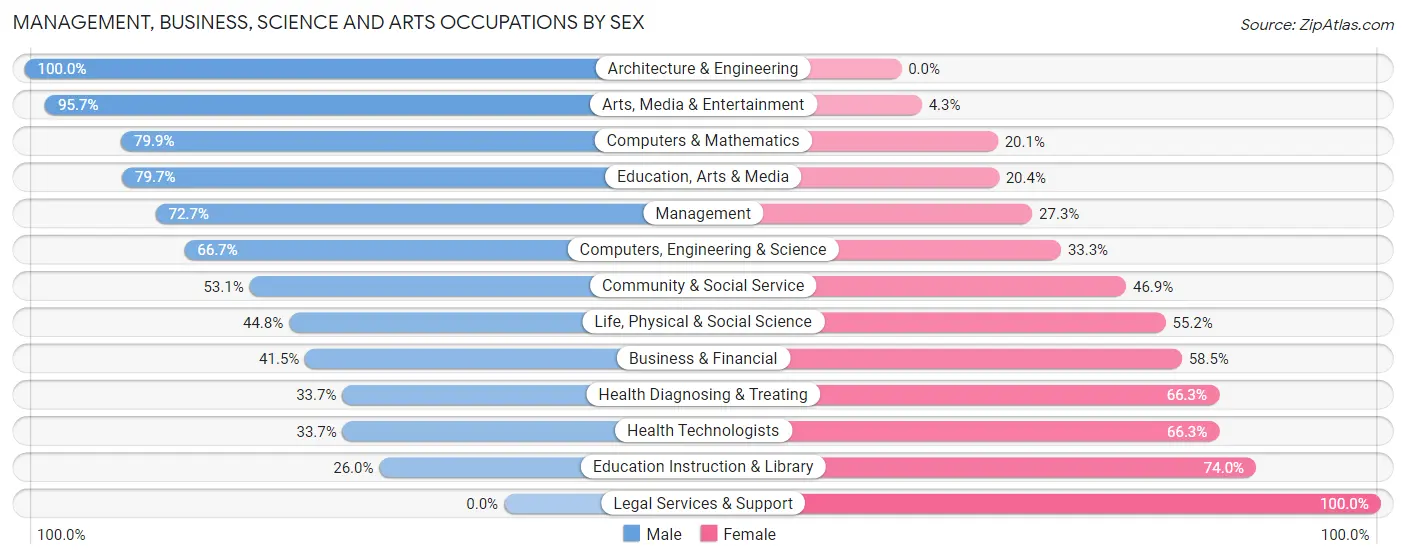
Management, Business, Science and Arts Occupations by Sex
Within the Management, Business, Science and Arts occupations in Lynden, the most male-oriented occupations are Architecture & Engineering (100.0%), Arts, Media & Entertainment (95.7%), and Computers & Mathematics (79.9%), while the most female-oriented occupations are Legal Services & Support (100.0%), Education Instruction & Library (74.0%), and Health Technologists (66.3%).
| Occupation | Male | Female |
| Management | 447 (72.7%) | 168 (27.3%) |
| Business & Financial | 207 (41.5%) | 292 (58.5%) |
| Computers, Engineering & Science | 216 (66.7%) | 108 (33.3%) |
| Computers & Mathematics | 111 (79.9%) | 28 (20.1%) |
| Architecture & Engineering | 40 (100.0%) | 0 (0.0%) |
| Life, Physical & Social Science | 65 (44.8%) | 80 (55.2%) |
| Community & Social Service | 395 (53.1%) | 349 (46.9%) |
| Education, Arts & Media | 184 (79.6%) | 47 (20.3%) |
| Legal Services & Support | 0 (0.0%) | 77 (100.0%) |
| Education Instruction & Library | 77 (26.0%) | 219 (74.0%) |
| Arts, Media & Entertainment | 134 (95.7%) | 6 (4.3%) |
| Health Diagnosing & Treating | 111 (33.7%) | 218 (66.3%) |
| Health Technologists | 65 (33.7%) | 128 (66.3%) |
| Total (Category) | 1,376 (54.8%) | 1,135 (45.2%) |
| Total (Overall) | 4,257 (56.3%) | 3,303 (43.7%) |
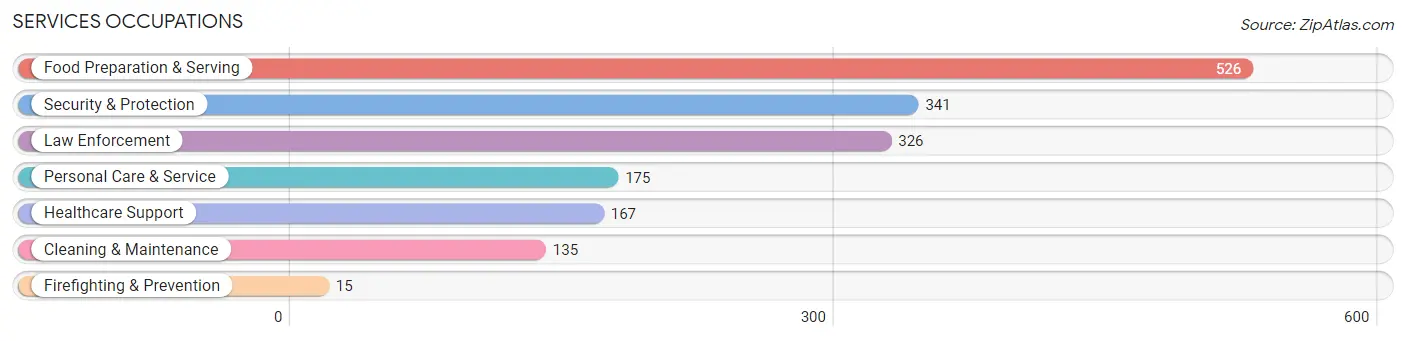
Services Occupations
The most common Services occupations in Lynden are Food Preparation & Serving (526 | 7.0%), Security & Protection (341 | 4.5%), Law Enforcement (326 | 4.3%), Personal Care & Service (175 | 2.3%), and Healthcare Support (167 | 2.2%).
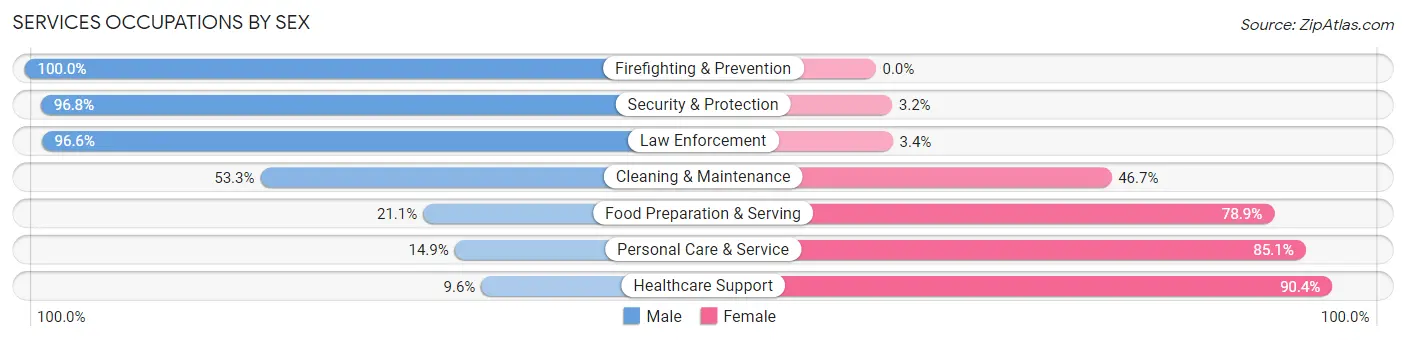
Services Occupations by Sex
Within the Services occupations in Lynden, the most male-oriented occupations are Firefighting & Prevention (100.0%), Security & Protection (96.8%), and Law Enforcement (96.6%), while the most female-oriented occupations are Healthcare Support (90.4%), Personal Care & Service (85.1%), and Food Preparation & Serving (78.9%).
| Occupation | Male | Female |
| Healthcare Support | 16 (9.6%) | 151 (90.4%) |
| Security & Protection | 330 (96.8%) | 11 (3.2%) |
| Firefighting & Prevention | 15 (100.0%) | 0 (0.0%) |
| Law Enforcement | 315 (96.6%) | 11 (3.4%) |
| Food Preparation & Serving | 111 (21.1%) | 415 (78.9%) |
| Cleaning & Maintenance | 72 (53.3%) | 63 (46.7%) |
| Personal Care & Service | 26 (14.9%) | 149 (85.1%) |
| Total (Category) | 555 (41.3%) | 789 (58.7%) |
| Total (Overall) | 4,257 (56.3%) | 3,303 (43.7%) |
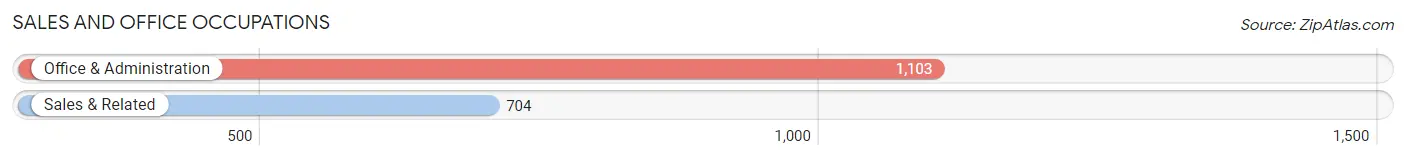
Sales and Office Occupations
The most common Sales and Office occupations in Lynden are Office & Administration (1,103 | 14.6%), and Sales & Related (704 | 9.3%).
Sales and Office Occupations by Sex
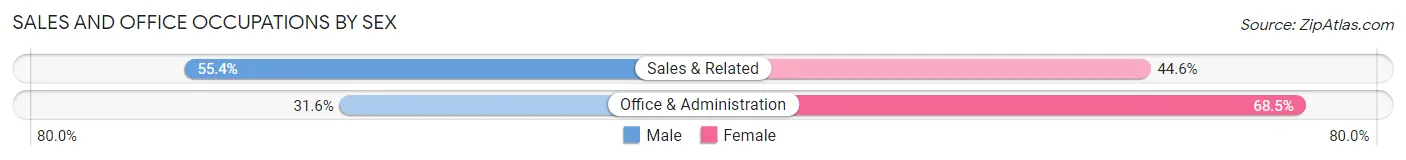
| Occupation | Male | Female |
| Sales & Related | 390 (55.4%) | 314 (44.6%) |
| Office & Administration | 348 (31.6%) | 755 (68.4%) |
| Total (Category) | 738 (40.8%) | 1,069 (59.2%) |
| Total (Overall) | 4,257 (56.3%) | 3,303 (43.7%) |
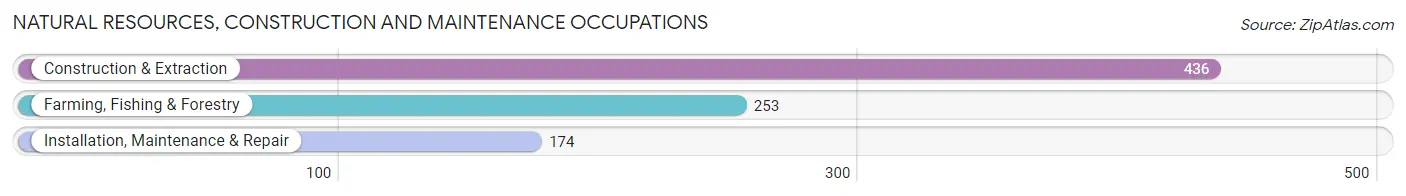
Natural Resources, Construction and Maintenance Occupations
The most common Natural Resources, Construction and Maintenance occupations in Lynden are Construction & Extraction (436 | 5.8%), Farming, Fishing & Forestry (253 | 3.4%), and Installation, Maintenance & Repair (174 | 2.3%).
Natural Resources, Construction and Maintenance Occupations by Sex
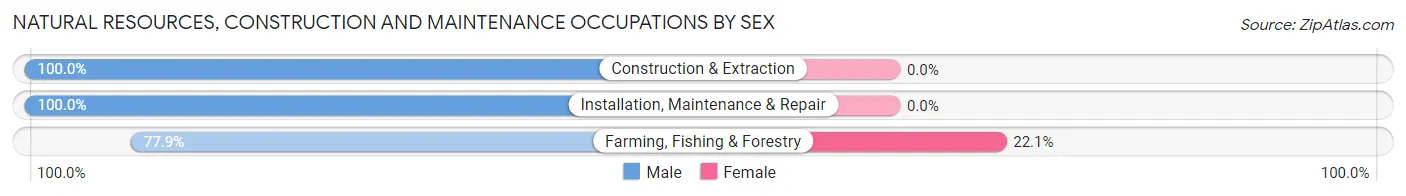
| Occupation | Male | Female |
| Farming, Fishing & Forestry | 197 (77.9%) | 56 (22.1%) |
| Construction & Extraction | 436 (100.0%) | 0 (0.0%) |
| Installation, Maintenance & Repair | 174 (100.0%) | 0 (0.0%) |
| Total (Category) | 807 (93.5%) | 56 (6.5%) |
| Total (Overall) | 4,257 (56.3%) | 3,303 (43.7%) |
Production, Transportation and Moving Occupations
The most common Production, Transportation and Moving occupations in Lynden are Material Moving (403 | 5.3%), Production (326 | 4.3%), and Transportation (306 | 4.1%).
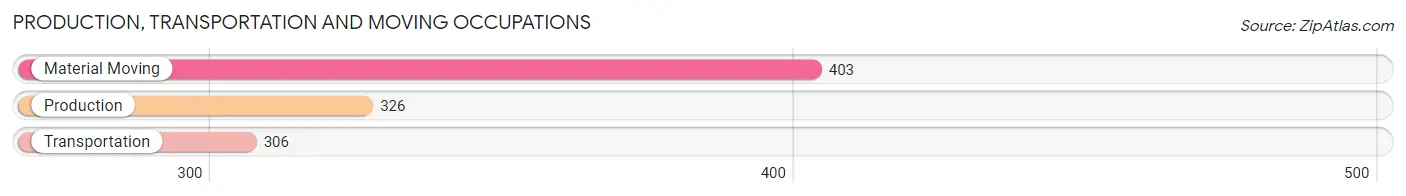
Production, Transportation and Moving Occupations by Sex
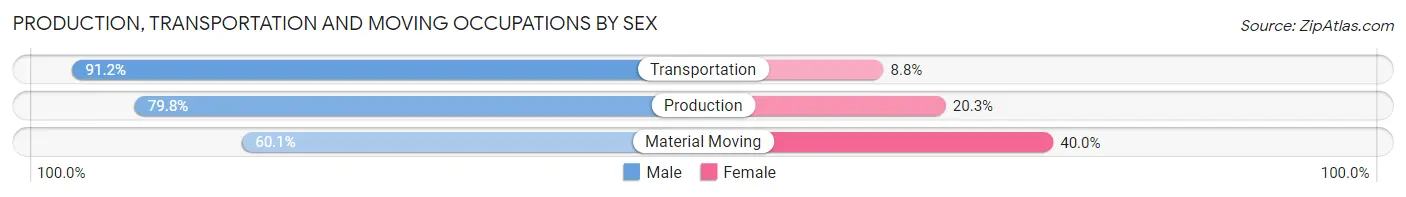
| Occupation | Male | Female |
| Production | 260 (79.7%) | 66 (20.3%) |
| Transportation | 279 (91.2%) | 27 (8.8%) |
| Material Moving | 242 (60.1%) | 161 (40.0%) |
| Total (Category) | 781 (75.5%) | 254 (24.5%) |
| Total (Overall) | 4,257 (56.3%) | 3,303 (43.7%) |
Employment Industries by Sex in Lynden
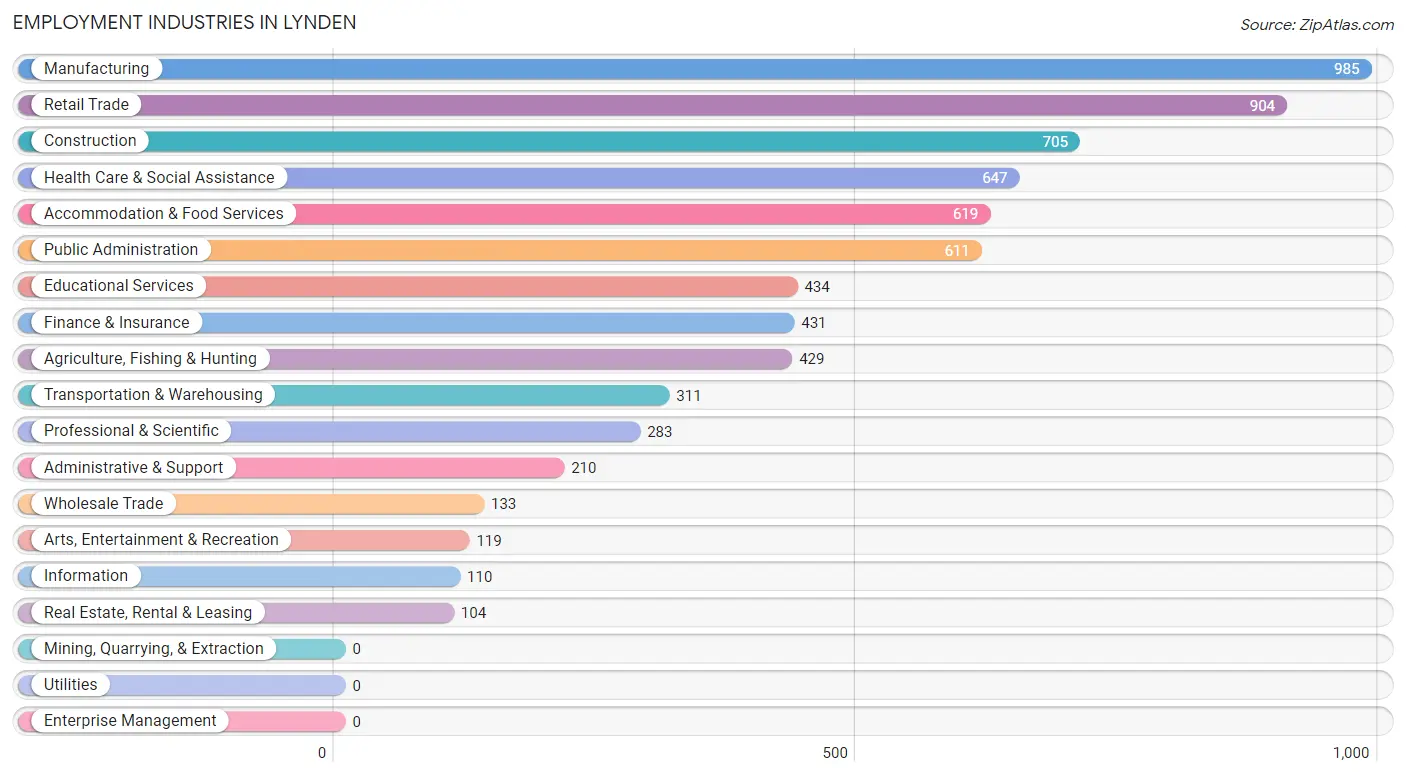
Employment Industries in Lynden
The major employment industries in Lynden include Manufacturing (985 | 13.0%), Retail Trade (904 | 12.0%), Construction (705 | 9.3%), Health Care & Social Assistance (647 | 8.6%), and Accommodation & Food Services (619 | 8.2%).
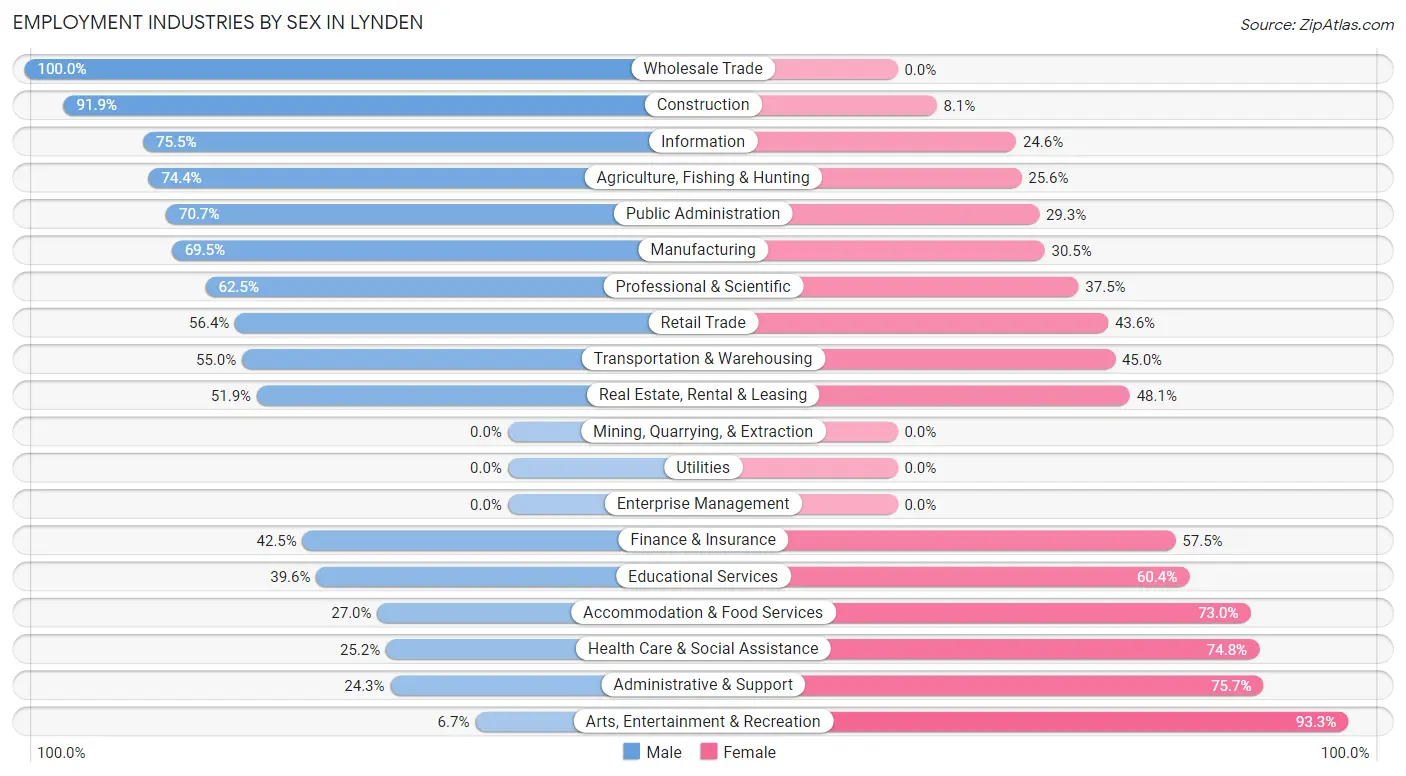
Employment Industries by Sex in Lynden
The Lynden industries that see more men than women are Wholesale Trade (100.0%), Construction (91.9%), and Information (75.4%), whereas the industries that tend to have a higher number of women are Arts, Entertainment & Recreation (93.3%), Administrative & Support (75.7%), and Health Care & Social Assistance (74.8%).
| Industry | Male | Female |
| Agriculture, Fishing & Hunting | 319 (74.4%) | 110 (25.6%) |
| Mining, Quarrying, & Extraction | 0 (0.0%) | 0 (0.0%) |
| Construction | 648 (91.9%) | 57 (8.1%) |
| Manufacturing | 685 (69.5%) | 300 (30.5%) |
| Wholesale Trade | 133 (100.0%) | 0 (0.0%) |
| Retail Trade | 510 (56.4%) | 394 (43.6%) |
| Transportation & Warehousing | 171 (55.0%) | 140 (45.0%) |
| Utilities | 0 (0.0%) | 0 (0.0%) |
| Information | 83 (75.4%) | 27 (24.5%) |
| Finance & Insurance | 183 (42.5%) | 248 (57.5%) |
| Real Estate, Rental & Leasing | 54 (51.9%) | 50 (48.1%) |
| Professional & Scientific | 177 (62.5%) | 106 (37.5%) |
| Enterprise Management | 0 (0.0%) | 0 (0.0%) |
| Administrative & Support | 51 (24.3%) | 159 (75.7%) |
| Educational Services | 172 (39.6%) | 262 (60.4%) |
| Health Care & Social Assistance | 163 (25.2%) | 484 (74.8%) |
| Arts, Entertainment & Recreation | 8 (6.7%) | 111 (93.3%) |
| Accommodation & Food Services | 167 (27.0%) | 452 (73.0%) |
| Public Administration | 432 (70.7%) | 179 (29.3%) |
| Total | 4,257 (56.3%) | 3,303 (43.7%) |
Education in Lynden
School Enrollment in Lynden
The most common levels of schooling among the 3,786 students in Lynden are high school (889 | 23.5%), elementary school (875 | 23.1%), and middle school (764 | 20.2%).
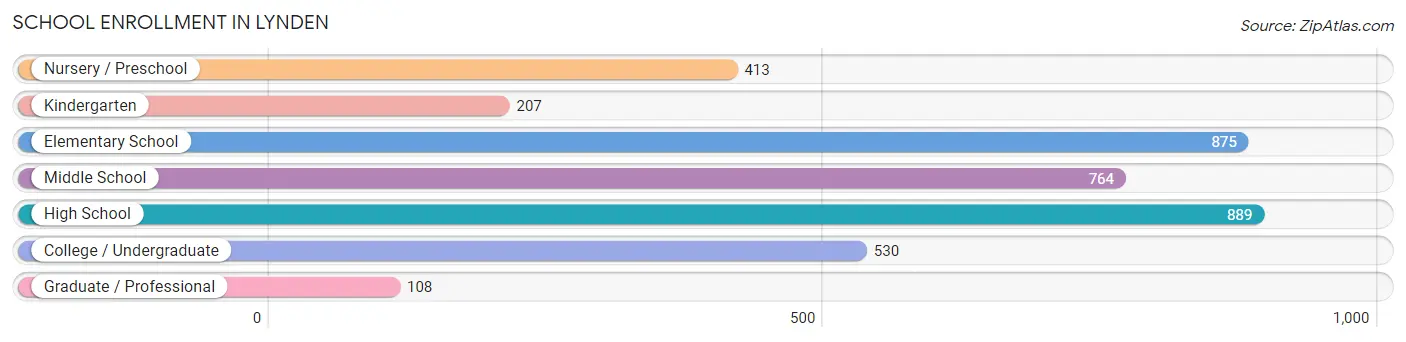
| School Level | # Students | % Students |
| Nursery / Preschool | 413 | 10.9% |
| Kindergarten | 207 | 5.5% |
| Elementary School | 875 | 23.1% |
| Middle School | 764 | 20.2% |
| High School | 889 | 23.5% |
| College / Undergraduate | 530 | 14.0% |
| Graduate / Professional | 108 | 2.9% |
| Total | 3,786 | 100.0% |
School Enrollment by Age by Funding Source in Lynden
Out of a total of 3,786 students who are enrolled in schools in Lynden, 765 (20.2%) attend a private institution, while the remaining 3,021 (79.8%) are enrolled in public schools. The age group of 3 to 4 year olds has the highest likelihood of being enrolled in private schools, with 226 (67.7% in the age bracket) enrolled. Conversely, the age group of 20 to 24 year olds has the lowest likelihood of being enrolled in a private school, with 323 (100.0% in the age bracket) attending a public institution.
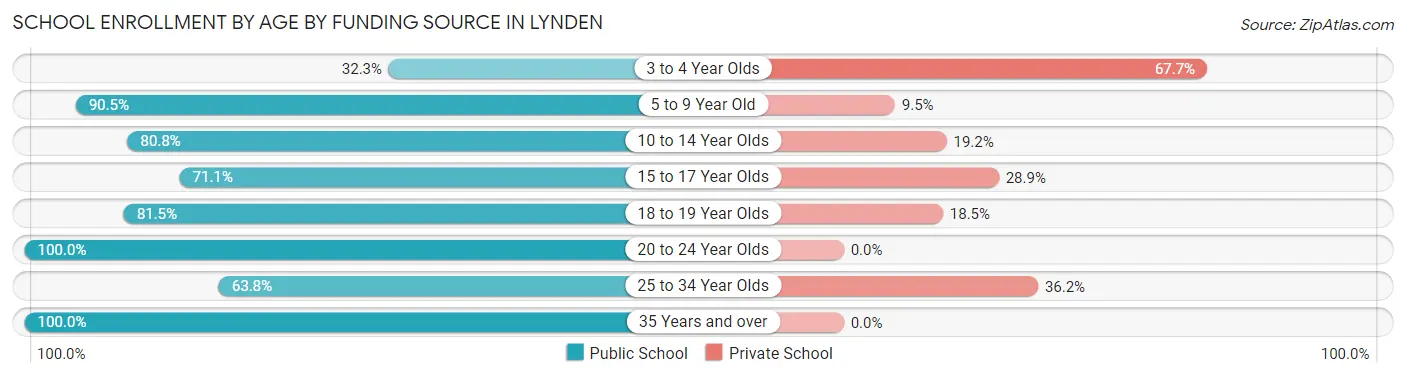
| Age Bracket | Public School | Private School |
| 3 to 4 Year Olds | 108 (32.3%) | 226 (67.7%) |
| 5 to 9 Year Old | 959 (90.5%) | 101 (9.5%) |
| 10 to 14 Year Olds | 865 (80.8%) | 205 (19.2%) |
| 15 to 17 Year Olds | 399 (71.1%) | 162 (28.9%) |
| 18 to 19 Year Olds | 150 (81.5%) | 34 (18.5%) |
| 20 to 24 Year Olds | 323 (100.0%) | 0 (0.0%) |
| 25 to 34 Year Olds | 67 (63.8%) | 38 (36.2%) |
| 35 Years and over | 149 (100.0%) | 0 (0.0%) |
| Total | 3,021 (79.8%) | 765 (20.2%) |
Educational Attainment by Field of Study in Lynden
Business (643 | 21.3%), education (402 | 13.3%), liberal arts & history (353 | 11.7%), arts & humanities (267 | 8.8%), and social sciences (225 | 7.5%) are the most common fields of study among 3,018 individuals in Lynden who have obtained a bachelor's degree or higher.
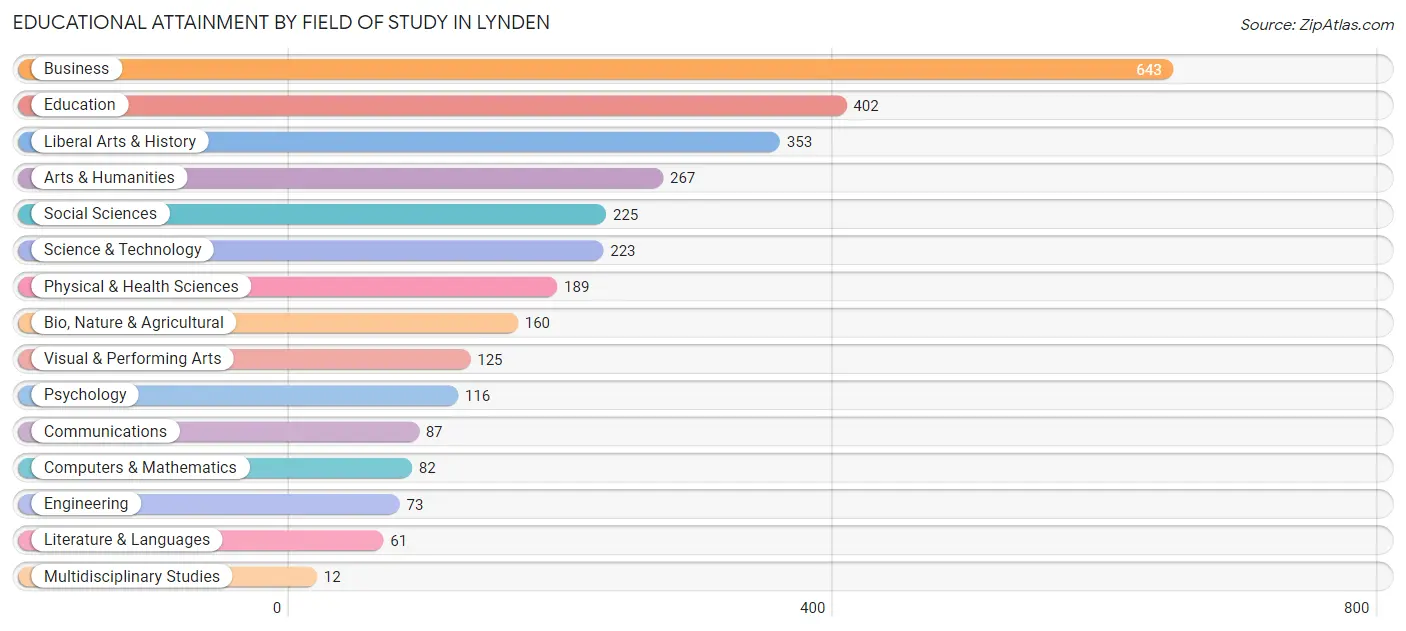
| Field of Study | # Graduates | % Graduates |
| Computers & Mathematics | 82 | 2.7% |
| Bio, Nature & Agricultural | 160 | 5.3% |
| Physical & Health Sciences | 189 | 6.3% |
| Psychology | 116 | 3.8% |
| Social Sciences | 225 | 7.5% |
| Engineering | 73 | 2.4% |
| Multidisciplinary Studies | 12 | 0.4% |
| Science & Technology | 223 | 7.4% |
| Business | 643 | 21.3% |
| Education | 402 | 13.3% |
| Literature & Languages | 61 | 2.0% |
| Liberal Arts & History | 353 | 11.7% |
| Visual & Performing Arts | 125 | 4.1% |
| Communications | 87 | 2.9% |
| Arts & Humanities | 267 | 8.8% |
| Total | 3,018 | 100.0% |
Transportation & Commute in Lynden
Vehicle Availability by Sex in Lynden
The most prevalent vehicle ownership categories in Lynden are males with 2 vehicles (1,734, accounting for 42.0%) and females with 2 vehicles (1,129, making up 54.8%).
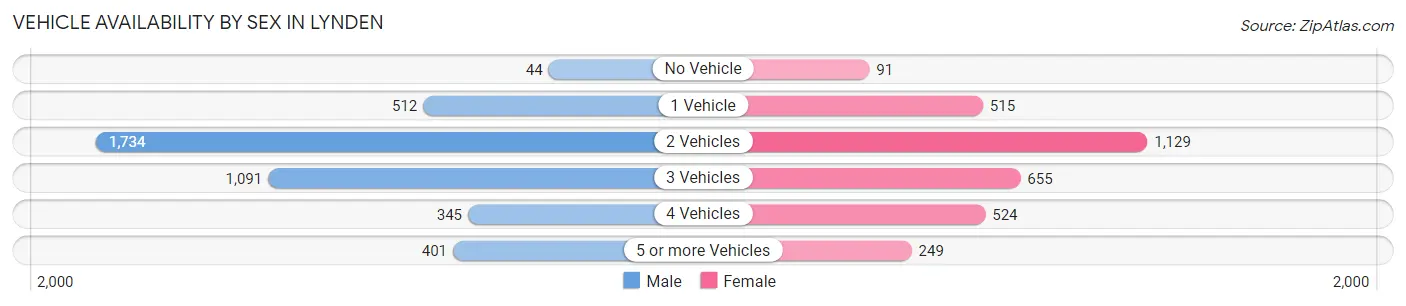
| Vehicles Available | Male | Female |
| No Vehicle | 44 (1.1%) | 91 (2.9%) |
| 1 Vehicle | 512 (12.4%) | 515 (16.3%) |
| 2 Vehicles | 1,734 (42.0%) | 1,129 (35.7%) |
| 3 Vehicles | 1,091 (26.4%) | 655 (20.7%) |
| 4 Vehicles | 345 (8.4%) | 524 (16.6%) |
| 5 or more Vehicles | 401 (9.7%) | 249 (7.9%) |
| Total | 4,127 (100.0%) | 3,163 (100.0%) |
Commute Time in Lynden
The most frequently occuring commute durations in Lynden are 30 to 34 minutes (1,296 commuters, 19.2%), 5 to 9 minutes (1,231 commuters, 18.3%), and 20 to 24 minutes (1,011 commuters, 15.0%).
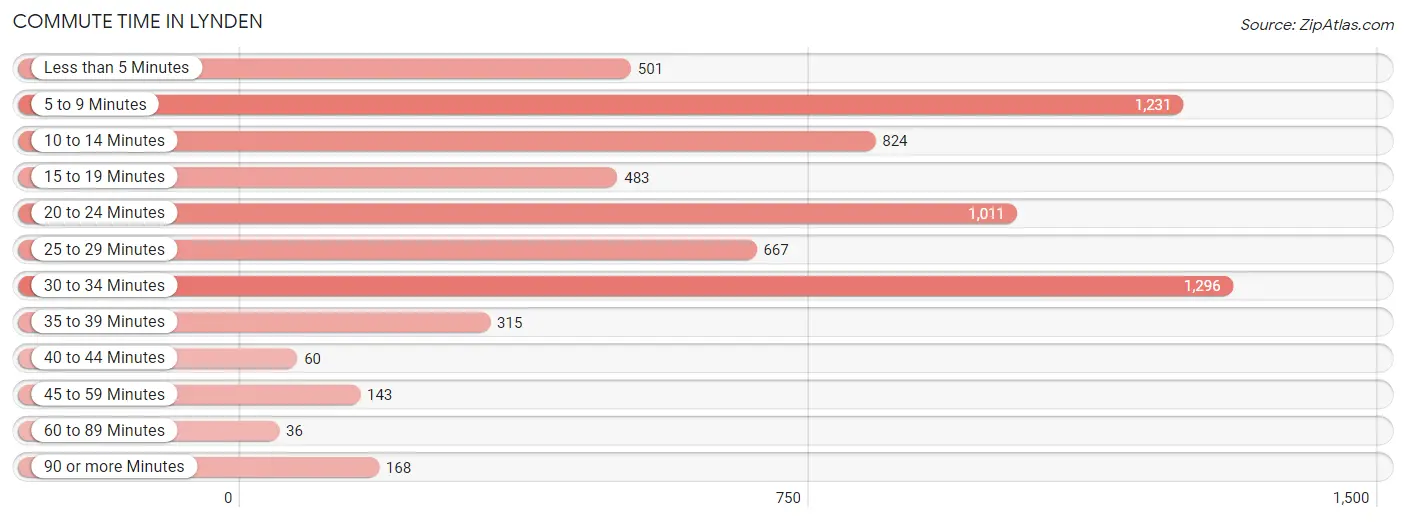
| Commute Time | # Commuters | % Commuters |
| Less than 5 Minutes | 501 | 7.4% |
| 5 to 9 Minutes | 1,231 | 18.3% |
| 10 to 14 Minutes | 824 | 12.2% |
| 15 to 19 Minutes | 483 | 7.2% |
| 20 to 24 Minutes | 1,011 | 15.0% |
| 25 to 29 Minutes | 667 | 9.9% |
| 30 to 34 Minutes | 1,296 | 19.2% |
| 35 to 39 Minutes | 315 | 4.7% |
| 40 to 44 Minutes | 60 | 0.9% |
| 45 to 59 Minutes | 143 | 2.1% |
| 60 to 89 Minutes | 36 | 0.5% |
| 90 or more Minutes | 168 | 2.5% |
Commute Time by Sex in Lynden
The most common commute times in Lynden are 30 to 34 minutes (748 commuters, 19.0%) for males and 5 to 9 minutes (738 commuters, 26.4%) for females.
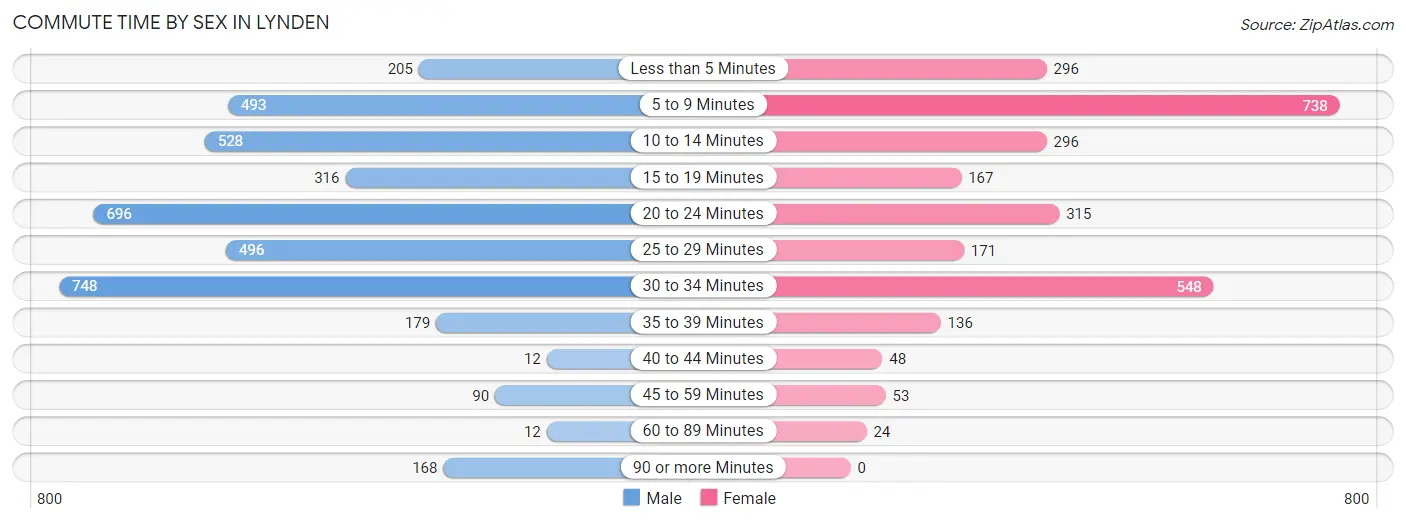
| Commute Time | Male | Female |
| Less than 5 Minutes | 205 (5.2%) | 296 (10.6%) |
| 5 to 9 Minutes | 493 (12.5%) | 738 (26.4%) |
| 10 to 14 Minutes | 528 (13.4%) | 296 (10.6%) |
| 15 to 19 Minutes | 316 (8.0%) | 167 (6.0%) |
| 20 to 24 Minutes | 696 (17.6%) | 315 (11.3%) |
| 25 to 29 Minutes | 496 (12.6%) | 171 (6.1%) |
| 30 to 34 Minutes | 748 (19.0%) | 548 (19.6%) |
| 35 to 39 Minutes | 179 (4.5%) | 136 (4.9%) |
| 40 to 44 Minutes | 12 (0.3%) | 48 (1.7%) |
| 45 to 59 Minutes | 90 (2.3%) | 53 (1.9%) |
| 60 to 89 Minutes | 12 (0.3%) | 24 (0.9%) |
| 90 or more Minutes | 168 (4.3%) | 0 (0.0%) |
Time of Departure to Work by Sex in Lynden
The most frequent times of departure to work in Lynden are 7:00 AM to 7:29 AM (638, 16.2%) for males and 7:00 AM to 7:29 AM (417, 14.9%) for females.
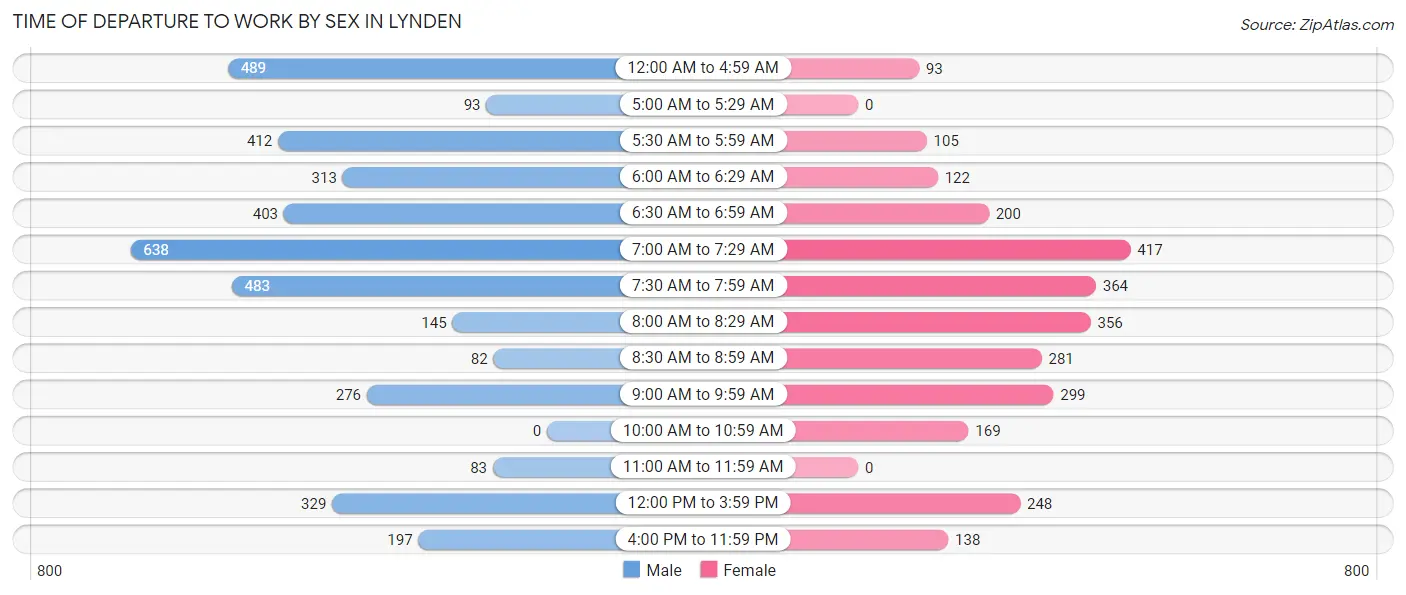
| Time of Departure | Male | Female |
| 12:00 AM to 4:59 AM | 489 (12.4%) | 93 (3.3%) |
| 5:00 AM to 5:29 AM | 93 (2.4%) | 0 (0.0%) |
| 5:30 AM to 5:59 AM | 412 (10.4%) | 105 (3.8%) |
| 6:00 AM to 6:29 AM | 313 (7.9%) | 122 (4.4%) |
| 6:30 AM to 6:59 AM | 403 (10.2%) | 200 (7.2%) |
| 7:00 AM to 7:29 AM | 638 (16.2%) | 417 (14.9%) |
| 7:30 AM to 7:59 AM | 483 (12.2%) | 364 (13.0%) |
| 8:00 AM to 8:29 AM | 145 (3.7%) | 356 (12.8%) |
| 8:30 AM to 8:59 AM | 82 (2.1%) | 281 (10.1%) |
| 9:00 AM to 9:59 AM | 276 (7.0%) | 299 (10.7%) |
| 10:00 AM to 10:59 AM | 0 (0.0%) | 169 (6.0%) |
| 11:00 AM to 11:59 AM | 83 (2.1%) | 0 (0.0%) |
| 12:00 PM to 3:59 PM | 329 (8.3%) | 248 (8.9%) |
| 4:00 PM to 11:59 PM | 197 (5.0%) | 138 (4.9%) |
| Total | 3,943 (100.0%) | 2,792 (100.0%) |
Housing Occupancy in Lynden
Occupancy by Ownership in Lynden
Of the total 5,786 dwellings in Lynden, owner-occupied units account for 3,720 (64.3%), while renter-occupied units make up 2,066 (35.7%).
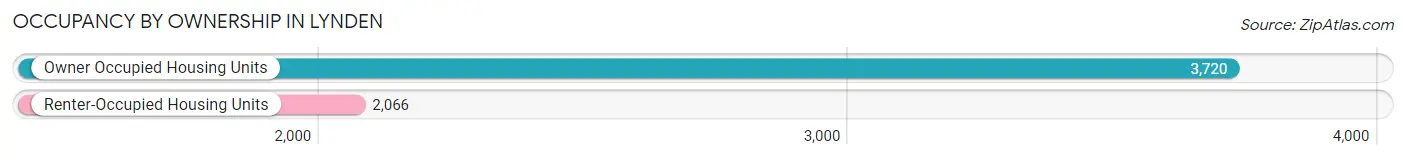
| Occupancy | # Housing Units | % Housing Units |
| Owner Occupied Housing Units | 3,720 | 64.3% |
| Renter-Occupied Housing Units | 2,066 | 35.7% |
| Total Occupied Housing Units | 5,786 | 100.0% |
Occupancy by Household Size in Lynden
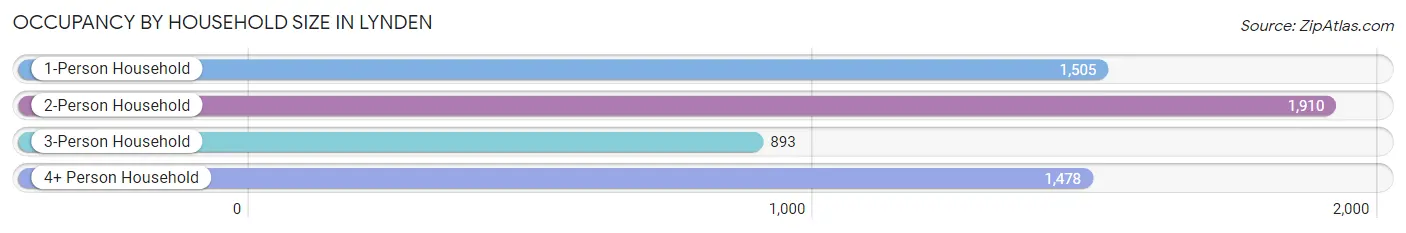
| Household Size | # Housing Units | % Housing Units |
| 1-Person Household | 1,505 | 26.0% |
| 2-Person Household | 1,910 | 33.0% |
| 3-Person Household | 893 | 15.4% |
| 4+ Person Household | 1,478 | 25.5% |
| Total Housing Units | 5,786 | 100.0% |
Occupancy by Ownership by Household Size in Lynden
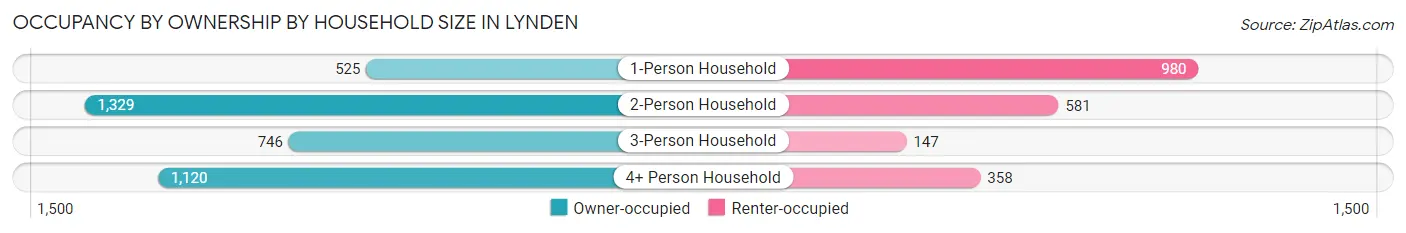
| Household Size | Owner-occupied | Renter-occupied |
| 1-Person Household | 525 (34.9%) | 980 (65.1%) |
| 2-Person Household | 1,329 (69.6%) | 581 (30.4%) |
| 3-Person Household | 746 (83.5%) | 147 (16.5%) |
| 4+ Person Household | 1,120 (75.8%) | 358 (24.2%) |
| Total Housing Units | 3,720 (64.3%) | 2,066 (35.7%) |
Occupancy by Educational Attainment in Lynden
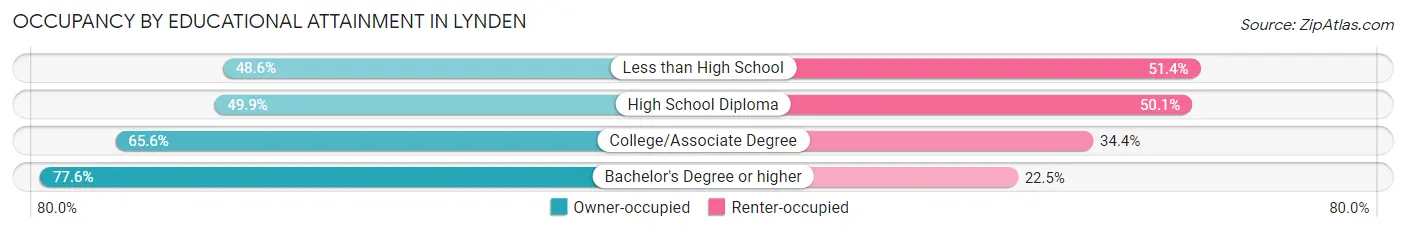
| Household Size | Owner-occupied | Renter-occupied |
| Less than High School | 187 (48.6%) | 198 (51.4%) |
| High School Diploma | 675 (49.9%) | 678 (50.1%) |
| College/Associate Degree | 1,542 (65.6%) | 809 (34.4%) |
| Bachelor's Degree or higher | 1,316 (77.5%) | 381 (22.5%) |
Occupancy by Age of Householder in Lynden
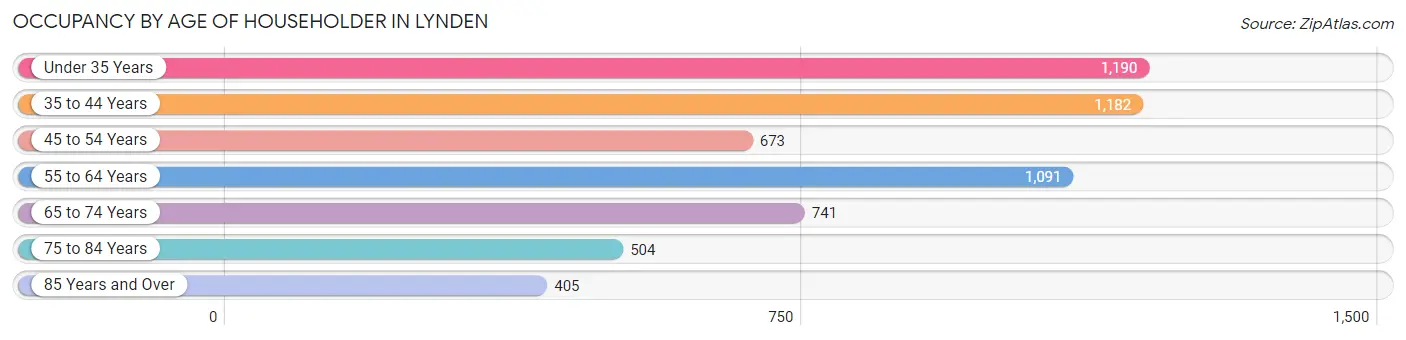
| Age Bracket | # Households | % Households |
| Under 35 Years | 1,190 | 20.6% |
| 35 to 44 Years | 1,182 | 20.4% |
| 45 to 54 Years | 673 | 11.6% |
| 55 to 64 Years | 1,091 | 18.9% |
| 65 to 74 Years | 741 | 12.8% |
| 75 to 84 Years | 504 | 8.7% |
| 85 Years and Over | 405 | 7.0% |
| Total | 5,786 | 100.0% |
Housing Finances in Lynden
Median Income by Occupancy in Lynden
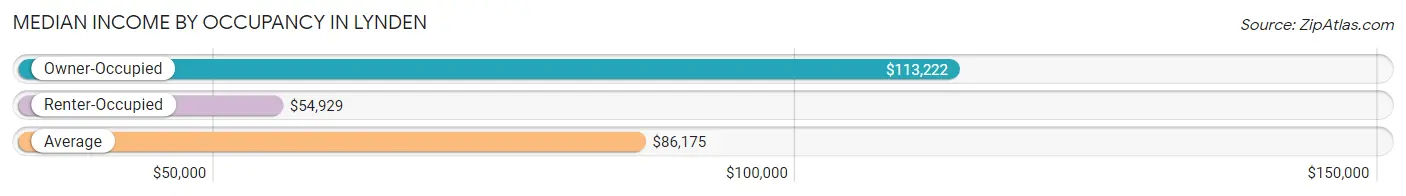
| Occupancy Type | # Households | Median Income |
| Owner-Occupied | 3,720 (64.3%) | $113,222 |
| Renter-Occupied | 2,066 (35.7%) | $54,929 |
| Average | 5,786 (100.0%) | $86,175 |
Occupancy by Householder Income Bracket in Lynden
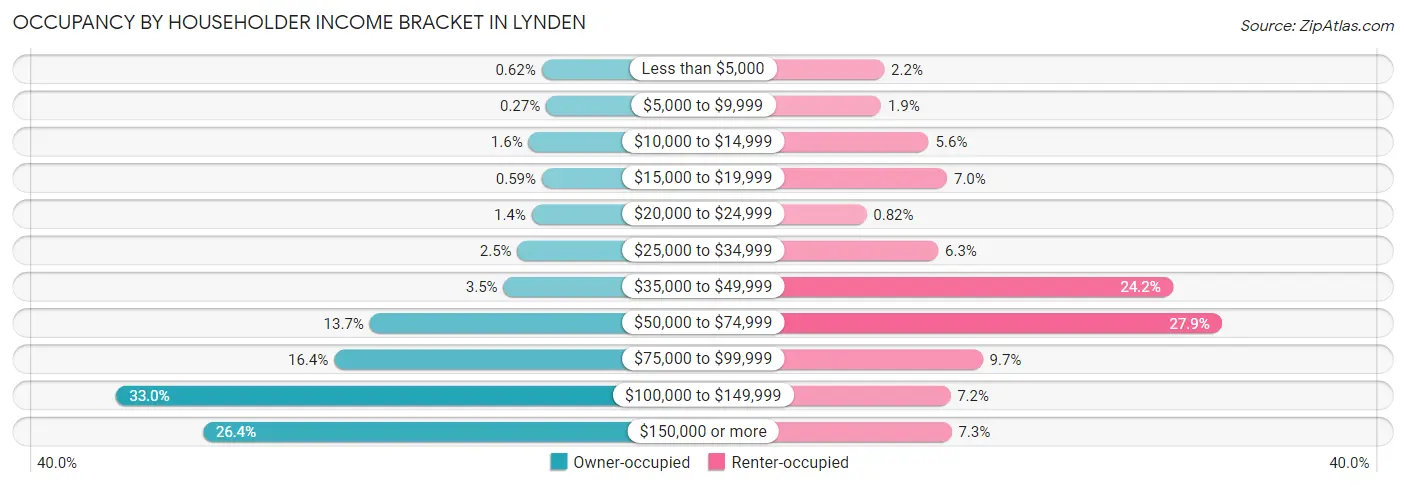
| Income Bracket | Owner-occupied | Renter-occupied |
| Less than $5,000 | 23 (0.6%) | 45 (2.2%) |
| $5,000 to $9,999 | 10 (0.3%) | 40 (1.9%) |
| $10,000 to $14,999 | 60 (1.6%) | 115 (5.6%) |
| $15,000 to $19,999 | 22 (0.6%) | 144 (7.0%) |
| $20,000 to $24,999 | 51 (1.4%) | 17 (0.8%) |
| $25,000 to $34,999 | 91 (2.5%) | 130 (6.3%) |
| $35,000 to $49,999 | 131 (3.5%) | 499 (24.1%) |
| $50,000 to $74,999 | 510 (13.7%) | 576 (27.9%) |
| $75,000 to $99,999 | 611 (16.4%) | 200 (9.7%) |
| $100,000 to $149,999 | 1,228 (33.0%) | 149 (7.2%) |
| $150,000 or more | 983 (26.4%) | 151 (7.3%) |
| Total | 3,720 (100.0%) | 2,066 (100.0%) |
Monthly Housing Cost Tiers in Lynden
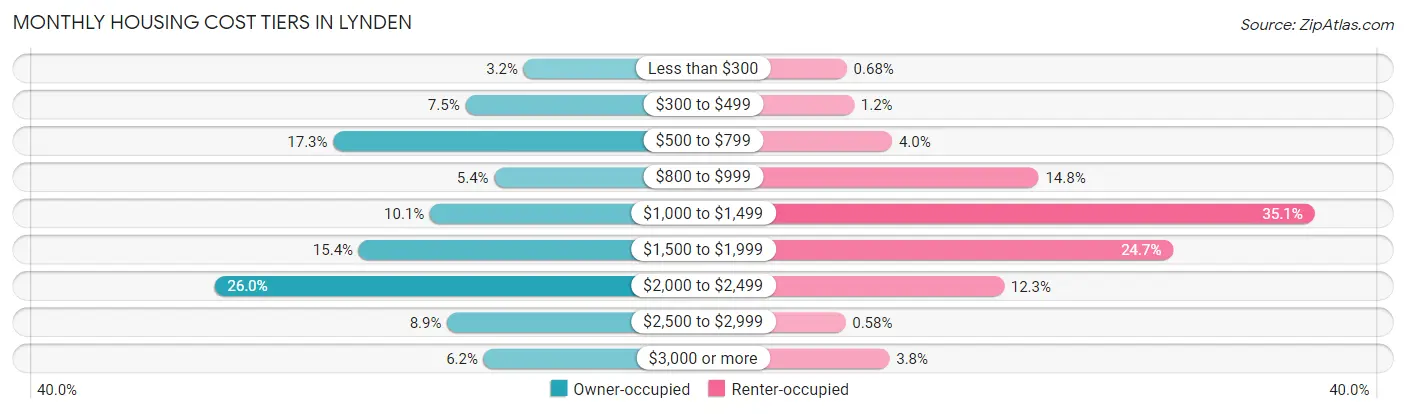
| Monthly Cost | Owner-occupied | Renter-occupied |
| Less than $300 | 120 (3.2%) | 14 (0.7%) |
| $300 to $499 | 280 (7.5%) | 25 (1.2%) |
| $500 to $799 | 642 (17.3%) | 83 (4.0%) |
| $800 to $999 | 201 (5.4%) | 306 (14.8%) |
| $1,000 to $1,499 | 377 (10.1%) | 726 (35.1%) |
| $1,500 to $1,999 | 572 (15.4%) | 511 (24.7%) |
| $2,000 to $2,499 | 968 (26.0%) | 253 (12.2%) |
| $2,500 to $2,999 | 330 (8.9%) | 12 (0.6%) |
| $3,000 or more | 230 (6.2%) | 79 (3.8%) |
| Total | 3,720 (100.0%) | 2,066 (100.0%) |
Physical Housing Characteristics in Lynden
Housing Structures in Lynden
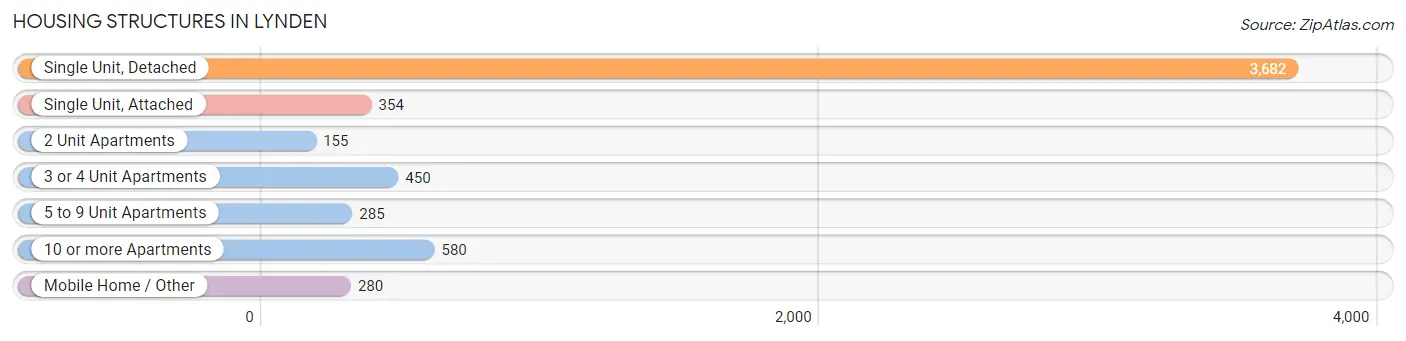
| Structure Type | # Housing Units | % Housing Units |
| Single Unit, Detached | 3,682 | 63.6% |
| Single Unit, Attached | 354 | 6.1% |
| 2 Unit Apartments | 155 | 2.7% |
| 3 or 4 Unit Apartments | 450 | 7.8% |
| 5 to 9 Unit Apartments | 285 | 4.9% |
| 10 or more Apartments | 580 | 10.0% |
| Mobile Home / Other | 280 | 4.8% |
| Total | 5,786 | 100.0% |
Housing Structures by Occupancy in Lynden
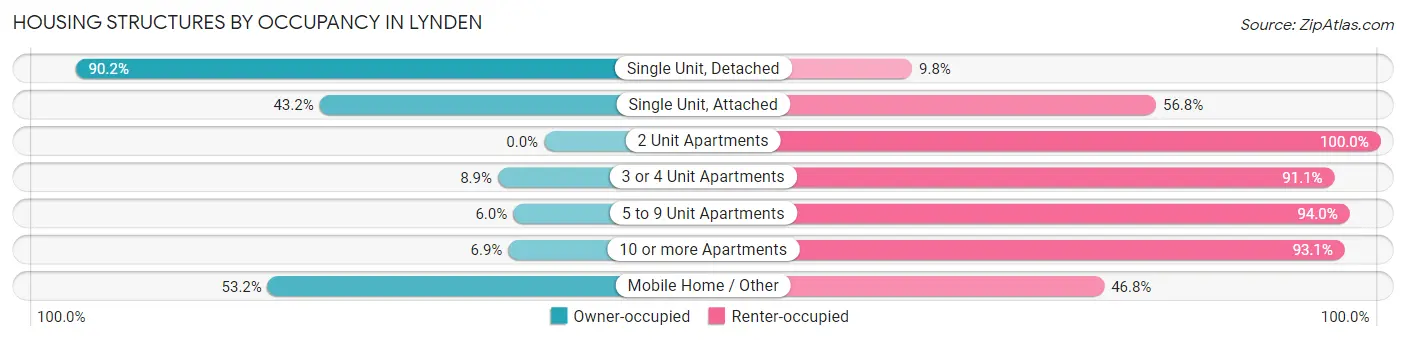
| Structure Type | Owner-occupied | Renter-occupied |
| Single Unit, Detached | 3,321 (90.2%) | 361 (9.8%) |
| Single Unit, Attached | 153 (43.2%) | 201 (56.8%) |
| 2 Unit Apartments | 0 (0.0%) | 155 (100.0%) |
| 3 or 4 Unit Apartments | 40 (8.9%) | 410 (91.1%) |
| 5 to 9 Unit Apartments | 17 (6.0%) | 268 (94.0%) |
| 10 or more Apartments | 40 (6.9%) | 540 (93.1%) |
| Mobile Home / Other | 149 (53.2%) | 131 (46.8%) |
| Total | 3,720 (64.3%) | 2,066 (35.7%) |
Housing Structures by Number of Rooms in Lynden
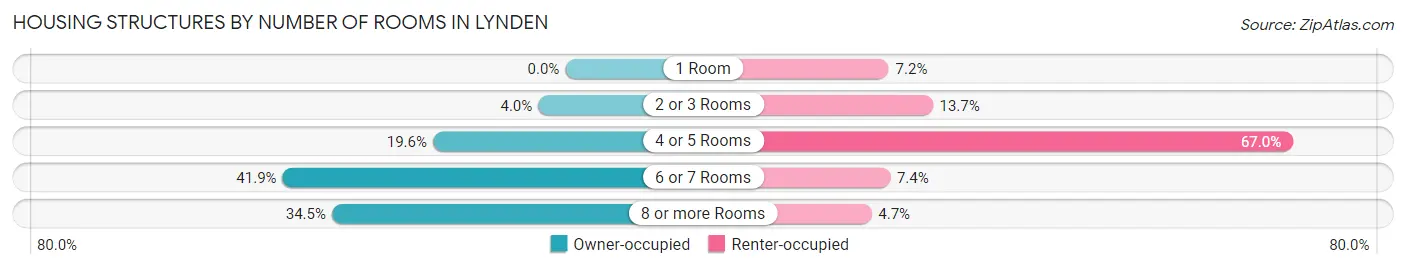
| Number of Rooms | Owner-occupied | Renter-occupied |
| 1 Room | 0 (0.0%) | 149 (7.2%) |
| 2 or 3 Rooms | 149 (4.0%) | 283 (13.7%) |
| 4 or 5 Rooms | 729 (19.6%) | 1,385 (67.0%) |
| 6 or 7 Rooms | 1,557 (41.8%) | 153 (7.4%) |
| 8 or more Rooms | 1,285 (34.5%) | 96 (4.6%) |
| Total | 3,720 (100.0%) | 2,066 (100.0%) |
Housing Structure by Heating Type in Lynden
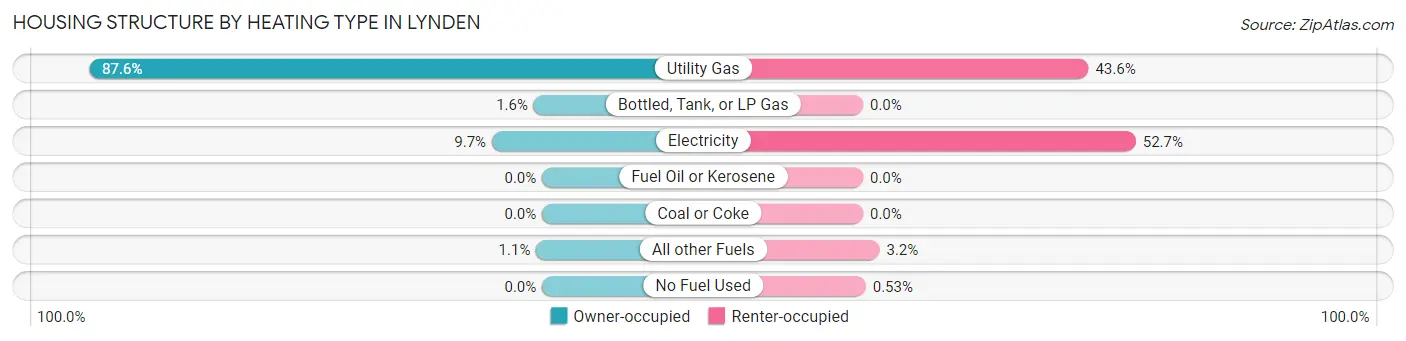
| Heating Type | Owner-occupied | Renter-occupied |
| Utility Gas | 3,257 (87.5%) | 900 (43.6%) |
| Bottled, Tank, or LP Gas | 60 (1.6%) | 0 (0.0%) |
| Electricity | 361 (9.7%) | 1,089 (52.7%) |
| Fuel Oil or Kerosene | 0 (0.0%) | 0 (0.0%) |
| Coal or Coke | 0 (0.0%) | 0 (0.0%) |
| All other Fuels | 42 (1.1%) | 66 (3.2%) |
| No Fuel Used | 0 (0.0%) | 11 (0.5%) |
| Total | 3,720 (100.0%) | 2,066 (100.0%) |
Household Vehicle Usage in Lynden
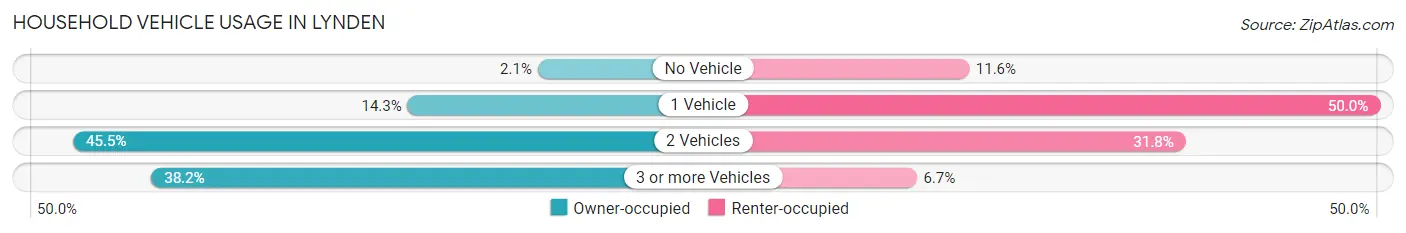
| Vehicles per Household | Owner-occupied | Renter-occupied |
| No Vehicle | 78 (2.1%) | 239 (11.6%) |
| 1 Vehicle | 530 (14.2%) | 1,032 (49.9%) |
| 2 Vehicles | 1,692 (45.5%) | 657 (31.8%) |
| 3 or more Vehicles | 1,420 (38.2%) | 138 (6.7%) |
| Total | 3,720 (100.0%) | 2,066 (100.0%) |
Real Estate & Mortgages in Lynden
Real Estate and Mortgage Overview in Lynden
| Characteristic | Without Mortgage | With Mortgage |
| Housing Units | 1,210 | 2,510 |
| Median Property Value | $465,600 | $483,300 |
| Median Household Income | $90,399 | $819 |
| Monthly Housing Costs | $576 | $230 |
| Real Estate Taxes | $3,360 | $40 |
Property Value by Mortgage Status in Lynden
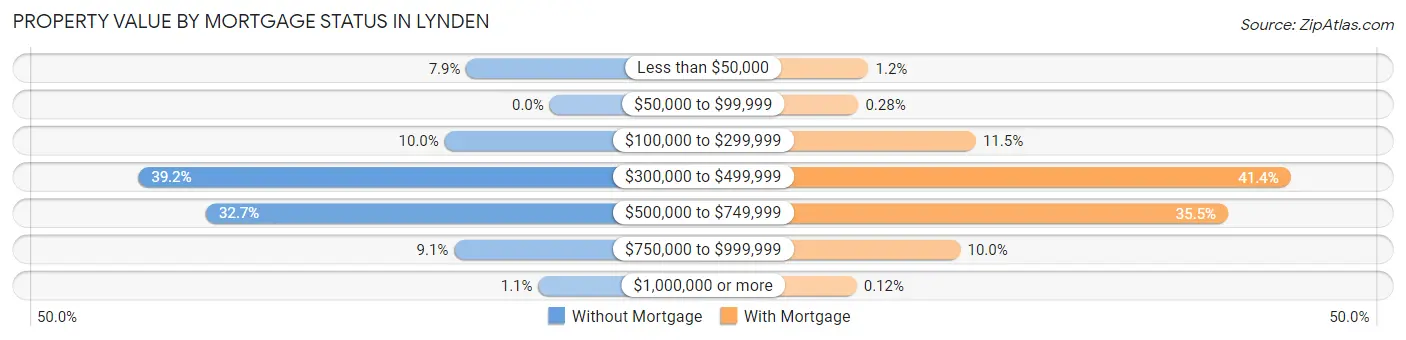
| Property Value | Without Mortgage | With Mortgage |
| Less than $50,000 | 96 (7.9%) | 31 (1.2%) |
| $50,000 to $99,999 | 0 (0.0%) | 7 (0.3%) |
| $100,000 to $299,999 | 121 (10.0%) | 288 (11.5%) |
| $300,000 to $499,999 | 474 (39.2%) | 1,040 (41.4%) |
| $500,000 to $749,999 | 396 (32.7%) | 890 (35.5%) |
| $750,000 to $999,999 | 110 (9.1%) | 251 (10.0%) |
| $1,000,000 or more | 13 (1.1%) | 3 (0.1%) |
| Total | 1,210 (100.0%) | 2,510 (100.0%) |
Household Income by Mortgage Status in Lynden
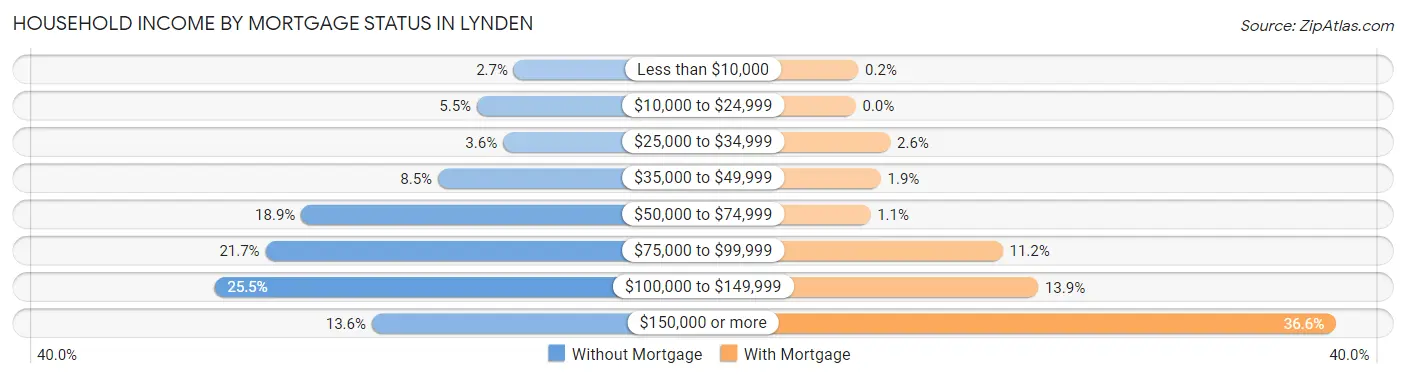
| Household Income | Without Mortgage | With Mortgage |
| Less than $10,000 | 33 (2.7%) | 5 (0.2%) |
| $10,000 to $24,999 | 67 (5.5%) | 0 (0.0%) |
| $25,000 to $34,999 | 43 (3.5%) | 66 (2.6%) |
| $35,000 to $49,999 | 103 (8.5%) | 48 (1.9%) |
| $50,000 to $74,999 | 229 (18.9%) | 28 (1.1%) |
| $75,000 to $99,999 | 262 (21.6%) | 281 (11.2%) |
| $100,000 to $149,999 | 309 (25.5%) | 349 (13.9%) |
| $150,000 or more | 164 (13.6%) | 919 (36.6%) |
| Total | 1,210 (100.0%) | 2,510 (100.0%) |
Property Value to Household Income Ratio in Lynden
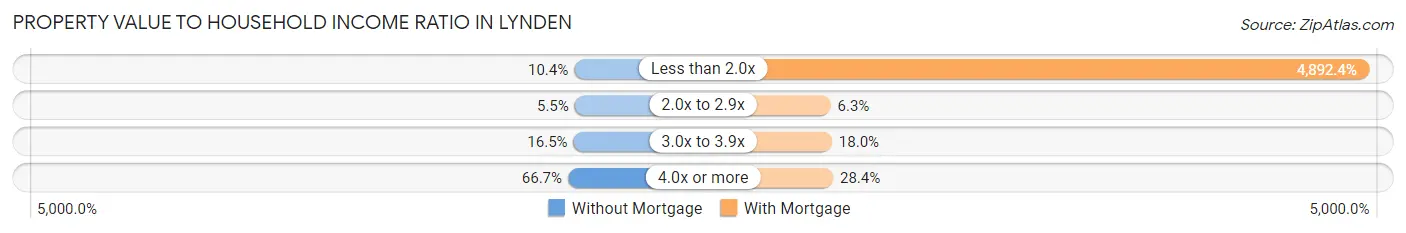
| Value-to-Income Ratio | Without Mortgage | With Mortgage |
| Less than 2.0x | 126 (10.4%) | 122,800 (4,892.4%) |
| 2.0x to 2.9x | 66 (5.4%) | 158 (6.3%) |
| 3.0x to 3.9x | 199 (16.5%) | 451 (18.0%) |
| 4.0x or more | 807 (66.7%) | 713 (28.4%) |
| Total | 1,210 (100.0%) | 2,510 (100.0%) |
Real Estate Taxes by Mortgage Status in Lynden
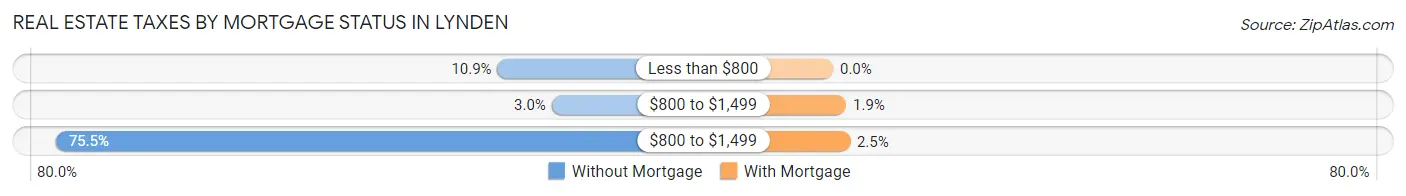
| Property Taxes | Without Mortgage | With Mortgage |
| Less than $800 | 132 (10.9%) | 0 (0.0%) |
| $800 to $1,499 | 36 (3.0%) | 48 (1.9%) |
| $800 to $1,499 | 913 (75.4%) | 62 (2.5%) |
| Total | 1,210 (100.0%) | 2,510 (100.0%) |
Health & Disability in Lynden
Health Insurance Coverage by Age in Lynden
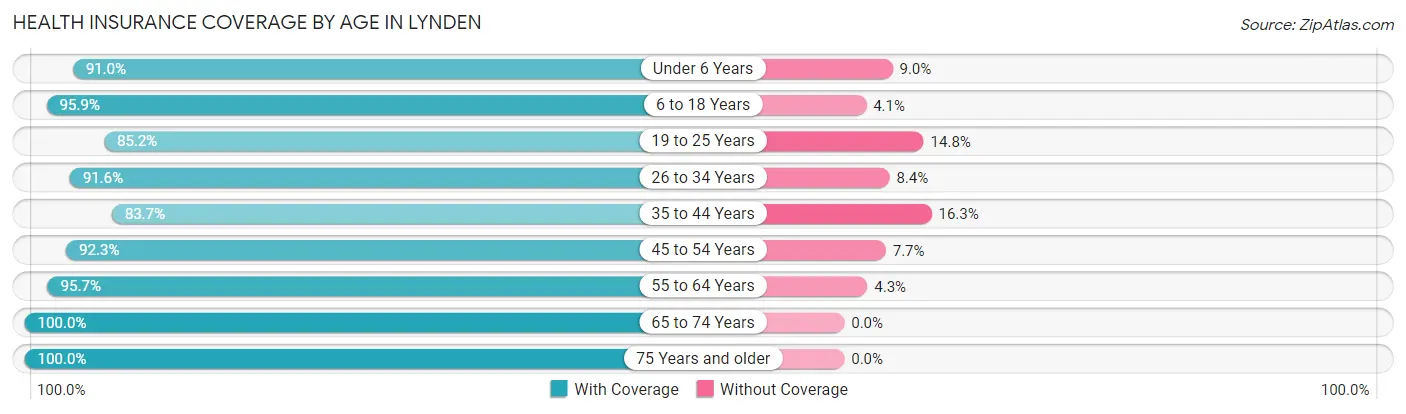
| Age Bracket | With Coverage | Without Coverage |
| Under 6 Years | 1,427 (91.0%) | 141 (9.0%) |
| 6 to 18 Years | 2,628 (95.9%) | 112 (4.1%) |
| 19 to 25 Years | 1,215 (85.2%) | 211 (14.8%) |
| 26 to 34 Years | 1,738 (91.6%) | 160 (8.4%) |
| 35 to 44 Years | 1,776 (83.7%) | 345 (16.3%) |
| 45 to 54 Years | 1,144 (92.3%) | 96 (7.7%) |
| 55 to 64 Years | 1,734 (95.7%) | 78 (4.3%) |
| 65 to 74 Years | 1,500 (100.0%) | 0 (0.0%) |
| 75 Years and older | 1,275 (100.0%) | 0 (0.0%) |
| Total | 14,437 (92.7%) | 1,143 (7.3%) |
Health Insurance Coverage by Citizenship Status in Lynden
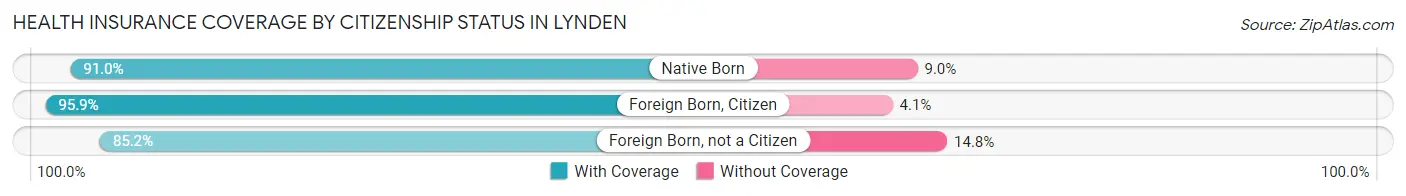
| Citizenship Status | With Coverage | Without Coverage |
| Native Born | 1,427 (91.0%) | 141 (9.0%) |
| Foreign Born, Citizen | 2,628 (95.9%) | 112 (4.1%) |
| Foreign Born, not a Citizen | 1,215 (85.2%) | 211 (14.8%) |
Health Insurance Coverage by Household Income in Lynden
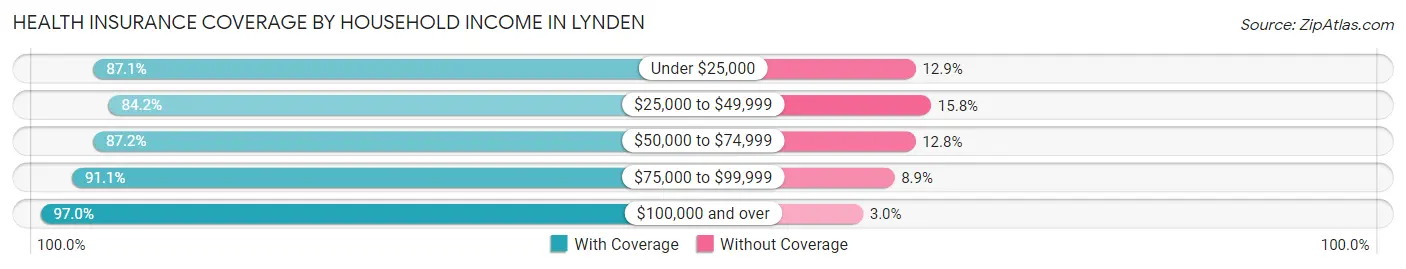
| Household Income | With Coverage | Without Coverage |
| Under $25,000 | 1,002 (87.1%) | 148 (12.9%) |
| $25,000 to $49,999 | 1,390 (84.2%) | 260 (15.8%) |
| $50,000 to $74,999 | 1,904 (87.2%) | 280 (12.8%) |
| $75,000 to $99,999 | 2,172 (91.1%) | 212 (8.9%) |
| $100,000 and over | 7,882 (97.0%) | 243 (3.0%) |
Public vs Private Health Insurance Coverage by Age in Lynden
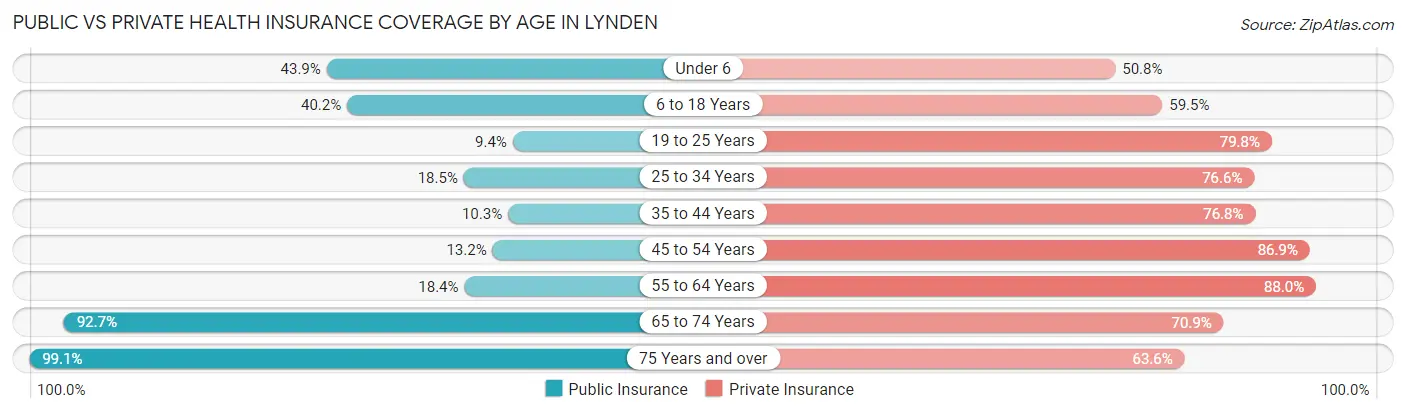
| Age Bracket | Public Insurance | Private Insurance |
| Under 6 | 689 (43.9%) | 796 (50.8%) |
| 6 to 18 Years | 1,100 (40.2%) | 1,630 (59.5%) |
| 19 to 25 Years | 134 (9.4%) | 1,138 (79.8%) |
| 25 to 34 Years | 351 (18.5%) | 1,453 (76.5%) |
| 35 to 44 Years | 218 (10.3%) | 1,628 (76.8%) |
| 45 to 54 Years | 163 (13.2%) | 1,077 (86.9%) |
| 55 to 64 Years | 333 (18.4%) | 1,595 (88.0%) |
| 65 to 74 Years | 1,391 (92.7%) | 1,063 (70.9%) |
| 75 Years and over | 1,264 (99.1%) | 811 (63.6%) |
| Total | 5,643 (36.2%) | 11,191 (71.8%) |
Disability Status by Sex by Age in Lynden
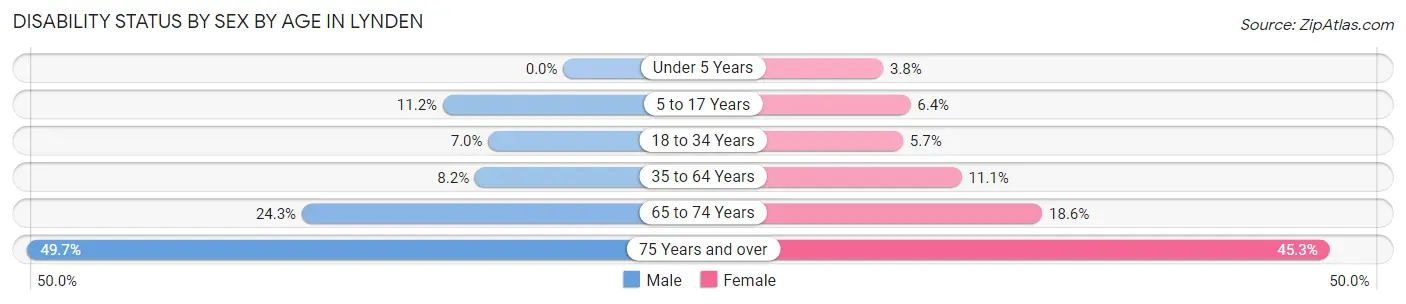
| Age Bracket | Male | Female |
| Under 5 Years | 0 (0.0%) | 28 (3.8%) |
| 5 to 17 Years | 169 (11.2%) | 76 (6.4%) |
| 18 to 34 Years | 118 (7.0%) | 106 (5.7%) |
| 35 to 64 Years | 217 (8.2%) | 281 (11.1%) |
| 65 to 74 Years | 206 (24.3%) | 121 (18.6%) |
| 75 Years and over | 267 (49.7%) | 334 (45.3%) |
Disability Class by Sex by Age in Lynden
Disability Class: Hearing Difficulty
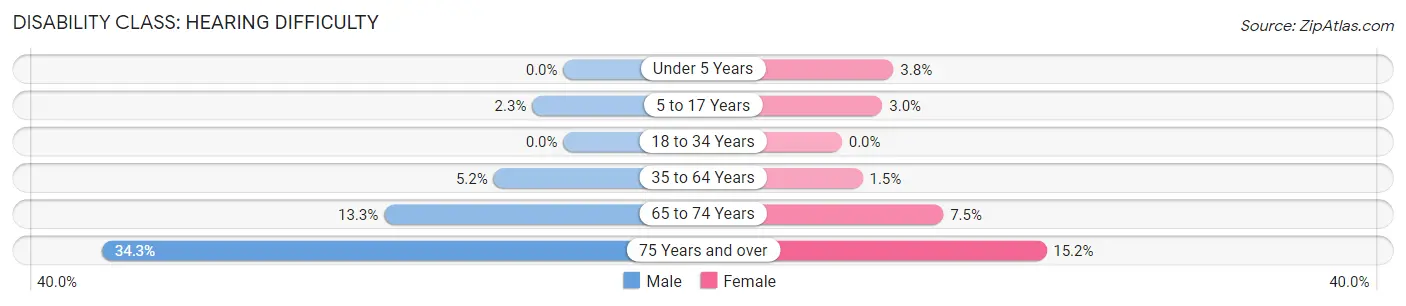
| Age Bracket | Male | Female |
| Under 5 Years | 0 (0.0%) | 28 (3.8%) |
| 5 to 17 Years | 35 (2.3%) | 36 (3.0%) |
| 18 to 34 Years | 0 (0.0%) | 0 (0.0%) |
| 35 to 64 Years | 137 (5.2%) | 39 (1.5%) |
| 65 to 74 Years | 113 (13.3%) | 49 (7.5%) |
| 75 Years and over | 184 (34.3%) | 112 (15.2%) |
Disability Class: Vision Difficulty
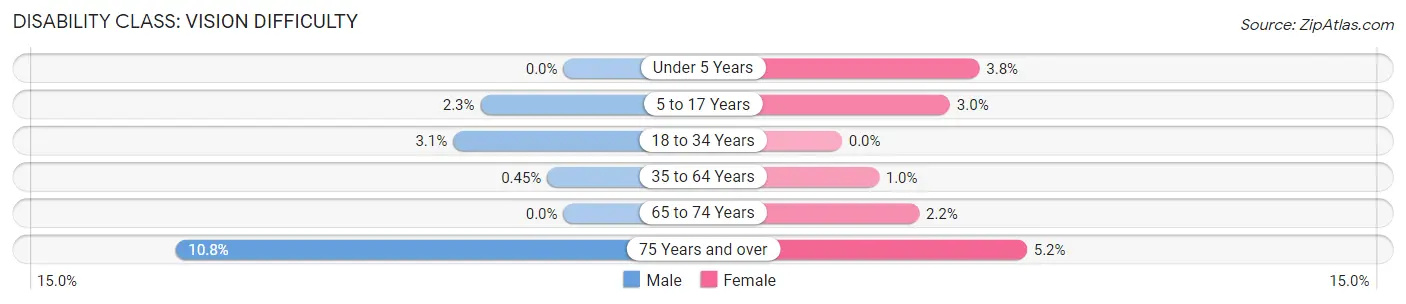
| Age Bracket | Male | Female |
| Under 5 Years | 0 (0.0%) | 28 (3.8%) |
| 5 to 17 Years | 35 (2.3%) | 36 (3.0%) |
| 18 to 34 Years | 52 (3.1%) | 0 (0.0%) |
| 35 to 64 Years | 12 (0.4%) | 26 (1.0%) |
| 65 to 74 Years | 0 (0.0%) | 14 (2.1%) |
| 75 Years and over | 58 (10.8%) | 38 (5.1%) |
Disability Class: Cognitive Difficulty
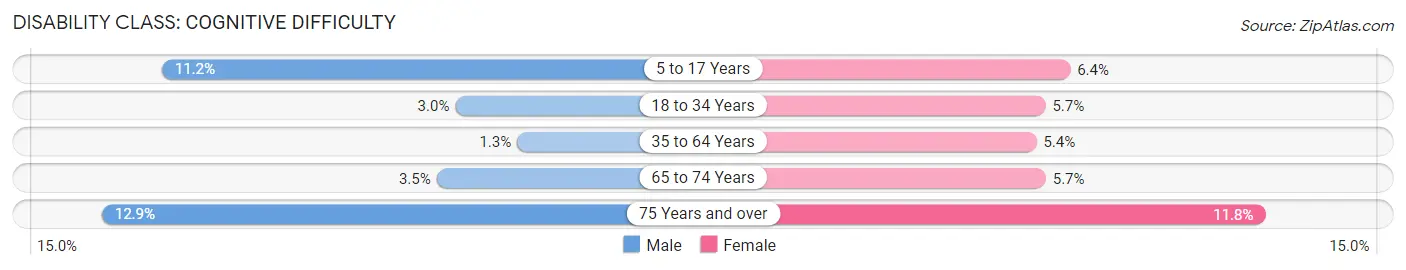
| Age Bracket | Male | Female |
| 5 to 17 Years | 169 (11.2%) | 76 (6.4%) |
| 18 to 34 Years | 51 (3.0%) | 106 (5.7%) |
| 35 to 64 Years | 34 (1.3%) | 137 (5.4%) |
| 65 to 74 Years | 30 (3.5%) | 37 (5.7%) |
| 75 Years and over | 69 (12.9%) | 87 (11.8%) |
Disability Class: Ambulatory Difficulty
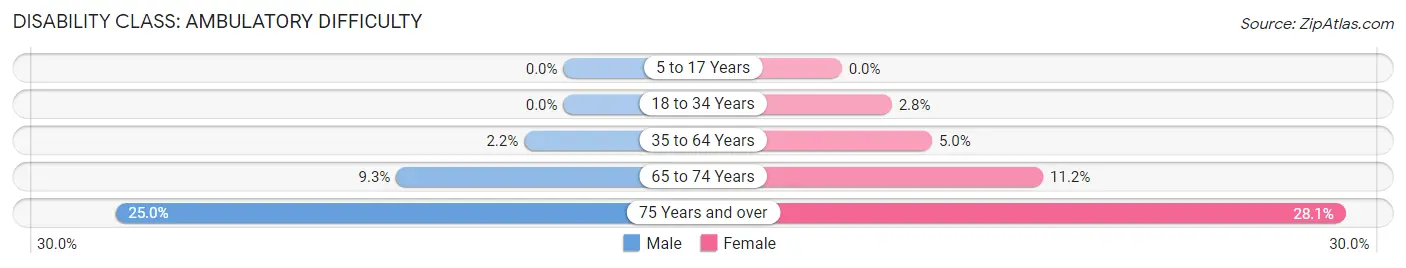
| Age Bracket | Male | Female |
| 5 to 17 Years | 0 (0.0%) | 0 (0.0%) |
| 18 to 34 Years | 0 (0.0%) | 52 (2.8%) |
| 35 to 64 Years | 58 (2.2%) | 127 (5.0%) |
| 65 to 74 Years | 79 (9.3%) | 73 (11.2%) |
| 75 Years and over | 134 (24.9%) | 207 (28.1%) |
Disability Class: Self-Care Difficulty
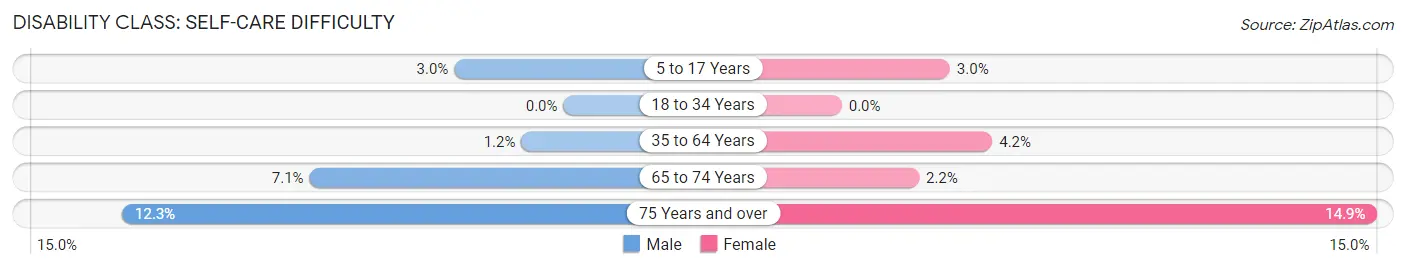
| Age Bracket | Male | Female |
| 5 to 17 Years | 46 (3.0%) | 36 (3.0%) |
| 18 to 34 Years | 0 (0.0%) | 0 (0.0%) |
| 35 to 64 Years | 31 (1.2%) | 106 (4.2%) |
| 65 to 74 Years | 60 (7.1%) | 14 (2.1%) |
| 75 Years and over | 66 (12.3%) | 110 (14.9%) |
Technology Access in Lynden
Computing Device Access in Lynden
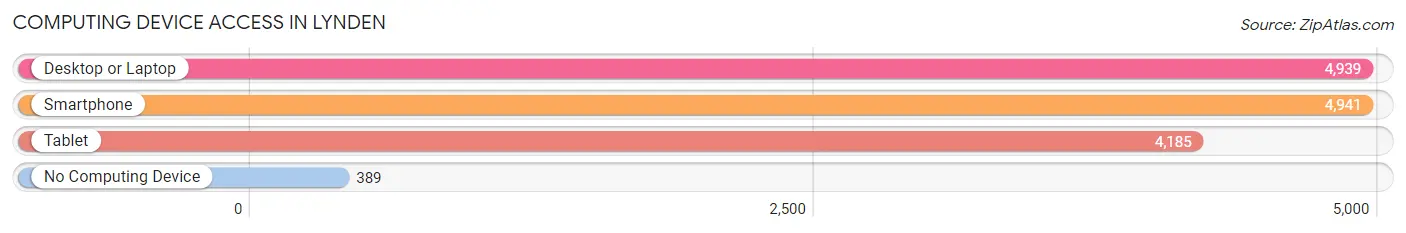
| Device Type | # Households | % Households |
| Desktop or Laptop | 4,939 | 85.4% |
| Smartphone | 4,941 | 85.4% |
| Tablet | 4,185 | 72.3% |
| No Computing Device | 389 | 6.7% |
| Total | 5,786 | 100.0% |
Internet Access in Lynden
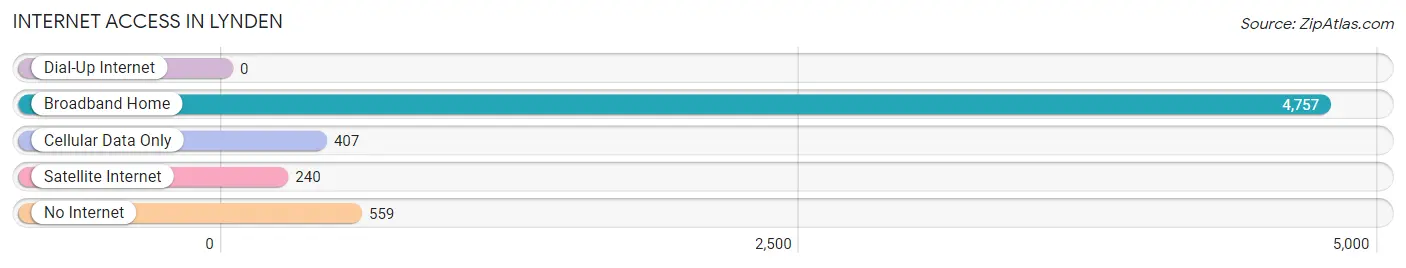
| Internet Type | # Households | % Households |
| Dial-Up Internet | 0 | 0.0% |
| Broadband Home | 4,757 | 82.2% |
| Cellular Data Only | 407 | 7.0% |
| Satellite Internet | 240 | 4.2% |
| No Internet | 559 | 9.7% |
| Total | 5,786 | 100.0% |
Lynden Summary
Lynden, Washington is a small city located in Whatcom County, Washington, United States. It is situated about 10 miles south of the Canadian border and about 20 miles north of Bellingham. The city is known for its Dutch-American heritage, its rural atmosphere, and its proximity to the Cascade Mountains.
History
The area that is now Lynden was first inhabited by the Nooksack Indians, who lived in the area for thousands of years before the arrival of European settlers. The first Europeans to settle in the area were Dutch immigrants, who arrived in the late 19th century. The city was founded in 1874 by a group of Dutch settlers led by Roelof Van Loo, who named the settlement after his hometown of Lynden, Netherlands. The settlers established a dairy farm and a sawmill, and the town quickly grew. By the early 20th century, Lynden had become a thriving agricultural community, with a population of over 1,000.
Geography
Lynden is located in Whatcom County, Washington, about 10 miles south of the Canadian border and about 20 miles north of Bellingham. The city is situated in the Nooksack Valley, which is surrounded by the Cascade Mountains to the east and the Olympic Mountains to the west. The city is located at the confluence of the Nooksack and Sumas Rivers. The city has a total area of 4.2 square miles, all of which is land.
Economy
Lynden’s economy is largely based on agriculture. The city is home to several large dairy farms, as well as a number of smaller farms that produce a variety of crops, including potatoes, apples, and berries. The city is also home to several manufacturing companies, including a lumber mill and a canning factory. In addition, Lynden is home to a number of retail stores, restaurants, and other businesses.
Demographics
As of the 2010 census, Lynden had a population of 11,951. The racial makeup of the city was 91.2% White, 0.7% African American, 0.7% Native American, 1.2% Asian, 0.2% Pacific Islander, 3.3% from other races, and 2.8% from two or more races. Hispanic or Latino of any race were 8.2% of the population. The median household income in Lynden was $50,945, and the median family income was $60,945.
Lynden is a small city with a strong sense of community and a rich history. The city is known for its Dutch-American heritage, its rural atmosphere, and its proximity to the Cascade Mountains. The city’s economy is largely based on agriculture, and the city is home to several large dairy farms, as well as a number of smaller farms that produce a variety of crops. Lynden is also home to a number of manufacturing companies, retail stores, restaurants, and other businesses. The city has a population of 11,951, and the median household income is $50,945.
Common Questions
What is Per Capita Income in Lynden?
Per Capita income in Lynden is $39,677.
What is the Median Family Income in Lynden?
Median Family Income in Lynden is $109,052.
What is the Median Household income in Lynden?
Median Household Income in Lynden is $86,175.
What is Income or Wage Gap in Lynden?
Income or Wage Gap in Lynden is 59.6%.
Women in Lynden earn 40.4 cents for every dollar earned by a man.
What is Inequality or Gini Index in Lynden?
Inequality or Gini Index in Lynden is 0.39.
What is the Total Population of Lynden?
Total Population of Lynden is 15,723.
What is the Total Male Population of Lynden?
Total Male Population of Lynden is 7,915.
What is the Total Female Population of Lynden?
Total Female Population of Lynden is 7,808.
What is the Ratio of Males per 100 Females in Lynden?
There are 101.37 Males per 100 Females in Lynden.
What is the Ratio of Females per 100 Males in Lynden?
There are 98.65 Females per 100 Males in Lynden.
What is the Median Population Age in Lynden?
Median Population Age in Lynden is 35.7 Years.
What is the Average Family Size in Lynden
Average Family Size in Lynden is 3.3 People.
What is the Average Household Size in Lynden
Average Household Size in Lynden is 2.7 People.
How Large is the Labor Force in Lynden?
There are 7,923 People in the Labor Forcein in Lynden.
What is the Percentage of People in the Labor Force in Lynden?
66.0% of People are in the Labor Force in Lynden.
What is the Unemployment Rate in Lynden?
Unemployment Rate in Lynden is 4.5%.