Mccleary, WA Map & Demographics
Mccleary Map
Mccleary Overview
$28,827
PER CAPITA INCOME
$81,587
AVG FAMILY INCOME
$67,885
AVG HOUSEHOLD INCOME
24.9%
WAGE / INCOME GAP [ % ]
75.1¢/ $1
WAGE / INCOME GAP [ $ ]
0.38
INEQUALITY / GINI INDEX
2,426
TOTAL POPULATION
1,176
MALE POPULATION
1,250
FEMALE POPULATION
94.08
MALES / 100 FEMALES
106.29
FEMALES / 100 MALES
36.6
MEDIAN AGE
3.4
AVG FAMILY SIZE
2.8
AVG HOUSEHOLD SIZE
999
LABOR FORCE [ PEOPLE ]
53.2%
PERCENT IN LABOR FORCE
8.3%
UNEMPLOYMENT RATE
Mccleary Zip Codes
Mccleary Area Codes
Income in Mccleary
Income Overview in Mccleary
Per Capita Income in Mccleary is $28,827, while median incomes of families and households are $81,587 and $67,885 respectively.
| Characteristic | Number | Measure |
| Per Capita Income | 2,426 | $28,827 |
| Median Family Income | 569 | $81,587 |
| Mean Family Income | 569 | $92,396 |
| Median Household Income | 876 | $67,885 |
| Mean Household Income | 876 | $78,186 |
| Income Deficit | 569 | $0 |
| Wage / Income Gap (%) | 2,426 | 24.94% |
| Wage / Income Gap ($) | 2,426 | 75.06¢ per $1 |
| Gini / Inequality Index | 2,426 | 0.38 |
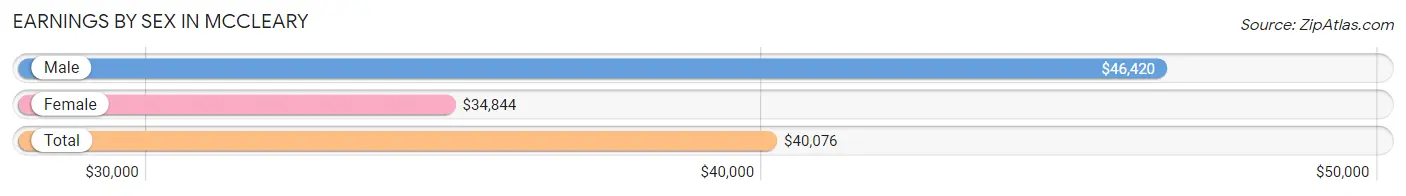
Earnings by Sex in Mccleary
Average Earnings in Mccleary are $40,076, $46,420 for men and $34,844 for women, a difference of 24.9%.
| Sex | Number | Average Earnings |
| Male | 573 (53.1%) | $46,420 |
| Female | 507 (46.9%) | $34,844 |
| Total | 1,080 (100.0%) | $40,076 |
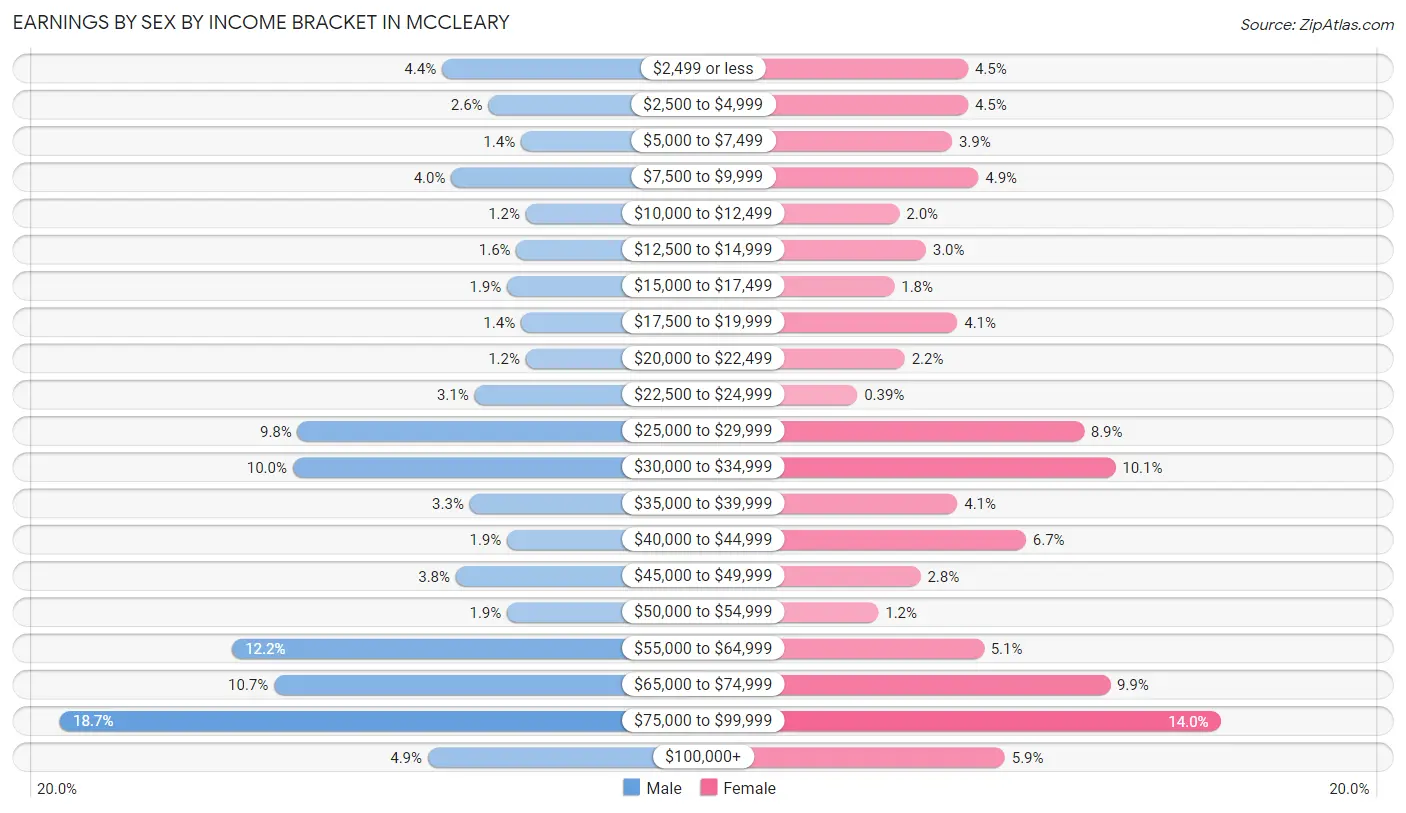
Earnings by Sex by Income Bracket in Mccleary
The most common earnings brackets in Mccleary are $75,000 to $99,999 for men (107 | 18.7%) and $75,000 to $99,999 for women (71 | 14.0%).
| Income | Male | Female |
| $2,499 or less | 25 (4.4%) | 23 (4.5%) |
| $2,500 to $4,999 | 15 (2.6%) | 23 (4.5%) |
| $5,000 to $7,499 | 8 (1.4%) | 20 (3.9%) |
| $7,500 to $9,999 | 23 (4.0%) | 25 (4.9%) |
| $10,000 to $12,499 | 7 (1.2%) | 10 (2.0%) |
| $12,500 to $14,999 | 9 (1.6%) | 15 (3.0%) |
| $15,000 to $17,499 | 11 (1.9%) | 9 (1.8%) |
| $17,500 to $19,999 | 8 (1.4%) | 21 (4.1%) |
| $20,000 to $22,499 | 7 (1.2%) | 11 (2.2%) |
| $22,500 to $24,999 | 18 (3.1%) | 2 (0.4%) |
| $25,000 to $29,999 | 56 (9.8%) | 45 (8.9%) |
| $30,000 to $34,999 | 57 (10.0%) | 51 (10.1%) |
| $35,000 to $39,999 | 19 (3.3%) | 21 (4.1%) |
| $40,000 to $44,999 | 11 (1.9%) | 34 (6.7%) |
| $45,000 to $49,999 | 22 (3.8%) | 14 (2.8%) |
| $50,000 to $54,999 | 11 (1.9%) | 6 (1.2%) |
| $55,000 to $64,999 | 70 (12.2%) | 26 (5.1%) |
| $65,000 to $74,999 | 61 (10.6%) | 50 (9.9%) |
| $75,000 to $99,999 | 107 (18.7%) | 71 (14.0%) |
| $100,000+ | 28 (4.9%) | 30 (5.9%) |
| Total | 573 (100.0%) | 507 (100.0%) |
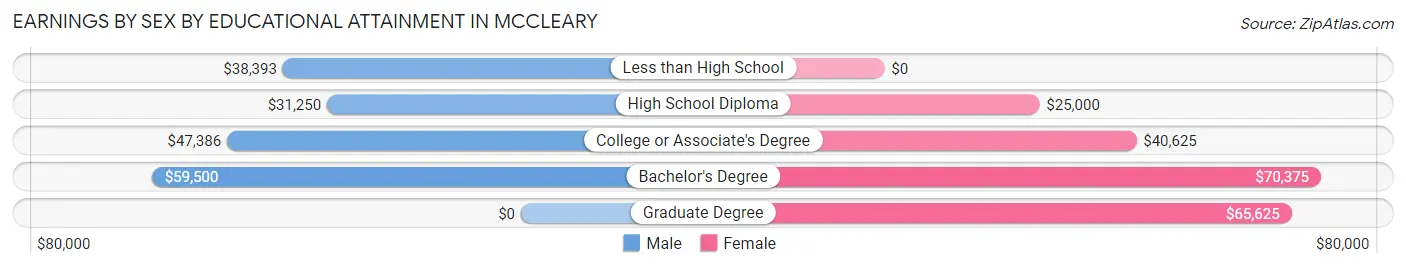
Earnings by Sex by Educational Attainment in Mccleary
Average earnings in Mccleary are $47,330 for men and $36,786 for women, a difference of 22.3%. Men with an educational attainment of bachelor's degree enjoy the highest average annual earnings of $59,500, while those with high school diploma education earn the least with $31,250. Women with an educational attainment of bachelor's degree earn the most with the average annual earnings of $70,375, while those with high school diploma education have the smallest earnings of $25,000.
| Educational Attainment | Male Income | Female Income |
| Less than High School | $38,393 | $0 |
| High School Diploma | $31,250 | $25,000 |
| College or Associate's Degree | $47,386 | $40,625 |
| Bachelor's Degree | $59,500 | $70,375 |
| Graduate Degree | - | - |
| Total | $47,330 | $36,786 |
Family Income in Mccleary
Family Income Brackets in Mccleary
According to the Mccleary family income data, there are 129 families falling into the $100,000 to $149,999 income range, which is the most common income bracket and makes up 22.7% of all families.
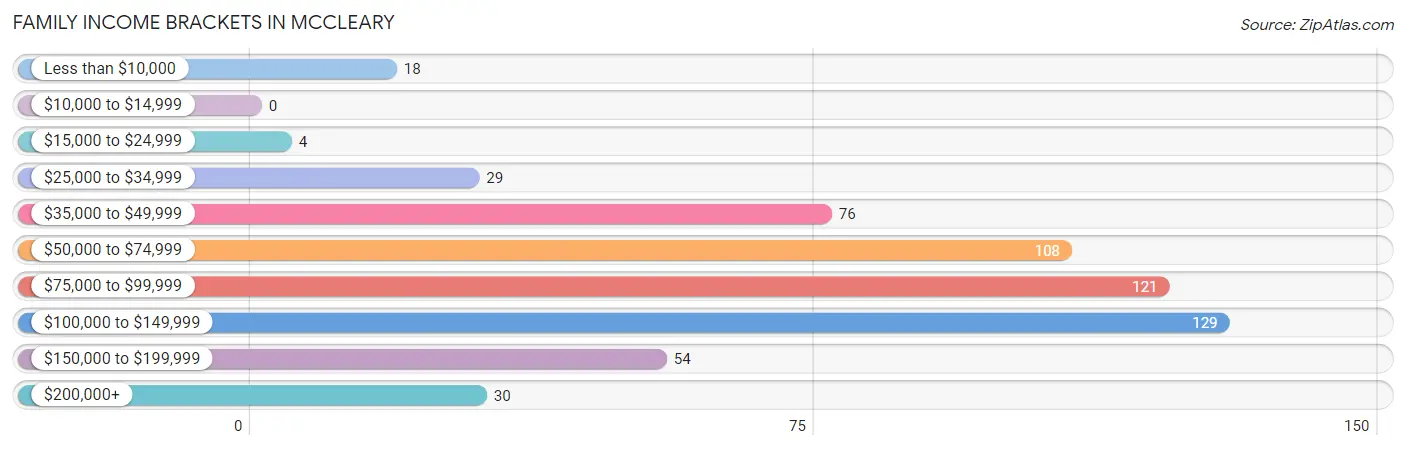
| Income Bracket | # Families | % Families |
| Less than $10,000 | 18 | 3.2% |
| $10,000 to $14,999 | 0 | 0.0% |
| $15,000 to $24,999 | 4 | 0.7% |
| $25,000 to $34,999 | 29 | 5.1% |
| $35,000 to $49,999 | 76 | 13.4% |
| $50,000 to $74,999 | 108 | 19.0% |
| $75,000 to $99,999 | 121 | 21.3% |
| $100,000 to $149,999 | 129 | 22.7% |
| $150,000 to $199,999 | 54 | 9.5% |
| $200,000+ | 30 | 5.3% |
Family Income by Famaliy Size in Mccleary
5-person families (56 | 9.8%) account for the highest median family income in Mccleary with $172,800 per family, while 5-person families (56 | 9.8%) have the highest median income of $34,560 per family member.
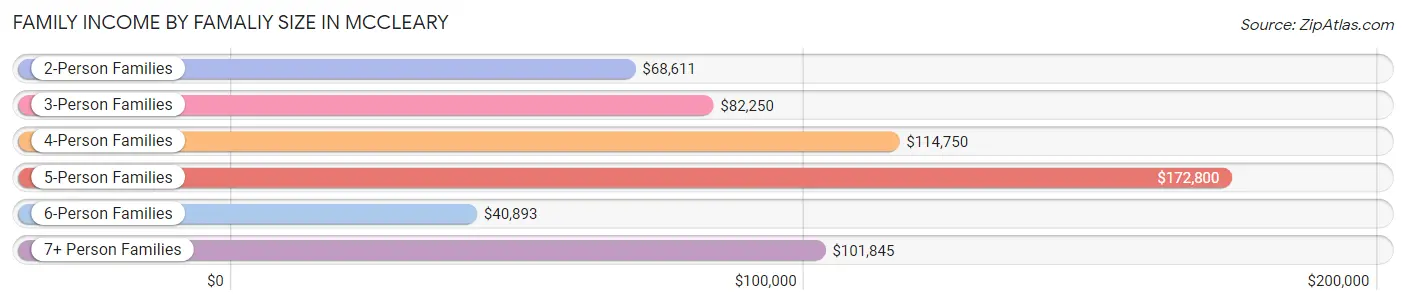
| Income Bracket | # Families | Median Income |
| 2-Person Families | 270 (47.4%) | $68,611 |
| 3-Person Families | 124 (21.8%) | $82,250 |
| 4-Person Families | 75 (13.2%) | $114,750 |
| 5-Person Families | 56 (9.8%) | $172,800 |
| 6-Person Families | 13 (2.3%) | $40,893 |
| 7+ Person Families | 31 (5.4%) | $101,845 |
| Total | 569 (100.0%) | $81,587 |
Family Income by Number of Earners in Mccleary
The median family income in Mccleary is $81,587, with families comprising 3+ earners (31) having the highest median family income of $172,083, while families with no earners (123) have the lowest median family income of $56,875, accounting for 5.4% and 21.6% of families, respectively.
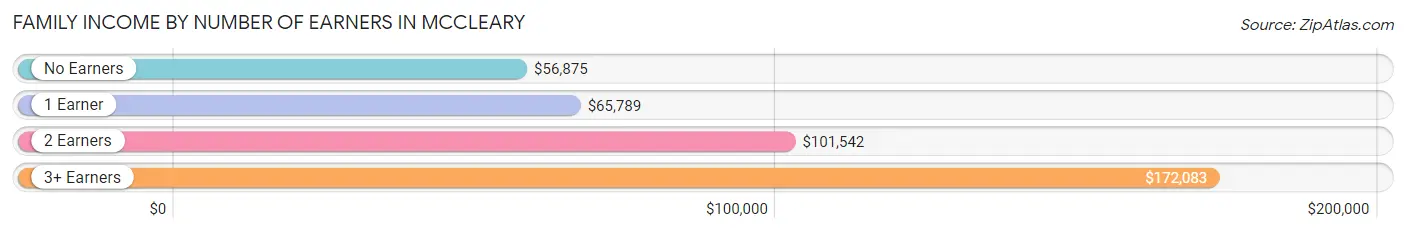
| Number of Earners | # Families | Median Income |
| No Earners | 123 (21.6%) | $56,875 |
| 1 Earner | 168 (29.5%) | $65,789 |
| 2 Earners | 247 (43.4%) | $101,542 |
| 3+ Earners | 31 (5.4%) | $172,083 |
| Total | 569 (100.0%) | $81,587 |
Household Income in Mccleary
Household Income Brackets in Mccleary
With 159 households falling in the category, the $75,000 to $99,999 income range is the most frequent in Mccleary, accounting for 18.1% of all households. In contrast, only 33 households (3.8%) fall into the less than $10,000 income bracket, making it the least populous group.
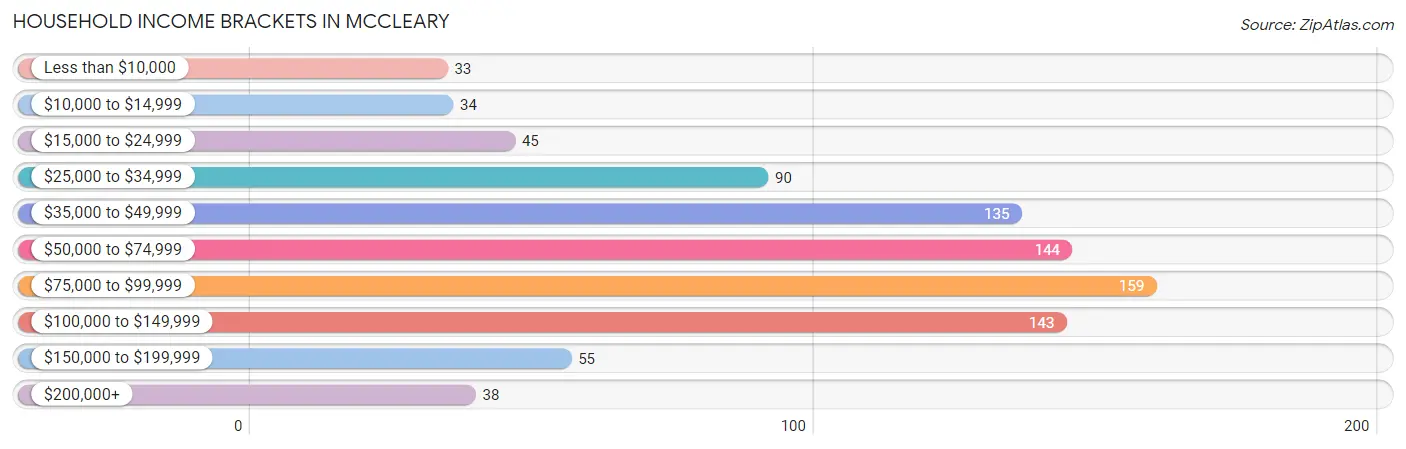
| Income Bracket | # Households | % Households |
| Less than $10,000 | 33 | 3.8% |
| $10,000 to $14,999 | 34 | 3.9% |
| $15,000 to $24,999 | 45 | 5.1% |
| $25,000 to $34,999 | 90 | 10.3% |
| $35,000 to $49,999 | 135 | 15.4% |
| $50,000 to $74,999 | 144 | 16.4% |
| $75,000 to $99,999 | 159 | 18.2% |
| $100,000 to $149,999 | 143 | 16.3% |
| $150,000 to $199,999 | 55 | 6.3% |
| $200,000+ | 38 | 4.3% |
Household Income by Householder Age in Mccleary
The median household income in Mccleary is $67,885, with the highest median household income of $96,250 found in the 25 to 44 years age bracket for the primary householder. A total of 340 households (38.8%) fall into this category. Meanwhile, the 15 to 24 years age bracket for the primary householder has the lowest median household income of $0, with 13 households (1.5%) in this group.
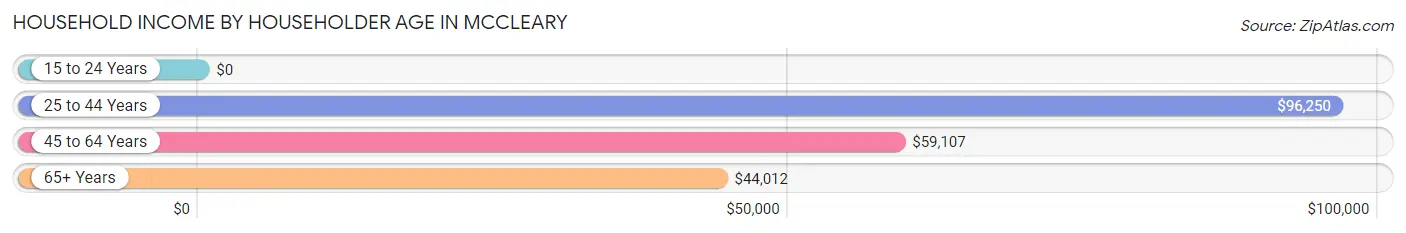
| Income Bracket | # Households | Median Income |
| 15 to 24 Years | 13 (1.5%) | $0 |
| 25 to 44 Years | 340 (38.8%) | $96,250 |
| 45 to 64 Years | 293 (33.5%) | $59,107 |
| 65+ Years | 230 (26.3%) | $44,012 |
| Total | 876 (100.0%) | $67,885 |
Poverty in Mccleary
Income Below Poverty by Sex and Age in Mccleary
With 9.3% poverty level for males and 12.4% for females among the residents of Mccleary, 16 and 17 year old males and 16 and 17 year old females are the most vulnerable to poverty, with 20 males (57.1%) and 6 females (37.5%) in their respective age groups living below the poverty level.
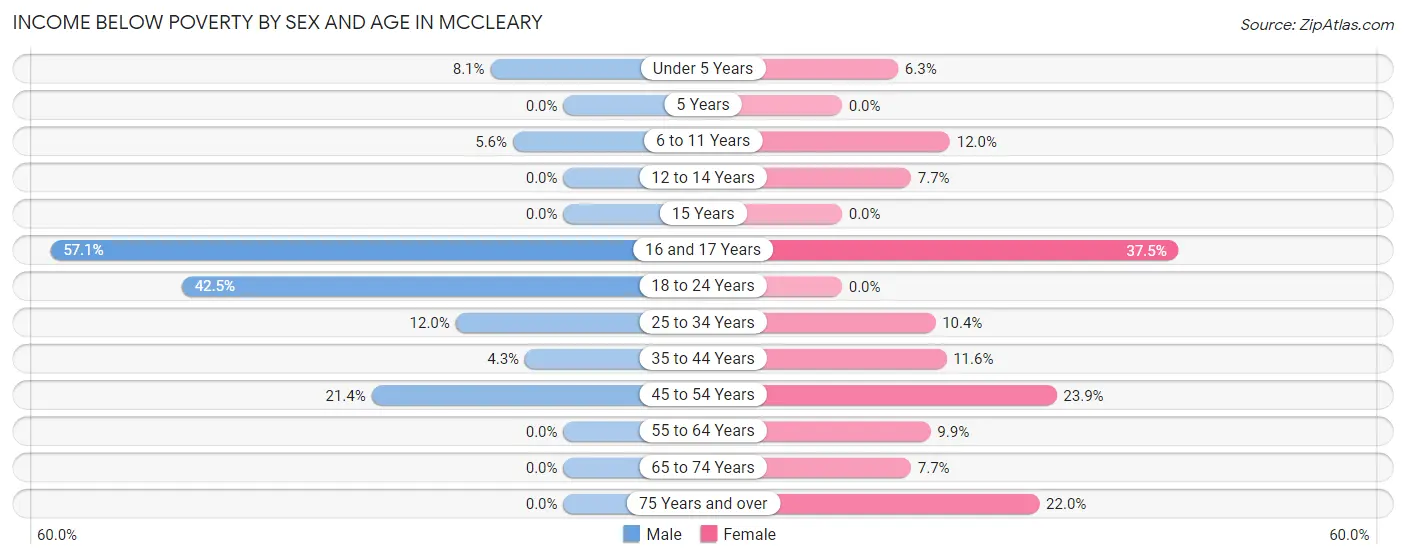
| Age Bracket | Male | Female |
| Under 5 Years | 10 (8.1%) | 3 (6.2%) |
| 5 Years | 0 (0.0%) | 0 (0.0%) |
| 6 to 11 Years | 5 (5.6%) | 19 (12.0%) |
| 12 to 14 Years | 0 (0.0%) | 4 (7.7%) |
| 15 Years | 0 (0.0%) | 0 (0.0%) |
| 16 and 17 Years | 20 (57.1%) | 6 (37.5%) |
| 18 to 24 Years | 17 (42.5%) | 0 (0.0%) |
| 25 to 34 Years | 27 (12.0%) | 18 (10.4%) |
| 35 to 44 Years | 8 (4.3%) | 20 (11.6%) |
| 45 to 54 Years | 22 (21.4%) | 38 (23.9%) |
| 55 to 64 Years | 0 (0.0%) | 15 (9.9%) |
| 65 to 74 Years | 0 (0.0%) | 10 (7.7%) |
| 75 Years and over | 0 (0.0%) | 20 (22.0%) |
| Total | 109 (9.3%) | 153 (12.4%) |
Income Above Poverty by Sex and Age in Mccleary
According to the poverty statistics in Mccleary, males aged 5 years and females aged 5 years are the age groups that are most secure financially, with 100.0% of males and 100.0% of females in these age groups living above the poverty line.
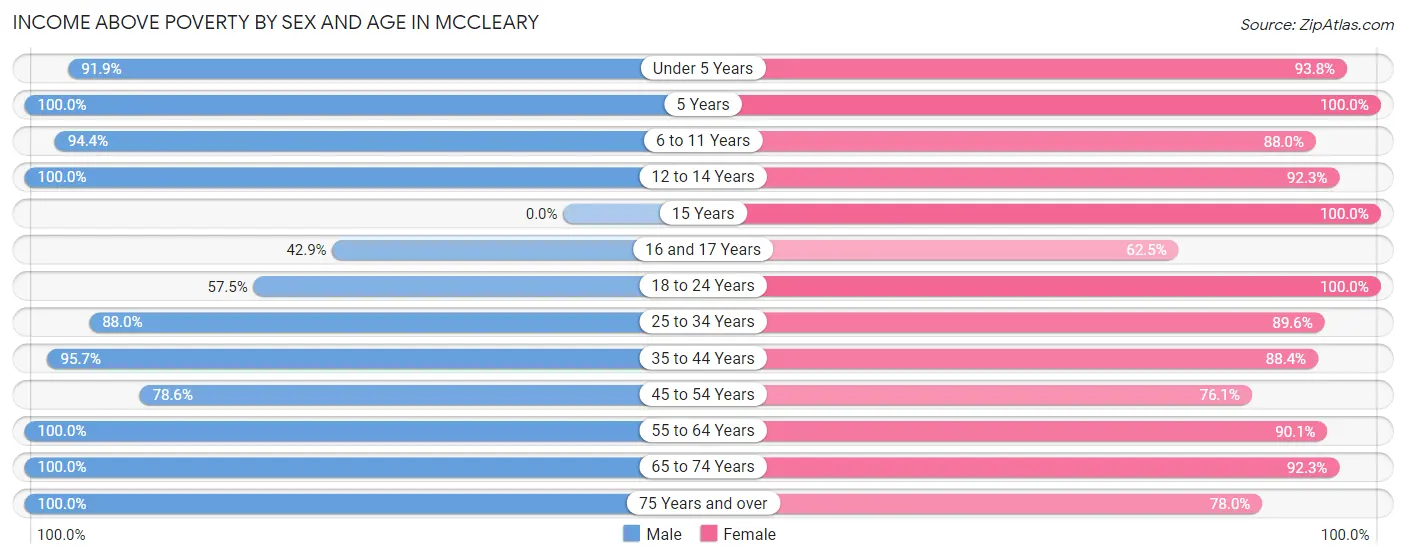
| Age Bracket | Male | Female |
| Under 5 Years | 113 (91.9%) | 45 (93.8%) |
| 5 Years | 3 (100.0%) | 6 (100.0%) |
| 6 to 11 Years | 84 (94.4%) | 139 (88.0%) |
| 12 to 14 Years | 45 (100.0%) | 48 (92.3%) |
| 15 Years | 0 (0.0%) | 8 (100.0%) |
| 16 and 17 Years | 15 (42.9%) | 10 (62.5%) |
| 18 to 24 Years | 23 (57.5%) | 73 (100.0%) |
| 25 to 34 Years | 198 (88.0%) | 155 (89.6%) |
| 35 to 44 Years | 179 (95.7%) | 152 (88.4%) |
| 45 to 54 Years | 81 (78.6%) | 121 (76.1%) |
| 55 to 64 Years | 138 (100.0%) | 137 (90.1%) |
| 65 to 74 Years | 110 (100.0%) | 120 (92.3%) |
| 75 Years and over | 74 (100.0%) | 71 (78.0%) |
| Total | 1,063 (90.7%) | 1,085 (87.6%) |
Income Below Poverty Among Married-Couple Families in Mccleary
The poverty statistics for married-couple families in Mccleary show that 5.1% or 22 of the total 433 families live below the poverty line. Families with 1 or 2 children have the highest poverty rate of 21.6%, comprising of 22 families. On the other hand, families with no children have the lowest poverty rate of 0.0%, which includes 0 families.
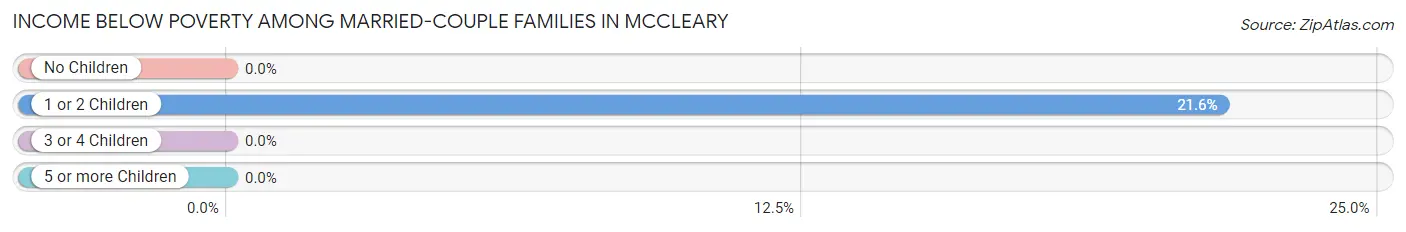
| Children | Above Poverty | Below Poverty |
| No Children | 260 (100.0%) | 0 (0.0%) |
| 1 or 2 Children | 80 (78.4%) | 22 (21.6%) |
| 3 or 4 Children | 71 (100.0%) | 0 (0.0%) |
| 5 or more Children | 0 (0.0%) | 0 (0.0%) |
| Total | 411 (94.9%) | 22 (5.1%) |
Income Below Poverty Among Single-Parent Households in Mccleary
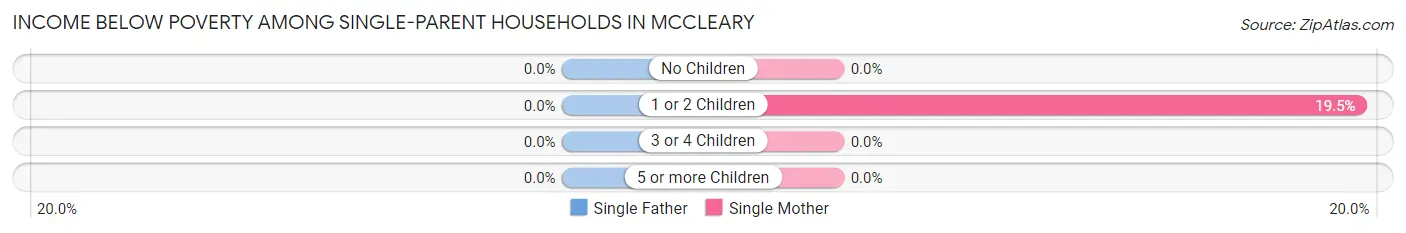
| Children | Single Father | Single Mother |
| No Children | 0 (0.0%) | 0 (0.0%) |
| 1 or 2 Children | 0 (0.0%) | 8 (19.5%) |
| 3 or 4 Children | 0 (0.0%) | 0 (0.0%) |
| 5 or more Children | 0 (0.0%) | 0 (0.0%) |
| Total | 0 (0.0%) | 8 (8.3%) |
Income Below Poverty Among Married-Couple vs Single-Parent Households in Mccleary
The poverty data for Mccleary shows that 22 of the married-couple family households (5.1%) and 8 of the single-parent households (5.9%) are living below the poverty level. Within the married-couple family households, those with 1 or 2 children have the highest poverty rate, with 22 households (21.6%) falling below the poverty line. Among the single-parent households, those with 1 or 2 children have the highest poverty rate, with 8 household (12.7%) living below poverty.
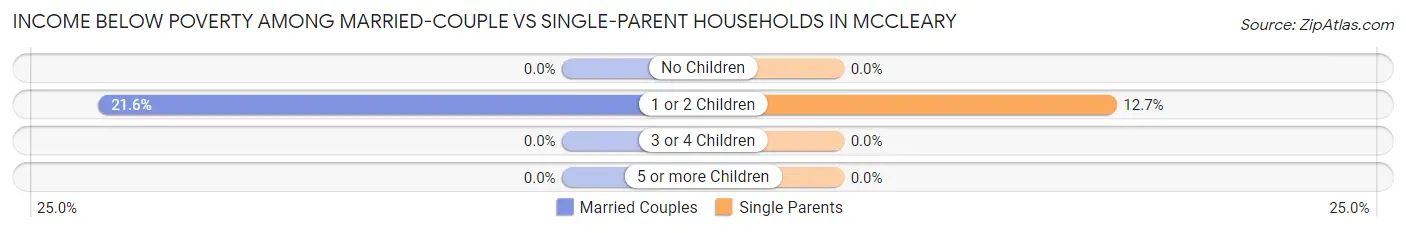
| Children | Married-Couple Families | Single-Parent Households |
| No Children | 0 (0.0%) | 0 (0.0%) |
| 1 or 2 Children | 22 (21.6%) | 8 (12.7%) |
| 3 or 4 Children | 0 (0.0%) | 0 (0.0%) |
| 5 or more Children | 0 (0.0%) | 0 (0.0%) |
| Total | 22 (5.1%) | 8 (5.9%) |
Race in Mccleary
The most populous races in Mccleary are White / Caucasian (2,040 | 84.1%), Hispanic or Latino (336 | 13.9%), and Two or more Races (158 | 6.5%).
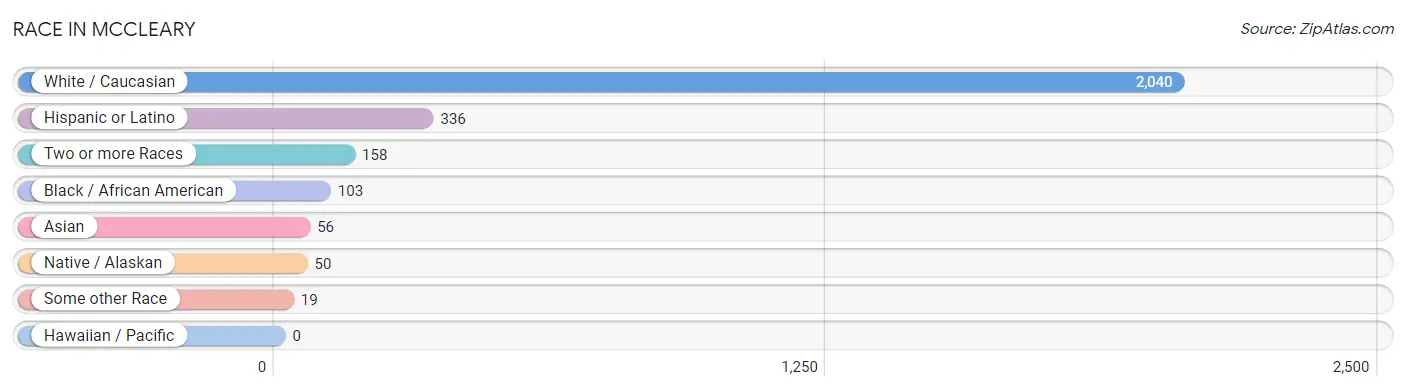
| Race | # Population | % Population |
| Asian | 56 | 2.3% |
| Black / African American | 103 | 4.3% |
| Hawaiian / Pacific | 0 | 0.0% |
| Hispanic or Latino | 336 | 13.9% |
| Native / Alaskan | 50 | 2.1% |
| White / Caucasian | 2,040 | 84.1% |
| Two or more Races | 158 | 6.5% |
| Some other Race | 19 | 0.8% |
| Total | 2,426 | 100.0% |
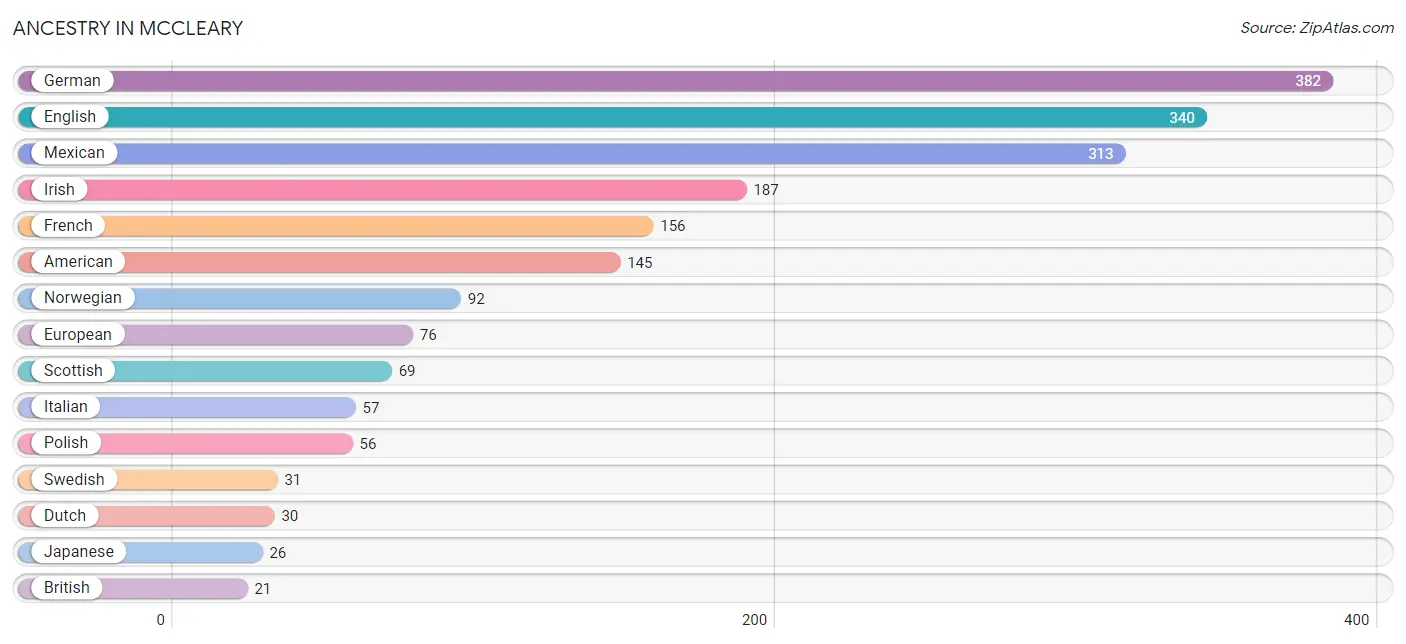
Ancestry in Mccleary
The most populous ancestries reported in Mccleary are German (382 | 15.8%), English (340 | 14.0%), Mexican (313 | 12.9%), Irish (187 | 7.7%), and French (156 | 6.4%), together accounting for 56.8% of all Mccleary residents.
| Ancestry | # Population | % Population |
| American | 145 | 6.0% |
| Austrian | 5 | 0.2% |
| Bhutanese | 8 | 0.3% |
| Blackfeet | 9 | 0.4% |
| British | 21 | 0.9% |
| Burmese | 16 | 0.7% |
| Canadian | 12 | 0.5% |
| Cherokee | 5 | 0.2% |
| Choctaw | 5 | 0.2% |
| Danish | 1 | 0.0% |
| Dutch | 30 | 1.2% |
| English | 340 | 14.0% |
| European | 76 | 3.1% |
| French | 156 | 6.4% |
| French Canadian | 14 | 0.6% |
| German | 382 | 15.8% |
| Hungarian | 9 | 0.4% |
| Indian (Asian) | 12 | 0.5% |
| Irish | 187 | 7.7% |
| Italian | 57 | 2.4% |
| Japanese | 26 | 1.1% |
| Mexican | 313 | 12.9% |
| Mexican American Indian | 18 | 0.7% |
| Navajo | 7 | 0.3% |
| Norwegian | 92 | 3.8% |
| Pakistani | 10 | 0.4% |
| Peruvian | 12 | 0.5% |
| Polish | 56 | 2.3% |
| Puerto Rican | 4 | 0.2% |
| Puget Sound Salish | 15 | 0.6% |
| Scandinavian | 19 | 0.8% |
| Scotch-Irish | 11 | 0.4% |
| Scottish | 69 | 2.8% |
| South American | 12 | 0.5% |
| South American Indian | 12 | 0.5% |
| Swedish | 31 | 1.3% |
| Swiss | 5 | 0.2% |
| Tsimshian | 8 | 0.3% |
| Welsh | 15 | 0.6% | View All 39 Rows |
Immigrants in Mccleary
The most numerous immigrant groups reported in Mccleary came from Latin America (79 | 3.3%), Central America (73 | 3.0%), Mexico (54 | 2.2%), Asia (39 | 1.6%), and South Eastern Asia (23 | 0.9%), together accounting for 11.1% of all Mccleary residents.
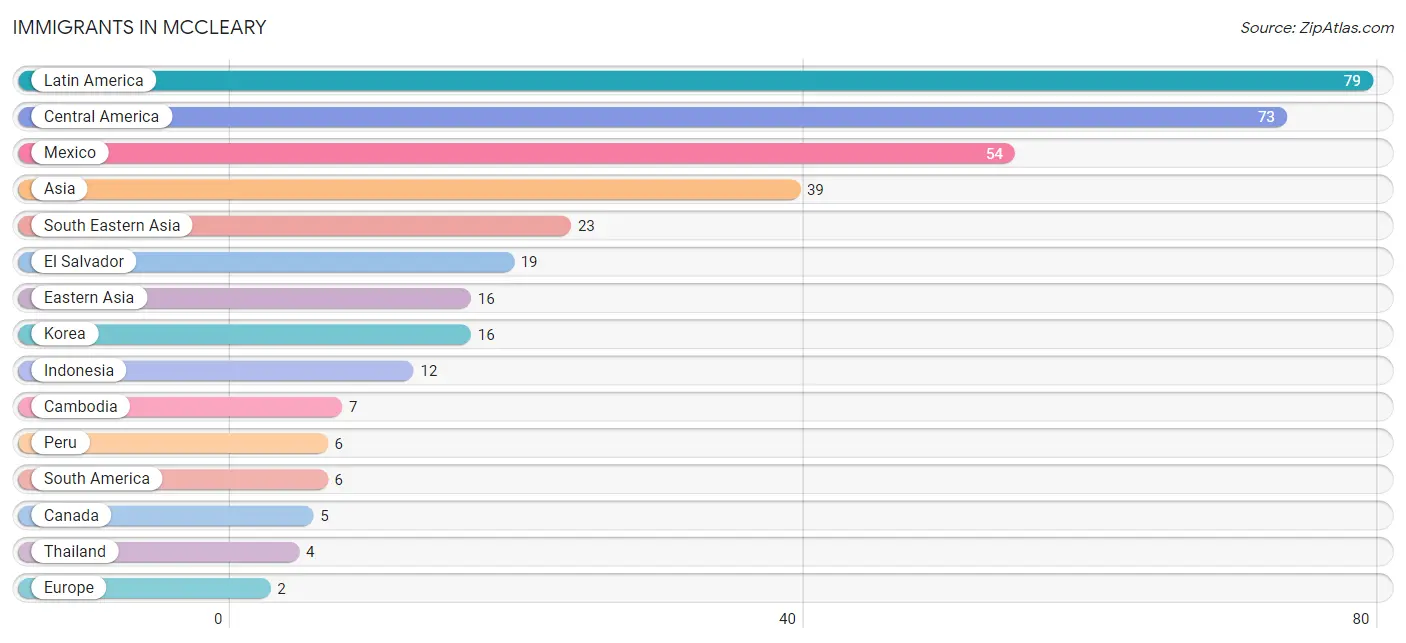
| Immigration Origin | # Population | % Population |
| Asia | 39 | 1.6% |
| Cambodia | 7 | 0.3% |
| Canada | 5 | 0.2% |
| Central America | 73 | 3.0% |
| Eastern Asia | 16 | 0.7% |
| El Salvador | 19 | 0.8% |
| Europe | 2 | 0.1% |
| Germany | 2 | 0.1% |
| Indonesia | 12 | 0.5% |
| Korea | 16 | 0.7% |
| Latin America | 79 | 3.3% |
| Mexico | 54 | 2.2% |
| Peru | 6 | 0.3% |
| South America | 6 | 0.3% |
| South Eastern Asia | 23 | 0.9% |
| Thailand | 4 | 0.2% |
| Western Europe | 2 | 0.1% | View All 17 Rows |
Sex and Age in Mccleary
Sex and Age in Mccleary
The most populous age groups in Mccleary are Under 5 Years (123 | 10.5%) for men and 5 to 9 Years (134 | 10.7%) for women.
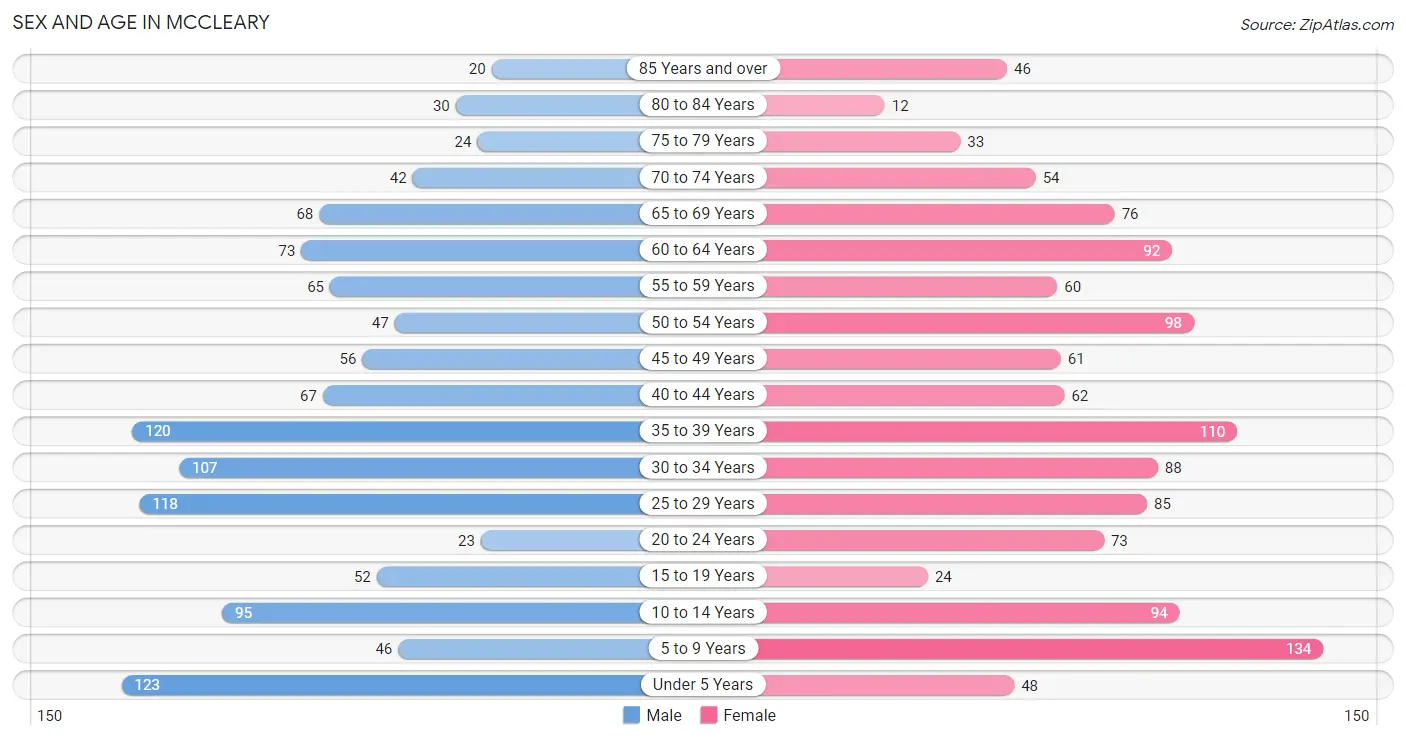
| Age Bracket | Male | Female |
| Under 5 Years | 123 (10.5%) | 48 (3.8%) |
| 5 to 9 Years | 46 (3.9%) | 134 (10.7%) |
| 10 to 14 Years | 95 (8.1%) | 94 (7.5%) |
| 15 to 19 Years | 52 (4.4%) | 24 (1.9%) |
| 20 to 24 Years | 23 (2.0%) | 73 (5.8%) |
| 25 to 29 Years | 118 (10.0%) | 85 (6.8%) |
| 30 to 34 Years | 107 (9.1%) | 88 (7.0%) |
| 35 to 39 Years | 120 (10.2%) | 110 (8.8%) |
| 40 to 44 Years | 67 (5.7%) | 62 (5.0%) |
| 45 to 49 Years | 56 (4.8%) | 61 (4.9%) |
| 50 to 54 Years | 47 (4.0%) | 98 (7.8%) |
| 55 to 59 Years | 65 (5.5%) | 60 (4.8%) |
| 60 to 64 Years | 73 (6.2%) | 92 (7.4%) |
| 65 to 69 Years | 68 (5.8%) | 76 (6.1%) |
| 70 to 74 Years | 42 (3.6%) | 54 (4.3%) |
| 75 to 79 Years | 24 (2.0%) | 33 (2.6%) |
| 80 to 84 Years | 30 (2.5%) | 12 (1.0%) |
| 85 Years and over | 20 (1.7%) | 46 (3.7%) |
| Total | 1,176 (100.0%) | 1,250 (100.0%) |
Families and Households in Mccleary
Median Family Size in Mccleary
The median family size in Mccleary is 3.38 persons per family, with single male/father families (40 | 7.0%) accounting for the largest median family size of 4.6 persons per family. On the other hand, married-couple families (433 | 76.1%) represent the smallest median family size with 3.29 persons per family.
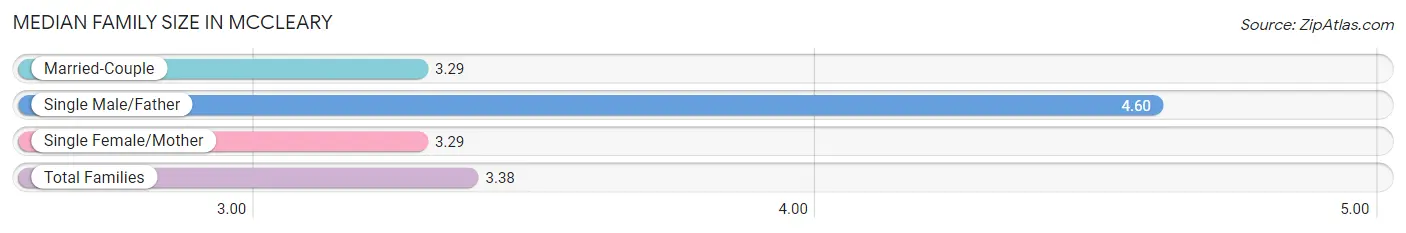
| Family Type | # Families | Family Size |
| Married-Couple | 433 (76.1%) | 3.29 |
| Single Male/Father | 40 (7.0%) | 4.60 |
| Single Female/Mother | 96 (16.9%) | 3.29 |
| Total Families | 569 (100.0%) | 3.38 |
Median Household Size in Mccleary
The median household size in Mccleary is 2.77 persons per household, with single male/father households (40 | 4.6%) accounting for the largest median household size of 5.6 persons per household. non-family households (307 | 35.0%) represent the smallest median household size with 1.36 persons per household.
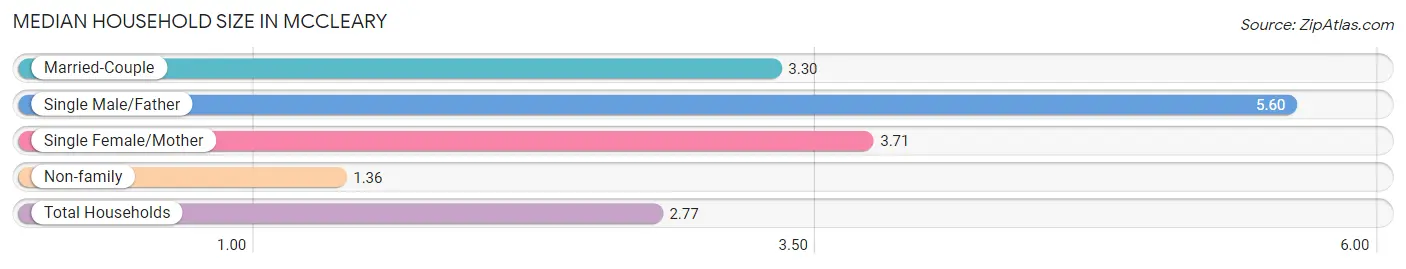
| Household Type | # Households | Household Size |
| Married-Couple | 433 (49.4%) | 3.30 |
| Single Male/Father | 40 (4.6%) | 5.60 |
| Single Female/Mother | 96 (11.0%) | 3.71 |
| Non-family | 307 (35.0%) | 1.36 |
| Total Households | 876 (100.0%) | 2.77 |
Household Size by Marriage Status in Mccleary
Out of a total of 876 households in Mccleary, 569 (64.9%) are family households, while 307 (35.0%) are nonfamily households. The most numerous type of family households are 2-person households, comprising 255, and the most common type of nonfamily households are 1-person households, comprising 240.
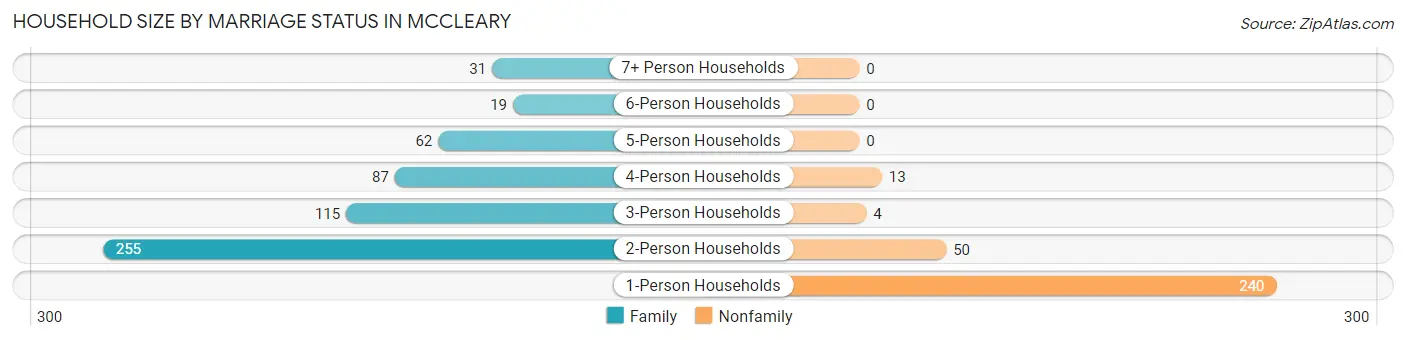
| Household Size | Family Households | Nonfamily Households |
| 1-Person Households | - | 240 (27.4%) |
| 2-Person Households | 255 (29.1%) | 50 (5.7%) |
| 3-Person Households | 115 (13.1%) | 4 (0.5%) |
| 4-Person Households | 87 (9.9%) | 13 (1.5%) |
| 5-Person Households | 62 (7.1%) | 0 (0.0%) |
| 6-Person Households | 19 (2.2%) | 0 (0.0%) |
| 7+ Person Households | 31 (3.5%) | 0 (0.0%) |
| Total | 569 (64.9%) | 307 (35.0%) |
Female Fertility in Mccleary
Fertility by Age in Mccleary
Average fertility rate in Mccleary is 25.0 births per 1,000 women. Women in the age bracket of 20 to 34 years have the highest fertility rate with 53.0 births per 1,000 women. Women in the age bracket of 20 to 34 years acount for 100.0% of all women with births.
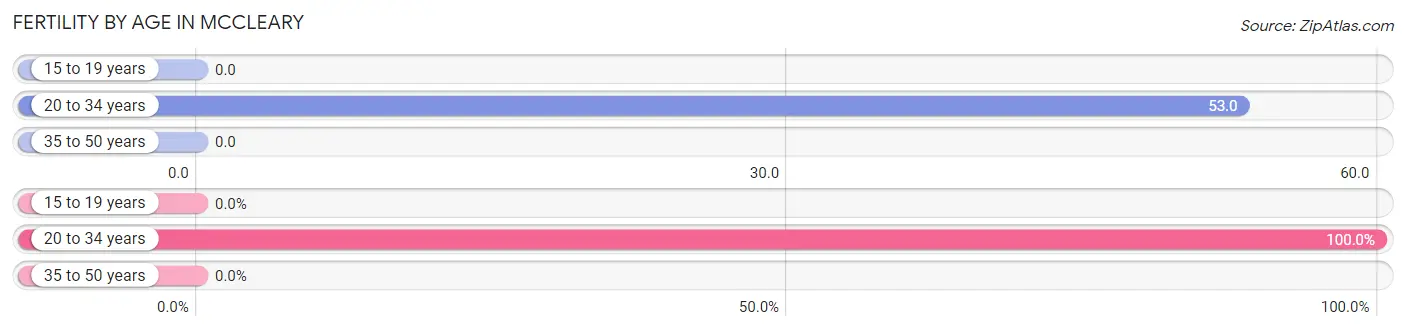
| Age Bracket | Women with Births | Births / 1,000 Women |
| 15 to 19 years | 0 (0.0%) | 0.0 |
| 20 to 34 years | 13 (100.0%) | 53.0 |
| 35 to 50 years | 0 (0.0%) | 0.0 |
| Total | 13 (100.0%) | 25.0 |
Fertility by Age by Marriage Status in Mccleary
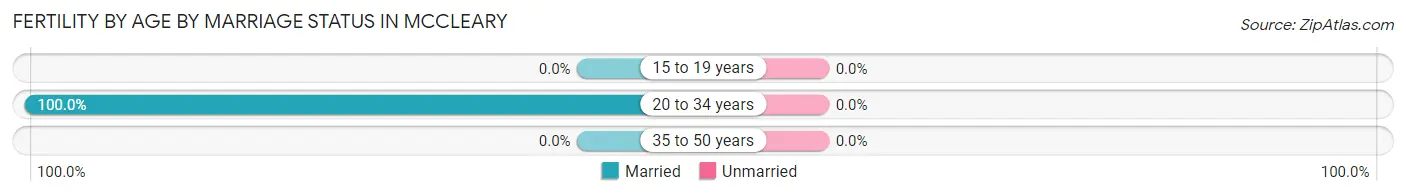
| Age Bracket | Married | Unmarried |
| 15 to 19 years | 0 (0.0%) | 0 (0.0%) |
| 20 to 34 years | 13 (100.0%) | 0 (0.0%) |
| 35 to 50 years | 0 (0.0%) | 0 (0.0%) |
| Total | 13 (100.0%) | 0 (0.0%) |
Fertility by Education in Mccleary
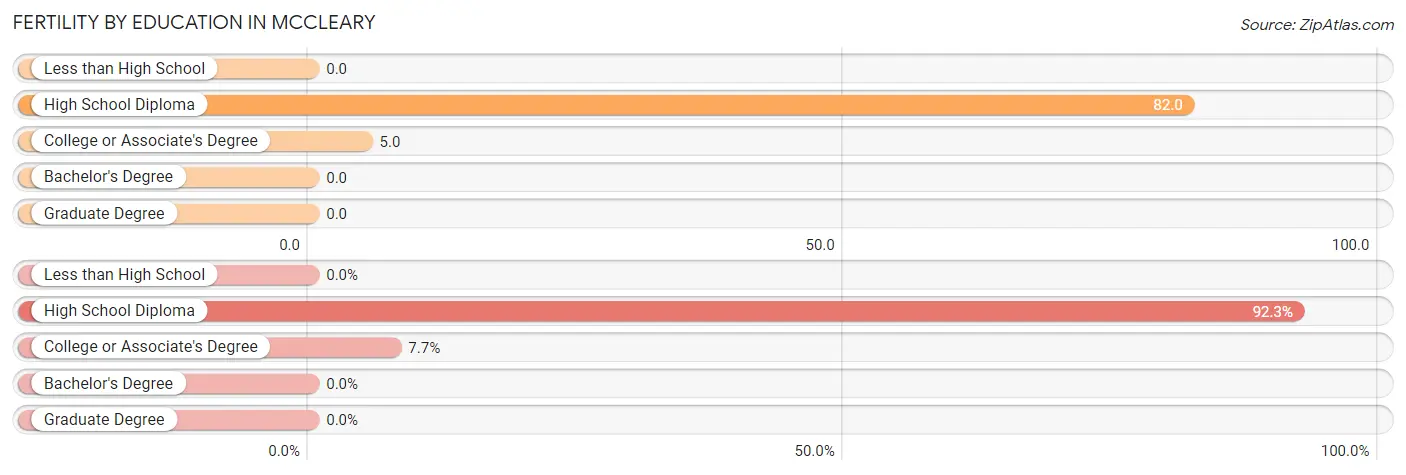
| Educational Attainment | Women with Births | Births / 1,000 Women |
| Less than High School | 0 (0.0%) | 0.0 |
| High School Diploma | 12 (92.3%) | 82.0 |
| College or Associate's Degree | 1 (7.7%) | 5.0 |
| Bachelor's Degree | 0 (0.0%) | 0.0 |
| Graduate Degree | 0 (0.0%) | 0.0 |
| Total | 13 (100.0%) | 25.0 |
Fertility by Education by Marriage Status in Mccleary
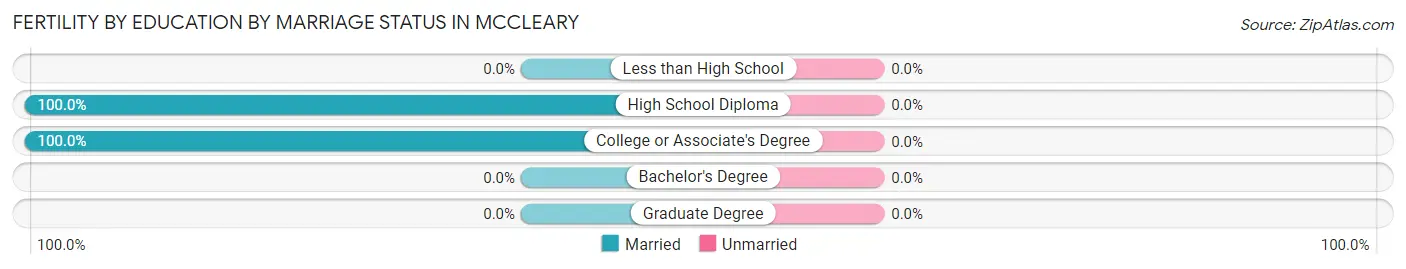
| Educational Attainment | Married | Unmarried |
| Less than High School | 0 (0.0%) | 0 (0.0%) |
| High School Diploma | 12 (100.0%) | 0 (0.0%) |
| College or Associate's Degree | 1 (100.0%) | 0 (0.0%) |
| Bachelor's Degree | 0 (0.0%) | 0 (0.0%) |
| Graduate Degree | 0 (0.0%) | 0 (0.0%) |
| Total | 13 (100.0%) | 0 (0.0%) |
Employment Characteristics in Mccleary
Employment by Class of Employer in Mccleary
Among the 913 employed individuals in Mccleary, private company employees (482 | 52.8%), state government employees (193 | 21.1%), and not-for-profit organizations (74 | 8.1%) make up the most common classes of employment.
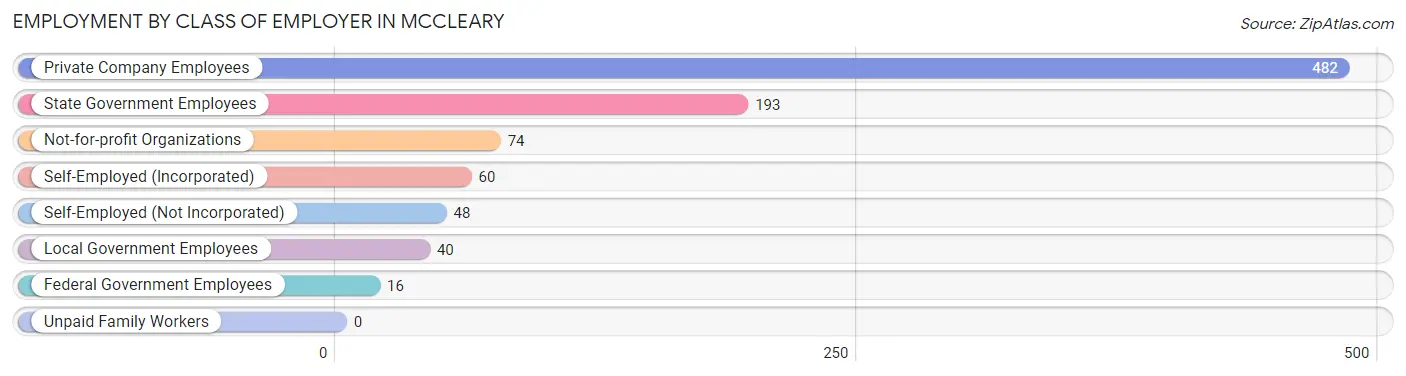
| Employer Class | # Employees | % Employees |
| Private Company Employees | 482 | 52.8% |
| Self-Employed (Incorporated) | 60 | 6.6% |
| Self-Employed (Not Incorporated) | 48 | 5.3% |
| Not-for-profit Organizations | 74 | 8.1% |
| Local Government Employees | 40 | 4.4% |
| State Government Employees | 193 | 21.1% |
| Federal Government Employees | 16 | 1.8% |
| Unpaid Family Workers | 0 | 0.0% |
| Total | 913 | 100.0% |
Employment Status by Age in Mccleary
According to the labor force statistics for Mccleary, out of the total population over 16 years of age (1,878), 53.2% or 999 individuals are in the labor force, with 8.3% or 83 of them unemployed. The age group with the highest labor force participation rate is 30 to 34 years, with 79.0% or 154 individuals in the labor force. Within the labor force, the 20 to 24 years age range has the highest percentage of unemployed individuals, with 32.3% or 21 of them being unemployed.
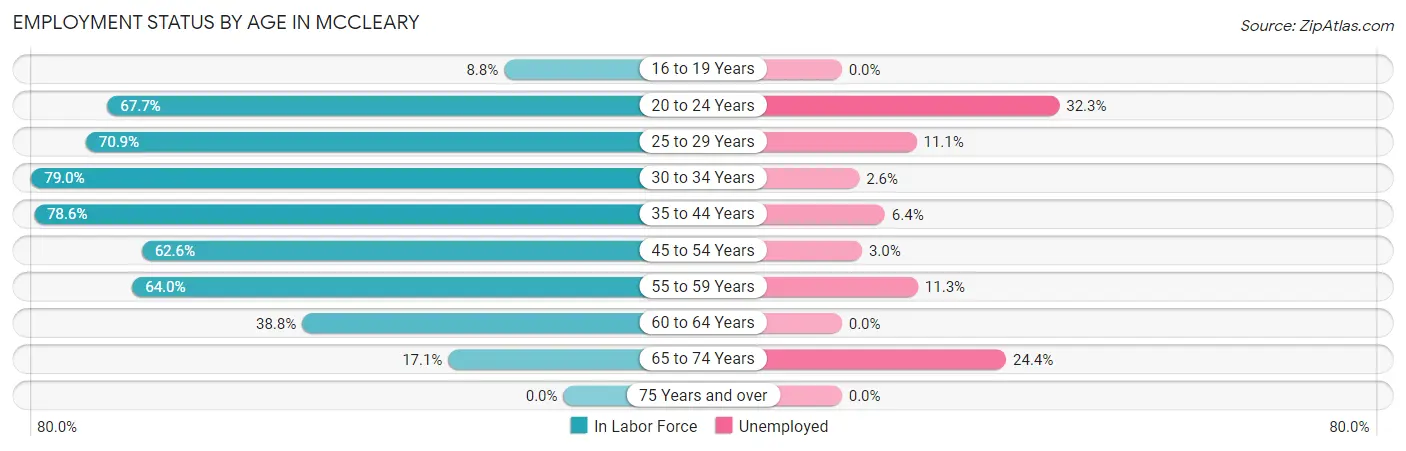
| Age Bracket | In Labor Force | Unemployed |
| 16 to 19 Years | 6 (8.8%) | 0 (0.0%) |
| 20 to 24 Years | 65 (67.7%) | 21 (32.3%) |
| 25 to 29 Years | 144 (70.9%) | 16 (11.1%) |
| 30 to 34 Years | 154 (79.0%) | 4 (2.6%) |
| 35 to 44 Years | 282 (78.6%) | 18 (6.4%) |
| 45 to 54 Years | 164 (62.6%) | 5 (3.0%) |
| 55 to 59 Years | 80 (64.0%) | 9 (11.3%) |
| 60 to 64 Years | 64 (38.8%) | 0 (0.0%) |
| 65 to 74 Years | 41 (17.1%) | 10 (24.4%) |
| 75 Years and over | 0 (0.0%) | 0 (0.0%) |
| Total | 999 (53.2%) | 83 (8.3%) |
Employment Status by Educational Attainment in Mccleary
According to labor force statistics for Mccleary, 67.8% of individuals (888) out of the total population between 25 and 64 years of age (1,309) are in the labor force, with 5.9% or 52 of them being unemployed. The group with the highest labor force participation rate are those with the educational attainment of bachelor's degree or higher, with 81.8% or 207 individuals in the labor force. Within the labor force, individuals with high school diploma education have the highest percentage of unemployment, with 16.1% or 31 of them being unemployed.
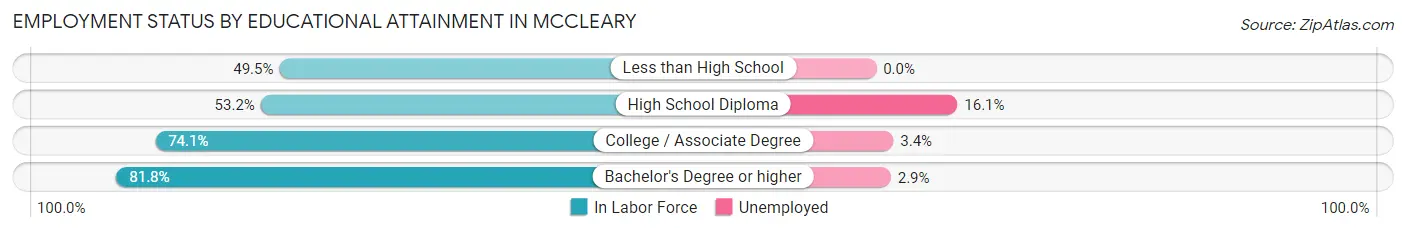
| Educational Attainment | In Labor Force | Unemployed |
| Less than High School | 51 (49.5%) | 0 (0.0%) |
| High School Diploma | 193 (53.2%) | 58 (16.1%) |
| College / Associate Degree | 437 (74.1%) | 20 (3.4%) |
| Bachelor's Degree or higher | 207 (81.8%) | 7 (2.9%) |
| Total | 888 (67.8%) | 77 (5.9%) |
Employment Occupations by Sex in Mccleary
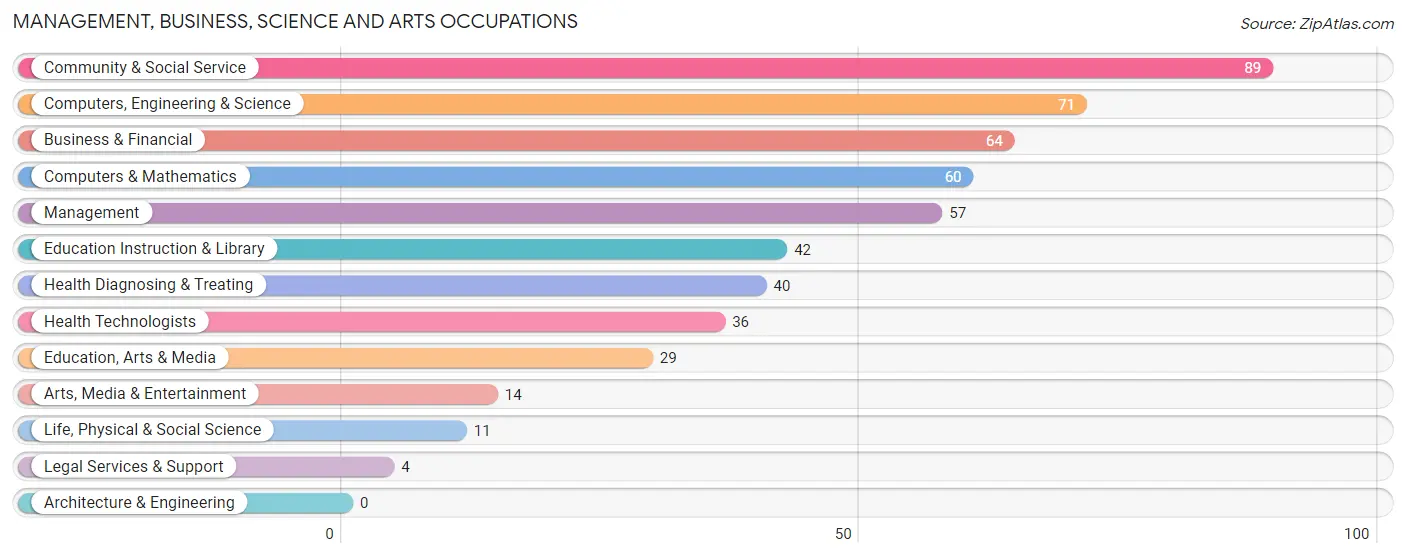
Management, Business, Science and Arts Occupations
The most common Management, Business, Science and Arts occupations in Mccleary are Community & Social Service (89 | 9.7%), Computers, Engineering & Science (71 | 7.7%), Business & Financial (64 | 7.0%), Computers & Mathematics (60 | 6.5%), and Management (57 | 6.2%).
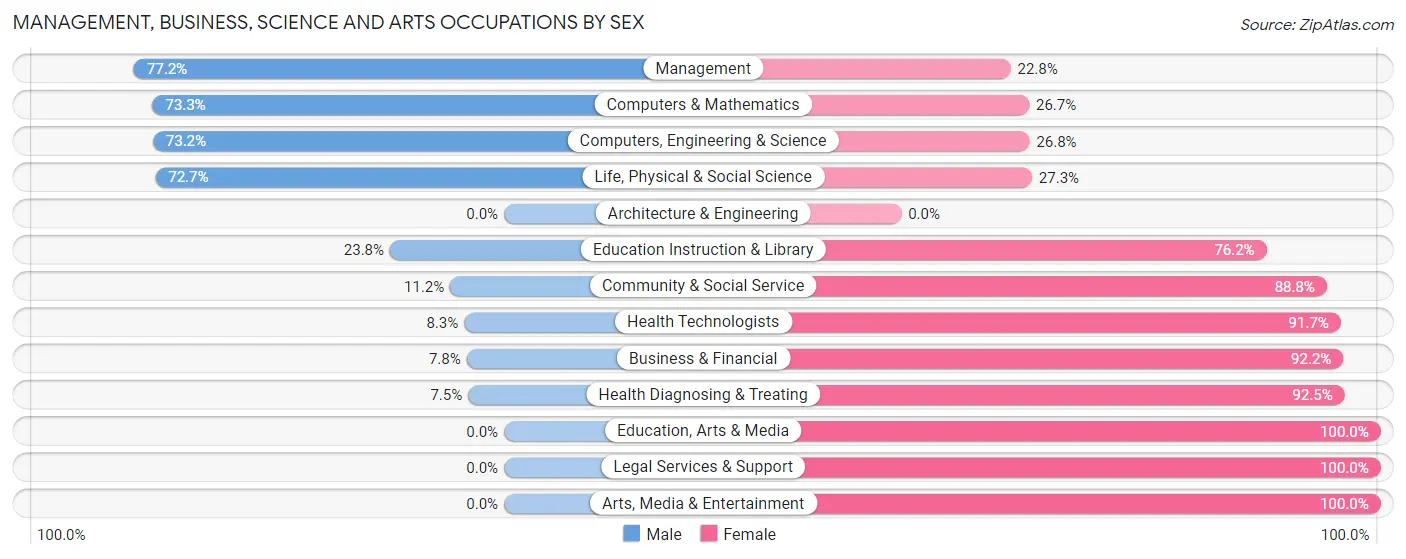
Management, Business, Science and Arts Occupations by Sex
Within the Management, Business, Science and Arts occupations in Mccleary, the most male-oriented occupations are Management (77.2%), Computers & Mathematics (73.3%), and Computers, Engineering & Science (73.2%), while the most female-oriented occupations are Education, Arts & Media (100.0%), Legal Services & Support (100.0%), and Arts, Media & Entertainment (100.0%).
| Occupation | Male | Female |
| Management | 44 (77.2%) | 13 (22.8%) |
| Business & Financial | 5 (7.8%) | 59 (92.2%) |
| Computers, Engineering & Science | 52 (73.2%) | 19 (26.8%) |
| Computers & Mathematics | 44 (73.3%) | 16 (26.7%) |
| Architecture & Engineering | 0 (0.0%) | 0 (0.0%) |
| Life, Physical & Social Science | 8 (72.7%) | 3 (27.3%) |
| Community & Social Service | 10 (11.2%) | 79 (88.8%) |
| Education, Arts & Media | 0 (0.0%) | 29 (100.0%) |
| Legal Services & Support | 0 (0.0%) | 4 (100.0%) |
| Education Instruction & Library | 10 (23.8%) | 32 (76.2%) |
| Arts, Media & Entertainment | 0 (0.0%) | 14 (100.0%) |
| Health Diagnosing & Treating | 3 (7.5%) | 37 (92.5%) |
| Health Technologists | 3 (8.3%) | 33 (91.7%) |
| Total (Category) | 114 (35.5%) | 207 (64.5%) |
| Total (Overall) | 488 (53.2%) | 429 (46.8%) |
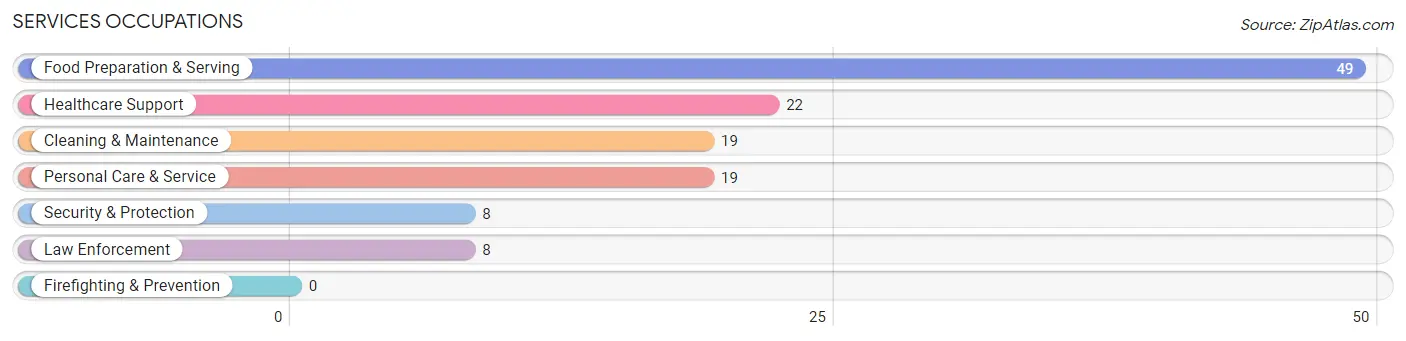
Services Occupations
The most common Services occupations in Mccleary are Food Preparation & Serving (49 | 5.3%), Healthcare Support (22 | 2.4%), Cleaning & Maintenance (19 | 2.1%), Personal Care & Service (19 | 2.1%), and Security & Protection (8 | 0.9%).
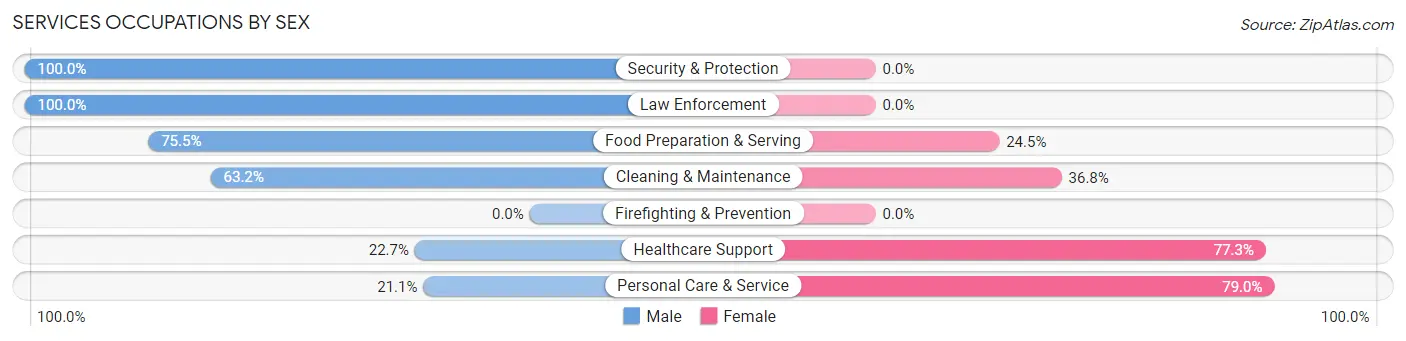
Services Occupations by Sex
Within the Services occupations in Mccleary, the most male-oriented occupations are Security & Protection (100.0%), Law Enforcement (100.0%), and Food Preparation & Serving (75.5%), while the most female-oriented occupations are Personal Care & Service (78.9%), Healthcare Support (77.3%), and Cleaning & Maintenance (36.8%).
| Occupation | Male | Female |
| Healthcare Support | 5 (22.7%) | 17 (77.3%) |
| Security & Protection | 8 (100.0%) | 0 (0.0%) |
| Firefighting & Prevention | 0 (0.0%) | 0 (0.0%) |
| Law Enforcement | 8 (100.0%) | 0 (0.0%) |
| Food Preparation & Serving | 37 (75.5%) | 12 (24.5%) |
| Cleaning & Maintenance | 12 (63.2%) | 7 (36.8%) |
| Personal Care & Service | 4 (21.0%) | 15 (78.9%) |
| Total (Category) | 66 (56.4%) | 51 (43.6%) |
| Total (Overall) | 488 (53.2%) | 429 (46.8%) |
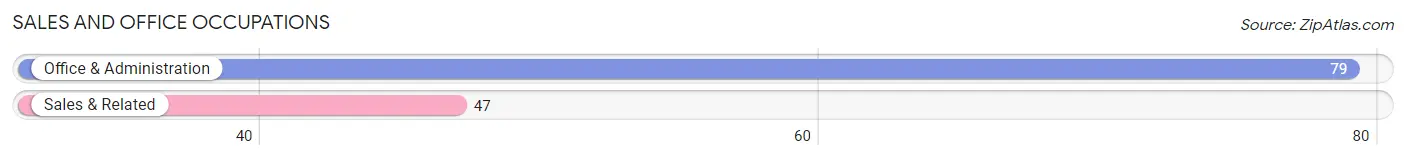
Sales and Office Occupations
The most common Sales and Office occupations in Mccleary are Office & Administration (79 | 8.6%), and Sales & Related (47 | 5.1%).
Sales and Office Occupations by Sex
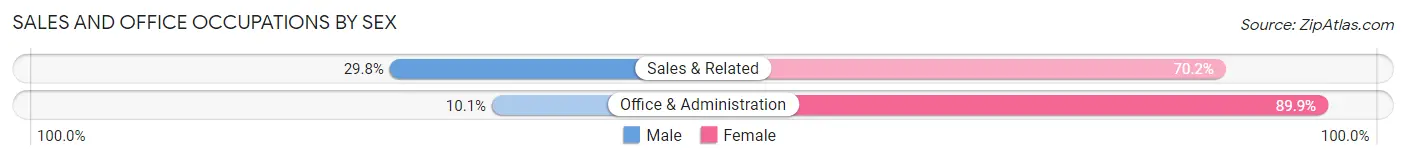
| Occupation | Male | Female |
| Sales & Related | 14 (29.8%) | 33 (70.2%) |
| Office & Administration | 8 (10.1%) | 71 (89.9%) |
| Total (Category) | 22 (17.5%) | 104 (82.5%) |
| Total (Overall) | 488 (53.2%) | 429 (46.8%) |
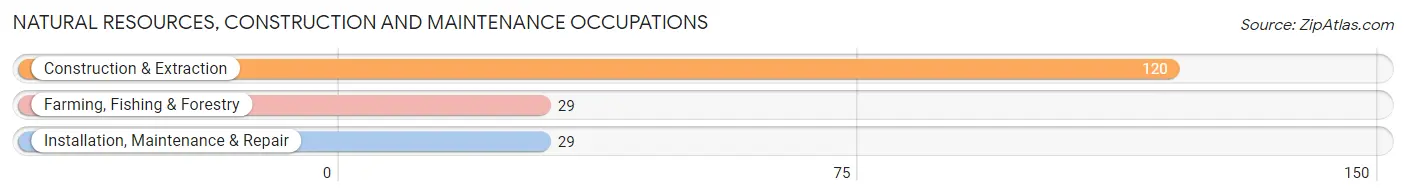
Natural Resources, Construction and Maintenance Occupations
The most common Natural Resources, Construction and Maintenance occupations in Mccleary are Construction & Extraction (120 | 13.1%), Farming, Fishing & Forestry (29 | 3.2%), and Installation, Maintenance & Repair (29 | 3.2%).
Natural Resources, Construction and Maintenance Occupations by Sex
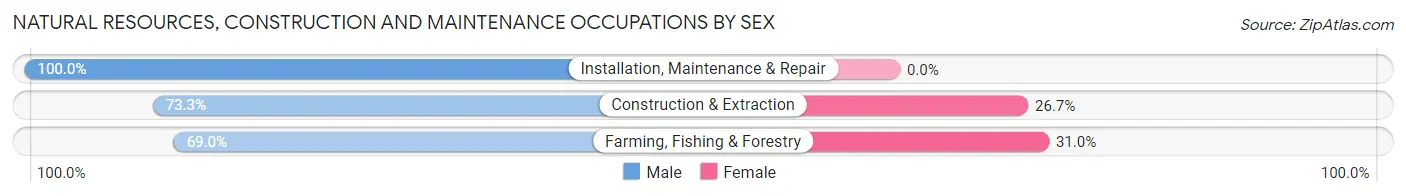
| Occupation | Male | Female |
| Farming, Fishing & Forestry | 20 (69.0%) | 9 (31.0%) |
| Construction & Extraction | 88 (73.3%) | 32 (26.7%) |
| Installation, Maintenance & Repair | 29 (100.0%) | 0 (0.0%) |
| Total (Category) | 137 (77.0%) | 41 (23.0%) |
| Total (Overall) | 488 (53.2%) | 429 (46.8%) |
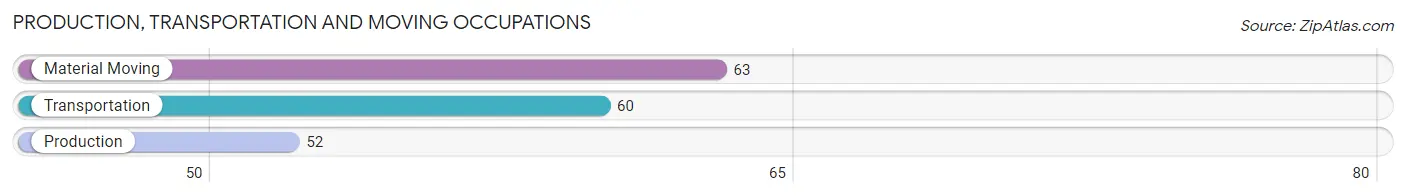
Production, Transportation and Moving Occupations
The most common Production, Transportation and Moving occupations in Mccleary are Material Moving (63 | 6.9%), Transportation (60 | 6.5%), and Production (52 | 5.7%).
Production, Transportation and Moving Occupations by Sex
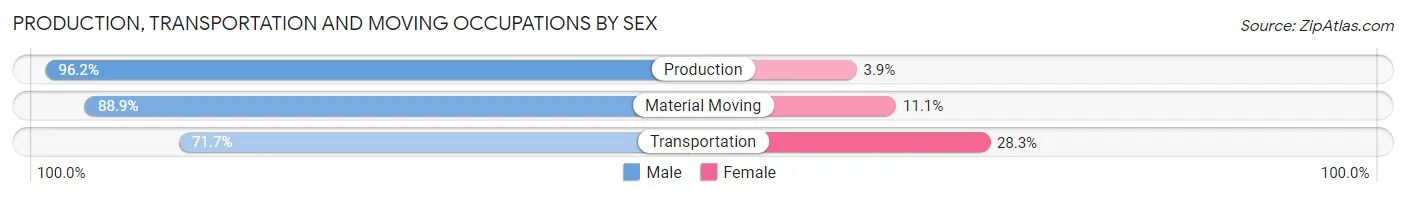
| Occupation | Male | Female |
| Production | 50 (96.2%) | 2 (3.8%) |
| Transportation | 43 (71.7%) | 17 (28.3%) |
| Material Moving | 56 (88.9%) | 7 (11.1%) |
| Total (Category) | 149 (85.1%) | 26 (14.9%) |
| Total (Overall) | 488 (53.2%) | 429 (46.8%) |
Employment Industries by Sex in Mccleary
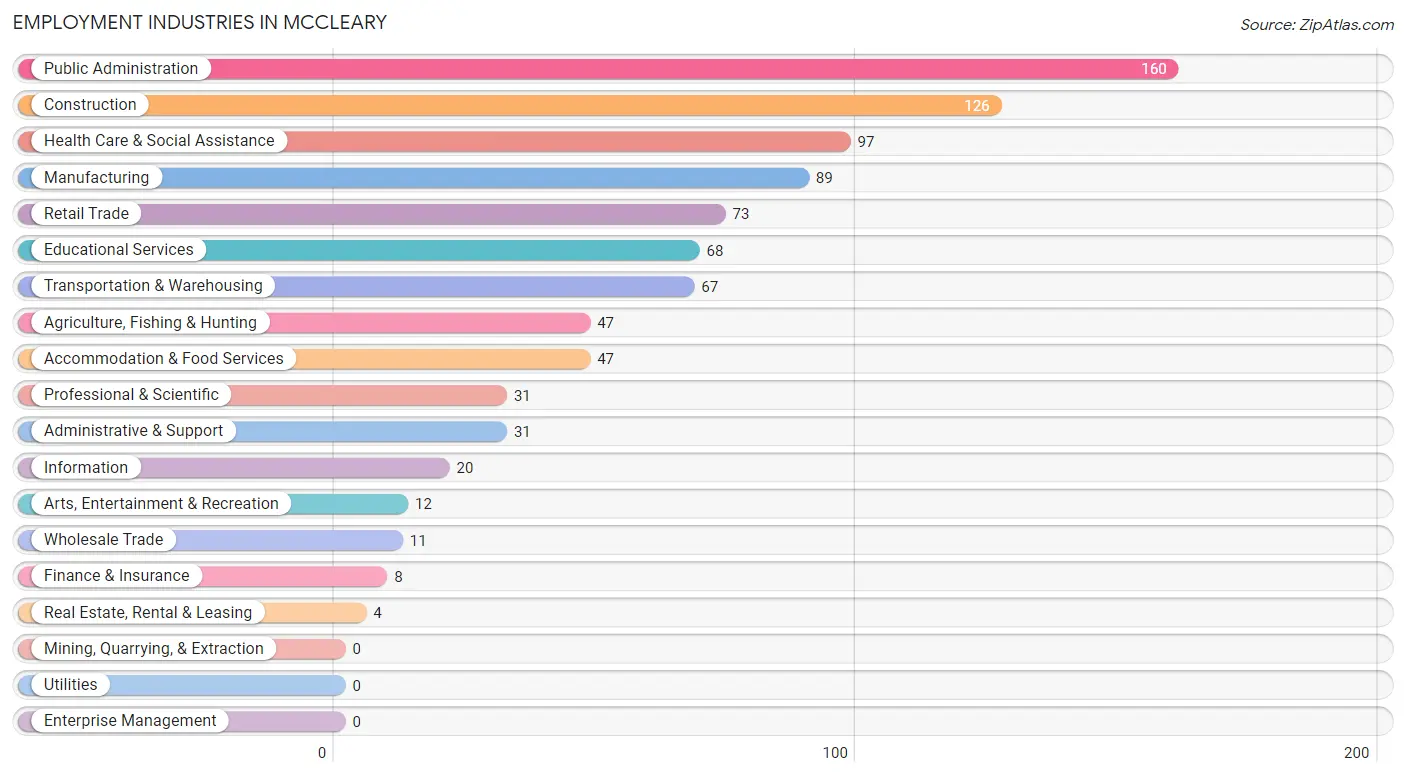
Employment Industries in Mccleary
The major employment industries in Mccleary include Public Administration (160 | 17.4%), Construction (126 | 13.7%), Health Care & Social Assistance (97 | 10.6%), Manufacturing (89 | 9.7%), and Retail Trade (73 | 8.0%).
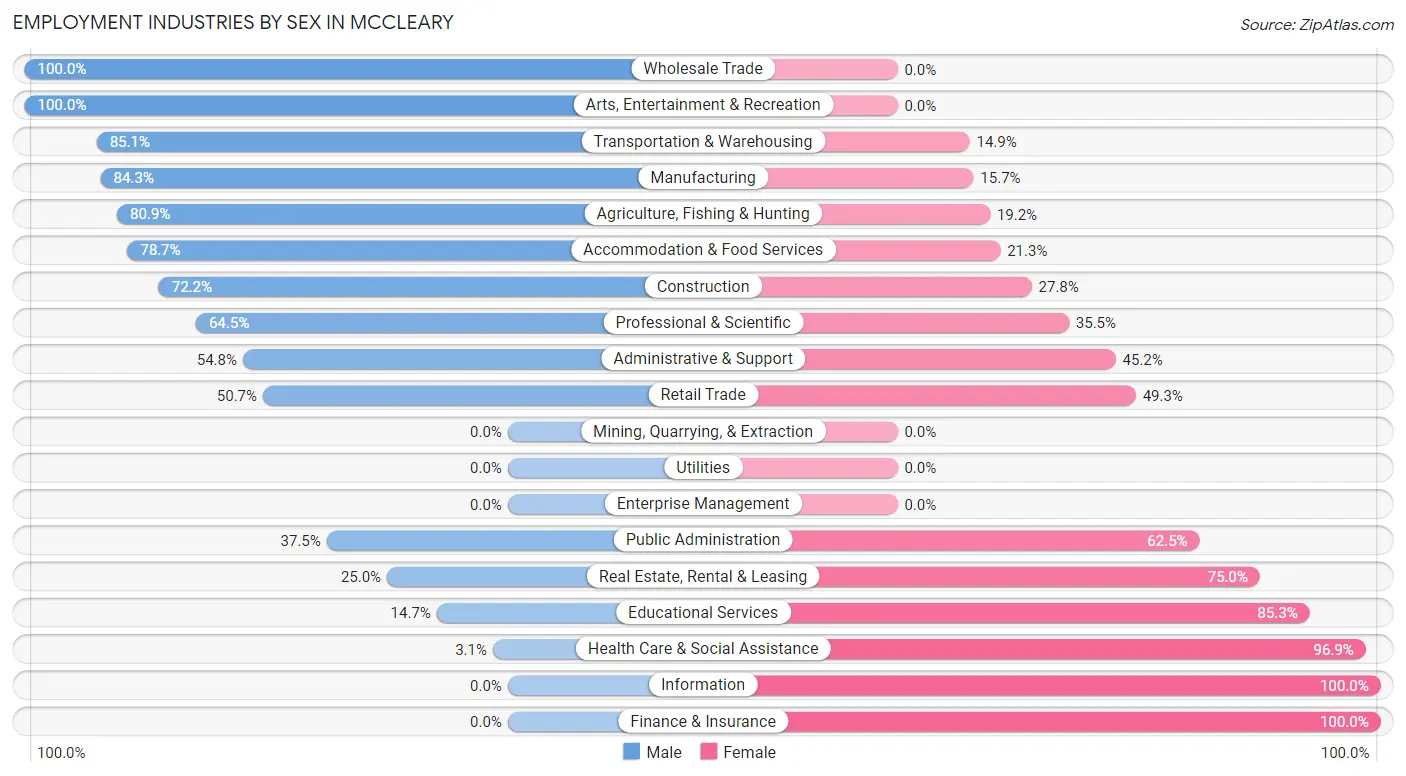
Employment Industries by Sex in Mccleary
The Mccleary industries that see more men than women are Wholesale Trade (100.0%), Arts, Entertainment & Recreation (100.0%), and Transportation & Warehousing (85.1%), whereas the industries that tend to have a higher number of women are Information (100.0%), Finance & Insurance (100.0%), and Health Care & Social Assistance (96.9%).
| Industry | Male | Female |
| Agriculture, Fishing & Hunting | 38 (80.8%) | 9 (19.2%) |
| Mining, Quarrying, & Extraction | 0 (0.0%) | 0 (0.0%) |
| Construction | 91 (72.2%) | 35 (27.8%) |
| Manufacturing | 75 (84.3%) | 14 (15.7%) |
| Wholesale Trade | 11 (100.0%) | 0 (0.0%) |
| Retail Trade | 37 (50.7%) | 36 (49.3%) |
| Transportation & Warehousing | 57 (85.1%) | 10 (14.9%) |
| Utilities | 0 (0.0%) | 0 (0.0%) |
| Information | 0 (0.0%) | 20 (100.0%) |
| Finance & Insurance | 0 (0.0%) | 8 (100.0%) |
| Real Estate, Rental & Leasing | 1 (25.0%) | 3 (75.0%) |
| Professional & Scientific | 20 (64.5%) | 11 (35.5%) |
| Enterprise Management | 0 (0.0%) | 0 (0.0%) |
| Administrative & Support | 17 (54.8%) | 14 (45.2%) |
| Educational Services | 10 (14.7%) | 58 (85.3%) |
| Health Care & Social Assistance | 3 (3.1%) | 94 (96.9%) |
| Arts, Entertainment & Recreation | 12 (100.0%) | 0 (0.0%) |
| Accommodation & Food Services | 37 (78.7%) | 10 (21.3%) |
| Public Administration | 60 (37.5%) | 100 (62.5%) |
| Total | 488 (53.2%) | 429 (46.8%) |
Education in Mccleary
School Enrollment in Mccleary
The most common levels of schooling among the 515 students in Mccleary are middle school (174 | 33.8%), elementary school (135 | 26.2%), and college / undergraduate (69 | 13.4%).
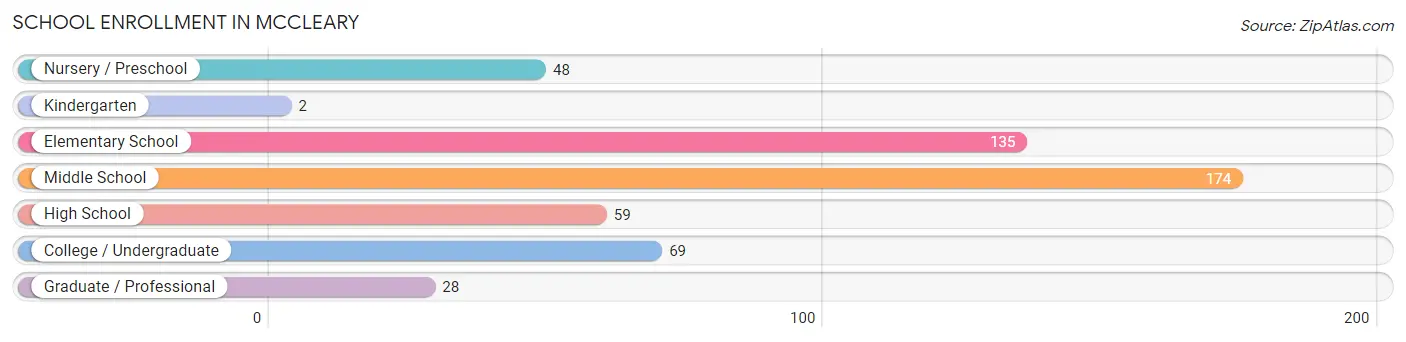
| School Level | # Students | % Students |
| Nursery / Preschool | 48 | 9.3% |
| Kindergarten | 2 | 0.4% |
| Elementary School | 135 | 26.2% |
| Middle School | 174 | 33.8% |
| High School | 59 | 11.5% |
| College / Undergraduate | 69 | 13.4% |
| Graduate / Professional | 28 | 5.4% |
| Total | 515 | 100.0% |
School Enrollment by Age by Funding Source in Mccleary
Out of a total of 515 students who are enrolled in schools in Mccleary, 64 (12.4%) attend a private institution, while the remaining 451 (87.6%) are enrolled in public schools. The age group of 3 to 4 year olds has the highest likelihood of being enrolled in private schools, with 38 (79.2% in the age bracket) enrolled. Conversely, the age group of 20 to 24 year olds has the lowest likelihood of being enrolled in a private school, with 39 (100.0% in the age bracket) attending a public institution.
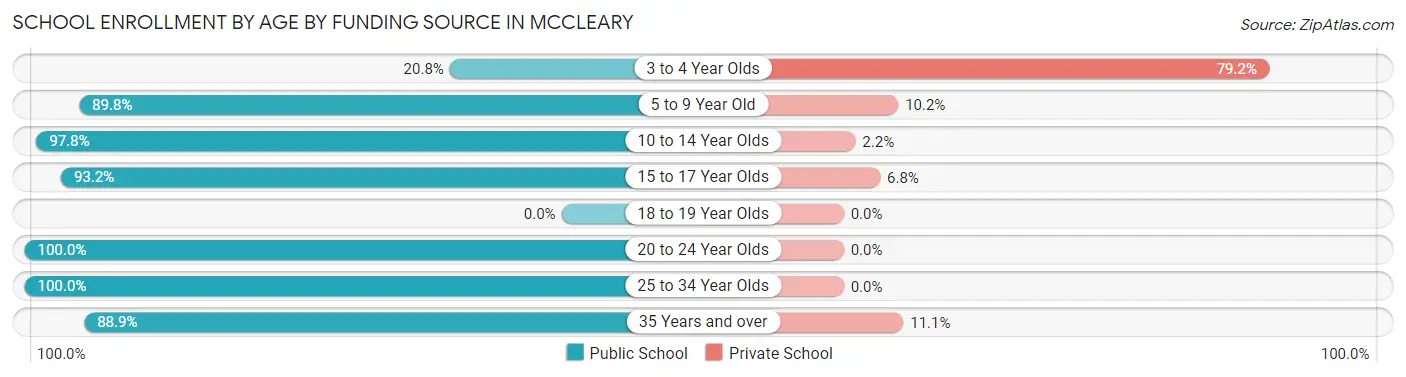
| Age Bracket | Public School | Private School |
| 3 to 4 Year Olds | 10 (20.8%) | 38 (79.2%) |
| 5 to 9 Year Old | 115 (89.8%) | 13 (10.2%) |
| 10 to 14 Year Olds | 179 (97.8%) | 4 (2.2%) |
| 15 to 17 Year Olds | 55 (93.2%) | 4 (6.8%) |
| 18 to 19 Year Olds | 0 (0.0%) | 0 (0.0%) |
| 20 to 24 Year Olds | 39 (100.0%) | 0 (0.0%) |
| 25 to 34 Year Olds | 13 (100.0%) | 0 (0.0%) |
| 35 Years and over | 40 (88.9%) | 5 (11.1%) |
| Total | 451 (87.6%) | 64 (12.4%) |
Educational Attainment by Field of Study in Mccleary
Business (45 | 14.8%), social sciences (40 | 13.2%), science & technology (36 | 11.8%), bio, nature & agricultural (35 | 11.5%), and liberal arts & history (32 | 10.5%) are the most common fields of study among 304 individuals in Mccleary who have obtained a bachelor's degree or higher.
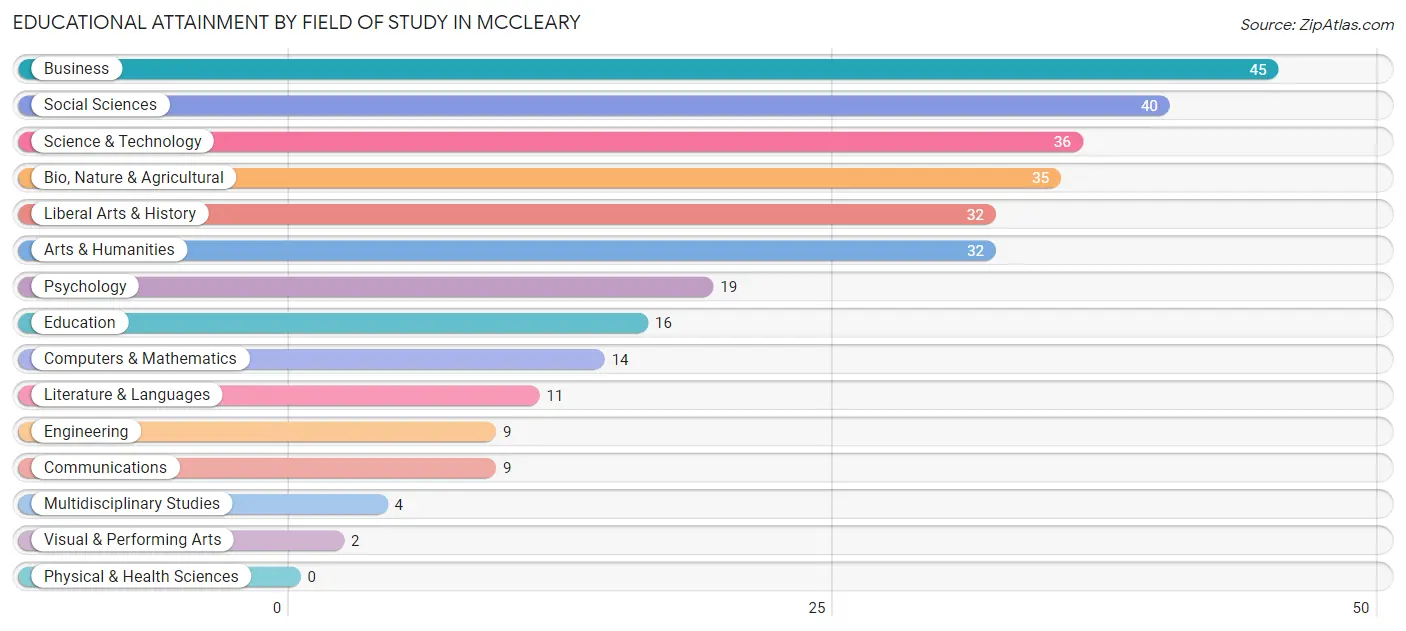
| Field of Study | # Graduates | % Graduates |
| Computers & Mathematics | 14 | 4.6% |
| Bio, Nature & Agricultural | 35 | 11.5% |
| Physical & Health Sciences | 0 | 0.0% |
| Psychology | 19 | 6.2% |
| Social Sciences | 40 | 13.2% |
| Engineering | 9 | 3.0% |
| Multidisciplinary Studies | 4 | 1.3% |
| Science & Technology | 36 | 11.8% |
| Business | 45 | 14.8% |
| Education | 16 | 5.3% |
| Literature & Languages | 11 | 3.6% |
| Liberal Arts & History | 32 | 10.5% |
| Visual & Performing Arts | 2 | 0.7% |
| Communications | 9 | 3.0% |
| Arts & Humanities | 32 | 10.5% |
| Total | 304 | 100.0% |
Transportation & Commute in Mccleary
Vehicle Availability by Sex in Mccleary
The most prevalent vehicle ownership categories in Mccleary are males with 2 vehicles (216, accounting for 44.6%) and females with 2 vehicles (191, making up 50.3%).
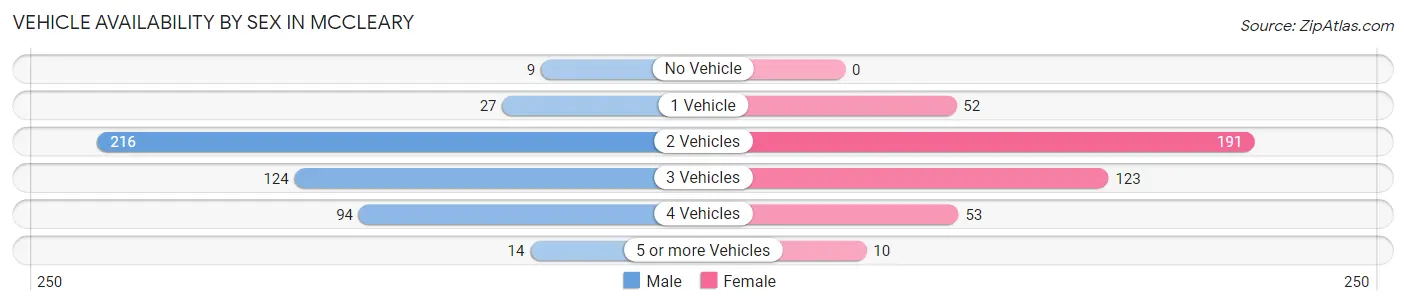
| Vehicles Available | Male | Female |
| No Vehicle | 9 (1.9%) | 0 (0.0%) |
| 1 Vehicle | 27 (5.6%) | 52 (12.1%) |
| 2 Vehicles | 216 (44.6%) | 191 (44.5%) |
| 3 Vehicles | 124 (25.6%) | 123 (28.7%) |
| 4 Vehicles | 94 (19.4%) | 53 (12.3%) |
| 5 or more Vehicles | 14 (2.9%) | 10 (2.3%) |
| Total | 484 (100.0%) | 429 (100.0%) |
Commute Time in Mccleary
The most frequently occuring commute durations in Mccleary are 30 to 34 minutes (165 commuters, 21.9%), 25 to 29 minutes (139 commuters, 18.4%), and 45 to 59 minutes (77 commuters, 10.2%).
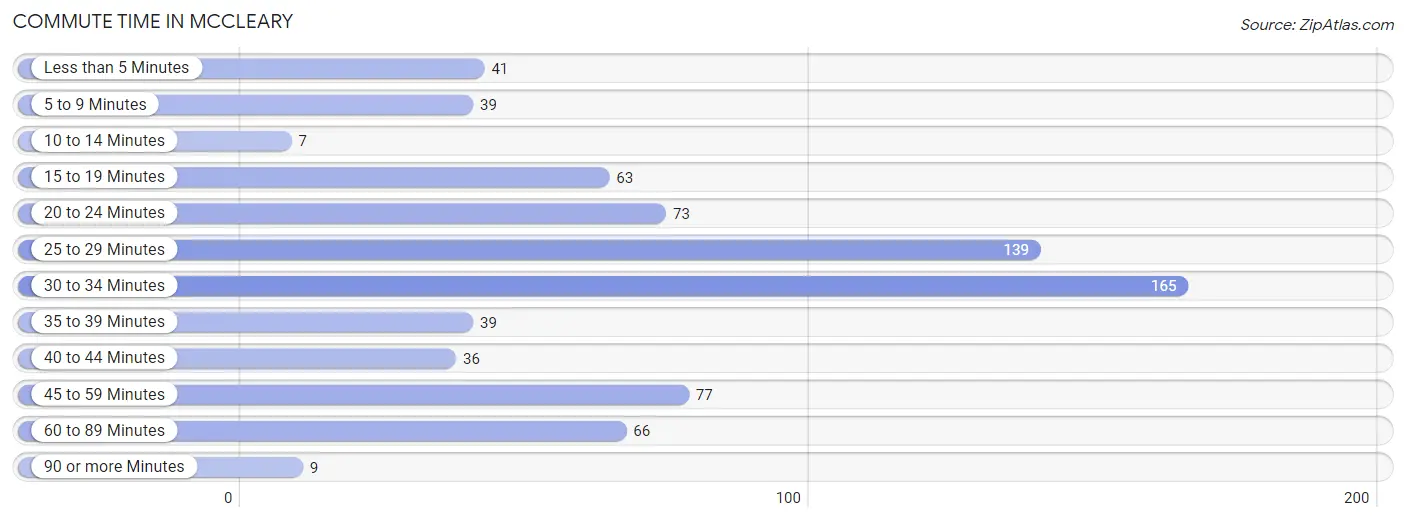
| Commute Time | # Commuters | % Commuters |
| Less than 5 Minutes | 41 | 5.4% |
| 5 to 9 Minutes | 39 | 5.2% |
| 10 to 14 Minutes | 7 | 0.9% |
| 15 to 19 Minutes | 63 | 8.4% |
| 20 to 24 Minutes | 73 | 9.7% |
| 25 to 29 Minutes | 139 | 18.4% |
| 30 to 34 Minutes | 165 | 21.9% |
| 35 to 39 Minutes | 39 | 5.2% |
| 40 to 44 Minutes | 36 | 4.8% |
| 45 to 59 Minutes | 77 | 10.2% |
| 60 to 89 Minutes | 66 | 8.7% |
| 90 or more Minutes | 9 | 1.2% |
Commute Time by Sex in Mccleary
The most common commute times in Mccleary are 30 to 34 minutes (125 commuters, 28.1%) for males and 25 to 29 minutes (59 commuters, 19.0%) for females.
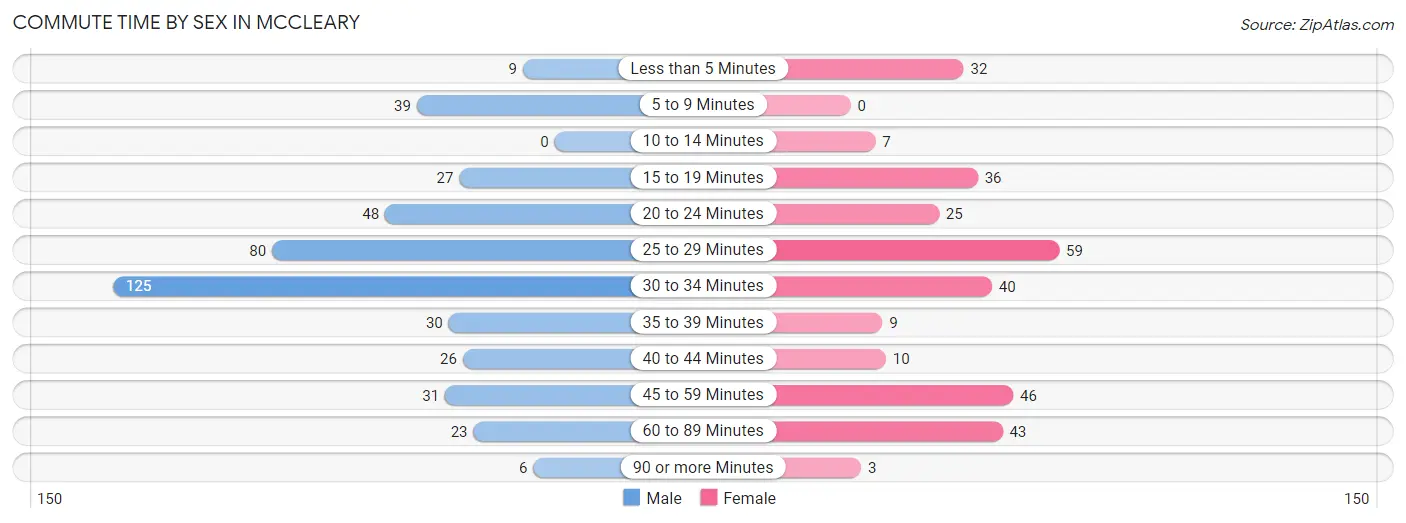
| Commute Time | Male | Female |
| Less than 5 Minutes | 9 (2.0%) | 32 (10.3%) |
| 5 to 9 Minutes | 39 (8.8%) | 0 (0.0%) |
| 10 to 14 Minutes | 0 (0.0%) | 7 (2.3%) |
| 15 to 19 Minutes | 27 (6.1%) | 36 (11.6%) |
| 20 to 24 Minutes | 48 (10.8%) | 25 (8.1%) |
| 25 to 29 Minutes | 80 (18.0%) | 59 (19.0%) |
| 30 to 34 Minutes | 125 (28.1%) | 40 (12.9%) |
| 35 to 39 Minutes | 30 (6.8%) | 9 (2.9%) |
| 40 to 44 Minutes | 26 (5.9%) | 10 (3.2%) |
| 45 to 59 Minutes | 31 (7.0%) | 46 (14.8%) |
| 60 to 89 Minutes | 23 (5.2%) | 43 (13.9%) |
| 90 or more Minutes | 6 (1.3%) | 3 (1.0%) |
Time of Departure to Work by Sex in Mccleary
The most frequent times of departure to work in Mccleary are 6:00 AM to 6:29 AM (104, 23.4%) for males and 7:00 AM to 7:29 AM (74, 23.9%) for females.
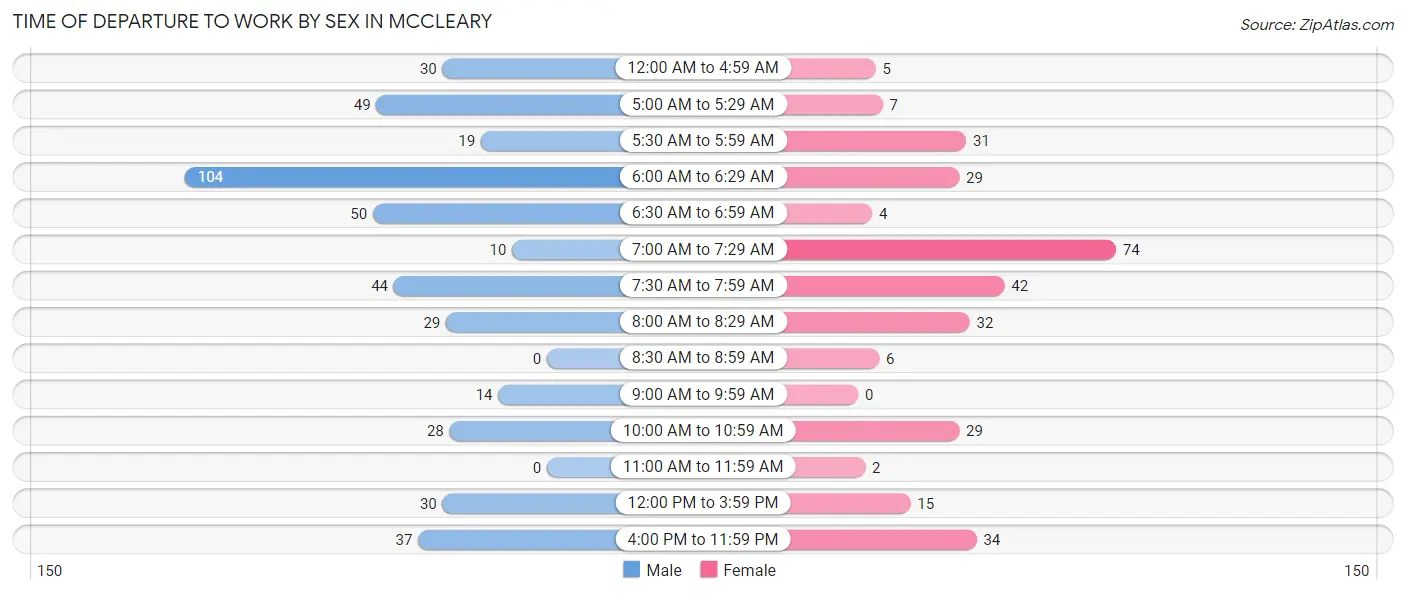
| Time of Departure | Male | Female |
| 12:00 AM to 4:59 AM | 30 (6.8%) | 5 (1.6%) |
| 5:00 AM to 5:29 AM | 49 (11.0%) | 7 (2.3%) |
| 5:30 AM to 5:59 AM | 19 (4.3%) | 31 (10.0%) |
| 6:00 AM to 6:29 AM | 104 (23.4%) | 29 (9.3%) |
| 6:30 AM to 6:59 AM | 50 (11.3%) | 4 (1.3%) |
| 7:00 AM to 7:29 AM | 10 (2.2%) | 74 (23.9%) |
| 7:30 AM to 7:59 AM | 44 (9.9%) | 42 (13.6%) |
| 8:00 AM to 8:29 AM | 29 (6.5%) | 32 (10.3%) |
| 8:30 AM to 8:59 AM | 0 (0.0%) | 6 (1.9%) |
| 9:00 AM to 9:59 AM | 14 (3.2%) | 0 (0.0%) |
| 10:00 AM to 10:59 AM | 28 (6.3%) | 29 (9.3%) |
| 11:00 AM to 11:59 AM | 0 (0.0%) | 2 (0.6%) |
| 12:00 PM to 3:59 PM | 30 (6.8%) | 15 (4.8%) |
| 4:00 PM to 11:59 PM | 37 (8.3%) | 34 (11.0%) |
| Total | 444 (100.0%) | 310 (100.0%) |
Housing Occupancy in Mccleary
Occupancy by Ownership in Mccleary
Of the total 876 dwellings in Mccleary, owner-occupied units account for 693 (79.1%), while renter-occupied units make up 183 (20.9%).
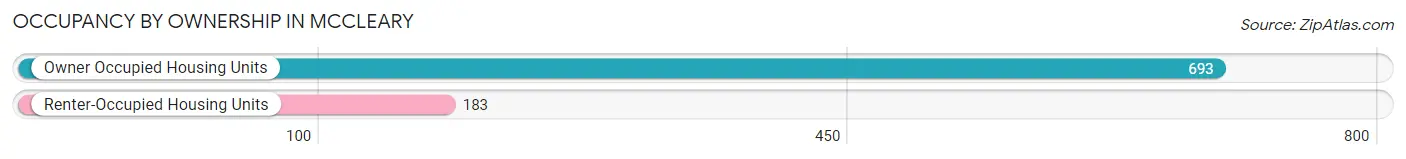
| Occupancy | # Housing Units | % Housing Units |
| Owner Occupied Housing Units | 693 | 79.1% |
| Renter-Occupied Housing Units | 183 | 20.9% |
| Total Occupied Housing Units | 876 | 100.0% |
Occupancy by Household Size in Mccleary
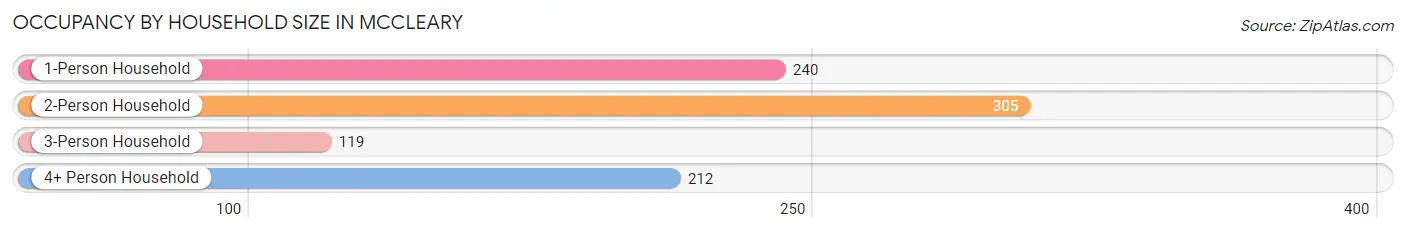
| Household Size | # Housing Units | % Housing Units |
| 1-Person Household | 240 | 27.4% |
| 2-Person Household | 305 | 34.8% |
| 3-Person Household | 119 | 13.6% |
| 4+ Person Household | 212 | 24.2% |
| Total Housing Units | 876 | 100.0% |
Occupancy by Ownership by Household Size in Mccleary
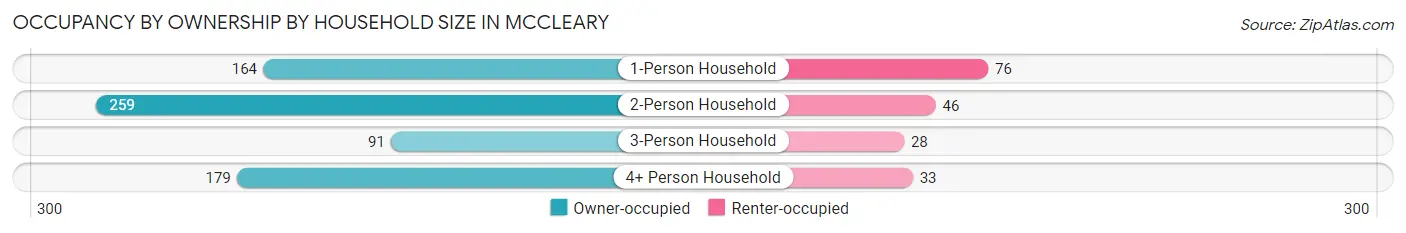
| Household Size | Owner-occupied | Renter-occupied |
| 1-Person Household | 164 (68.3%) | 76 (31.7%) |
| 2-Person Household | 259 (84.9%) | 46 (15.1%) |
| 3-Person Household | 91 (76.5%) | 28 (23.5%) |
| 4+ Person Household | 179 (84.4%) | 33 (15.6%) |
| Total Housing Units | 693 (79.1%) | 183 (20.9%) |
Occupancy by Educational Attainment in Mccleary
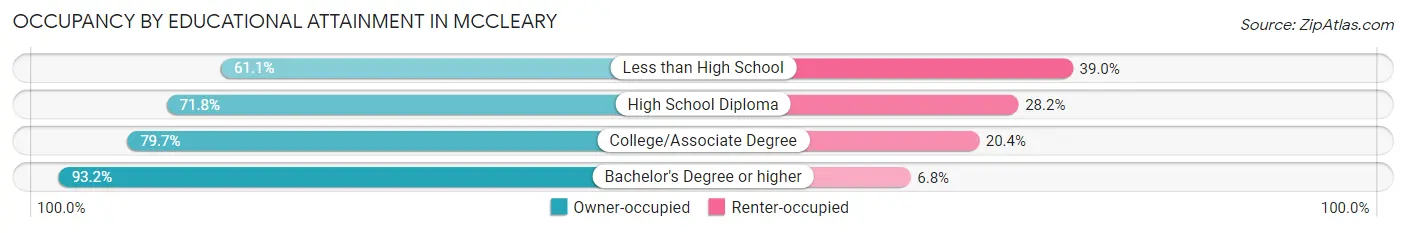
| Household Size | Owner-occupied | Renter-occupied |
| Less than High School | 58 (61.1%) | 37 (39.0%) |
| High School Diploma | 102 (71.8%) | 40 (28.2%) |
| College/Associate Degree | 368 (79.6%) | 94 (20.3%) |
| Bachelor's Degree or higher | 165 (93.2%) | 12 (6.8%) |
Occupancy by Age of Householder in Mccleary
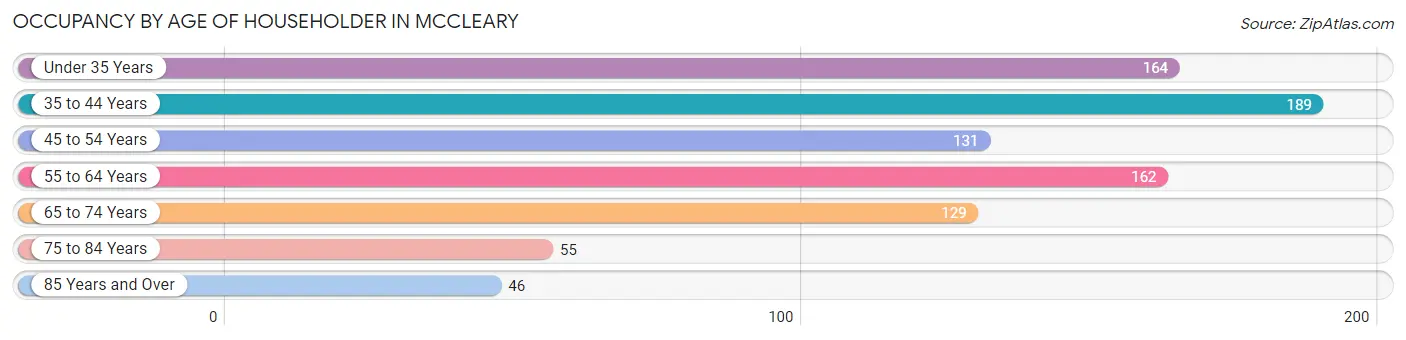
| Age Bracket | # Households | % Households |
| Under 35 Years | 164 | 18.7% |
| 35 to 44 Years | 189 | 21.6% |
| 45 to 54 Years | 131 | 14.9% |
| 55 to 64 Years | 162 | 18.5% |
| 65 to 74 Years | 129 | 14.7% |
| 75 to 84 Years | 55 | 6.3% |
| 85 Years and Over | 46 | 5.2% |
| Total | 876 | 100.0% |
Housing Finances in Mccleary
Median Income by Occupancy in Mccleary
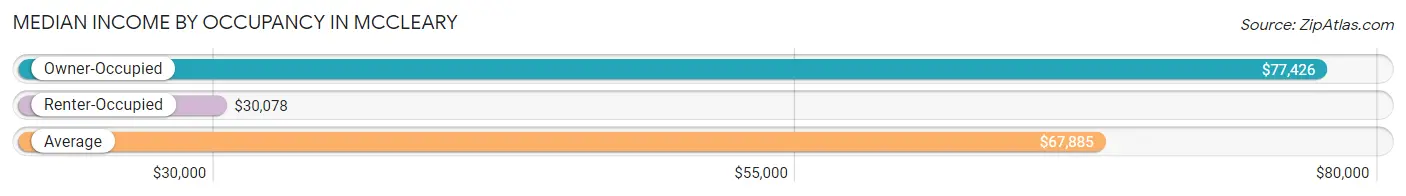
| Occupancy Type | # Households | Median Income |
| Owner-Occupied | 693 (79.1%) | $77,426 |
| Renter-Occupied | 183 (20.9%) | $30,078 |
| Average | 876 (100.0%) | $67,885 |
Occupancy by Householder Income Bracket in Mccleary
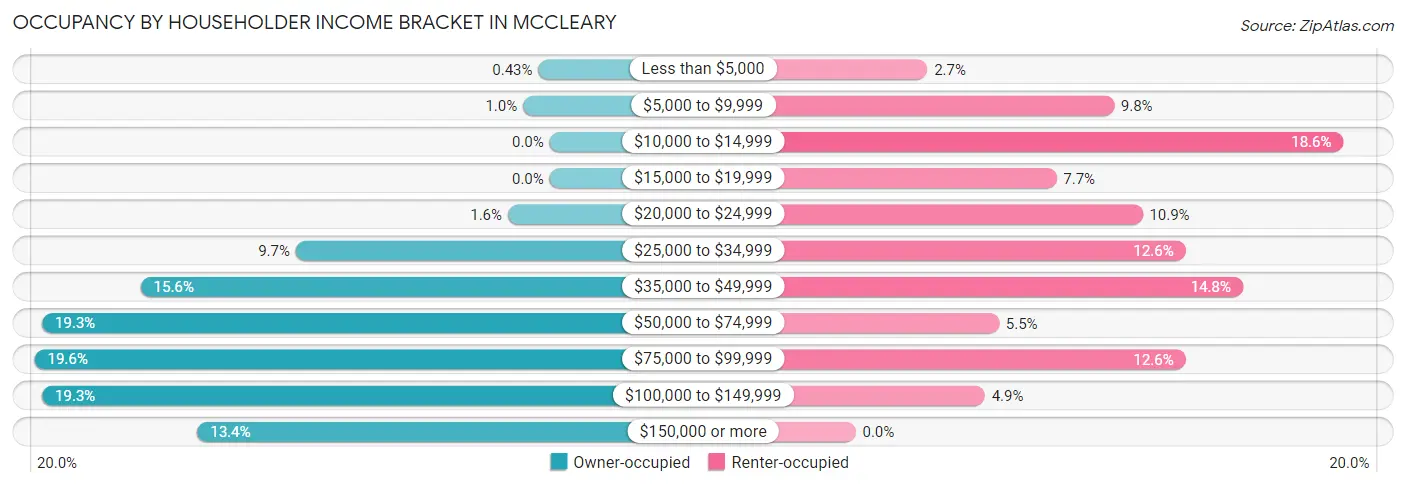
| Income Bracket | Owner-occupied | Renter-occupied |
| Less than $5,000 | 3 (0.4%) | 5 (2.7%) |
| $5,000 to $9,999 | 7 (1.0%) | 18 (9.8%) |
| $10,000 to $14,999 | 0 (0.0%) | 34 (18.6%) |
| $15,000 to $19,999 | 0 (0.0%) | 14 (7.6%) |
| $20,000 to $24,999 | 11 (1.6%) | 20 (10.9%) |
| $25,000 to $34,999 | 67 (9.7%) | 23 (12.6%) |
| $35,000 to $49,999 | 108 (15.6%) | 27 (14.7%) |
| $50,000 to $74,999 | 134 (19.3%) | 10 (5.5%) |
| $75,000 to $99,999 | 136 (19.6%) | 23 (12.6%) |
| $100,000 to $149,999 | 134 (19.3%) | 9 (4.9%) |
| $150,000 or more | 93 (13.4%) | 0 (0.0%) |
| Total | 693 (100.0%) | 183 (100.0%) |
Monthly Housing Cost Tiers in Mccleary
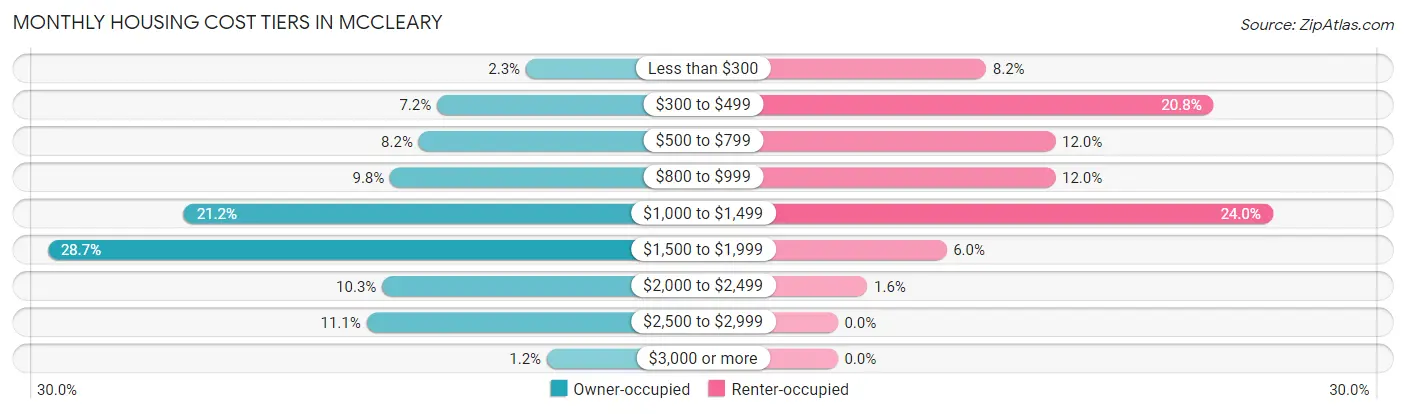
| Monthly Cost | Owner-occupied | Renter-occupied |
| Less than $300 | 16 (2.3%) | 15 (8.2%) |
| $300 to $499 | 50 (7.2%) | 38 (20.8%) |
| $500 to $799 | 57 (8.2%) | 22 (12.0%) |
| $800 to $999 | 68 (9.8%) | 22 (12.0%) |
| $1,000 to $1,499 | 147 (21.2%) | 44 (24.0%) |
| $1,500 to $1,999 | 199 (28.7%) | 11 (6.0%) |
| $2,000 to $2,499 | 71 (10.2%) | 3 (1.6%) |
| $2,500 to $2,999 | 77 (11.1%) | 0 (0.0%) |
| $3,000 or more | 8 (1.1%) | 0 (0.0%) |
| Total | 693 (100.0%) | 183 (100.0%) |
Physical Housing Characteristics in Mccleary
Housing Structures in Mccleary
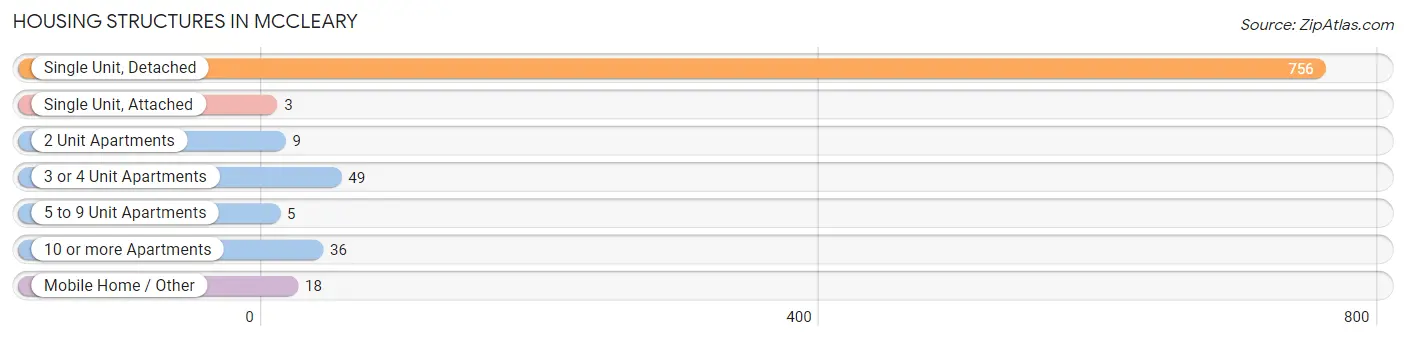
| Structure Type | # Housing Units | % Housing Units |
| Single Unit, Detached | 756 | 86.3% |
| Single Unit, Attached | 3 | 0.3% |
| 2 Unit Apartments | 9 | 1.0% |
| 3 or 4 Unit Apartments | 49 | 5.6% |
| 5 to 9 Unit Apartments | 5 | 0.6% |
| 10 or more Apartments | 36 | 4.1% |
| Mobile Home / Other | 18 | 2.1% |
| Total | 876 | 100.0% |
Housing Structures by Occupancy in Mccleary
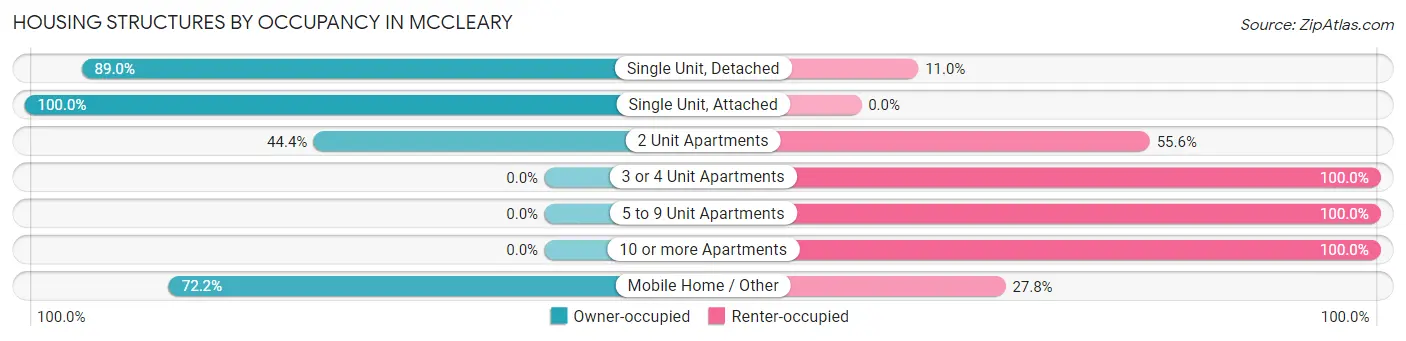
| Structure Type | Owner-occupied | Renter-occupied |
| Single Unit, Detached | 673 (89.0%) | 83 (11.0%) |
| Single Unit, Attached | 3 (100.0%) | 0 (0.0%) |
| 2 Unit Apartments | 4 (44.4%) | 5 (55.6%) |
| 3 or 4 Unit Apartments | 0 (0.0%) | 49 (100.0%) |
| 5 to 9 Unit Apartments | 0 (0.0%) | 5 (100.0%) |
| 10 or more Apartments | 0 (0.0%) | 36 (100.0%) |
| Mobile Home / Other | 13 (72.2%) | 5 (27.8%) |
| Total | 693 (79.1%) | 183 (20.9%) |
Housing Structures by Number of Rooms in Mccleary
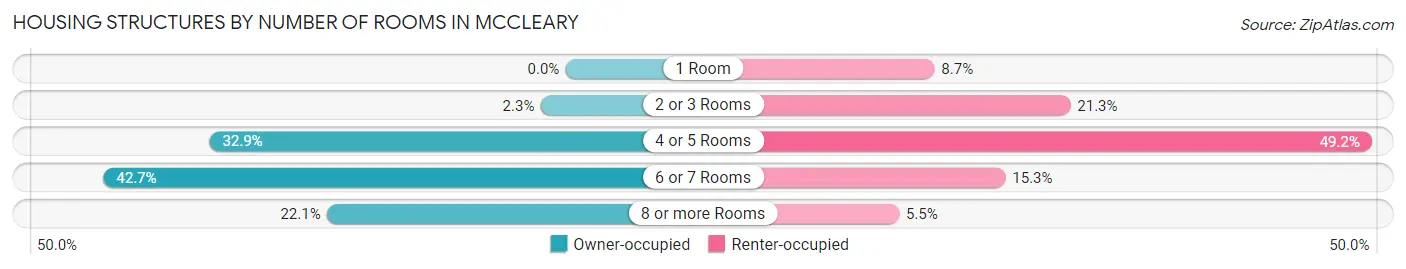
| Number of Rooms | Owner-occupied | Renter-occupied |
| 1 Room | 0 (0.0%) | 16 (8.7%) |
| 2 or 3 Rooms | 16 (2.3%) | 39 (21.3%) |
| 4 or 5 Rooms | 228 (32.9%) | 90 (49.2%) |
| 6 or 7 Rooms | 296 (42.7%) | 28 (15.3%) |
| 8 or more Rooms | 153 (22.1%) | 10 (5.5%) |
| Total | 693 (100.0%) | 183 (100.0%) |
Housing Structure by Heating Type in Mccleary
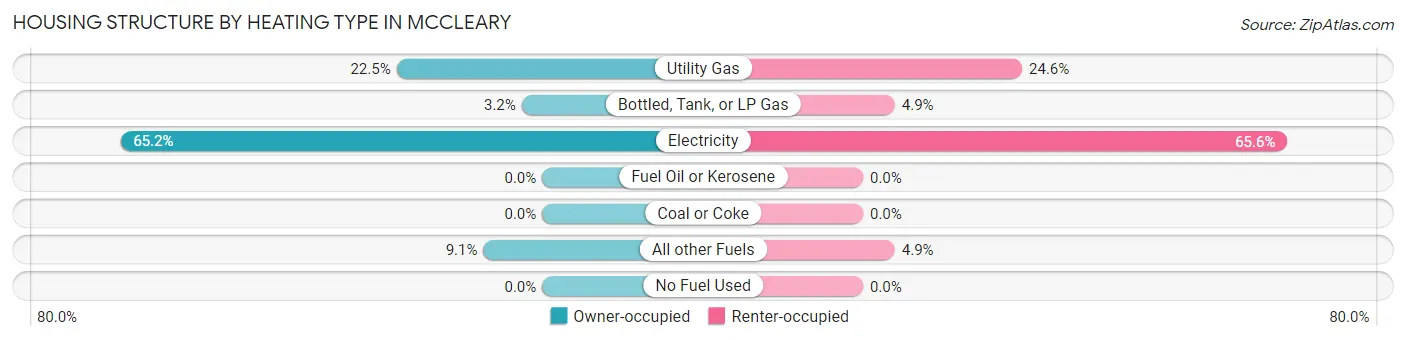
| Heating Type | Owner-occupied | Renter-occupied |
| Utility Gas | 156 (22.5%) | 45 (24.6%) |
| Bottled, Tank, or LP Gas | 22 (3.2%) | 9 (4.9%) |
| Electricity | 452 (65.2%) | 120 (65.6%) |
| Fuel Oil or Kerosene | 0 (0.0%) | 0 (0.0%) |
| Coal or Coke | 0 (0.0%) | 0 (0.0%) |
| All other Fuels | 63 (9.1%) | 9 (4.9%) |
| No Fuel Used | 0 (0.0%) | 0 (0.0%) |
| Total | 693 (100.0%) | 183 (100.0%) |
Household Vehicle Usage in Mccleary
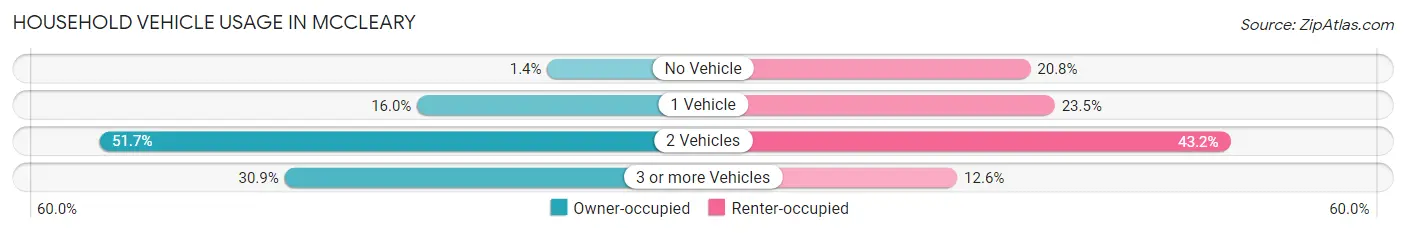
| Vehicles per Household | Owner-occupied | Renter-occupied |
| No Vehicle | 10 (1.4%) | 38 (20.8%) |
| 1 Vehicle | 111 (16.0%) | 43 (23.5%) |
| 2 Vehicles | 358 (51.7%) | 79 (43.2%) |
| 3 or more Vehicles | 214 (30.9%) | 23 (12.6%) |
| Total | 693 (100.0%) | 183 (100.0%) |
Real Estate & Mortgages in Mccleary
Real Estate and Mortgage Overview in Mccleary
| Characteristic | Without Mortgage | With Mortgage |
| Housing Units | 164 | 529 |
| Median Property Value | $220,600 | $294,800 |
| Median Household Income | $58,929 | $86 |
| Monthly Housing Costs | $536 | $8 |
| Real Estate Taxes | $2,800 | $48 |
Property Value by Mortgage Status in Mccleary
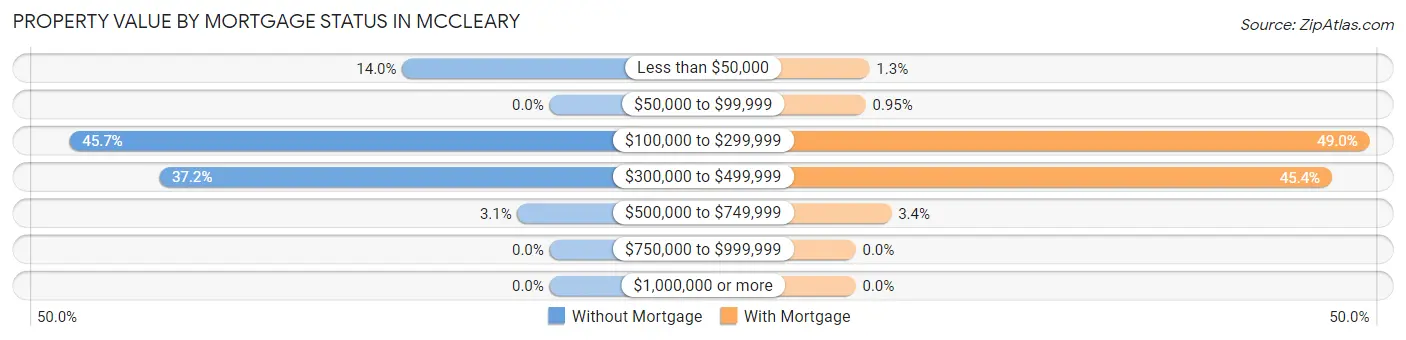
| Property Value | Without Mortgage | With Mortgage |
| Less than $50,000 | 23 (14.0%) | 7 (1.3%) |
| $50,000 to $99,999 | 0 (0.0%) | 5 (0.9%) |
| $100,000 to $299,999 | 75 (45.7%) | 259 (49.0%) |
| $300,000 to $499,999 | 61 (37.2%) | 240 (45.4%) |
| $500,000 to $749,999 | 5 (3.0%) | 18 (3.4%) |
| $750,000 to $999,999 | 0 (0.0%) | 0 (0.0%) |
| $1,000,000 or more | 0 (0.0%) | 0 (0.0%) |
| Total | 164 (100.0%) | 529 (100.0%) |
Household Income by Mortgage Status in Mccleary
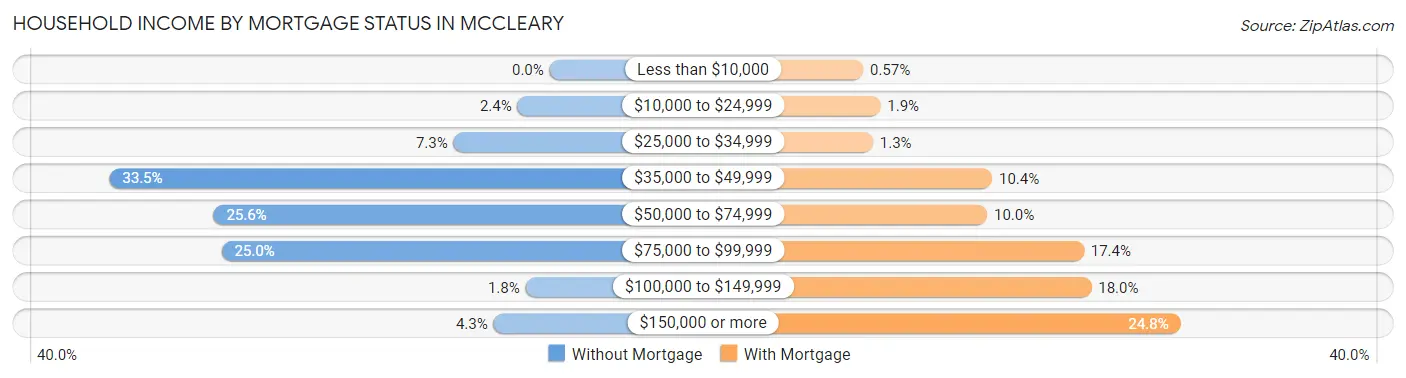
| Household Income | Without Mortgage | With Mortgage |
| Less than $10,000 | 0 (0.0%) | 3 (0.6%) |
| $10,000 to $24,999 | 4 (2.4%) | 10 (1.9%) |
| $25,000 to $34,999 | 12 (7.3%) | 7 (1.3%) |
| $35,000 to $49,999 | 55 (33.5%) | 55 (10.4%) |
| $50,000 to $74,999 | 42 (25.6%) | 53 (10.0%) |
| $75,000 to $99,999 | 41 (25.0%) | 92 (17.4%) |
| $100,000 to $149,999 | 3 (1.8%) | 95 (18.0%) |
| $150,000 or more | 7 (4.3%) | 131 (24.8%) |
| Total | 164 (100.0%) | 529 (100.0%) |
Property Value to Household Income Ratio in Mccleary
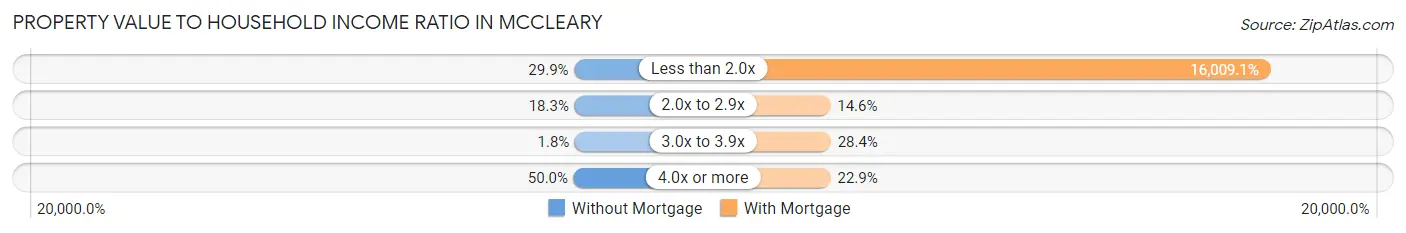
| Value-to-Income Ratio | Without Mortgage | With Mortgage |
| Less than 2.0x | 49 (29.9%) | 84,688 (16,009.1%) |
| 2.0x to 2.9x | 30 (18.3%) | 77 (14.6%) |
| 3.0x to 3.9x | 3 (1.8%) | 150 (28.4%) |
| 4.0x or more | 82 (50.0%) | 121 (22.9%) |
| Total | 164 (100.0%) | 529 (100.0%) |
Real Estate Taxes by Mortgage Status in Mccleary
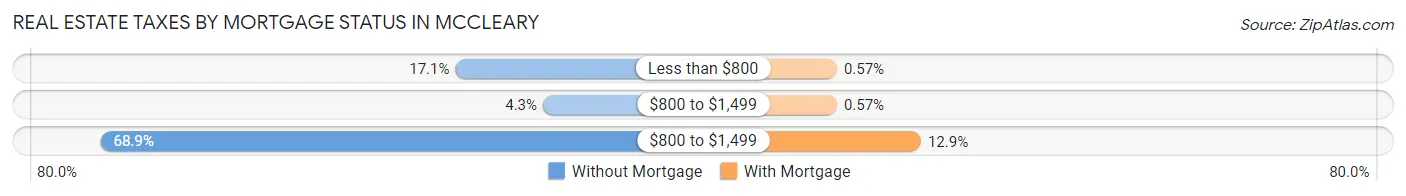
| Property Taxes | Without Mortgage | With Mortgage |
| Less than $800 | 28 (17.1%) | 3 (0.6%) |
| $800 to $1,499 | 7 (4.3%) | 3 (0.6%) |
| $800 to $1,499 | 113 (68.9%) | 68 (12.9%) |
| Total | 164 (100.0%) | 529 (100.0%) |
Health & Disability in Mccleary
Health Insurance Coverage by Age in Mccleary
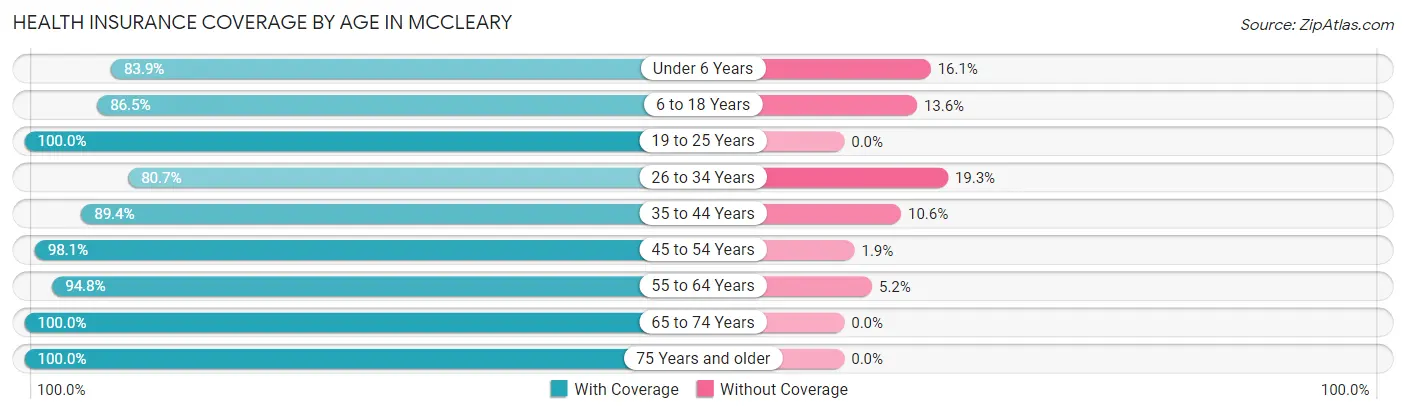
| Age Bracket | With Coverage | Without Coverage |
| Under 6 Years | 151 (83.9%) | 29 (16.1%) |
| 6 to 18 Years | 370 (86.5%) | 58 (13.6%) |
| 19 to 25 Years | 114 (100.0%) | 0 (0.0%) |
| 26 to 34 Years | 313 (80.7%) | 75 (19.3%) |
| 35 to 44 Years | 321 (89.4%) | 38 (10.6%) |
| 45 to 54 Years | 257 (98.1%) | 5 (1.9%) |
| 55 to 64 Years | 275 (94.8%) | 15 (5.2%) |
| 65 to 74 Years | 240 (100.0%) | 0 (0.0%) |
| 75 Years and older | 165 (100.0%) | 0 (0.0%) |
| Total | 2,206 (90.9%) | 220 (9.1%) |
Health Insurance Coverage by Citizenship Status in Mccleary
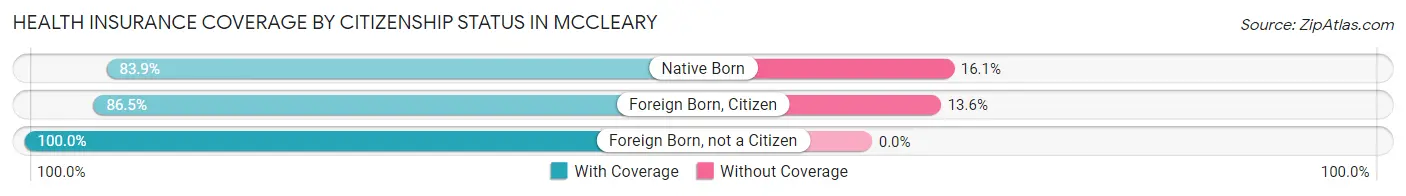
| Citizenship Status | With Coverage | Without Coverage |
| Native Born | 151 (83.9%) | 29 (16.1%) |
| Foreign Born, Citizen | 370 (86.5%) | 58 (13.6%) |
| Foreign Born, not a Citizen | 114 (100.0%) | 0 (0.0%) |
Health Insurance Coverage by Household Income in Mccleary
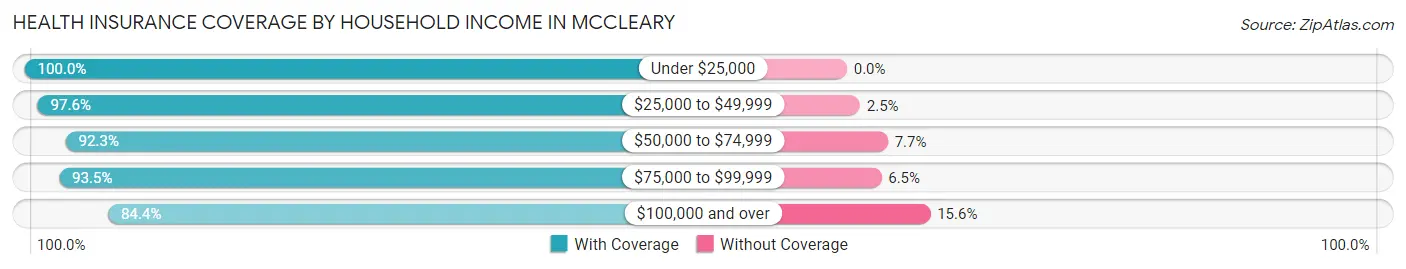
| Household Income | With Coverage | Without Coverage |
| Under $25,000 | 150 (100.0%) | 0 (0.0%) |
| $25,000 to $49,999 | 477 (97.6%) | 12 (2.5%) |
| $50,000 to $74,999 | 301 (92.3%) | 25 (7.7%) |
| $75,000 to $99,999 | 463 (93.5%) | 32 (6.5%) |
| $100,000 and over | 815 (84.4%) | 151 (15.6%) |
Public vs Private Health Insurance Coverage by Age in Mccleary
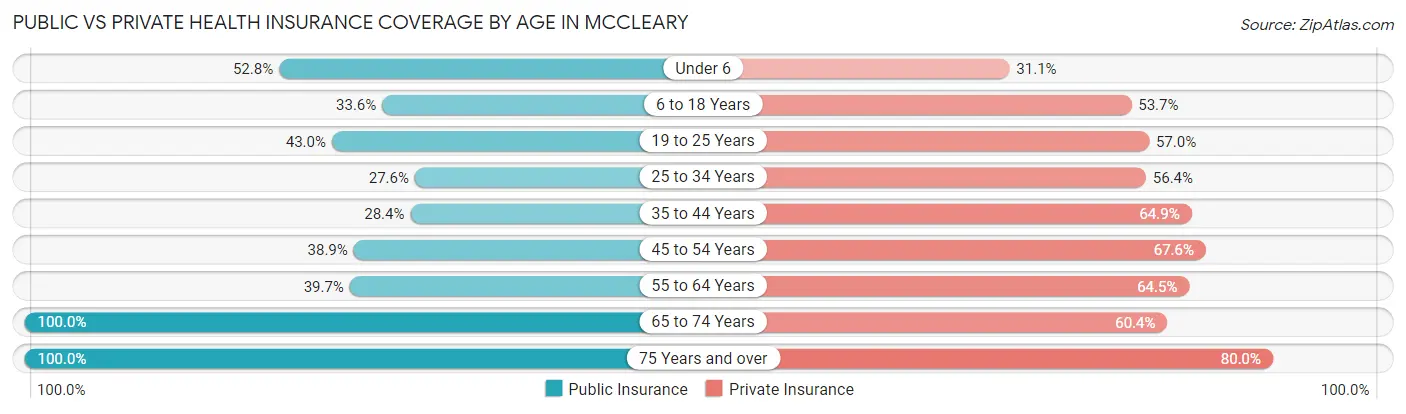
| Age Bracket | Public Insurance | Private Insurance |
| Under 6 | 95 (52.8%) | 56 (31.1%) |
| 6 to 18 Years | 144 (33.6%) | 230 (53.7%) |
| 19 to 25 Years | 49 (43.0%) | 65 (57.0%) |
| 25 to 34 Years | 107 (27.6%) | 219 (56.4%) |
| 35 to 44 Years | 102 (28.4%) | 233 (64.9%) |
| 45 to 54 Years | 102 (38.9%) | 177 (67.6%) |
| 55 to 64 Years | 115 (39.7%) | 187 (64.5%) |
| 65 to 74 Years | 240 (100.0%) | 145 (60.4%) |
| 75 Years and over | 165 (100.0%) | 132 (80.0%) |
| Total | 1,119 (46.1%) | 1,444 (59.5%) |
Disability Status by Sex by Age in Mccleary
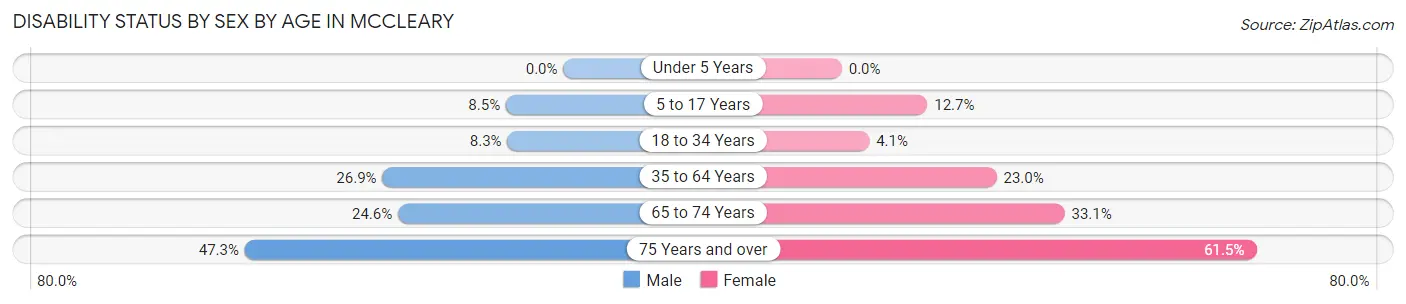
| Age Bracket | Male | Female |
| Under 5 Years | 0 (0.0%) | 0 (0.0%) |
| 5 to 17 Years | 15 (8.5%) | 32 (12.7%) |
| 18 to 34 Years | 22 (8.3%) | 10 (4.1%) |
| 35 to 64 Years | 115 (26.9%) | 111 (23.0%) |
| 65 to 74 Years | 27 (24.5%) | 43 (33.1%) |
| 75 Years and over | 35 (47.3%) | 56 (61.5%) |
Disability Class by Sex by Age in Mccleary
Disability Class: Hearing Difficulty
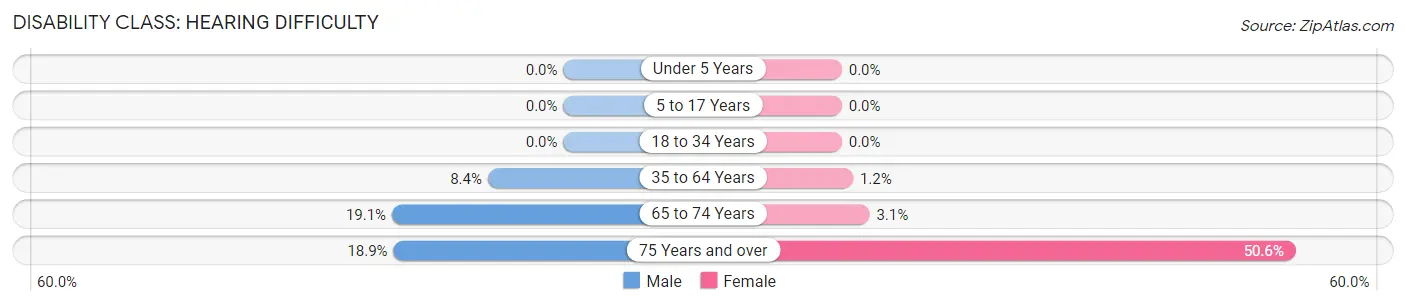
| Age Bracket | Male | Female |
| Under 5 Years | 0 (0.0%) | 0 (0.0%) |
| 5 to 17 Years | 0 (0.0%) | 0 (0.0%) |
| 18 to 34 Years | 0 (0.0%) | 0 (0.0%) |
| 35 to 64 Years | 36 (8.4%) | 6 (1.2%) |
| 65 to 74 Years | 21 (19.1%) | 4 (3.1%) |
| 75 Years and over | 14 (18.9%) | 46 (50.5%) |
Disability Class: Vision Difficulty
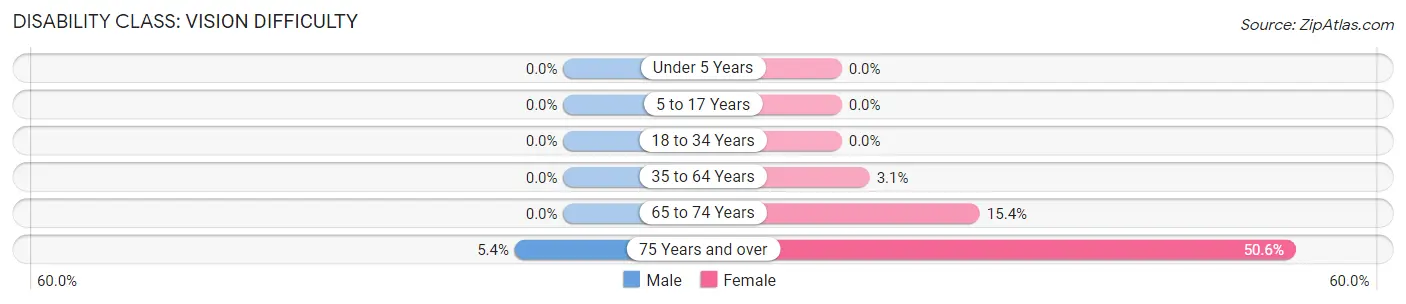
| Age Bracket | Male | Female |
| Under 5 Years | 0 (0.0%) | 0 (0.0%) |
| 5 to 17 Years | 0 (0.0%) | 0 (0.0%) |
| 18 to 34 Years | 0 (0.0%) | 0 (0.0%) |
| 35 to 64 Years | 0 (0.0%) | 15 (3.1%) |
| 65 to 74 Years | 0 (0.0%) | 20 (15.4%) |
| 75 Years and over | 4 (5.4%) | 46 (50.5%) |
Disability Class: Cognitive Difficulty
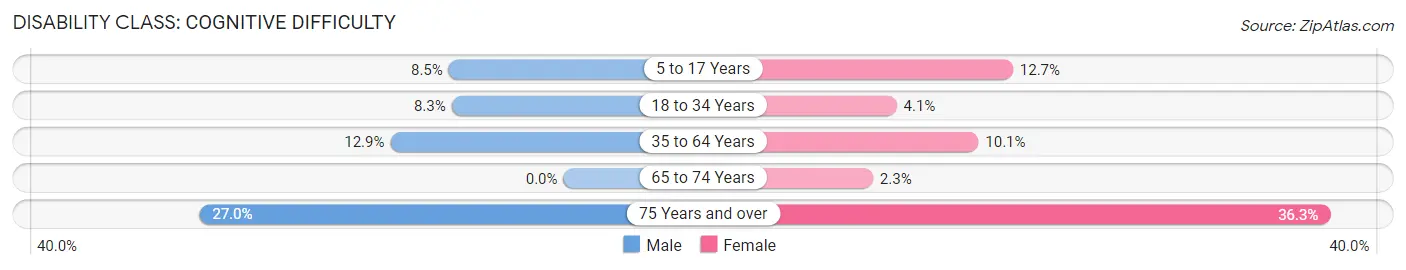
| Age Bracket | Male | Female |
| 5 to 17 Years | 15 (8.5%) | 32 (12.7%) |
| 18 to 34 Years | 22 (8.3%) | 10 (4.1%) |
| 35 to 64 Years | 55 (12.9%) | 49 (10.1%) |
| 65 to 74 Years | 0 (0.0%) | 3 (2.3%) |
| 75 Years and over | 20 (27.0%) | 33 (36.3%) |
Disability Class: Ambulatory Difficulty
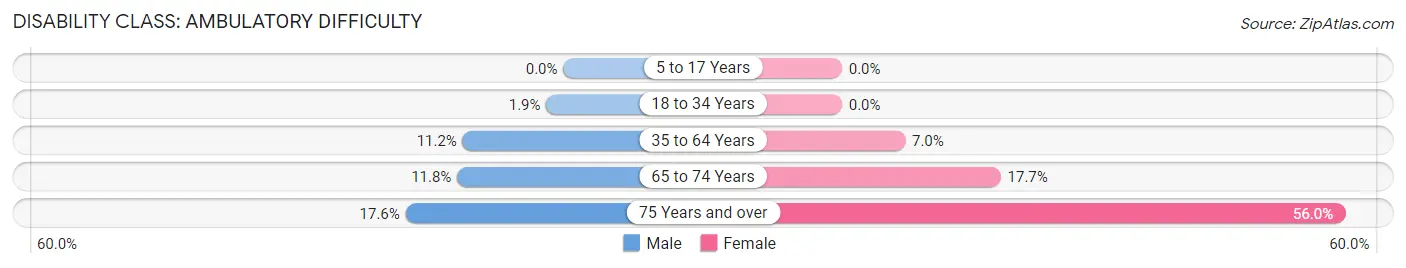
| Age Bracket | Male | Female |
| 5 to 17 Years | 0 (0.0%) | 0 (0.0%) |
| 18 to 34 Years | 5 (1.9%) | 0 (0.0%) |
| 35 to 64 Years | 48 (11.2%) | 34 (7.0%) |
| 65 to 74 Years | 13 (11.8%) | 23 (17.7%) |
| 75 Years and over | 13 (17.6%) | 51 (56.0%) |
Disability Class: Self-Care Difficulty
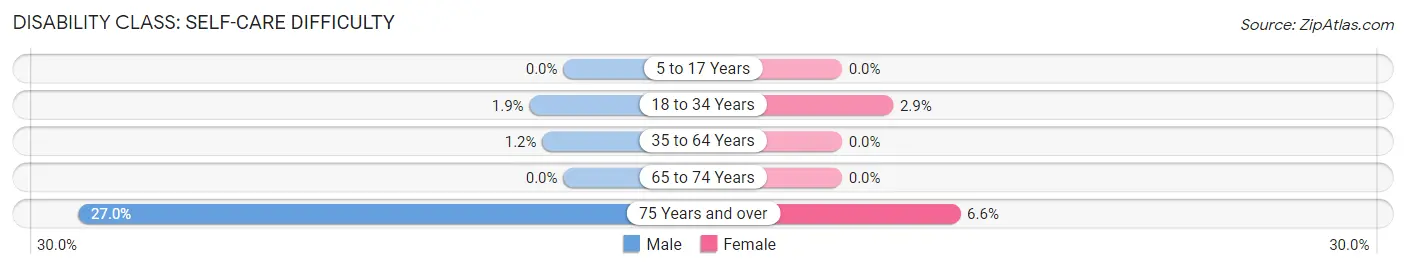
| Age Bracket | Male | Female |
| 5 to 17 Years | 0 (0.0%) | 0 (0.0%) |
| 18 to 34 Years | 5 (1.9%) | 7 (2.9%) |
| 35 to 64 Years | 5 (1.2%) | 0 (0.0%) |
| 65 to 74 Years | 0 (0.0%) | 0 (0.0%) |
| 75 Years and over | 20 (27.0%) | 6 (6.6%) |
Technology Access in Mccleary
Computing Device Access in Mccleary
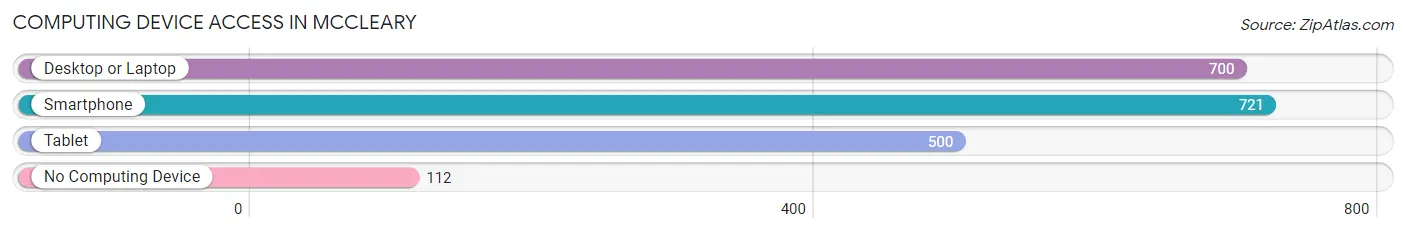
| Device Type | # Households | % Households |
| Desktop or Laptop | 700 | 79.9% |
| Smartphone | 721 | 82.3% |
| Tablet | 500 | 57.1% |
| No Computing Device | 112 | 12.8% |
| Total | 876 | 100.0% |
Internet Access in Mccleary
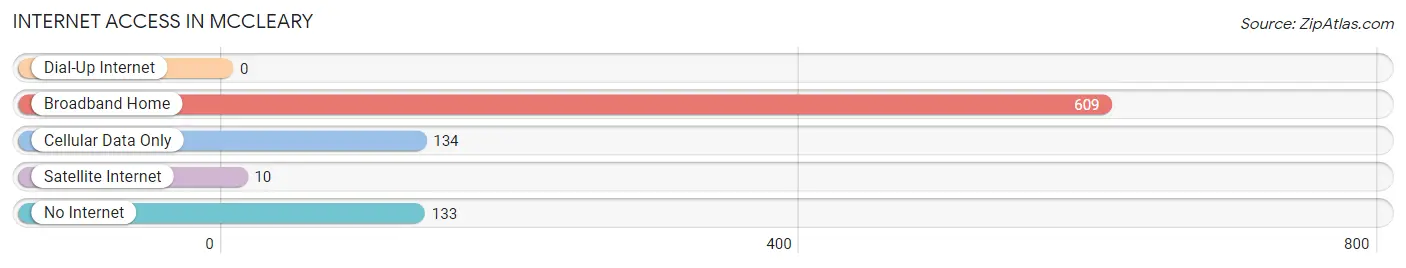
| Internet Type | # Households | % Households |
| Dial-Up Internet | 0 | 0.0% |
| Broadband Home | 609 | 69.5% |
| Cellular Data Only | 134 | 15.3% |
| Satellite Internet | 10 | 1.1% |
| No Internet | 133 | 15.2% |
| Total | 876 | 100.0% |
Mccleary Summary
Mccleary, Washington is a small city located in Grays Harbor County, Washington. It is situated on the Chehalis River, about 20 miles east of the Pacific Ocean. The city has a population of 1,845 as of the 2010 census.
History
Mccleary was founded in 1883 by William Mccleary, a settler from Iowa. He purchased a large tract of land from the local Native American tribes and began to develop the area. The town was originally called Mcclearyville, but the name was changed to Mccleary in 1891.
The city was incorporated in 1891 and was the first incorporated city in Grays Harbor County. The city was named after William Mccleary, who was the first mayor of the city.
The city grew rapidly in the early 1900s, and by 1910, it had a population of 1,000. The city was a major logging center, and the timber industry was the main source of employment for the residents.
The city was also home to a number of sawmills, which provided lumber for the local economy. The city was also home to a number of other businesses, including a cannery, a creamery, and a flour mill.
The city was also home to a number of churches, including the First Presbyterian Church, which was founded in 1891.
Geography
Mccleary is located in Grays Harbor County, Washington. It is situated on the Chehalis River, about 20 miles east of the Pacific Ocean. The city has a total area of 1.3 square miles, all of which is land.
The city is located in a temperate rainforest climate, with mild temperatures and abundant rainfall. The average annual temperature is around 50 degrees Fahrenheit, and the average annual rainfall is around 50 inches.
Economy
The economy of Mccleary is largely based on the timber industry. The city is home to a number of sawmills, which provide lumber for the local economy. The city is also home to a number of other businesses, including a cannery, a creamery, and a flour mill.
The city is also home to a number of retail stores, including a grocery store, a hardware store, and a drug store. The city is also home to a number of restaurants, including a pizza parlor, a Chinese restaurant, and a Mexican restaurant.
Demographics
As of the 2010 census, the population of Mccleary was 1,845. The racial makeup of the city was 94.3% White, 0.7% African American, 0.7% Native American, 0.7% Asian, 0.2% Pacific Islander, and 2.6% from other races.
The median household income in Mccleary was $37,917, and the median family income was $45,938. The per capita income in Mccleary was $18,945. About 11.3% of the population was below the poverty line.
Conclusion
Mccleary, Washington is a small city located in Grays Harbor County, Washington. It is situated on the Chehalis River, about 20 miles east of the Pacific Ocean. The city has a population of 1,845 as of the 2010 census. The economy of Mccleary is largely based on the timber industry, and the city is home to a number of sawmills, retail stores, and restaurants. The racial makeup of the city was 94.3% White, 0.7% African American, 0.7% Native American, 0.7% Asian, 0.2% Pacific Islander, and 2.6% from other races. The median household income in Mccleary was $37,917, and the median family income was $45,938. About 11.3% of the population was below the poverty line.
Common Questions
What is Per Capita Income in Mccleary?
Per Capita income in Mccleary is $28,827.
What is the Median Family Income in Mccleary?
Median Family Income in Mccleary is $81,587.
What is the Median Household income in Mccleary?
Median Household Income in Mccleary is $67,885.
What is Income or Wage Gap in Mccleary?
Income or Wage Gap in Mccleary is 24.9%.
Women in Mccleary earn 75.1 cents for every dollar earned by a man.
What is Inequality or Gini Index in Mccleary?
Inequality or Gini Index in Mccleary is 0.38.
What is the Total Population of Mccleary?
Total Population of Mccleary is 2,426.
What is the Total Male Population of Mccleary?
Total Male Population of Mccleary is 1,176.
What is the Total Female Population of Mccleary?
Total Female Population of Mccleary is 1,250.
What is the Ratio of Males per 100 Females in Mccleary?
There are 94.08 Males per 100 Females in Mccleary.
What is the Ratio of Females per 100 Males in Mccleary?
There are 106.29 Females per 100 Males in Mccleary.
What is the Median Population Age in Mccleary?
Median Population Age in Mccleary is 36.6 Years.
What is the Average Family Size in Mccleary
Average Family Size in Mccleary is 3.4 People.
What is the Average Household Size in Mccleary
Average Household Size in Mccleary is 2.8 People.
How Large is the Labor Force in Mccleary?
There are 999 People in the Labor Forcein in Mccleary.
What is the Percentage of People in the Labor Force in Mccleary?
53.2% of People are in the Labor Force in Mccleary.
What is the Unemployment Rate in Mccleary?
Unemployment Rate in Mccleary is 8.3%.