Cities with the Lowest Poverty Level Among Children Under the Age of 5 in South Carolina
RELATED REPORTS & OPTIONS
Lowest Poverty | Child 0-5
South Carolina
Compare Cities
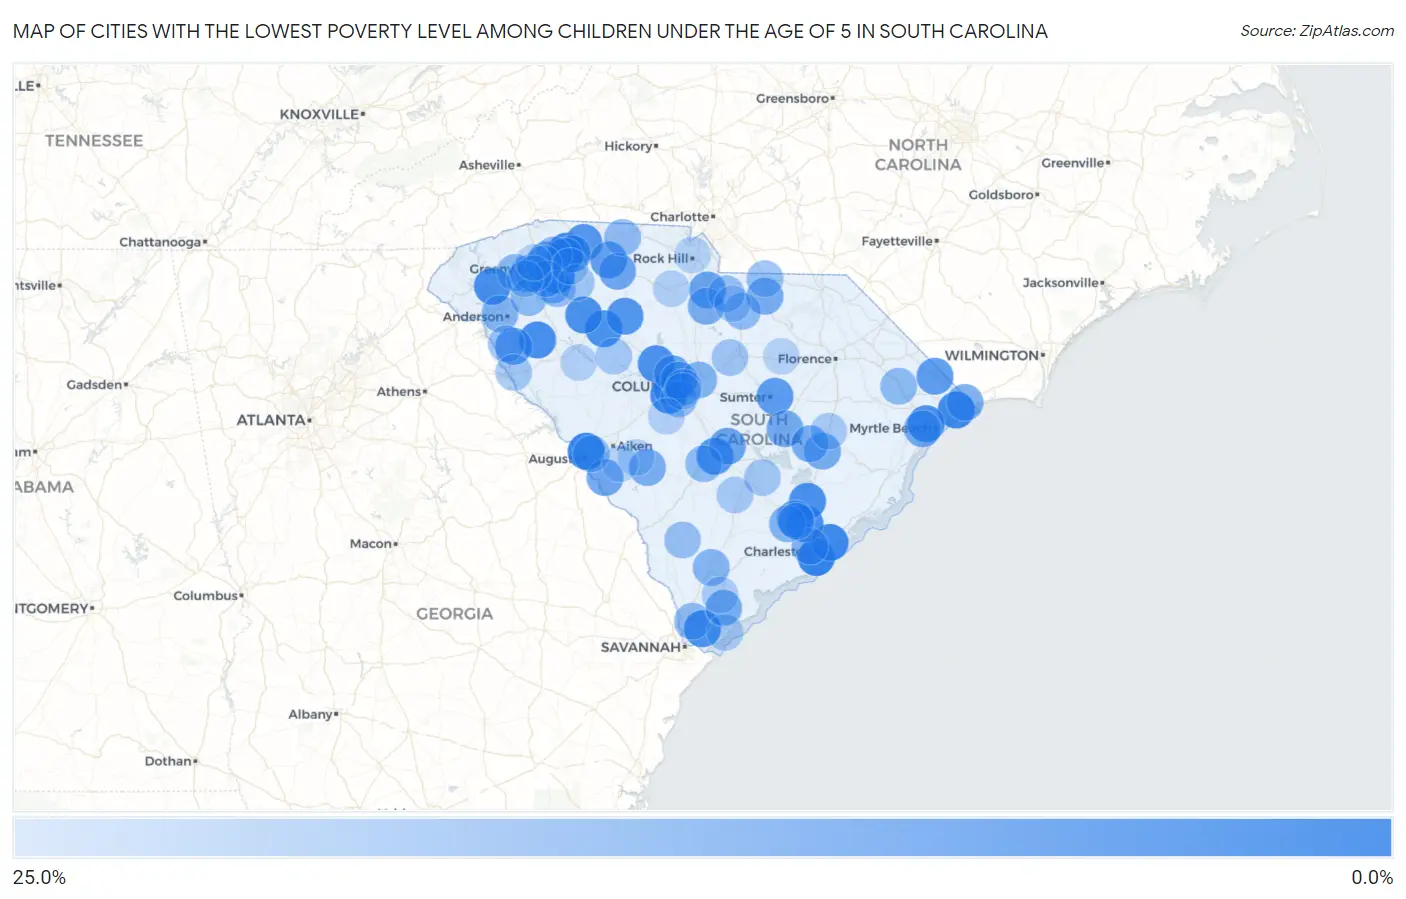
Map of Cities with the Lowest Poverty Level Among Children Under the Age of 5 in South Carolina
25.0%
0.0%
Cities with the Lowest Poverty Level Among Children Under the Age of 5 in South Carolina
| City | Child Poverty | vs State | vs National | |
| 1. | James Island | 0.95% | 22.4%(-21.4)#1 | 18.1%(-17.1)#94 |
| 2. | Five Forks | 1.3% | 22.4%(-21.1)#2 | 18.1%(-16.8)#156 |
| 3. | North Augusta | 1.4% | 22.4%(-20.9)#3 | 18.1%(-16.6)#186 |
| 4. | Lyman | 1.9% | 22.4%(-20.4)#4 | 18.1%(-16.1)#326 |
| 5. | Red Bank | 2.0% | 22.4%(-20.3)#5 | 18.1%(-16.0)#348 |
| 6. | Mount Pleasant | 2.3% | 22.4%(-20.0)#6 | 18.1%(-15.7)#454 |
| 7. | North Myrtle Beach | 2.5% | 22.4%(-19.9)#7 | 18.1%(-15.6)#498 |
| 8. | Central | 3.4% | 22.4%(-18.9)#8 | 18.1%(-14.6)#885 |
| 9. | Due West | 3.4% | 22.4%(-18.9)#9 | 18.1%(-14.6)#891 |
| 10. | Goose Creek | 4.0% | 22.4%(-18.4)#10 | 18.1%(-14.0)#1,140 |
| 11. | Moncks Corner | 4.1% | 22.4%(-18.3)#11 | 18.1%(-14.0)#1,164 |
| 12. | Bluffton | 4.1% | 22.4%(-18.2)#12 | 18.1%(-13.9)#1,179 |
| 13. | Forestbrook | 4.2% | 22.4%(-18.1)#13 | 18.1%(-13.8)#1,225 |
| 14. | Joanna | 4.3% | 22.4%(-18.1)#14 | 18.1%(-13.8)#1,237 |
| 15. | Watts Mills | 4.3% | 22.4%(-18.0)#15 | 18.1%(-13.7)#1,269 |
| 16. | Chapin | 4.6% | 22.4%(-17.8)#16 | 18.1%(-13.4)#1,387 |
| 17. | Wilkinson Heights | 5.5% | 22.4%(-16.9)#17 | 18.1%(-12.6)#1,783 |
| 18. | Whitmire | 5.6% | 22.4%(-16.8)#18 | 18.1%(-12.5)#1,803 |
| 19. | Boiling Springs | 5.8% | 22.4%(-16.5)#19 | 18.1%(-12.2)#1,924 |
| 20. | Carolina Forest | 6.6% | 22.4%(-15.8)#20 | 18.1%(-11.5)#2,217 |
| 21. | East Sumter | 7.1% | 22.4%(-15.3)#21 | 18.1%(-11.0)#2,446 |
| 22. | Loris | 7.2% | 22.4%(-15.1)#22 | 18.1%(-10.8)#2,517 |
| 23. | Welcome | 7.2% | 22.4%(-15.1)#23 | 18.1%(-10.8)#2,522 |
| 24. | Wellford | 7.6% | 22.4%(-14.8)#24 | 18.1%(-10.5)#2,671 |
| 25. | Pacolet | 7.8% | 22.4%(-14.6)#25 | 18.1%(-10.3)#2,771 |
| 26. | Sangaree | 8.0% | 22.4%(-14.4)#26 | 18.1%(-10.1)#2,820 |
| 27. | Lake Secession | 8.0% | 22.4%(-14.4)#27 | 18.1%(-10.1)#2,831 |
| 28. | Capitol View | 8.9% | 22.4%(-13.5)#28 | 18.1%(-9.20)#3,191 |
| 29. | Fort Lawn | 9.2% | 22.4%(-13.1)#29 | 18.1%(-8.83)#3,364 |
| 30. | Lexington | 9.5% | 22.4%(-12.9)#30 | 18.1%(-8.55)#3,459 |
| 31. | Cameron | 9.5% | 22.4%(-12.8)#31 | 18.1%(-8.54)#3,482 |
| 32. | Irmo | 9.8% | 22.4%(-12.6)#32 | 18.1%(-8.29)#3,572 |
| 33. | Taylors | 10.0% | 22.4%(-12.3)#33 | 18.1%(-8.03)#3,683 |
| 34. | Jonesville | 10.5% | 22.4%(-11.8)#34 | 18.1%(-7.54)#3,872 |
| 35. | Jackson | 10.7% | 22.4%(-11.6)#35 | 18.1%(-7.32)#3,957 |
| 36. | Socastee | 10.8% | 22.4%(-11.6)#36 | 18.1%(-7.24)#3,979 |
| 37. | Manning | 11.1% | 22.4%(-11.3)#37 | 18.1%(-6.95)#4,069 |
| 38. | Seven Oaks | 11.2% | 22.4%(-11.2)#38 | 18.1%(-6.89)#4,143 |
| 39. | Baxter | 11.6% | 22.4%(-10.8)#39 | 18.1%(-6.49)#4,290 |
| 40. | Lane | 11.8% | 22.4%(-10.6)#40 | 18.1%(-6.30)#4,365 |
| 41. | Greeleyville | 11.8% | 22.4%(-10.6)#41 | 18.1%(-6.30)#4,371 |
| 42. | Jefferson | 11.9% | 22.4%(-10.5)#42 | 18.1%(-6.20)#4,405 |
| 43. | Little River | 12.1% | 22.4%(-10.3)#43 | 18.1%(-5.99)#4,482 |
| 44. | Great Falls | 12.1% | 22.4%(-10.3)#44 | 18.1%(-5.97)#4,491 |
| 45. | Williston | 12.4% | 22.4%(-10.0)#45 | 18.1%(-5.70)#4,569 |
| 46. | Simpsonville | 13.0% | 22.4%(-9.40)#46 | 18.1%(-5.09)#4,830 |
| 47. | Beech Island | 13.3% | 22.4%(-9.04)#47 | 18.1%(-4.73)#4,948 |
| 48. | Charleston | 13.6% | 22.4%(-8.81)#48 | 18.1%(-4.50)#5,040 |
| 49. | Forest Acres | 13.9% | 22.4%(-8.45)#49 | 18.1%(-4.14)#5,181 |
| 50. | Centerville | 14.0% | 22.4%(-8.39)#50 | 18.1%(-4.08)#5,209 |
| 51. | Summerville | 14.0% | 22.4%(-8.32)#51 | 18.1%(-4.01)#5,235 |
| 52. | Yemassee | 14.3% | 22.4%(-8.09)#52 | 18.1%(-3.78)#5,319 |
| 53. | Duncan | 14.9% | 22.4%(-7.46)#53 | 18.1%(-3.15)#5,551 |
| 54. | Easley | 15.3% | 22.4%(-7.12)#54 | 18.1%(-2.81)#5,664 |
| 55. | South Congaree | 15.3% | 22.4%(-7.04)#55 | 18.1%(-2.73)#5,692 |
| 56. | Aynor | 15.4% | 22.4%(-6.99)#56 | 18.1%(-2.68)#5,715 |
| 57. | Elliott | 15.4% | 22.4%(-6.99)#57 | 18.1%(-2.68)#5,730 |
| 58. | Cordova | 15.4% | 22.4%(-6.99)#58 | 18.1%(-2.68)#5,749 |
| 59. | Pelzer | 15.6% | 22.4%(-6.82)#59 | 18.1%(-2.51)#5,788 |
| 60. | Hardeeville | 15.8% | 22.4%(-6.58)#60 | 18.1%(-2.27)#5,852 |
| 61. | Greer | 15.9% | 22.4%(-6.44)#61 | 18.1%(-2.13)#5,909 |
| 62. | Ladson | 16.0% | 22.4%(-6.36)#62 | 18.1%(-2.05)#5,943 |
| 63. | Kershaw | 16.1% | 22.4%(-6.27)#63 | 18.1%(-1.96)#5,969 |
| 64. | Gaffney | 16.3% | 22.4%(-6.03)#64 | 18.1%(-1.72)#6,040 |
| 65. | Wade Hampton | 16.6% | 22.4%(-5.78)#65 | 18.1%(-1.47)#6,118 |
| 66. | Clearwater | 16.7% | 22.4%(-5.71)#66 | 18.1%(-1.40)#6,135 |
| 67. | White Knoll | 17.2% | 22.4%(-5.17)#67 | 18.1%(-0.856)#6,344 |
| 68. | Elgin | 17.3% | 22.4%(-5.09)#68 | 18.1%(-0.779)#6,363 |
| 69. | Hampton | 17.3% | 22.4%(-5.04)#69 | 18.1%(-0.729)#6,379 |
| 70. | Fountain Inn | 17.4% | 22.4%(-5.01)#70 | 18.1%(-0.704)#6,386 |
| 71. | Pageland | 17.4% | 22.4%(-5.00)#71 | 18.1%(-0.687)#6,392 |
| 72. | Iva | 17.6% | 22.4%(-4.73)#72 | 18.1%(-0.416)#6,488 |
| 73. | Port Royal | 18.0% | 22.4%(-4.39)#73 | 18.1%(-0.076)#6,613 |
| 74. | Mauldin | 18.2% | 22.4%(-4.19)#74 | 18.1%(+0.119)#6,650 |
| 75. | Lugoff | 18.8% | 22.4%(-3.57)#75 | 18.1%(+0.744)#6,890 |
| 76. | West Columbia | 18.9% | 22.4%(-3.50)#76 | 18.1%(+0.807)#6,906 |
| 77. | Dunean | 19.0% | 22.4%(-3.36)#77 | 18.1%(+0.951)#6,938 |
| 78. | Woodruff | 19.2% | 22.4%(-3.12)#78 | 18.1%(+1.19)#7,017 |
| 79. | Holly Hill | 19.4% | 22.4%(-2.97)#79 | 18.1%(+1.34)#7,066 |
| 80. | Powdersville | 19.6% | 22.4%(-2.79)#80 | 18.1%(+1.52)#7,126 |
| 81. | Calhoun Falls | 19.6% | 22.4%(-2.78)#81 | 18.1%(+1.53)#7,135 |
| 82. | Reevesville | 20.0% | 22.4%(-2.37)#82 | 18.1%(+1.94)#7,284 |
| 83. | Silverstreet | 20.0% | 22.4%(-2.37)#83 | 18.1%(+1.94)#7,306 |
| 84. | Kingstree | 20.1% | 22.4%(-2.29)#84 | 18.1%(+2.02)#7,321 |
| 85. | Laurel Bay | 20.6% | 22.4%(-1.77)#85 | 18.1%(+2.54)#7,457 |
| 86. | Hilton Head Island | 21.1% | 22.4%(-1.30)#86 | 18.1%(+3.01)#7,591 |
| 87. | Heath Springs | 21.2% | 22.4%(-1.16)#87 | 18.1%(+3.15)#7,630 |
| 88. | Springdale | 21.3% | 22.4%(-1.02)#88 | 18.1%(+3.29)#7,671 |
| 89. | Reidville | 21.6% | 22.4%(-0.751)#89 | 18.1%(+3.56)#7,770 |
| 90. | Chester | 21.7% | 22.4%(-0.719)#90 | 18.1%(+3.59)#7,783 |
| 91. | Camp Croft | 21.7% | 22.4%(-0.706)#91 | 18.1%(+3.60)#7,785 |
| 92. | Pelion | 22.0% | 22.4%(-0.394)#92 | 18.1%(+3.92)#7,894 |
| 93. | Ninety Six | 22.1% | 22.4%(-0.313)#93 | 18.1%(+4.00)#7,915 |
| 94. | Windsor | 22.2% | 22.4%(-0.150)#94 | 18.1%(+4.16)#7,974 |
| 95. | Shell Point | 22.3% | 22.4%(-0.042)#95 | 18.1%(+4.27)#8,002 |
| 96. | Rock Hill | 22.5% | 22.4%(+0.157)#96 | 18.1%(+4.47)#8,063 |
| 97. | Bishopville | 22.6% | 22.4%(+0.208)#97 | 18.1%(+4.52)#8,082 |
| 98. | Sans Souci | 22.6% | 22.4%(+0.235)#98 | 18.1%(+4.54)#8,092 |
| 99. | Wyboo | 22.7% | 22.4%(+0.294)#99 | 18.1%(+4.60)#8,109 |
| 100. | New Ellenton | 22.7% | 22.4%(+0.355)#100 | 18.1%(+4.66)#8,125 |
Common Questions
What are the Top 10 Cities with the Lowest Poverty Level Among Children Under the Age of 5 in South Carolina?
Top 10 Cities with the Lowest Poverty Level Among Children Under the Age of 5 in South Carolina are:
#1
0.95%
#2
1.3%
#3
1.4%
#4
1.9%
#5
2.0%
#6
2.3%
#7
2.5%
#8
3.4%
#9
3.4%
#10
4.0%
What city has the Lowest Poverty Level Among Children Under the Age of 5 in South Carolina?
James Island has the Lowest Poverty Level Among Children Under the Age of 5 in South Carolina with 0.95%.
What is the Poverty Level Among Children Under the Age of 5 in the State of South Carolina?
Poverty Level Among Children Under the Age of 5 in South Carolina is 22.4%.
What is the Poverty Level Among Children Under the Age of 5 in the United States?
Poverty Level Among Children Under the Age of 5 in the United States is 18.1%.