Cities with the Lowest Poverty Level Among Children Under the Age of 5 in Texas
RELATED REPORTS & OPTIONS
Lowest Poverty | Child 0-5
Texas
Compare Cities
Map of Cities with the Lowest Poverty Level Among Children Under the Age of 5 in Texas
6.0%
0.0%
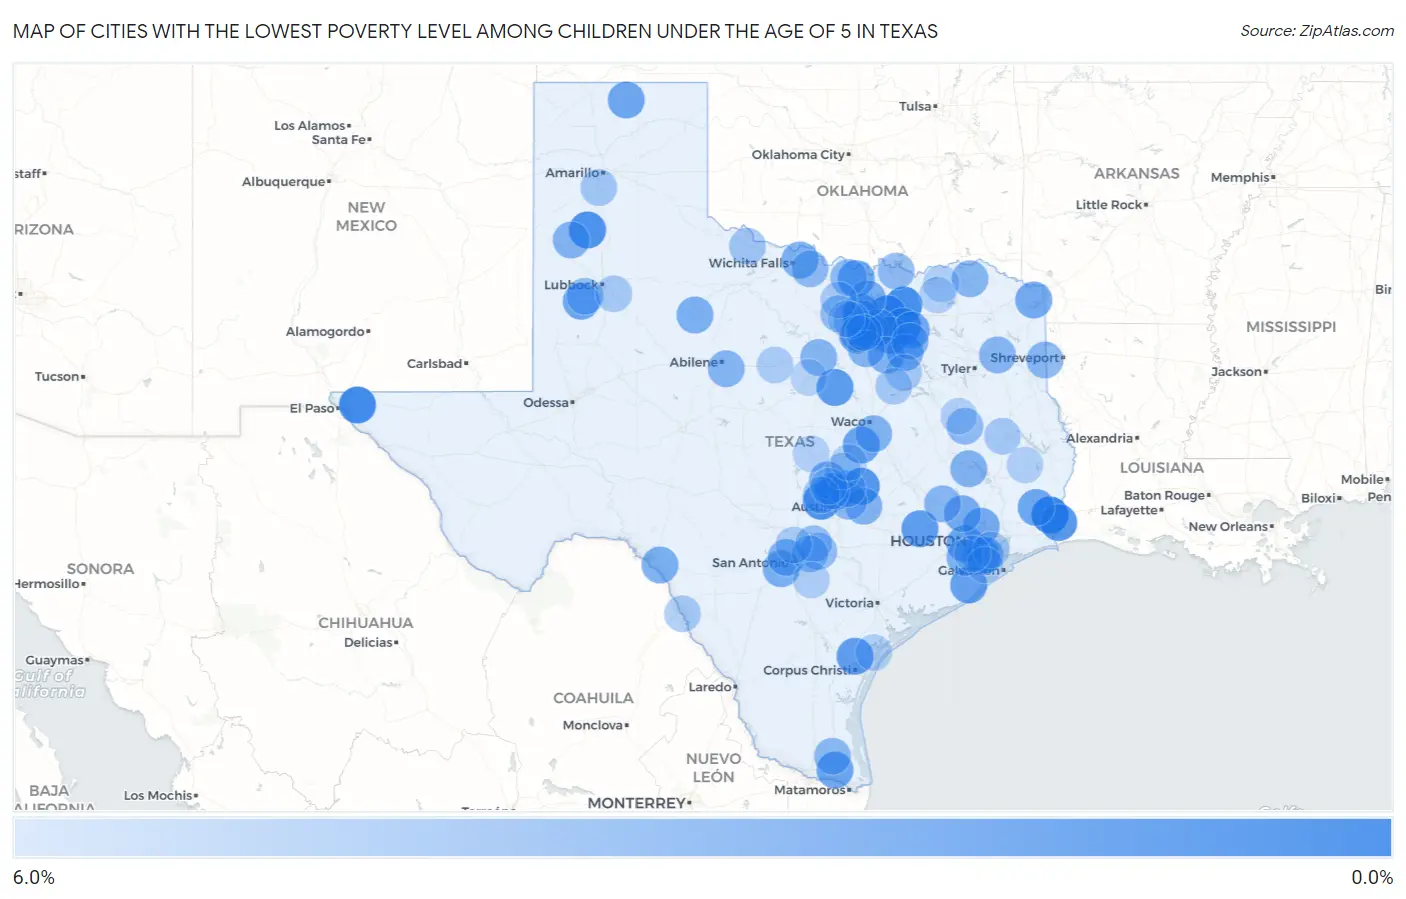
Cities with the Lowest Poverty Level Among Children Under the Age of 5 in Texas
| City | Child Poverty | vs State | vs National | |
| 1. | Vidor | 0.21% | 21.1%(-20.9)#1 | 18.1%(-17.9)#2 |
| 2. | Homestead Meadows South | 0.69% | 21.1%(-20.4)#2 | 18.1%(-17.4)#46 |
| 3. | Melissa | 0.81% | 21.1%(-20.3)#3 | 18.1%(-17.3)#62 |
| 4. | Frisco | 0.93% | 21.1%(-20.2)#4 | 18.1%(-17.1)#89 |
| 5. | Sachse | 1.1% | 21.1%(-20.0)#5 | 18.1%(-17.0)#113 |
| 6. | Hart | 1.1% | 21.1%(-20.0)#6 | 18.1%(-17.0)#117 |
| 7. | Southlake | 1.1% | 21.1%(-20.0)#7 | 18.1%(-16.9)#119 |
| 8. | University Park | 1.2% | 21.1%(-19.9)#8 | 18.1%(-16.9)#133 |
| 9. | Lakeway | 1.2% | 21.1%(-19.9)#9 | 18.1%(-16.9)#137 |
| 10. | Saginaw | 1.4% | 21.1%(-19.7)#10 | 18.1%(-16.7)#173 |
| 11. | Thrall | 1.4% | 21.1%(-19.6)#11 | 18.1%(-16.6)#194 |
| 12. | Bridge City | 1.5% | 21.1%(-19.6)#12 | 18.1%(-16.6)#207 |
| 13. | Brushy Creek | 1.7% | 21.1%(-19.4)#13 | 18.1%(-16.3)#261 |
| 14. | Walnut Springs | 1.8% | 21.1%(-19.3)#14 | 18.1%(-16.3)#289 |
| 15. | Bellville | 1.9% | 21.1%(-19.2)#15 | 18.1%(-16.1)#323 |
| 16. | Taft Southwest | 2.0% | 21.1%(-19.1)#16 | 18.1%(-16.1)#334 |
| 17. | Reno City Lamar County | 2.1% | 21.1%(-18.9)#17 | 18.1%(-15.9)#392 |
| 18. | Ponder | 2.2% | 21.1%(-18.9)#18 | 18.1%(-15.9)#401 |
| 19. | Justin | 2.2% | 21.1%(-18.9)#19 | 18.1%(-15.9)#405 |
| 20. | Richwood | 2.3% | 21.1%(-18.8)#20 | 18.1%(-15.8)#434 |
| 21. | Troy | 2.3% | 21.1%(-18.8)#21 | 18.1%(-15.7)#447 |
| 22. | Friendswood | 2.3% | 21.1%(-18.8)#22 | 18.1%(-15.7)#457 |
| 23. | Bellaire | 2.4% | 21.1%(-18.7)#23 | 18.1%(-15.7)#468 |
| 24. | Muenster | 2.5% | 21.1%(-18.6)#24 | 18.1%(-15.6)#496 |
| 25. | Lumberton | 2.5% | 21.1%(-18.5)#25 | 18.1%(-15.5)#521 |
| 26. | Palm Valley | 2.5% | 21.1%(-18.5)#26 | 18.1%(-15.5)#522 |
| 27. | Meadow | 2.5% | 21.1%(-18.5)#27 | 18.1%(-15.5)#526 |
| 28. | Gruver | 2.6% | 21.1%(-18.5)#28 | 18.1%(-15.5)#532 |
| 29. | Rockwall | 2.6% | 21.1%(-18.5)#29 | 18.1%(-15.5)#536 |
| 30. | Colleyville | 2.6% | 21.1%(-18.5)#30 | 18.1%(-15.4)#547 |
| 31. | Atascocita | 2.8% | 21.1%(-18.3)#31 | 18.1%(-15.3)#619 |
| 32. | Keller | 2.8% | 21.1%(-18.3)#32 | 18.1%(-15.3)#620 |
| 33. | Redwater | 2.9% | 21.1%(-18.2)#33 | 18.1%(-15.2)#652 |
| 34. | Liberty Hill | 3.0% | 21.1%(-18.1)#34 | 18.1%(-15.1)#696 |
| 35. | The Woodlands | 3.0% | 21.1%(-18.1)#35 | 18.1%(-15.1)#709 |
| 36. | Coppell | 3.0% | 21.1%(-18.1)#36 | 18.1%(-15.1)#713 |
| 37. | Macdona | 3.1% | 21.1%(-18.0)#37 | 18.1%(-14.9)#758 |
| 38. | Dean | 3.1% | 21.1%(-18.0)#38 | 18.1%(-14.9)#759 |
| 39. | Val Verde Park | 3.1% | 21.1%(-17.9)#39 | 18.1%(-14.9)#765 |
| 40. | Sanger | 3.2% | 21.1%(-17.9)#40 | 18.1%(-14.9)#781 |
| 41. | Aspermont | 3.2% | 21.1%(-17.9)#41 | 18.1%(-14.9)#790 |
| 42. | Glenn Heights | 3.2% | 21.1%(-17.9)#42 | 18.1%(-14.8)#796 |
| 43. | Webster | 3.3% | 21.1%(-17.8)#43 | 18.1%(-14.8)#811 |
| 44. | Combine | 3.3% | 21.1%(-17.8)#44 | 18.1%(-14.8)#822 |
| 45. | Leon Valley | 3.3% | 21.1%(-17.8)#45 | 18.1%(-14.8)#829 |
| 46. | Arcola | 3.3% | 21.1%(-17.8)#46 | 18.1%(-14.7)#841 |
| 47. | Earth | 3.4% | 21.1%(-17.7)#47 | 18.1%(-14.7)#867 |
| 48. | Riverside | 3.4% | 21.1%(-17.7)#48 | 18.1%(-14.7)#869 |
| 49. | Mcdade | 3.4% | 21.1%(-17.6)#49 | 18.1%(-14.6)#888 |
| 50. | Kennedale | 3.5% | 21.1%(-17.6)#50 | 18.1%(-14.6)#903 |
| 51. | Forney | 3.5% | 21.1%(-17.6)#51 | 18.1%(-14.6)#908 |
| 52. | Golinda | 3.5% | 21.1%(-17.6)#52 | 18.1%(-14.6)#912 |
| 53. | Potosi | 3.6% | 21.1%(-17.5)#53 | 18.1%(-14.4)#962 |
| 54. | Blossom | 3.6% | 21.1%(-17.5)#54 | 18.1%(-14.4)#974 |
| 55. | Plantersville | 3.7% | 21.1%(-17.4)#55 | 18.1%(-14.4)#1,004 |
| 56. | Lipan | 3.7% | 21.1%(-17.4)#56 | 18.1%(-14.4)#1,005 |
| 57. | Warren City | 3.7% | 21.1%(-17.4)#57 | 18.1%(-14.4)#1,008 |
| 58. | Waskom | 3.7% | 21.1%(-17.3)#58 | 18.1%(-14.3)#1,023 |
| 59. | Lyford | 3.8% | 21.1%(-17.3)#59 | 18.1%(-14.3)#1,034 |
| 60. | St Jo | 3.9% | 21.1%(-17.2)#60 | 18.1%(-14.1)#1,098 |
| 61. | Henrietta | 3.9% | 21.1%(-17.1)#61 | 18.1%(-14.1)#1,111 |
| 62. | Paradise | 4.0% | 21.1%(-17.1)#62 | 18.1%(-14.1)#1,132 |
| 63. | Pottsboro | 4.0% | 21.1%(-17.1)#63 | 18.1%(-14.0)#1,141 |
| 64. | Grapeland | 4.1% | 21.1%(-17.0)#64 | 18.1%(-14.0)#1,154 |
| 65. | Manor | 4.1% | 21.1%(-17.0)#65 | 18.1%(-14.0)#1,155 |
| 66. | Mcqueeney | 4.2% | 21.1%(-16.9)#66 | 18.1%(-13.9)#1,190 |
| 67. | New Braunfels | 4.3% | 21.1%(-16.7)#67 | 18.1%(-13.7)#1,264 |
| 68. | Ropesville | 4.3% | 21.1%(-16.7)#68 | 18.1%(-13.7)#1,277 |
| 69. | Cibolo | 4.4% | 21.1%(-16.7)#69 | 18.1%(-13.7)#1,279 |
| 70. | Hutto | 4.5% | 21.1%(-16.5)#70 | 18.1%(-13.5)#1,368 |
| 71. | Cedar Park | 4.6% | 21.1%(-16.5)#71 | 18.1%(-13.4)#1,391 |
| 72. | Vernon | 4.7% | 21.1%(-16.4)#72 | 18.1%(-13.3)#1,427 |
| 73. | Canyon | 4.8% | 21.1%(-16.3)#73 | 18.1%(-13.3)#1,471 |
| 74. | Jarrell | 4.8% | 21.1%(-16.2)#74 | 18.1%(-13.2)#1,502 |
| 75. | Rhome | 4.9% | 21.1%(-16.2)#75 | 18.1%(-13.2)#1,527 |
| 76. | Hudson | 5.0% | 21.1%(-16.1)#76 | 18.1%(-13.1)#1,550 |
| 77. | Lago Vista | 5.0% | 21.1%(-16.1)#77 | 18.1%(-13.1)#1,559 |
| 78. | Alma | 5.0% | 21.1%(-16.1)#78 | 18.1%(-13.1)#1,571 |
| 79. | Slaton | 5.0% | 21.1%(-16.0)#79 | 18.1%(-13.0)#1,592 |
| 80. | Rosita | 5.1% | 21.1%(-16.0)#80 | 18.1%(-13.0)#1,614 |
| 81. | Alvord | 5.1% | 21.1%(-16.0)#81 | 18.1%(-12.9)#1,619 |
| 82. | Blooming Grove | 5.1% | 21.1%(-16.0)#82 | 18.1%(-12.9)#1,630 |
| 83. | Shoreacres | 5.2% | 21.1%(-15.9)#83 | 18.1%(-12.9)#1,651 |
| 84. | Blue Mound | 5.2% | 21.1%(-15.9)#84 | 18.1%(-12.8)#1,666 |
| 85. | Eastland | 5.2% | 21.1%(-15.8)#85 | 18.1%(-12.8)#1,673 |
| 86. | Timberwood Park | 5.3% | 21.1%(-15.8)#86 | 18.1%(-12.8)#1,709 |
| 87. | Watauga | 5.3% | 21.1%(-15.8)#87 | 18.1%(-12.8)#1,713 |
| 88. | Floresville | 5.4% | 21.1%(-15.7)#88 | 18.1%(-12.7)#1,733 |
| 89. | Rockport | 5.5% | 21.1%(-15.6)#89 | 18.1%(-12.6)#1,765 |
| 90. | Honey Grove | 5.5% | 21.1%(-15.6)#90 | 18.1%(-12.6)#1,775 |
| 91. | Colmesneil | 5.5% | 21.1%(-15.6)#91 | 18.1%(-12.6)#1,781 |
| 92. | Elkhart | 5.6% | 21.1%(-15.5)#92 | 18.1%(-12.5)#1,804 |
| 93. | Ladonia | 5.6% | 21.1%(-15.5)#93 | 18.1%(-12.5)#1,809 |
| 94. | Lampasas | 5.6% | 21.1%(-15.5)#94 | 18.1%(-12.5)#1,823 |
| 95. | Santa Fe | 5.6% | 21.1%(-15.5)#95 | 18.1%(-12.5)#1,834 |
| 96. | Pearland | 5.6% | 21.1%(-15.5)#96 | 18.1%(-12.4)#1,847 |
| 97. | Leander | 5.7% | 21.1%(-15.4)#97 | 18.1%(-12.4)#1,866 |
| 98. | Salado | 5.7% | 21.1%(-15.4)#98 | 18.1%(-12.4)#1,869 |
| 99. | Boyd | 5.7% | 21.1%(-15.4)#99 | 18.1%(-12.3)#1,888 |
| 100. | Stephenville | 5.7% | 21.1%(-15.4)#100 | 18.1%(-12.3)#1,898 |
Common Questions
What are the Top 10 Cities with the Lowest Poverty Level Among Children Under the Age of 5 in Texas?
Top 10 Cities with the Lowest Poverty Level Among Children Under the Age of 5 in Texas are:
#1
0.21%
#2
0.69%
#3
0.81%
#4
0.93%
#5
1.1%
#6
1.1%
#7
1.1%
#8
1.2%
#9
1.2%
#10
1.4%
What city has the Lowest Poverty Level Among Children Under the Age of 5 in Texas?
Vidor has the Lowest Poverty Level Among Children Under the Age of 5 in Texas with 0.21%.
What is the Poverty Level Among Children Under the Age of 5 in the State of Texas?
Poverty Level Among Children Under the Age of 5 in Texas is 21.1%.
What is the Poverty Level Among Children Under the Age of 5 in the United States?
Poverty Level Among Children Under the Age of 5 in the United States is 18.1%.