Dupont, WA Map & Demographics
Dupont Map
Dupont Overview
$50,942
PER CAPITA INCOME
$115,847
AVG FAMILY INCOME
$106,695
AVG HOUSEHOLD INCOME
35.2%
WAGE / INCOME GAP [ % ]
64.8¢/ $1
WAGE / INCOME GAP [ $ ]
$12,358
FAMILY INCOME DEFICIT
0.33
INEQUALITY / GINI INDEX
9,955
TOTAL POPULATION
4,896
MALE POPULATION
5,059
FEMALE POPULATION
96.78
MALES / 100 FEMALES
103.33
FEMALES / 100 MALES
34.2
MEDIAN AGE
3.0
AVG FAMILY SIZE
2.5
AVG HOUSEHOLD SIZE
5,276
LABOR FORCE [ PEOPLE ]
69.3%
PERCENT IN LABOR FORCE
4.7%
UNEMPLOYMENT RATE
Dupont Zip Codes
Dupont Area Codes
Income in Dupont
Income Overview in Dupont
Per Capita Income in Dupont is $50,942, while median incomes of families and households are $115,847 and $106,695 respectively.
| Characteristic | Number | Measure |
| Per Capita Income | 9,955 | $50,942 |
| Median Family Income | 2,737 | $115,847 |
| Mean Family Income | 2,737 | $140,486 |
| Median Household Income | 4,006 | $106,695 |
| Mean Household Income | 4,006 | $127,513 |
| Income Deficit | 2,737 | $12,358 |
| Wage / Income Gap (%) | 9,955 | 35.19% |
| Wage / Income Gap ($) | 9,955 | 64.81¢ per $1 |
| Gini / Inequality Index | 9,955 | 0.33 |
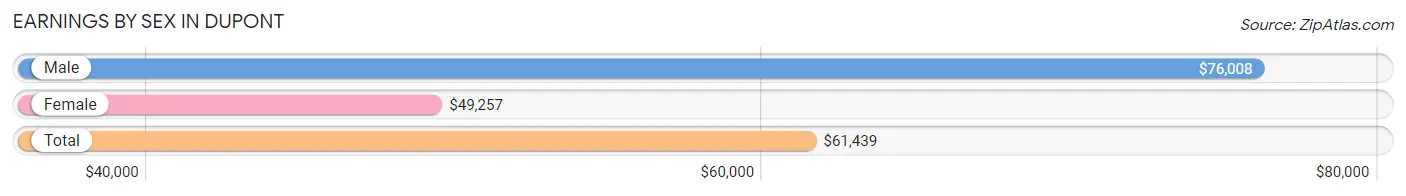
Earnings by Sex in Dupont
Average Earnings in Dupont are $61,439, $76,008 for men and $49,257 for women, a difference of 35.2%.
| Sex | Number | Average Earnings |
| Male | 2,895 (53.5%) | $76,008 |
| Female | 2,518 (46.5%) | $49,257 |
| Total | 5,413 (100.0%) | $61,439 |
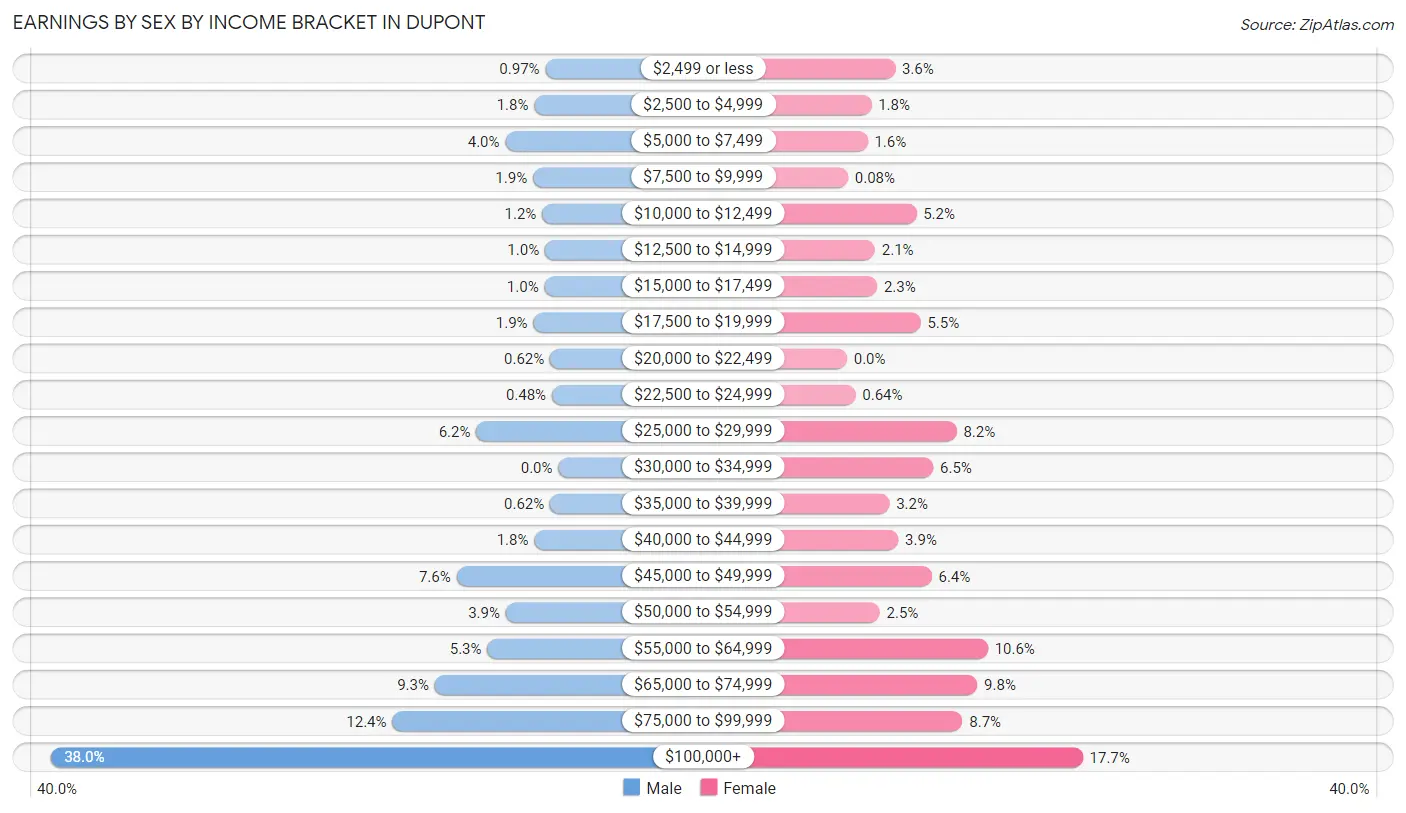
Earnings by Sex by Income Bracket in Dupont
The most common earnings brackets in Dupont are $100,000+ for men (1,100 | 38.0%) and $100,000+ for women (445 | 17.7%).
| Income | Male | Female |
| $2,499 or less | 28 (1.0%) | 91 (3.6%) |
| $2,500 to $4,999 | 52 (1.8%) | 46 (1.8%) |
| $5,000 to $7,499 | 115 (4.0%) | 39 (1.5%) |
| $7,500 to $9,999 | 55 (1.9%) | 2 (0.1%) |
| $10,000 to $12,499 | 35 (1.2%) | 131 (5.2%) |
| $12,500 to $14,999 | 29 (1.0%) | 53 (2.1%) |
| $15,000 to $17,499 | 30 (1.0%) | 57 (2.3%) |
| $17,500 to $19,999 | 54 (1.9%) | 139 (5.5%) |
| $20,000 to $22,499 | 18 (0.6%) | 0 (0.0%) |
| $22,500 to $24,999 | 14 (0.5%) | 16 (0.6%) |
| $25,000 to $29,999 | 178 (6.1%) | 207 (8.2%) |
| $30,000 to $34,999 | 0 (0.0%) | 163 (6.5%) |
| $35,000 to $39,999 | 18 (0.6%) | 80 (3.2%) |
| $40,000 to $44,999 | 52 (1.8%) | 97 (3.8%) |
| $45,000 to $49,999 | 221 (7.6%) | 160 (6.4%) |
| $50,000 to $54,999 | 114 (3.9%) | 62 (2.5%) |
| $55,000 to $64,999 | 154 (5.3%) | 266 (10.6%) |
| $65,000 to $74,999 | 268 (9.3%) | 246 (9.8%) |
| $75,000 to $99,999 | 360 (12.4%) | 218 (8.7%) |
| $100,000+ | 1,100 (38.0%) | 445 (17.7%) |
| Total | 2,895 (100.0%) | 2,518 (100.0%) |
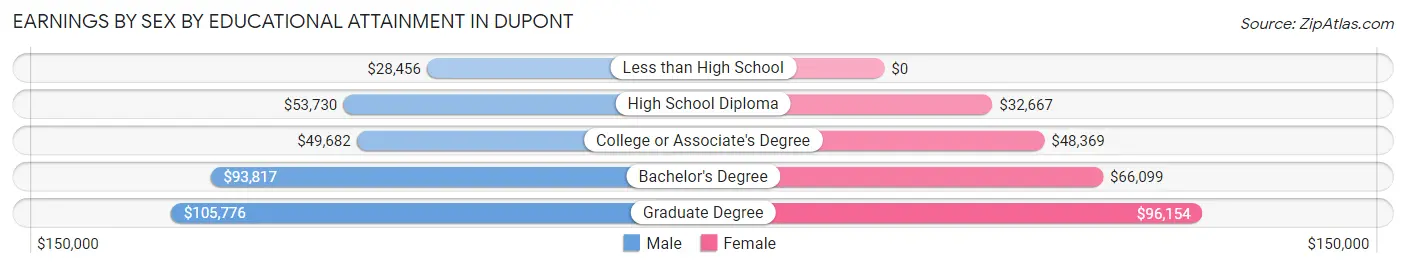
Earnings by Sex by Educational Attainment in Dupont
Average earnings in Dupont are $87,818 for men and $58,223 for women, a difference of 33.7%. Men with an educational attainment of graduate degree enjoy the highest average annual earnings of $105,776, while those with less than high school education earn the least with $28,456. Women with an educational attainment of graduate degree earn the most with the average annual earnings of $96,154, while those with high school diploma education have the smallest earnings of $32,667.
| Educational Attainment | Male Income | Female Income |
| Less than High School | $28,456 | $0 |
| High School Diploma | $53,730 | $32,667 |
| College or Associate's Degree | $49,682 | $48,369 |
| Bachelor's Degree | $93,817 | $66,099 |
| Graduate Degree | $105,776 | $96,154 |
| Total | $87,818 | $58,223 |
Family Income in Dupont
Family Income Brackets in Dupont
According to the Dupont family income data, there are 627 families falling into the $100,000 to $149,999 income range, which is the most common income bracket and makes up 22.9% of all families. Conversely, the $25,000 to $34,999 income bracket is the least frequent group with only 8 families (0.3%) belonging to this category.
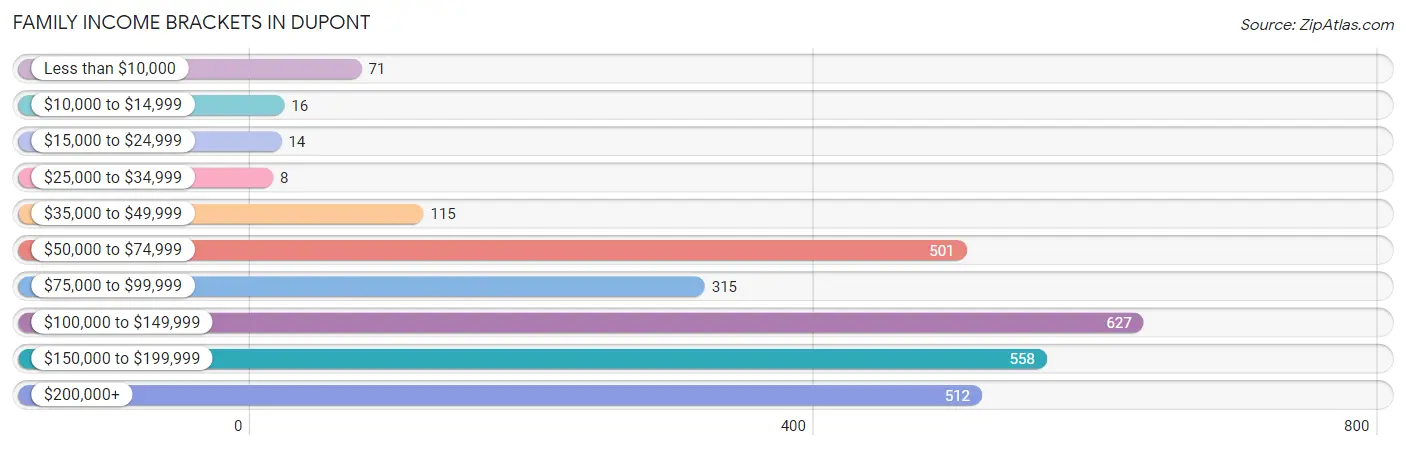
| Income Bracket | # Families | % Families |
| Less than $10,000 | 71 | 2.6% |
| $10,000 to $14,999 | 16 | 0.6% |
| $15,000 to $24,999 | 14 | 0.5% |
| $25,000 to $34,999 | 8 | 0.3% |
| $35,000 to $49,999 | 115 | 4.2% |
| $50,000 to $74,999 | 501 | 18.3% |
| $75,000 to $99,999 | 315 | 11.5% |
| $100,000 to $149,999 | 627 | 22.9% |
| $150,000 to $199,999 | 558 | 20.4% |
| $200,000+ | 512 | 18.7% |
Family Income by Famaliy Size in Dupont
3-person families (722 | 26.4%) account for the highest median family income in Dupont with $152,431 per family, while 3-person families (722 | 26.4%) have the highest median income of $50,810 per family member.
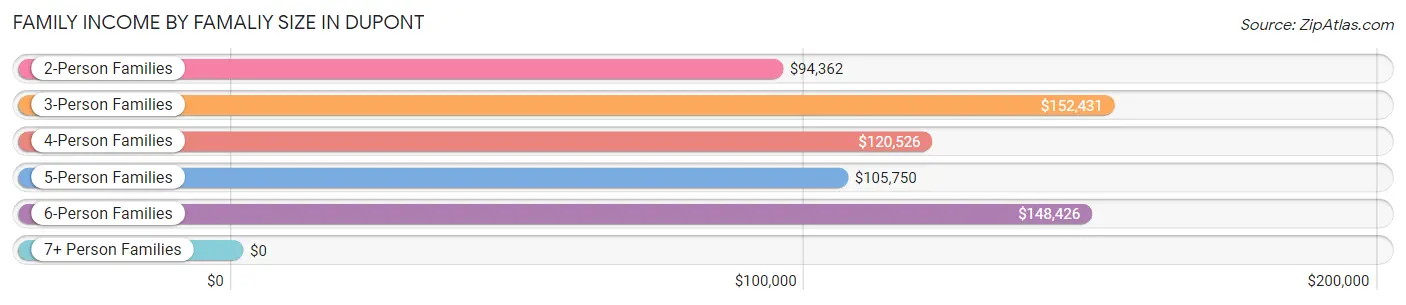
| Income Bracket | # Families | Median Income |
| 2-Person Families | 1,159 (42.3%) | $94,362 |
| 3-Person Families | 722 (26.4%) | $152,431 |
| 4-Person Families | 530 (19.4%) | $120,526 |
| 5-Person Families | 276 (10.1%) | $105,750 |
| 6-Person Families | 50 (1.8%) | $148,426 |
| 7+ Person Families | 0 (0.0%) | $0 |
| Total | 2,737 (100.0%) | $115,847 |
Family Income by Number of Earners in Dupont
The median family income in Dupont is $115,847, with families comprising 3+ earners (144) having the highest median family income of $195,547, while families with no earners (270) have the lowest median family income of $72,333, accounting for 5.3% and 9.9% of families, respectively.
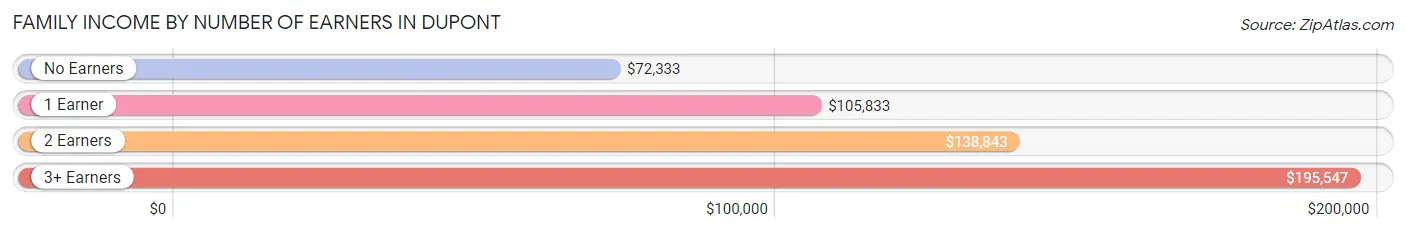
| Number of Earners | # Families | Median Income |
| No Earners | 270 (9.9%) | $72,333 |
| 1 Earner | 886 (32.4%) | $105,833 |
| 2 Earners | 1,437 (52.5%) | $138,843 |
| 3+ Earners | 144 (5.3%) | $195,547 |
| Total | 2,737 (100.0%) | $115,847 |
Household Income in Dupont
Household Income Brackets in Dupont
With 1,262 households falling in the category, the $100,000 to $149,999 income range is the most frequent in Dupont, accounting for 31.5% of all households. In contrast, only 8 households (0.2%) fall into the $25,000 to $34,999 income bracket, making it the least populous group.
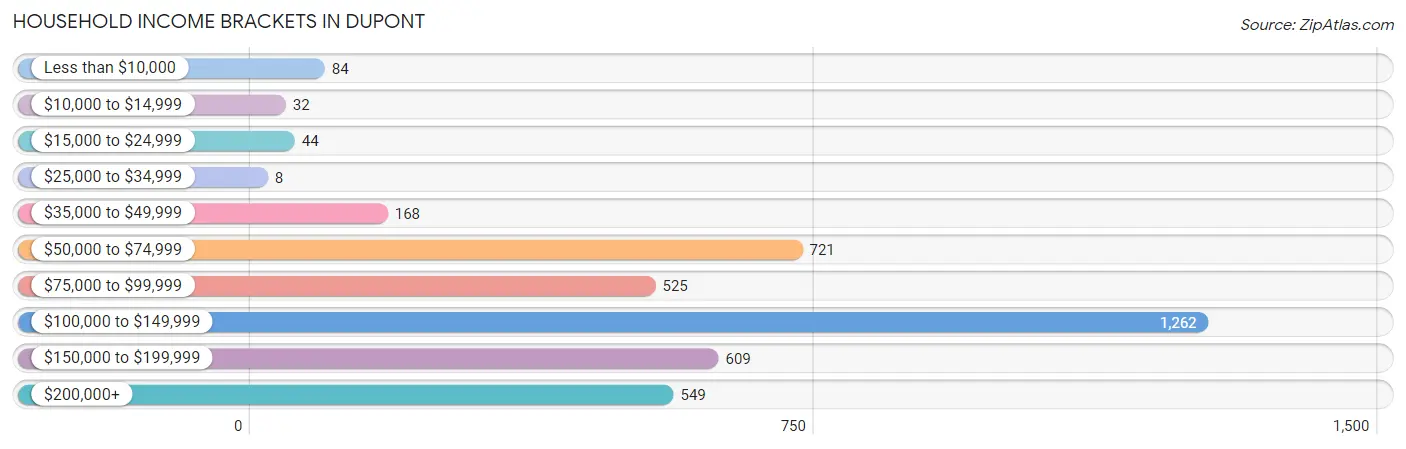
| Income Bracket | # Households | % Households |
| Less than $10,000 | 84 | 2.1% |
| $10,000 to $14,999 | 32 | 0.8% |
| $15,000 to $24,999 | 44 | 1.1% |
| $25,000 to $34,999 | 8 | 0.2% |
| $35,000 to $49,999 | 168 | 4.2% |
| $50,000 to $74,999 | 721 | 18.0% |
| $75,000 to $99,999 | 525 | 13.1% |
| $100,000 to $149,999 | 1,262 | 31.5% |
| $150,000 to $199,999 | 609 | 15.2% |
| $200,000+ | 549 | 13.7% |
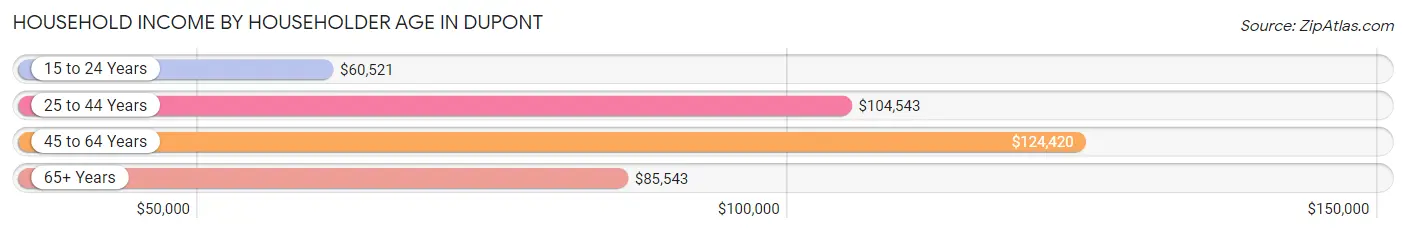
Household Income by Householder Age in Dupont
The median household income in Dupont is $106,695, with the highest median household income of $124,420 found in the 45 to 64 years age bracket for the primary householder. A total of 1,532 households (38.2%) fall into this category. Meanwhile, the 15 to 24 years age bracket for the primary householder has the lowest median household income of $60,521, with 183 households (4.6%) in this group.
| Income Bracket | # Households | Median Income |
| 15 to 24 Years | 183 (4.6%) | $60,521 |
| 25 to 44 Years | 1,704 (42.5%) | $104,543 |
| 45 to 64 Years | 1,532 (38.2%) | $124,420 |
| 65+ Years | 587 (14.6%) | $85,543 |
| Total | 4,006 (100.0%) | $106,695 |
Poverty in Dupont
Income Below Poverty by Sex and Age in Dupont
With 3.3% poverty level for males and 5.0% for females among the residents of Dupont, 65 to 74 year old males and 45 to 54 year old females are the most vulnerable to poverty, with 17 males (9.6%) and 84 females (12.2%) in their respective age groups living below the poverty level.
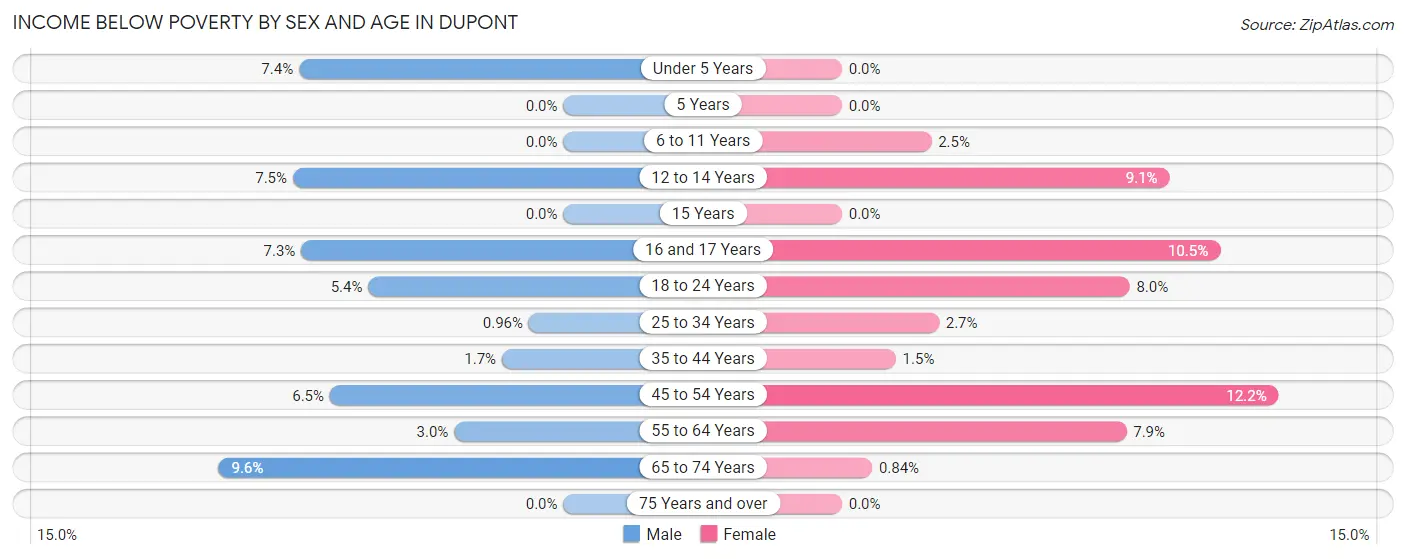
| Age Bracket | Male | Female |
| Under 5 Years | 24 (7.4%) | 0 (0.0%) |
| 5 Years | 0 (0.0%) | 0 (0.0%) |
| 6 to 11 Years | 0 (0.0%) | 14 (2.5%) |
| 12 to 14 Years | 14 (7.5%) | 26 (9.1%) |
| 15 Years | 0 (0.0%) | 0 (0.0%) |
| 16 and 17 Years | 13 (7.3%) | 8 (10.5%) |
| 18 to 24 Years | 19 (5.4%) | 41 (8.0%) |
| 25 to 34 Years | 9 (1.0%) | 19 (2.7%) |
| 35 to 44 Years | 12 (1.7%) | 12 (1.5%) |
| 45 to 54 Years | 39 (6.5%) | 84 (12.2%) |
| 55 to 64 Years | 15 (3.0%) | 48 (7.9%) |
| 65 to 74 Years | 17 (9.6%) | 2 (0.8%) |
| 75 Years and over | 0 (0.0%) | 0 (0.0%) |
| Total | 162 (3.3%) | 254 (5.0%) |
Income Above Poverty by Sex and Age in Dupont
According to the poverty statistics in Dupont, males aged 5 years and females aged under 5 years are the age groups that are most secure financially, with 100.0% of males and 100.0% of females in these age groups living above the poverty line.
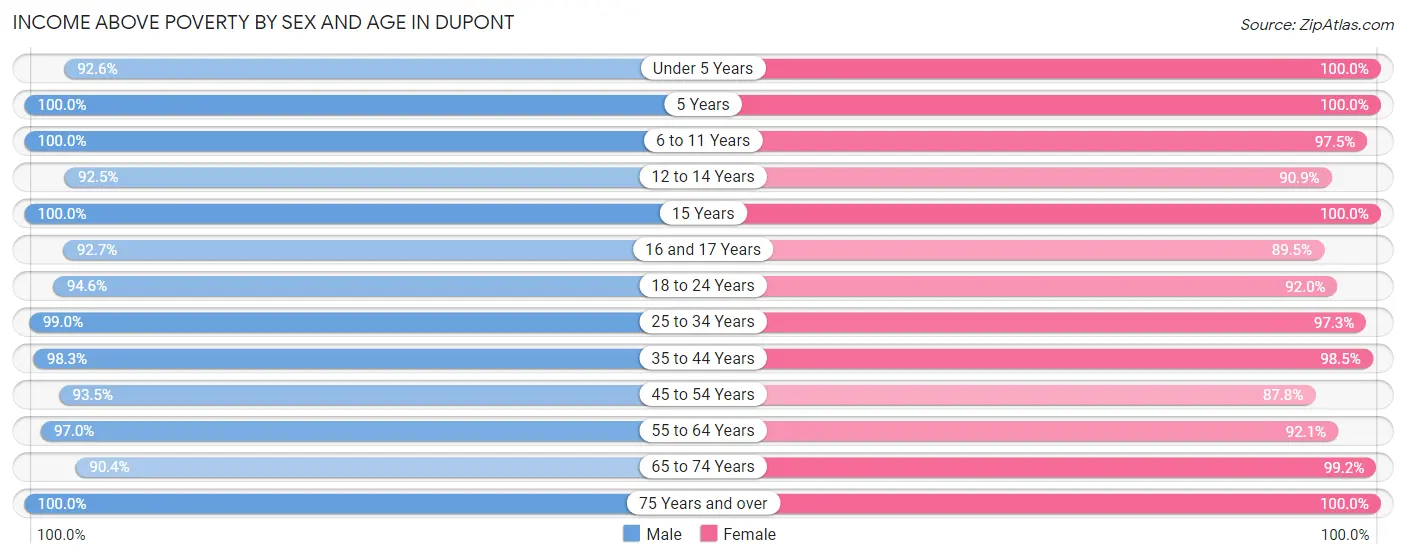
| Age Bracket | Male | Female |
| Under 5 Years | 302 (92.6%) | 273 (100.0%) |
| 5 Years | 93 (100.0%) | 44 (100.0%) |
| 6 to 11 Years | 474 (100.0%) | 548 (97.5%) |
| 12 to 14 Years | 172 (92.5%) | 259 (90.9%) |
| 15 Years | 8 (100.0%) | 48 (100.0%) |
| 16 and 17 Years | 165 (92.7%) | 68 (89.5%) |
| 18 to 24 Years | 331 (94.6%) | 471 (92.0%) |
| 25 to 34 Years | 928 (99.0%) | 686 (97.3%) |
| 35 to 44 Years | 690 (98.3%) | 788 (98.5%) |
| 45 to 54 Years | 561 (93.5%) | 607 (87.8%) |
| 55 to 64 Years | 479 (97.0%) | 558 (92.1%) |
| 65 to 74 Years | 160 (90.4%) | 235 (99.2%) |
| 75 Years and over | 328 (100.0%) | 220 (100.0%) |
| Total | 4,691 (96.7%) | 4,805 (95.0%) |
Income Below Poverty Among Married-Couple Families in Dupont
The poverty statistics for married-couple families in Dupont show that 3.1% or 74 of the total 2,417 families live below the poverty line. Families with no children have the highest poverty rate of 4.4%, comprising of 54 families. On the other hand, families with 3 or 4 children have the lowest poverty rate of 0.0%, which includes 0 families.
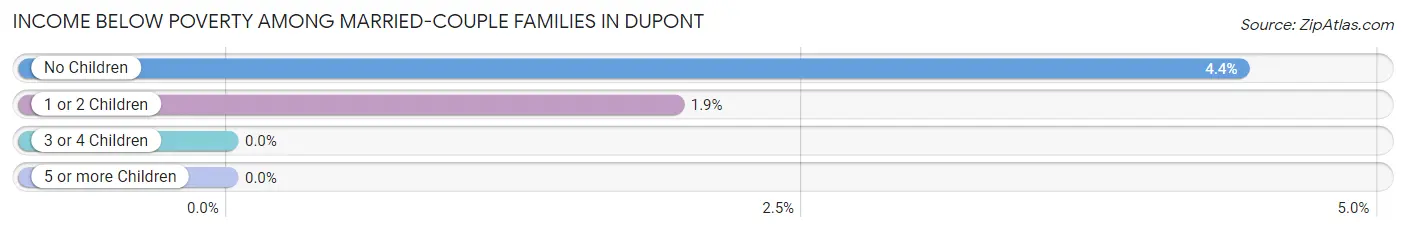
| Children | Above Poverty | Below Poverty |
| No Children | 1,174 (95.6%) | 54 (4.4%) |
| 1 or 2 Children | 1,012 (98.1%) | 20 (1.9%) |
| 3 or 4 Children | 157 (100.0%) | 0 (0.0%) |
| 5 or more Children | 0 (0.0%) | 0 (0.0%) |
| Total | 2,343 (96.9%) | 74 (3.1%) |
Income Below Poverty Among Single-Parent Households in Dupont
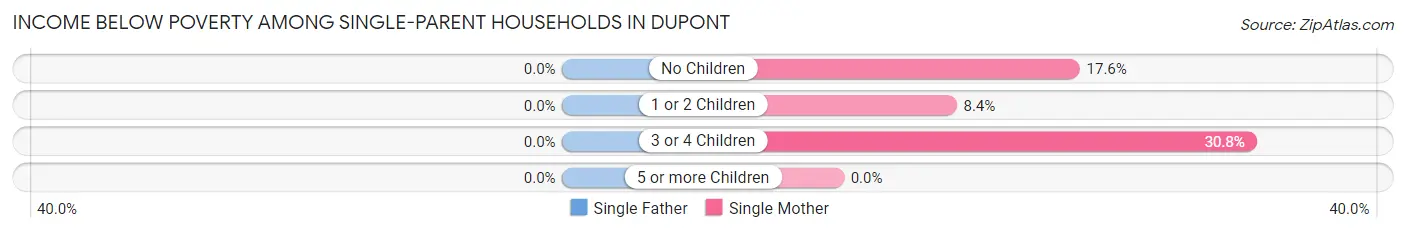
| Children | Single Father | Single Mother |
| No Children | 0 (0.0%) | 16 (17.6%) |
| 1 or 2 Children | 0 (0.0%) | 9 (8.4%) |
| 3 or 4 Children | 0 (0.0%) | 12 (30.8%) |
| 5 or more Children | 0 (0.0%) | 0 (0.0%) |
| Total | 0 (0.0%) | 37 (15.6%) |
Income Below Poverty Among Married-Couple vs Single-Parent Households in Dupont
The poverty data for Dupont shows that 74 of the married-couple family households (3.1%) and 37 of the single-parent households (11.6%) are living below the poverty level. Within the married-couple family households, those with no children have the highest poverty rate, with 54 households (4.4%) falling below the poverty line. Among the single-parent households, those with 3 or 4 children have the highest poverty rate, with 12 household (30.8%) living below poverty.
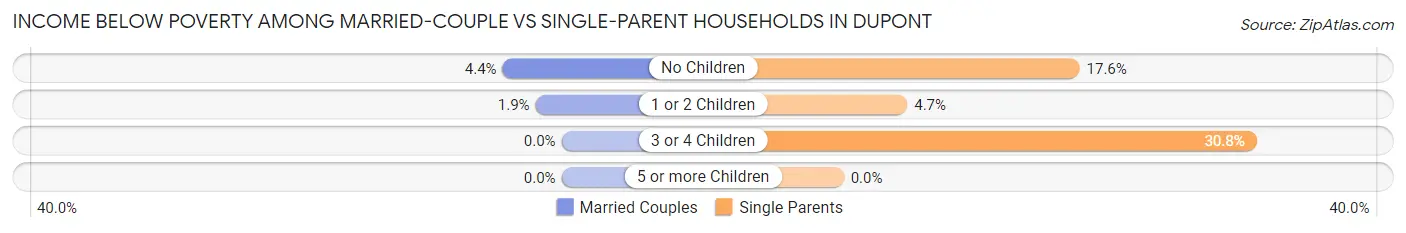
| Children | Married-Couple Families | Single-Parent Households |
| No Children | 54 (4.4%) | 16 (17.6%) |
| 1 or 2 Children | 20 (1.9%) | 9 (4.7%) |
| 3 or 4 Children | 0 (0.0%) | 12 (30.8%) |
| 5 or more Children | 0 (0.0%) | 0 (0.0%) |
| Total | 74 (3.1%) | 37 (11.6%) |
Race in Dupont
The most populous races in Dupont are White / Caucasian (6,422 | 64.5%), Hispanic or Latino (1,207 | 12.1%), and Two or more Races (1,125 | 11.3%).
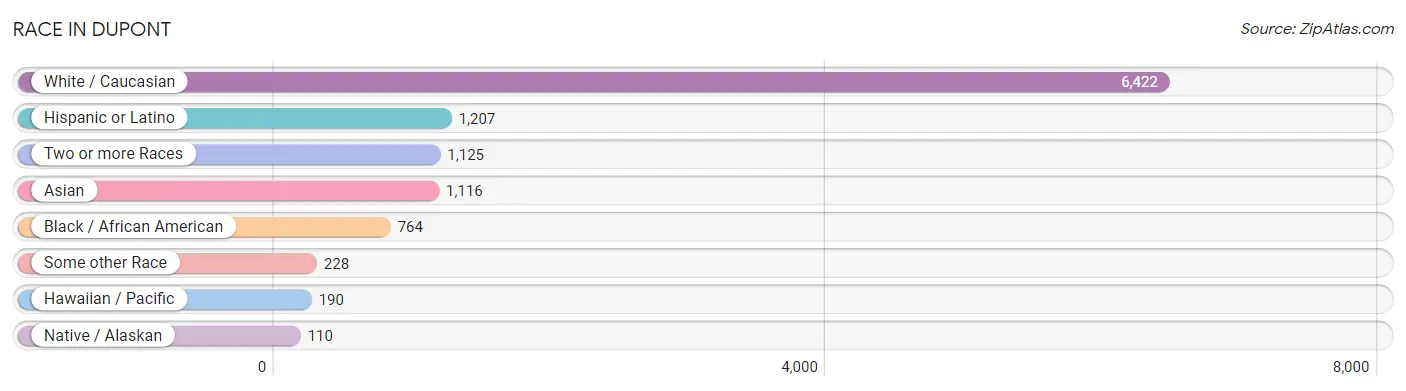
| Race | # Population | % Population |
| Asian | 1,116 | 11.2% |
| Black / African American | 764 | 7.7% |
| Hawaiian / Pacific | 190 | 1.9% |
| Hispanic or Latino | 1,207 | 12.1% |
| Native / Alaskan | 110 | 1.1% |
| White / Caucasian | 6,422 | 64.5% |
| Two or more Races | 1,125 | 11.3% |
| Some other Race | 228 | 2.3% |
| Total | 9,955 | 100.0% |
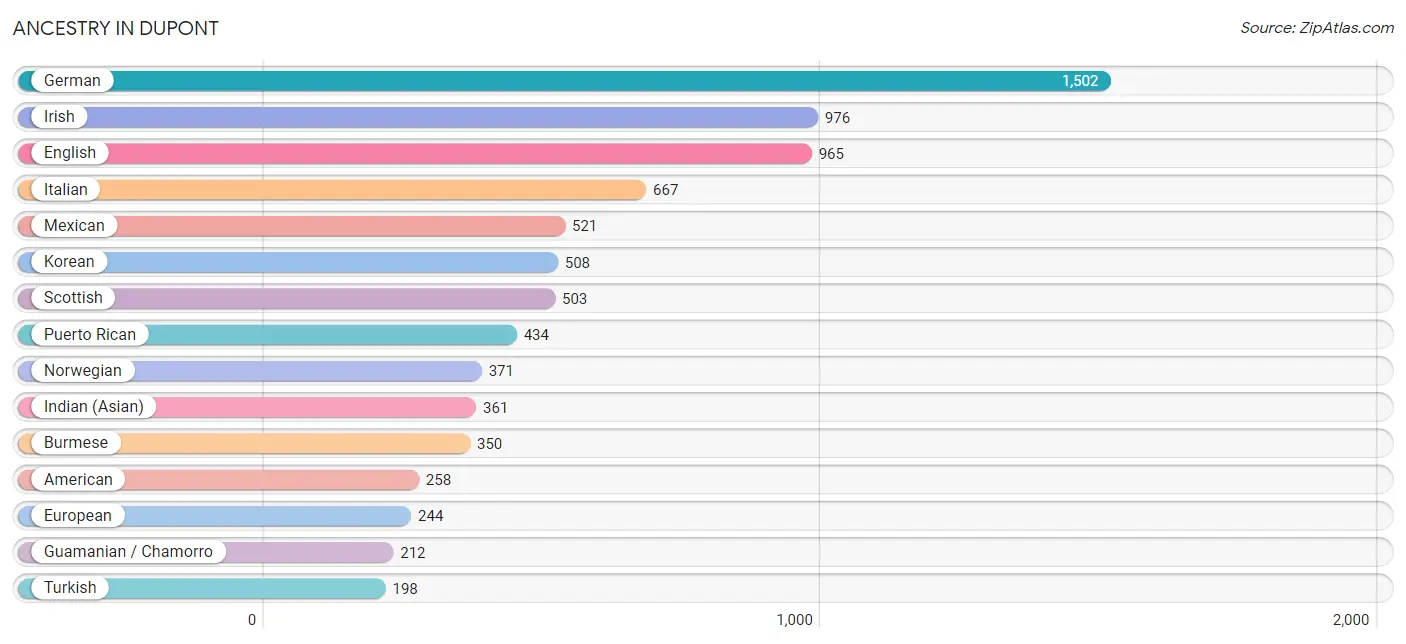
Ancestry in Dupont
The most populous ancestries reported in Dupont are German (1,502 | 15.1%), Irish (976 | 9.8%), English (965 | 9.7%), Italian (667 | 6.7%), and Mexican (521 | 5.2%), together accounting for 46.5% of all Dupont residents.
| Ancestry | # Population | % Population |
| American | 258 | 2.6% |
| Bhutanese | 188 | 1.9% |
| British | 22 | 0.2% |
| Burmese | 350 | 3.5% |
| Canadian | 38 | 0.4% |
| Central American | 107 | 1.1% |
| Central American Indian | 179 | 1.8% |
| Cherokee | 27 | 0.3% |
| Chickasaw | 48 | 0.5% |
| Colombian | 42 | 0.4% |
| Czech | 10 | 0.1% |
| Danish | 51 | 0.5% |
| Dutch | 172 | 1.7% |
| Eastern European | 16 | 0.2% |
| English | 965 | 9.7% |
| Ethiopian | 14 | 0.1% |
| European | 244 | 2.5% |
| Finnish | 90 | 0.9% |
| French | 142 | 1.4% |
| German | 1,502 | 15.1% |
| Greek | 39 | 0.4% |
| Guamanian / Chamorro | 212 | 2.1% |
| Guatemalan | 53 | 0.5% |
| Indian (Asian) | 361 | 3.6% |
| Irish | 976 | 9.8% |
| Italian | 667 | 6.7% |
| Korean | 508 | 5.1% |
| Lithuanian | 82 | 0.8% |
| Mexican | 521 | 5.2% |
| Native Hawaiian | 14 | 0.1% |
| Northern European | 113 | 1.1% |
| Norwegian | 371 | 3.7% |
| Pakistani | 82 | 0.8% |
| Polish | 121 | 1.2% |
| Portuguese | 172 | 1.7% |
| Puerto Rican | 434 | 4.4% |
| Salvadoran | 54 | 0.5% |
| Scandinavian | 58 | 0.6% |
| Scotch-Irish | 87 | 0.9% |
| Scottish | 503 | 5.1% |
| Slovak | 33 | 0.3% |
| South American | 42 | 0.4% |
| Spaniard | 26 | 0.3% |
| Spanish | 25 | 0.3% |
| Sri Lankan | 60 | 0.6% |
| Subsaharan African | 14 | 0.1% |
| Swedish | 147 | 1.5% |
| Thai | 83 | 0.8% |
| Turkish | 198 | 2.0% |
| Ukrainian | 34 | 0.3% |
| Welsh | 93 | 0.9% | View All 51 Rows |
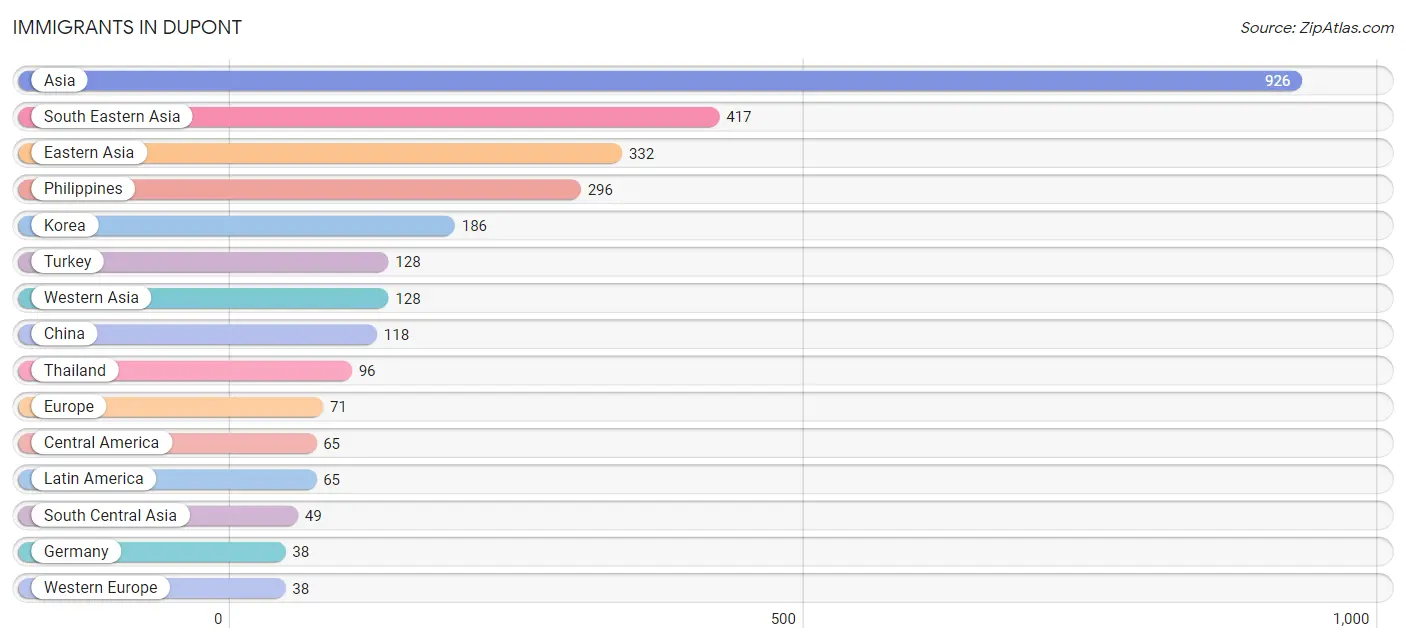
Immigrants in Dupont
The most numerous immigrant groups reported in Dupont came from Asia (926 | 9.3%), South Eastern Asia (417 | 4.2%), Eastern Asia (332 | 3.3%), Philippines (296 | 3.0%), and Korea (186 | 1.9%), together accounting for 21.7% of all Dupont residents.
| Immigration Origin | # Population | % Population |
| Africa | 14 | 0.1% |
| Asia | 926 | 9.3% |
| Cambodia | 25 | 0.3% |
| Canada | 18 | 0.2% |
| Central America | 65 | 0.6% |
| China | 118 | 1.2% |
| Eastern Africa | 14 | 0.1% |
| Eastern Asia | 332 | 3.3% |
| El Salvador | 35 | 0.4% |
| Ethiopia | 14 | 0.1% |
| Europe | 71 | 0.7% |
| Germany | 38 | 0.4% |
| Greece | 19 | 0.2% |
| Guatemala | 18 | 0.2% |
| India | 15 | 0.2% |
| Japan | 28 | 0.3% |
| Korea | 186 | 1.9% |
| Latin America | 65 | 0.6% |
| Mexico | 12 | 0.1% |
| Nepal | 34 | 0.3% |
| Philippines | 296 | 3.0% |
| South Central Asia | 49 | 0.5% |
| South Eastern Asia | 417 | 4.2% |
| Southern Europe | 19 | 0.2% |
| Taiwan | 9 | 0.1% |
| Thailand | 96 | 1.0% |
| Turkey | 128 | 1.3% |
| Western Asia | 128 | 1.3% |
| Western Europe | 38 | 0.4% | View All 29 Rows |
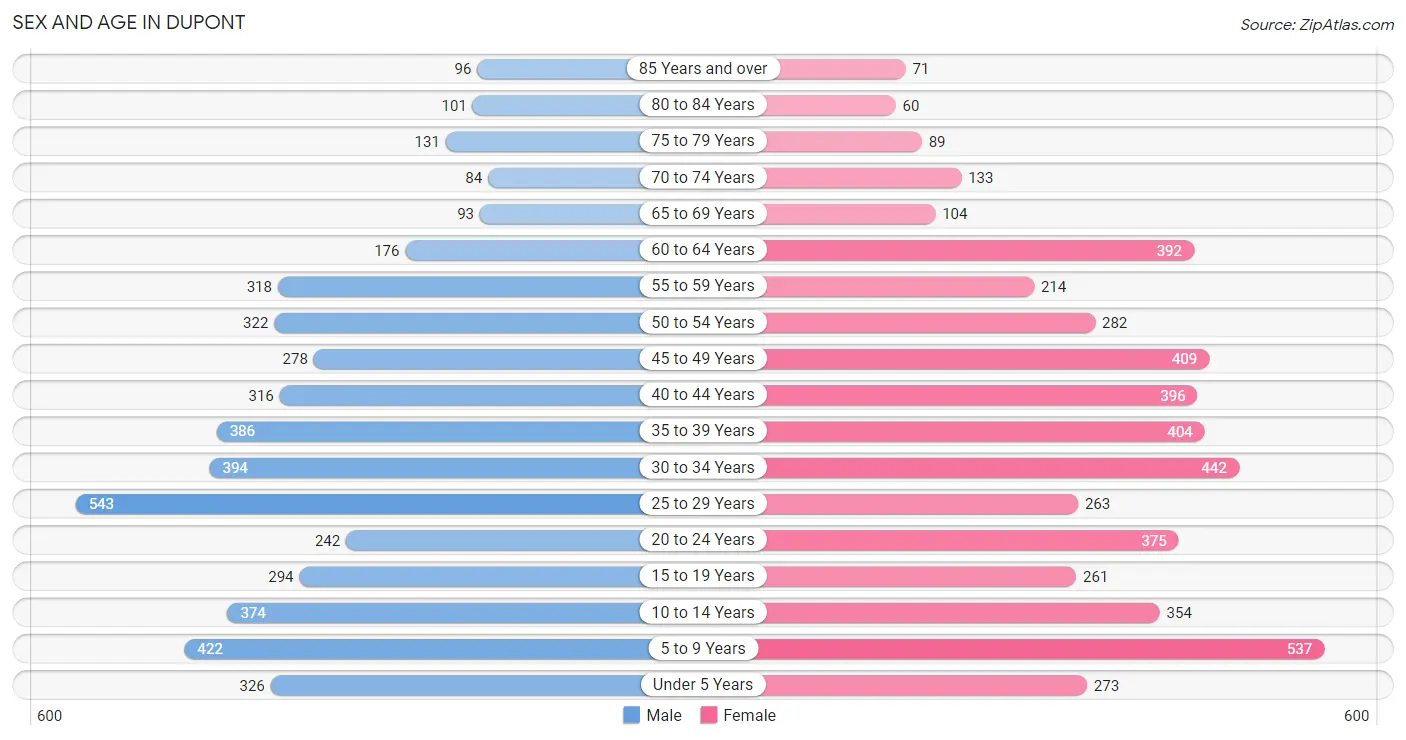
Sex and Age in Dupont
Sex and Age in Dupont
The most populous age groups in Dupont are 25 to 29 Years (543 | 11.1%) for men and 5 to 9 Years (537 | 10.6%) for women.
| Age Bracket | Male | Female |
| Under 5 Years | 326 (6.7%) | 273 (5.4%) |
| 5 to 9 Years | 422 (8.6%) | 537 (10.6%) |
| 10 to 14 Years | 374 (7.6%) | 354 (7.0%) |
| 15 to 19 Years | 294 (6.0%) | 261 (5.2%) |
| 20 to 24 Years | 242 (4.9%) | 375 (7.4%) |
| 25 to 29 Years | 543 (11.1%) | 263 (5.2%) |
| 30 to 34 Years | 394 (8.1%) | 442 (8.7%) |
| 35 to 39 Years | 386 (7.9%) | 404 (8.0%) |
| 40 to 44 Years | 316 (6.5%) | 396 (7.8%) |
| 45 to 49 Years | 278 (5.7%) | 409 (8.1%) |
| 50 to 54 Years | 322 (6.6%) | 282 (5.6%) |
| 55 to 59 Years | 318 (6.5%) | 214 (4.2%) |
| 60 to 64 Years | 176 (3.6%) | 392 (7.7%) |
| 65 to 69 Years | 93 (1.9%) | 104 (2.1%) |
| 70 to 74 Years | 84 (1.7%) | 133 (2.6%) |
| 75 to 79 Years | 131 (2.7%) | 89 (1.8%) |
| 80 to 84 Years | 101 (2.1%) | 60 (1.2%) |
| 85 Years and over | 96 (2.0%) | 71 (1.4%) |
| Total | 4,896 (100.0%) | 5,059 (100.0%) |
Families and Households in Dupont
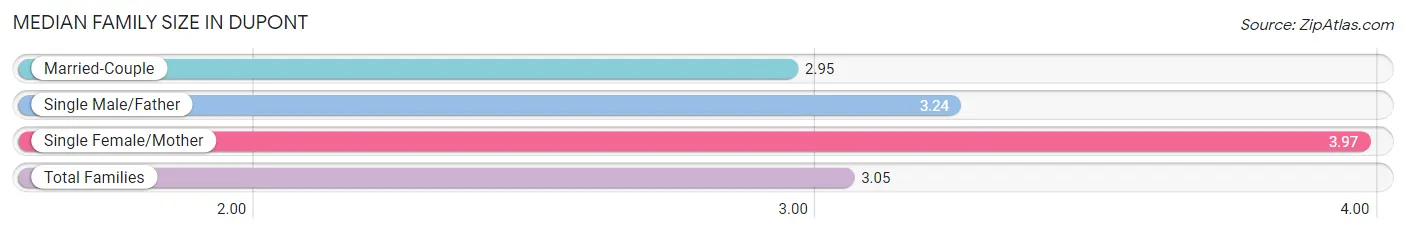
Median Family Size in Dupont
The median family size in Dupont is 3.05 persons per family, with single female/mother families (237 | 8.7%) accounting for the largest median family size of 3.97 persons per family. On the other hand, married-couple families (2,417 | 88.3%) represent the smallest median family size with 2.95 persons per family.
| Family Type | # Families | Family Size |
| Married-Couple | 2,417 (88.3%) | 2.95 |
| Single Male/Father | 83 (3.0%) | 3.24 |
| Single Female/Mother | 237 (8.7%) | 3.97 |
| Total Families | 2,737 (100.0%) | 3.05 |
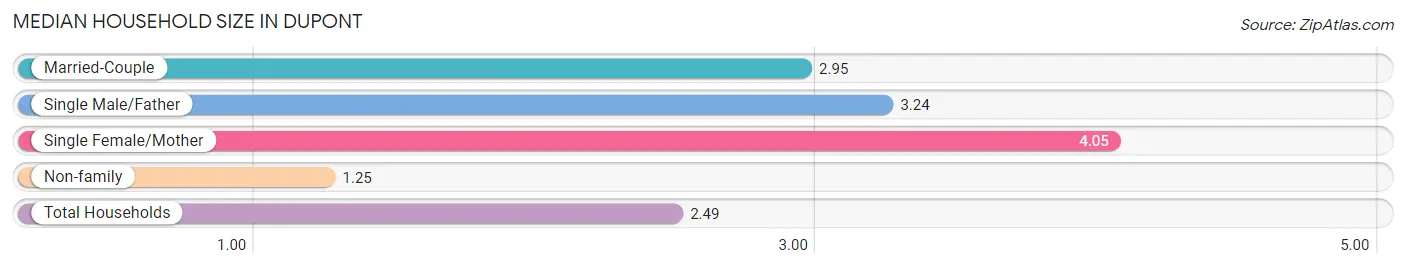
Median Household Size in Dupont
The median household size in Dupont is 2.49 persons per household, with single female/mother households (237 | 5.9%) accounting for the largest median household size of 4.05 persons per household. non-family households (1,269 | 31.7%) represent the smallest median household size with 1.25 persons per household.
| Household Type | # Households | Household Size |
| Married-Couple | 2,417 (60.3%) | 2.95 |
| Single Male/Father | 83 (2.1%) | 3.24 |
| Single Female/Mother | 237 (5.9%) | 4.05 |
| Non-family | 1,269 (31.7%) | 1.25 |
| Total Households | 4,006 (100.0%) | 2.49 |
Household Size by Marriage Status in Dupont
Out of a total of 4,006 households in Dupont, 2,737 (68.3%) are family households, while 1,269 (31.7%) are nonfamily households. The most numerous type of family households are 2-person households, comprising 1,143, and the most common type of nonfamily households are 1-person households, comprising 1,013.
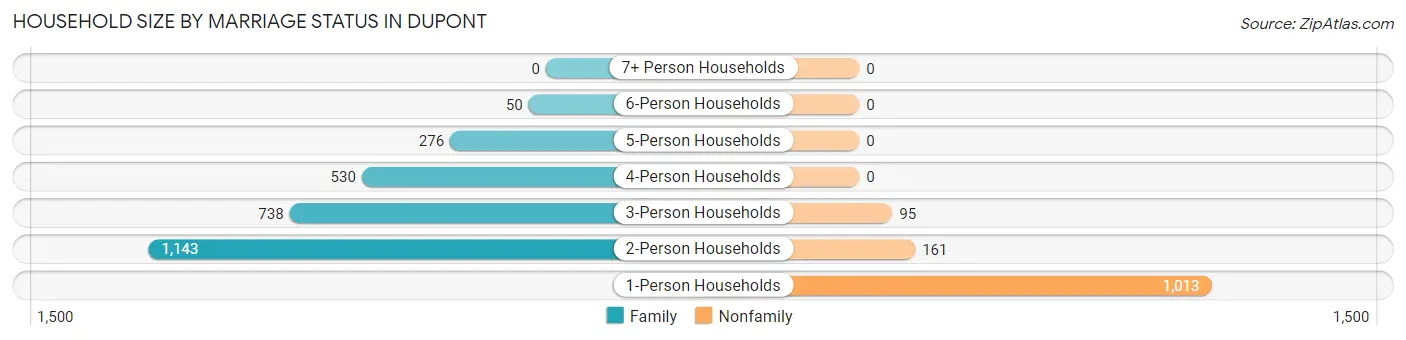
| Household Size | Family Households | Nonfamily Households |
| 1-Person Households | - | 1,013 (25.3%) |
| 2-Person Households | 1,143 (28.5%) | 161 (4.0%) |
| 3-Person Households | 738 (18.4%) | 95 (2.4%) |
| 4-Person Households | 530 (13.2%) | 0 (0.0%) |
| 5-Person Households | 276 (6.9%) | 0 (0.0%) |
| 6-Person Households | 50 (1.3%) | 0 (0.0%) |
| 7+ Person Households | 0 (0.0%) | 0 (0.0%) |
| Total | 2,737 (68.3%) | 1,269 (31.7%) |
Female Fertility in Dupont
Fertility by Age in Dupont
Average fertility rate in Dupont is 67.0 births per 1,000 women. Women in the age bracket of 20 to 34 years have the highest fertility rate with 106.0 births per 1,000 women. Women in the age bracket of 20 to 34 years acount for 66.1% of all women with births.
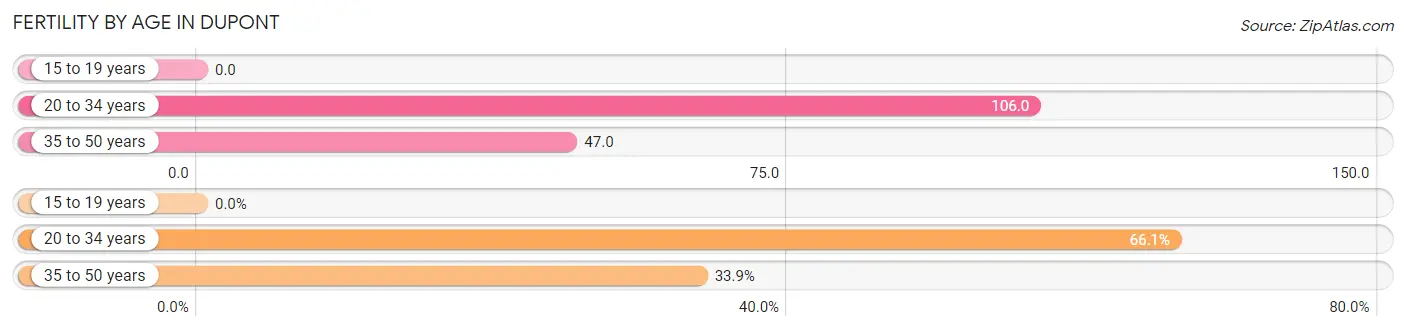
| Age Bracket | Women with Births | Births / 1,000 Women |
| 15 to 19 years | 0 (0.0%) | 0.0 |
| 20 to 34 years | 115 (66.1%) | 106.0 |
| 35 to 50 years | 59 (33.9%) | 47.0 |
| Total | 174 (100.0%) | 67.0 |
Fertility by Age by Marriage Status in Dupont
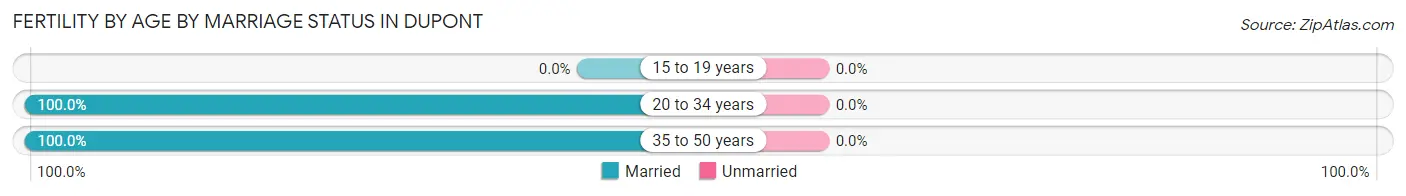
| Age Bracket | Married | Unmarried |
| 15 to 19 years | 0 (0.0%) | 0 (0.0%) |
| 20 to 34 years | 115 (100.0%) | 0 (0.0%) |
| 35 to 50 years | 59 (100.0%) | 0 (0.0%) |
| Total | 174 (100.0%) | 0 (0.0%) |
Fertility by Education in Dupont
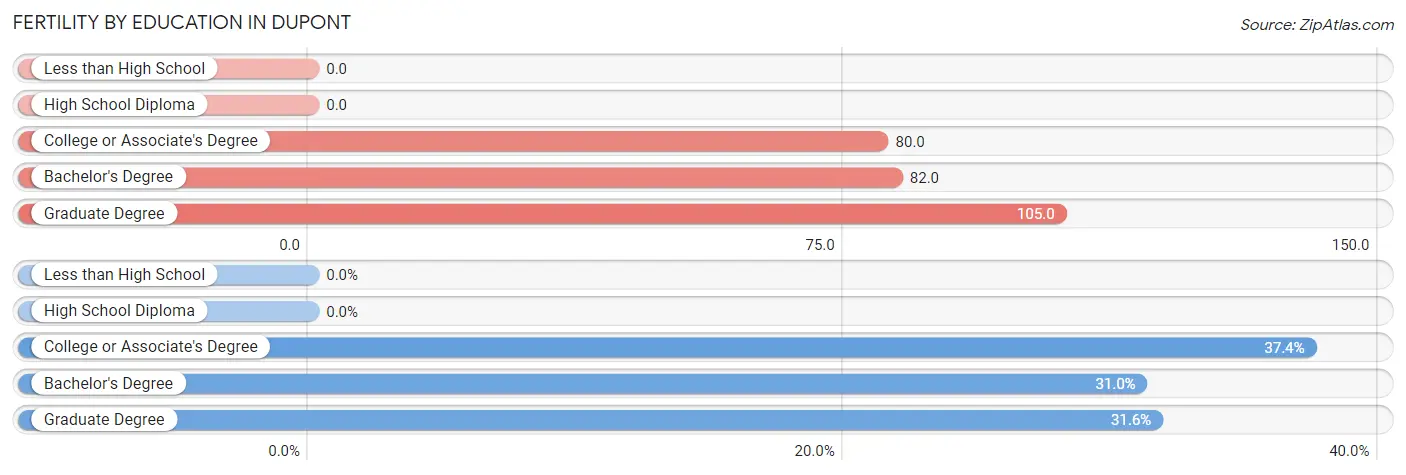
| Educational Attainment | Women with Births | Births / 1,000 Women |
| Less than High School | 0 (0.0%) | 0.0 |
| High School Diploma | 0 (0.0%) | 0.0 |
| College or Associate's Degree | 65 (37.4%) | 80.0 |
| Bachelor's Degree | 54 (31.0%) | 82.0 |
| Graduate Degree | 55 (31.6%) | 105.0 |
| Total | 174 (100.0%) | 67.0 |
Fertility by Education by Marriage Status in Dupont
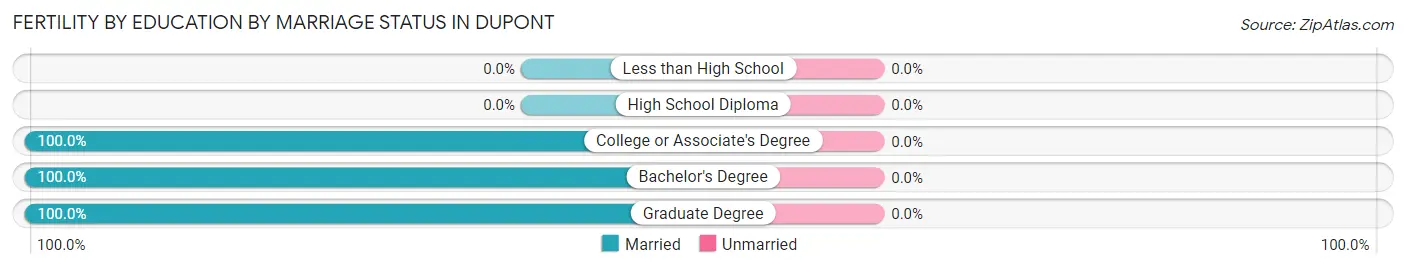
| Educational Attainment | Married | Unmarried |
| Less than High School | 0 (0.0%) | 0 (0.0%) |
| High School Diploma | 0 (0.0%) | 0 (0.0%) |
| College or Associate's Degree | 65 (100.0%) | 0 (0.0%) |
| Bachelor's Degree | 54 (100.0%) | 0 (0.0%) |
| Graduate Degree | 55 (100.0%) | 0 (0.0%) |
| Total | 174 (100.0%) | 0 (0.0%) |
Employment Characteristics in Dupont
Employment by Class of Employer in Dupont
Among the 4,905 employed individuals in Dupont, private company employees (2,041 | 41.6%), federal government employees (2,011 | 41.0%), and local government employees (279 | 5.7%) make up the most common classes of employment.
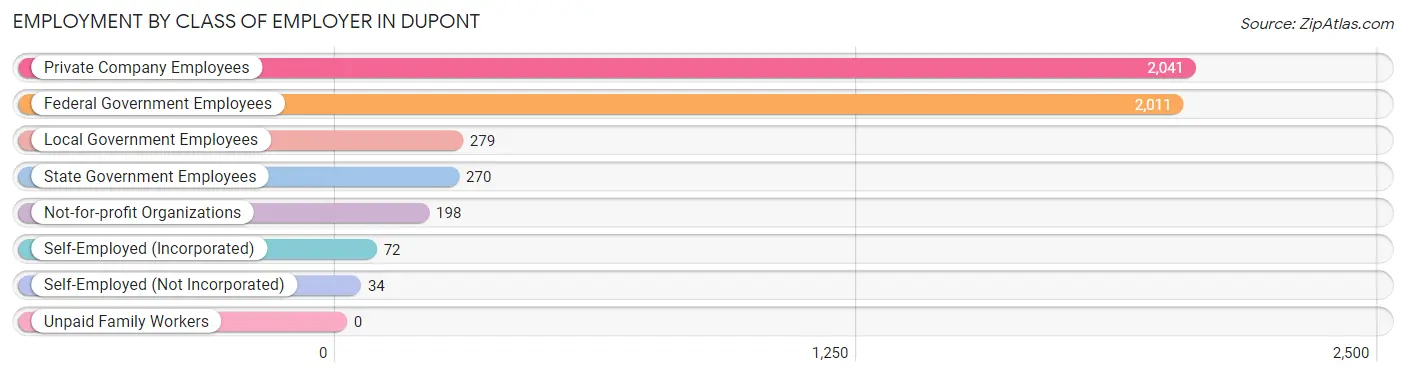
| Employer Class | # Employees | % Employees |
| Private Company Employees | 2,041 | 41.6% |
| Self-Employed (Incorporated) | 72 | 1.5% |
| Self-Employed (Not Incorporated) | 34 | 0.7% |
| Not-for-profit Organizations | 198 | 4.0% |
| Local Government Employees | 279 | 5.7% |
| State Government Employees | 270 | 5.5% |
| Federal Government Employees | 2,011 | 41.0% |
| Unpaid Family Workers | 0 | 0.0% |
| Total | 4,905 | 100.0% |
Employment Status by Age in Dupont
According to the labor force statistics for Dupont, out of the total population over 16 years of age (7,613), 69.3% or 5,276 individuals are in the labor force, with 4.7% or 248 of them unemployed. The age group with the highest labor force participation rate is 20 to 24 years, with 87.2% or 538 individuals in the labor force. Within the labor force, the 20 to 24 years age range has the highest percentage of unemployed individuals, with 15.8% or 85 of them being unemployed.
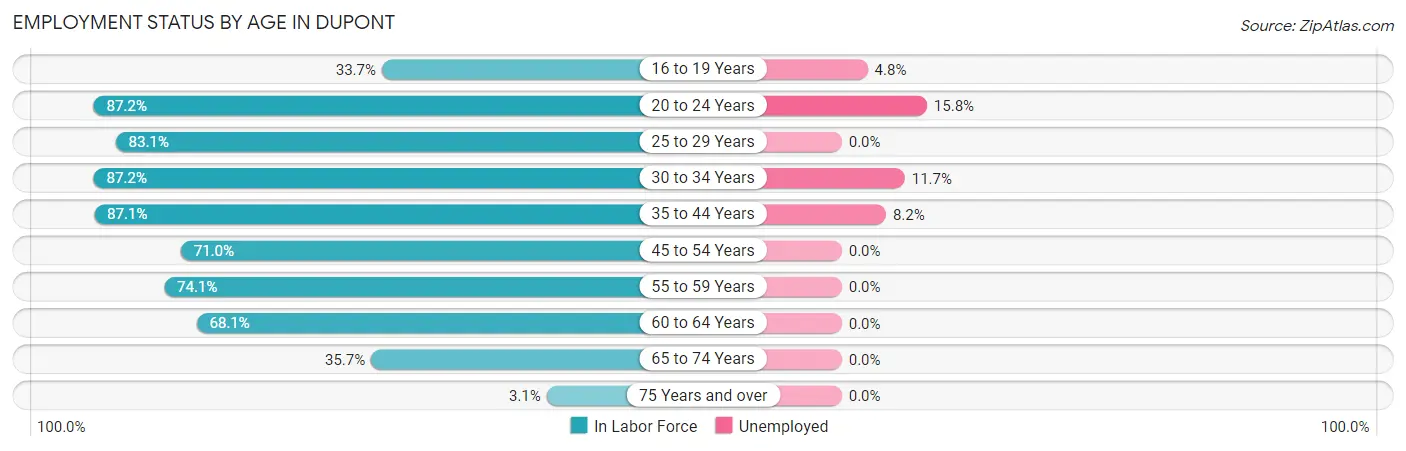
| Age Bracket | In Labor Force | Unemployed |
| 16 to 19 Years | 168 (33.7%) | 8 (4.8%) |
| 20 to 24 Years | 538 (87.2%) | 85 (15.8%) |
| 25 to 29 Years | 670 (83.1%) | 0 (0.0%) |
| 30 to 34 Years | 729 (87.2%) | 85 (11.7%) |
| 35 to 44 Years | 1,308 (87.1%) | 107 (8.2%) |
| 45 to 54 Years | 917 (71.0%) | 0 (0.0%) |
| 55 to 59 Years | 394 (74.1%) | 0 (0.0%) |
| 60 to 64 Years | 387 (68.1%) | 0 (0.0%) |
| 65 to 74 Years | 148 (35.7%) | 0 (0.0%) |
| 75 Years and over | 17 (3.1%) | 0 (0.0%) |
| Total | 5,276 (69.3%) | 248 (4.7%) |
Employment Status by Educational Attainment in Dupont
According to labor force statistics for Dupont, 79.6% of individuals (4,406) out of the total population between 25 and 64 years of age (5,535) are in the labor force, with 3.8% or 167 of them being unemployed. The group with the highest labor force participation rate are those with the educational attainment of less than high school, with 100.0% or 135 individuals in the labor force. Within the labor force, individuals with college / associate degree education have the highest percentage of unemployment, with 6.8% or 103 of them being unemployed.
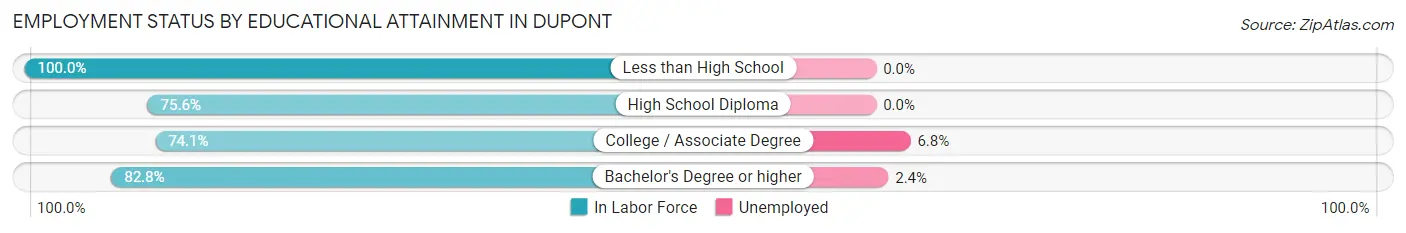
| Educational Attainment | In Labor Force | Unemployed |
| Less than High School | 135 (100.0%) | 0 (0.0%) |
| High School Diploma | 264 (75.6%) | 0 (0.0%) |
| College / Associate Degree | 1,509 (74.1%) | 139 (6.8%) |
| Bachelor's Degree or higher | 2,496 (82.8%) | 72 (2.4%) |
| Total | 4,406 (79.6%) | 210 (3.8%) |
Employment Occupations by Sex in Dupont
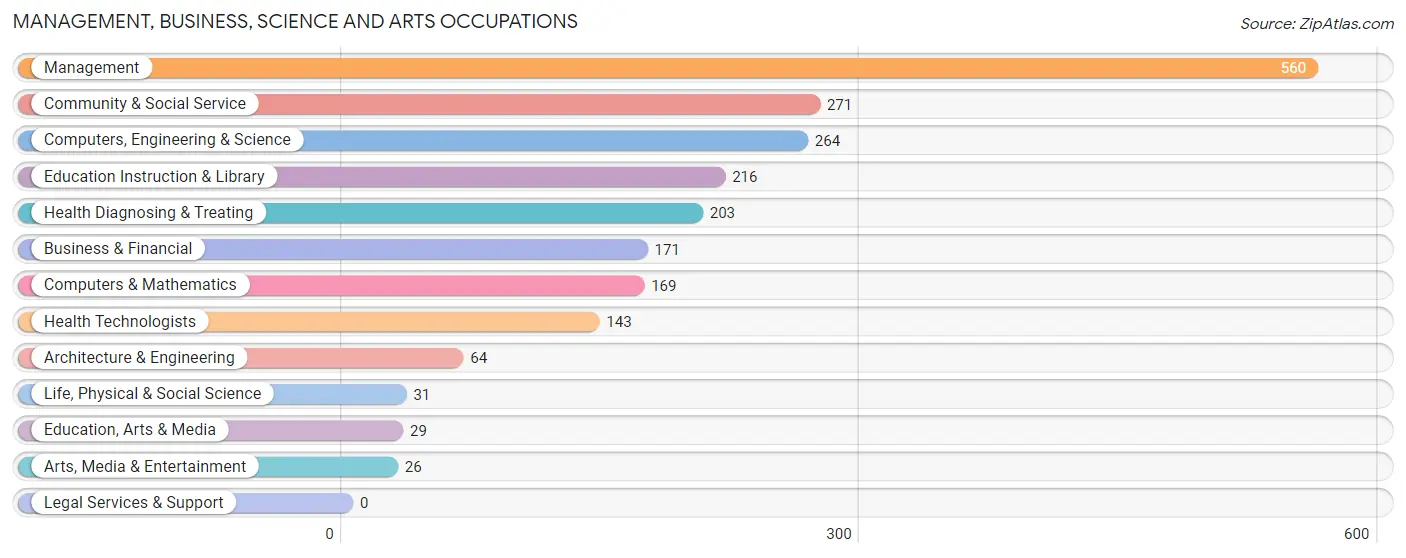
Management, Business, Science and Arts Occupations
The most common Management, Business, Science and Arts occupations in Dupont are Management (560 | 15.3%), Community & Social Service (271 | 7.4%), Computers, Engineering & Science (264 | 7.2%), Education Instruction & Library (216 | 5.9%), and Health Diagnosing & Treating (203 | 5.6%).
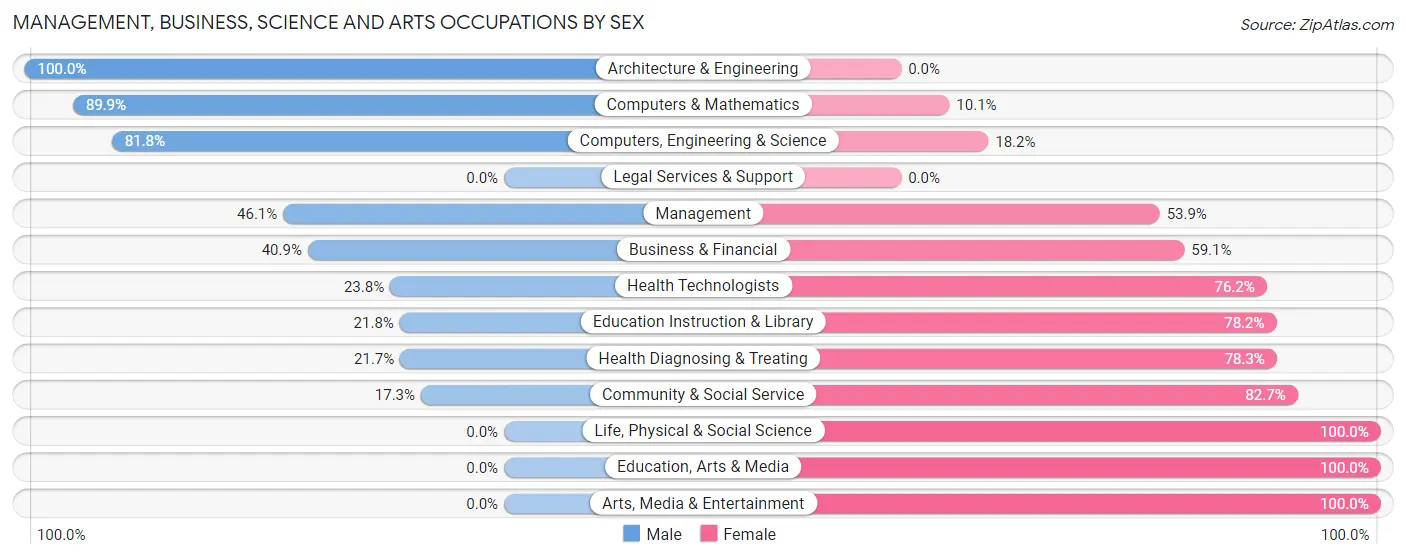
Management, Business, Science and Arts Occupations by Sex
Within the Management, Business, Science and Arts occupations in Dupont, the most male-oriented occupations are Architecture & Engineering (100.0%), Computers & Mathematics (89.9%), and Computers, Engineering & Science (81.8%), while the most female-oriented occupations are Life, Physical & Social Science (100.0%), Education, Arts & Media (100.0%), and Arts, Media & Entertainment (100.0%).
| Occupation | Male | Female |
| Management | 258 (46.1%) | 302 (53.9%) |
| Business & Financial | 70 (40.9%) | 101 (59.1%) |
| Computers, Engineering & Science | 216 (81.8%) | 48 (18.2%) |
| Computers & Mathematics | 152 (89.9%) | 17 (10.1%) |
| Architecture & Engineering | 64 (100.0%) | 0 (0.0%) |
| Life, Physical & Social Science | 0 (0.0%) | 31 (100.0%) |
| Community & Social Service | 47 (17.3%) | 224 (82.7%) |
| Education, Arts & Media | 0 (0.0%) | 29 (100.0%) |
| Legal Services & Support | 0 (0.0%) | 0 (0.0%) |
| Education Instruction & Library | 47 (21.8%) | 169 (78.2%) |
| Arts, Media & Entertainment | 0 (0.0%) | 26 (100.0%) |
| Health Diagnosing & Treating | 44 (21.7%) | 159 (78.3%) |
| Health Technologists | 34 (23.8%) | 109 (76.2%) |
| Total (Category) | 635 (43.2%) | 834 (56.8%) |
| Total (Overall) | 1,630 (44.5%) | 2,030 (55.5%) |
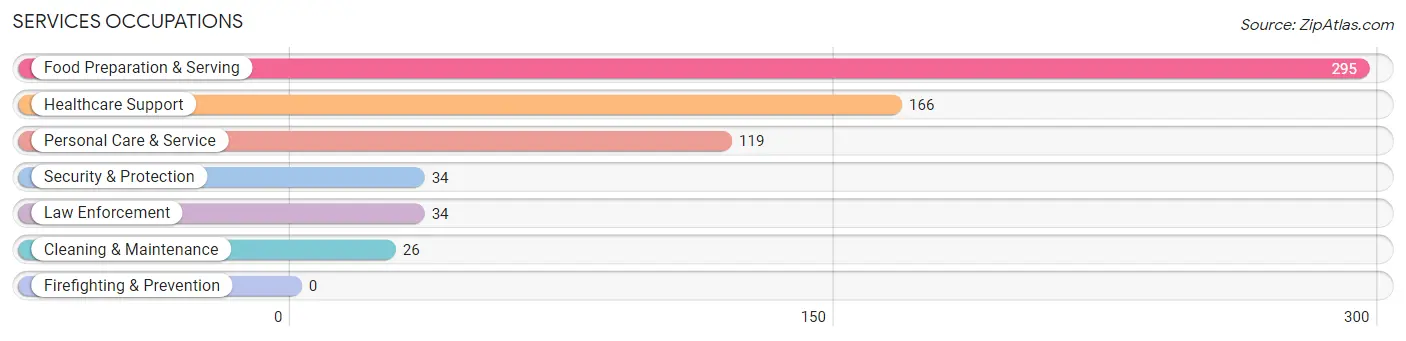
Services Occupations
The most common Services occupations in Dupont are Food Preparation & Serving (295 | 8.1%), Healthcare Support (166 | 4.5%), Personal Care & Service (119 | 3.3%), Security & Protection (34 | 0.9%), and Law Enforcement (34 | 0.9%).
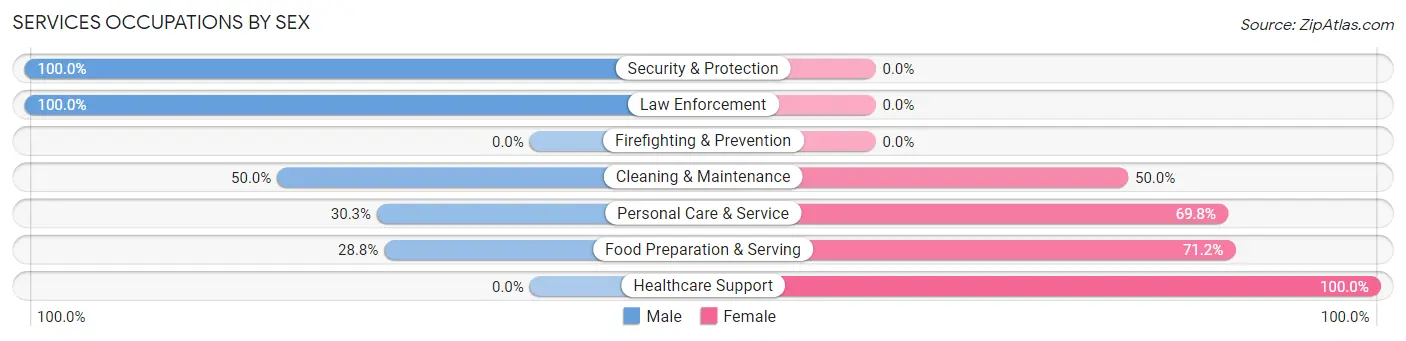
Services Occupations by Sex
Within the Services occupations in Dupont, the most male-oriented occupations are Security & Protection (100.0%), Law Enforcement (100.0%), and Cleaning & Maintenance (50.0%), while the most female-oriented occupations are Healthcare Support (100.0%), Food Preparation & Serving (71.2%), and Personal Care & Service (69.8%).
| Occupation | Male | Female |
| Healthcare Support | 0 (0.0%) | 166 (100.0%) |
| Security & Protection | 34 (100.0%) | 0 (0.0%) |
| Firefighting & Prevention | 0 (0.0%) | 0 (0.0%) |
| Law Enforcement | 34 (100.0%) | 0 (0.0%) |
| Food Preparation & Serving | 85 (28.8%) | 210 (71.2%) |
| Cleaning & Maintenance | 13 (50.0%) | 13 (50.0%) |
| Personal Care & Service | 36 (30.2%) | 83 (69.8%) |
| Total (Category) | 168 (26.3%) | 472 (73.8%) |
| Total (Overall) | 1,630 (44.5%) | 2,030 (55.5%) |
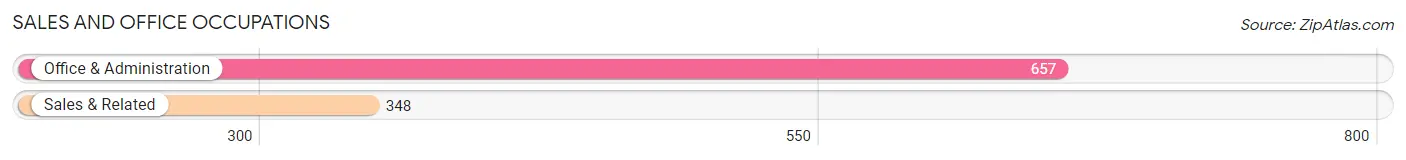
Sales and Office Occupations
The most common Sales and Office occupations in Dupont are Office & Administration (657 | 17.9%), and Sales & Related (348 | 9.5%).
Sales and Office Occupations by Sex
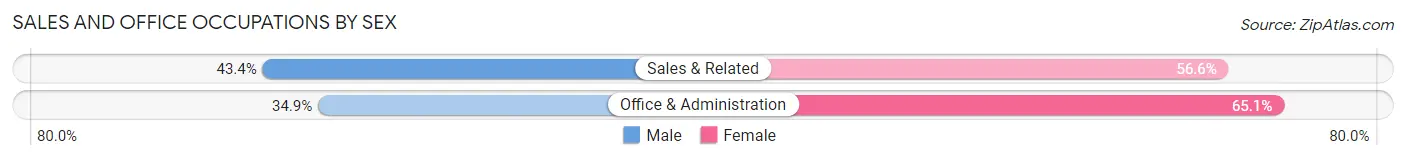
| Occupation | Male | Female |
| Sales & Related | 151 (43.4%) | 197 (56.6%) |
| Office & Administration | 229 (34.9%) | 428 (65.1%) |
| Total (Category) | 380 (37.8%) | 625 (62.2%) |
| Total (Overall) | 1,630 (44.5%) | 2,030 (55.5%) |
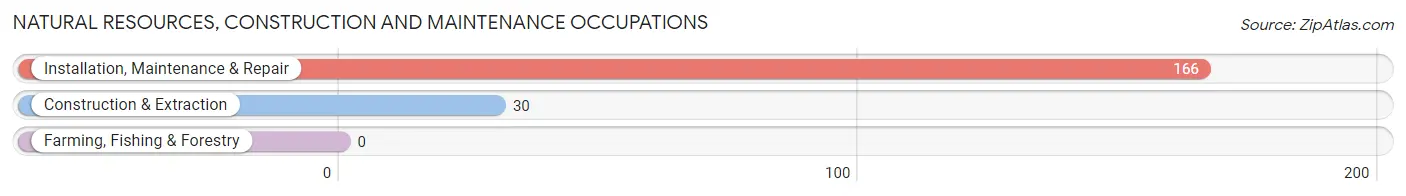
Natural Resources, Construction and Maintenance Occupations
The most common Natural Resources, Construction and Maintenance occupations in Dupont are Installation, Maintenance & Repair (166 | 4.5%), and Construction & Extraction (30 | 0.8%).
Natural Resources, Construction and Maintenance Occupations by Sex
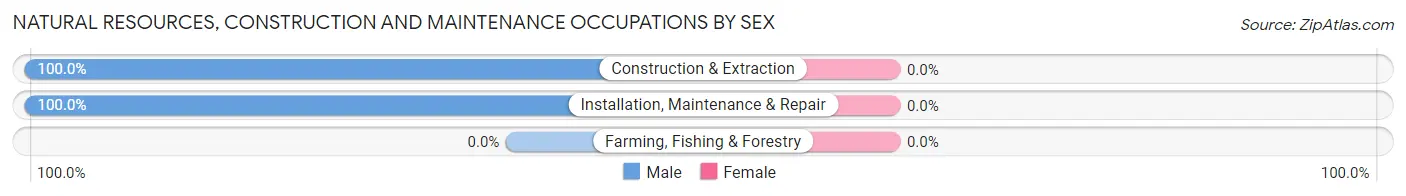
| Occupation | Male | Female |
| Farming, Fishing & Forestry | 0 (0.0%) | 0 (0.0%) |
| Construction & Extraction | 30 (100.0%) | 0 (0.0%) |
| Installation, Maintenance & Repair | 166 (100.0%) | 0 (0.0%) |
| Total (Category) | 196 (100.0%) | 0 (0.0%) |
| Total (Overall) | 1,630 (44.5%) | 2,030 (55.5%) |
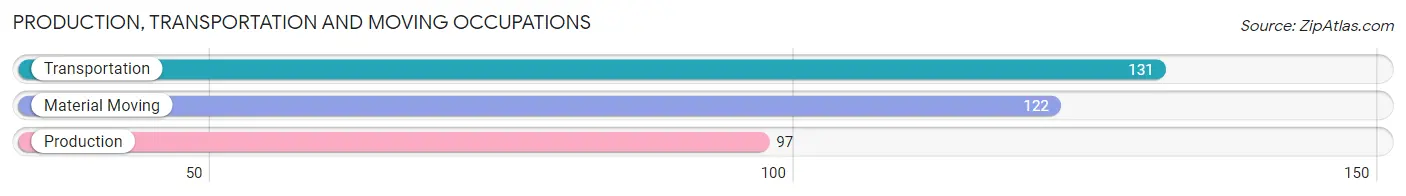
Production, Transportation and Moving Occupations
The most common Production, Transportation and Moving occupations in Dupont are Transportation (131 | 3.6%), Material Moving (122 | 3.3%), and Production (97 | 2.6%).
Production, Transportation and Moving Occupations by Sex
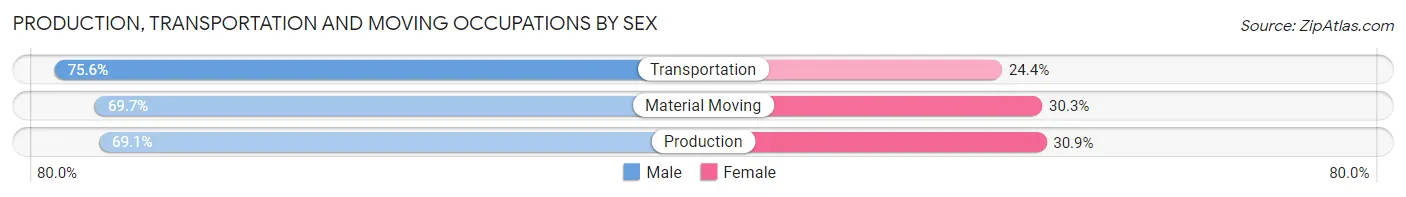
| Occupation | Male | Female |
| Production | 67 (69.1%) | 30 (30.9%) |
| Transportation | 99 (75.6%) | 32 (24.4%) |
| Material Moving | 85 (69.7%) | 37 (30.3%) |
| Total (Category) | 251 (71.7%) | 99 (28.3%) |
| Total (Overall) | 1,630 (44.5%) | 2,030 (55.5%) |
Employment Industries by Sex in Dupont
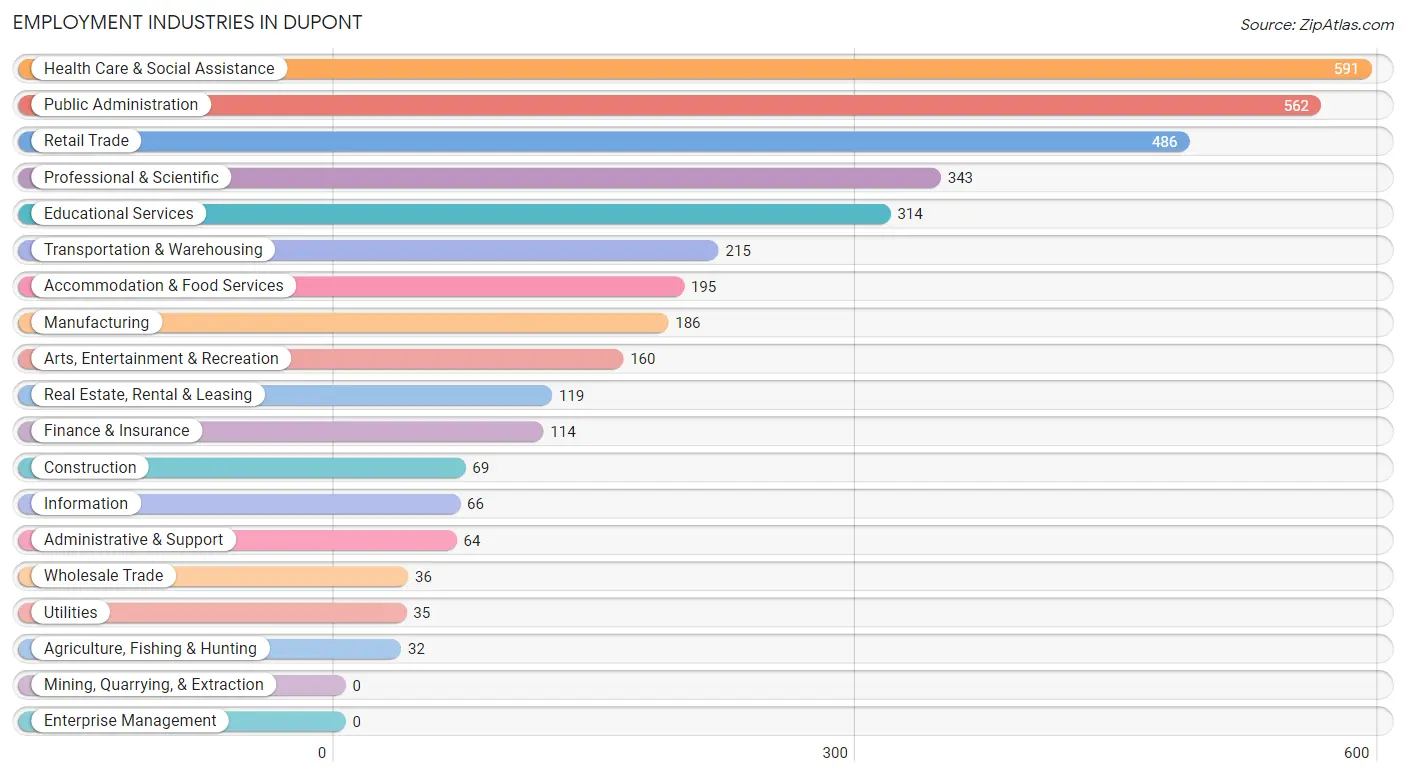
Employment Industries in Dupont
The major employment industries in Dupont include Health Care & Social Assistance (591 | 16.2%), Public Administration (562 | 15.4%), Retail Trade (486 | 13.3%), Professional & Scientific (343 | 9.4%), and Educational Services (314 | 8.6%).
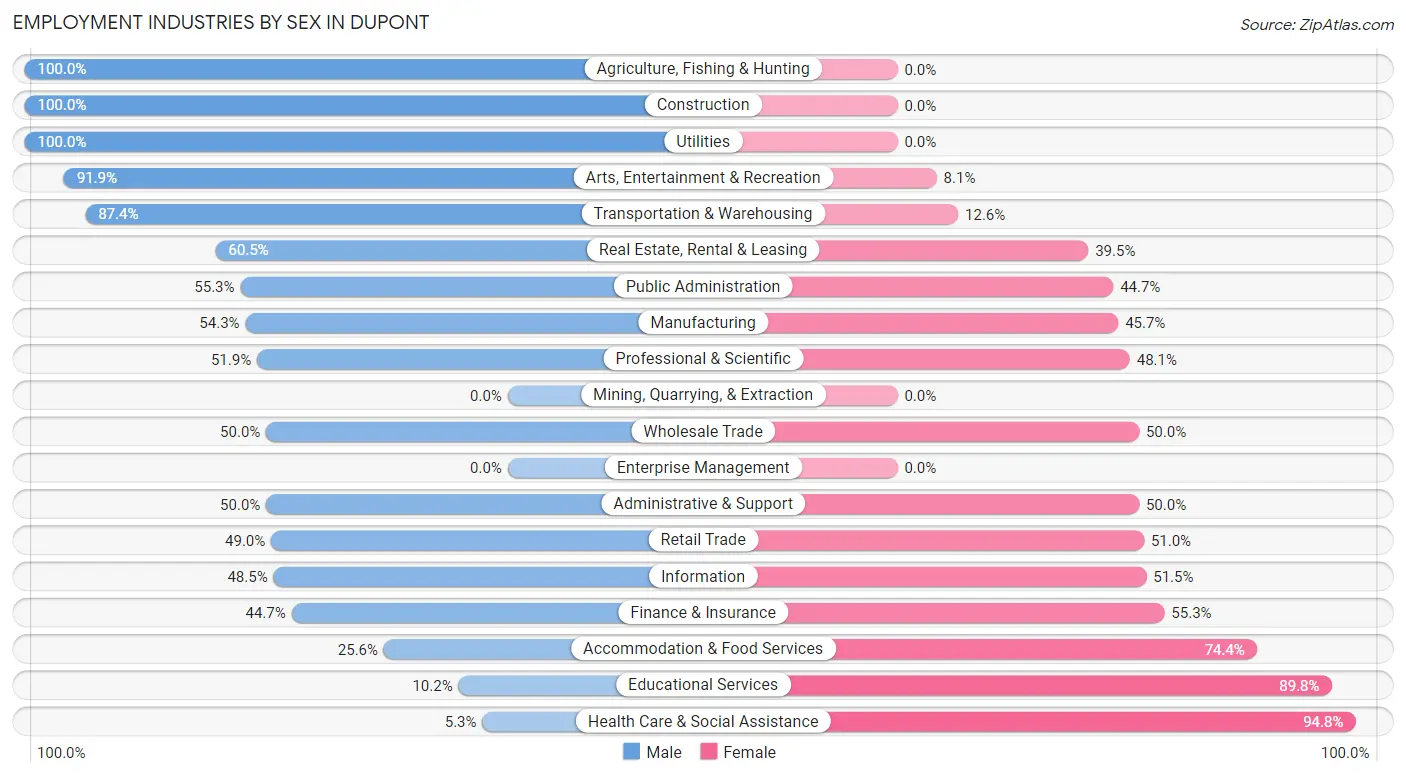
Employment Industries by Sex in Dupont
The Dupont industries that see more men than women are Agriculture, Fishing & Hunting (100.0%), Construction (100.0%), and Utilities (100.0%), whereas the industries that tend to have a higher number of women are Health Care & Social Assistance (94.8%), Educational Services (89.8%), and Accommodation & Food Services (74.4%).
| Industry | Male | Female |
| Agriculture, Fishing & Hunting | 32 (100.0%) | 0 (0.0%) |
| Mining, Quarrying, & Extraction | 0 (0.0%) | 0 (0.0%) |
| Construction | 69 (100.0%) | 0 (0.0%) |
| Manufacturing | 101 (54.3%) | 85 (45.7%) |
| Wholesale Trade | 18 (50.0%) | 18 (50.0%) |
| Retail Trade | 238 (49.0%) | 248 (51.0%) |
| Transportation & Warehousing | 188 (87.4%) | 27 (12.6%) |
| Utilities | 35 (100.0%) | 0 (0.0%) |
| Information | 32 (48.5%) | 34 (51.5%) |
| Finance & Insurance | 51 (44.7%) | 63 (55.3%) |
| Real Estate, Rental & Leasing | 72 (60.5%) | 47 (39.5%) |
| Professional & Scientific | 178 (51.9%) | 165 (48.1%) |
| Enterprise Management | 0 (0.0%) | 0 (0.0%) |
| Administrative & Support | 32 (50.0%) | 32 (50.0%) |
| Educational Services | 32 (10.2%) | 282 (89.8%) |
| Health Care & Social Assistance | 31 (5.2%) | 560 (94.8%) |
| Arts, Entertainment & Recreation | 147 (91.9%) | 13 (8.1%) |
| Accommodation & Food Services | 50 (25.6%) | 145 (74.4%) |
| Public Administration | 311 (55.3%) | 251 (44.7%) |
| Total | 1,630 (44.5%) | 2,030 (55.5%) |
Education in Dupont
School Enrollment in Dupont
The most common levels of schooling among the 3,093 students in Dupont are college / undergraduate (713 | 23.1%), elementary school (627 | 20.3%), and middle school (621 | 20.1%).
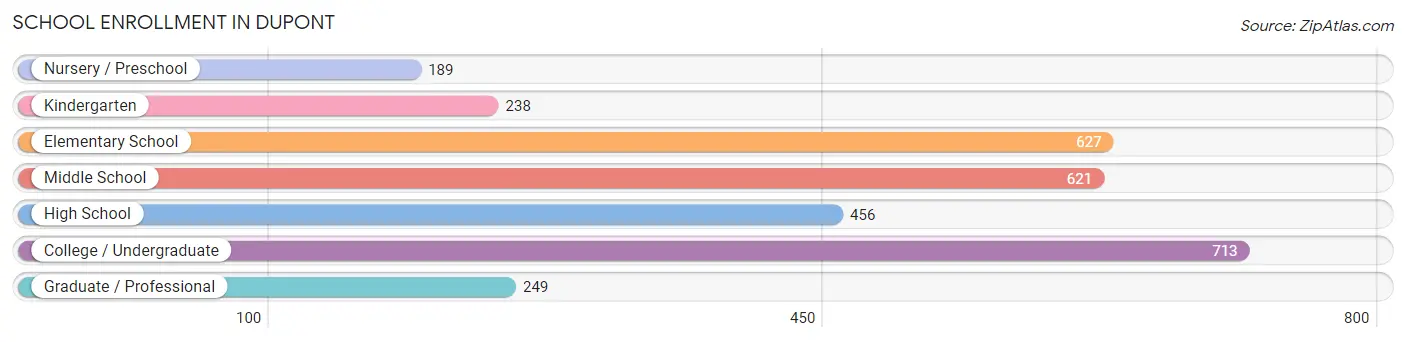
| School Level | # Students | % Students |
| Nursery / Preschool | 189 | 6.1% |
| Kindergarten | 238 | 7.7% |
| Elementary School | 627 | 20.3% |
| Middle School | 621 | 20.1% |
| High School | 456 | 14.7% |
| College / Undergraduate | 713 | 23.1% |
| Graduate / Professional | 249 | 8.1% |
| Total | 3,093 | 100.0% |
School Enrollment by Age by Funding Source in Dupont
Out of a total of 3,093 students who are enrolled in schools in Dupont, 554 (17.9%) attend a private institution, while the remaining 2,539 (82.1%) are enrolled in public schools. The age group of 3 to 4 year olds has the highest likelihood of being enrolled in private schools, with 81 (62.8% in the age bracket) enrolled. Conversely, the age group of 18 to 19 year olds has the lowest likelihood of being enrolled in a private school, with 151 (100.0% in the age bracket) attending a public institution.
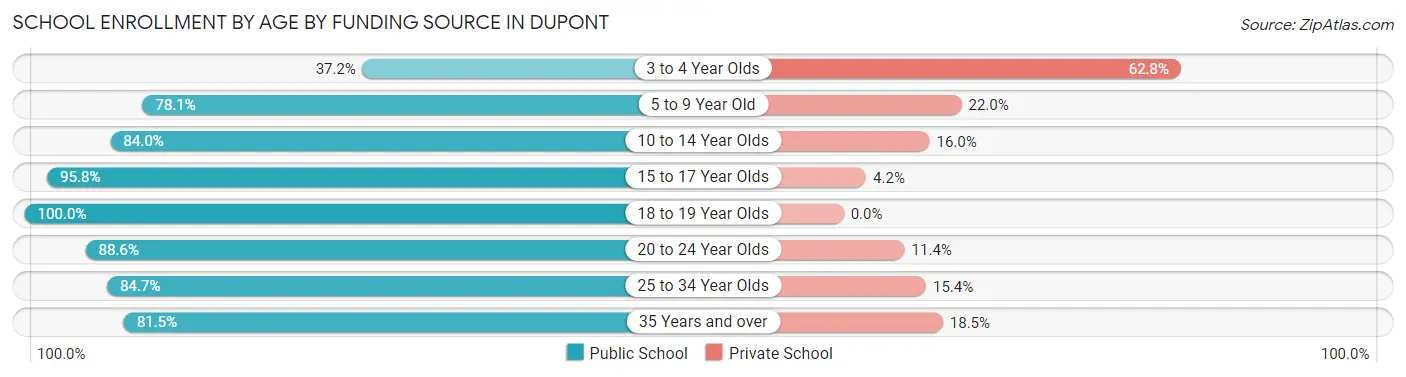
| Age Bracket | Public School | Private School |
| 3 to 4 Year Olds | 48 (37.2%) | 81 (62.8%) |
| 5 to 9 Year Old | 736 (78.0%) | 207 (22.0%) |
| 10 to 14 Year Olds | 599 (84.0%) | 114 (16.0%) |
| 15 to 17 Year Olds | 297 (95.8%) | 13 (4.2%) |
| 18 to 19 Year Olds | 151 (100.0%) | 0 (0.0%) |
| 20 to 24 Year Olds | 117 (88.6%) | 15 (11.4%) |
| 25 to 34 Year Olds | 193 (84.7%) | 35 (15.3%) |
| 35 Years and over | 397 (81.5%) | 90 (18.5%) |
| Total | 2,539 (82.1%) | 554 (17.9%) |
Educational Attainment by Field of Study in Dupont
Business (645 | 17.4%), arts & humanities (546 | 14.7%), engineering (378 | 10.2%), education (343 | 9.3%), and science & technology (342 | 9.2%) are the most common fields of study among 3,701 individuals in Dupont who have obtained a bachelor's degree or higher.
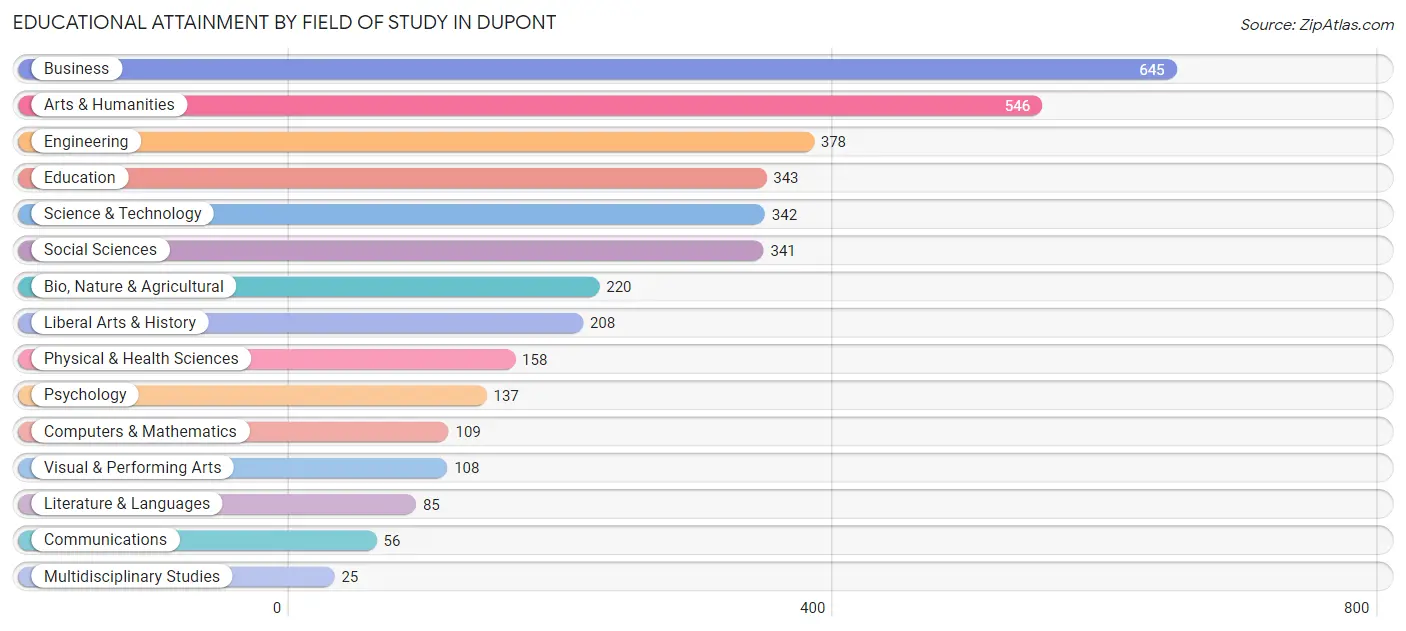
| Field of Study | # Graduates | % Graduates |
| Computers & Mathematics | 109 | 2.9% |
| Bio, Nature & Agricultural | 220 | 5.9% |
| Physical & Health Sciences | 158 | 4.3% |
| Psychology | 137 | 3.7% |
| Social Sciences | 341 | 9.2% |
| Engineering | 378 | 10.2% |
| Multidisciplinary Studies | 25 | 0.7% |
| Science & Technology | 342 | 9.2% |
| Business | 645 | 17.4% |
| Education | 343 | 9.3% |
| Literature & Languages | 85 | 2.3% |
| Liberal Arts & History | 208 | 5.6% |
| Visual & Performing Arts | 108 | 2.9% |
| Communications | 56 | 1.5% |
| Arts & Humanities | 546 | 14.7% |
| Total | 3,701 | 100.0% |
Transportation & Commute in Dupont
Vehicle Availability by Sex in Dupont
The most prevalent vehicle ownership categories in Dupont are males with 2 vehicles (1,299, accounting for 47.5%) and females with 2 vehicles (1,024, making up 59.8%).
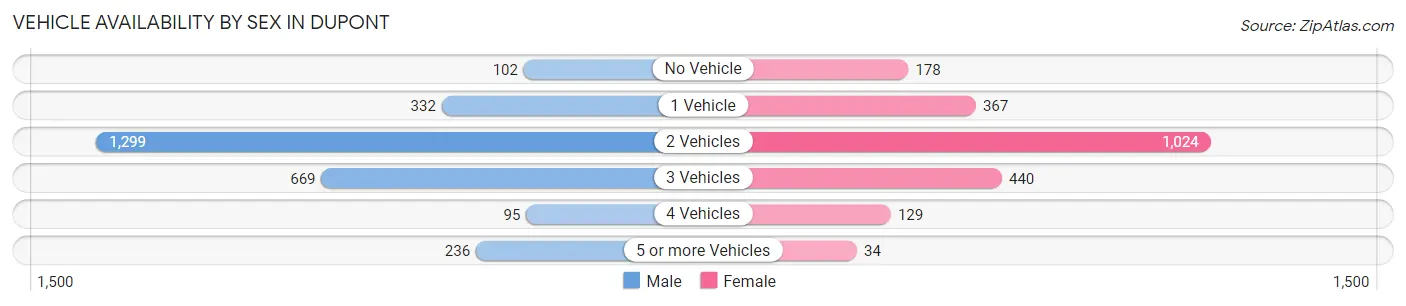
| Vehicles Available | Male | Female |
| No Vehicle | 102 (3.7%) | 178 (8.2%) |
| 1 Vehicle | 332 (12.1%) | 367 (16.9%) |
| 2 Vehicles | 1,299 (47.5%) | 1,024 (47.1%) |
| 3 Vehicles | 669 (24.5%) | 440 (20.3%) |
| 4 Vehicles | 95 (3.5%) | 129 (5.9%) |
| 5 or more Vehicles | 236 (8.6%) | 34 (1.6%) |
| Total | 2,733 (100.0%) | 2,172 (100.0%) |
Commute Time in Dupont
The most frequently occuring commute durations in Dupont are 20 to 24 minutes (1,058 commuters, 23.1%), 15 to 19 minutes (1,043 commuters, 22.7%), and 10 to 14 minutes (609 commuters, 13.3%).
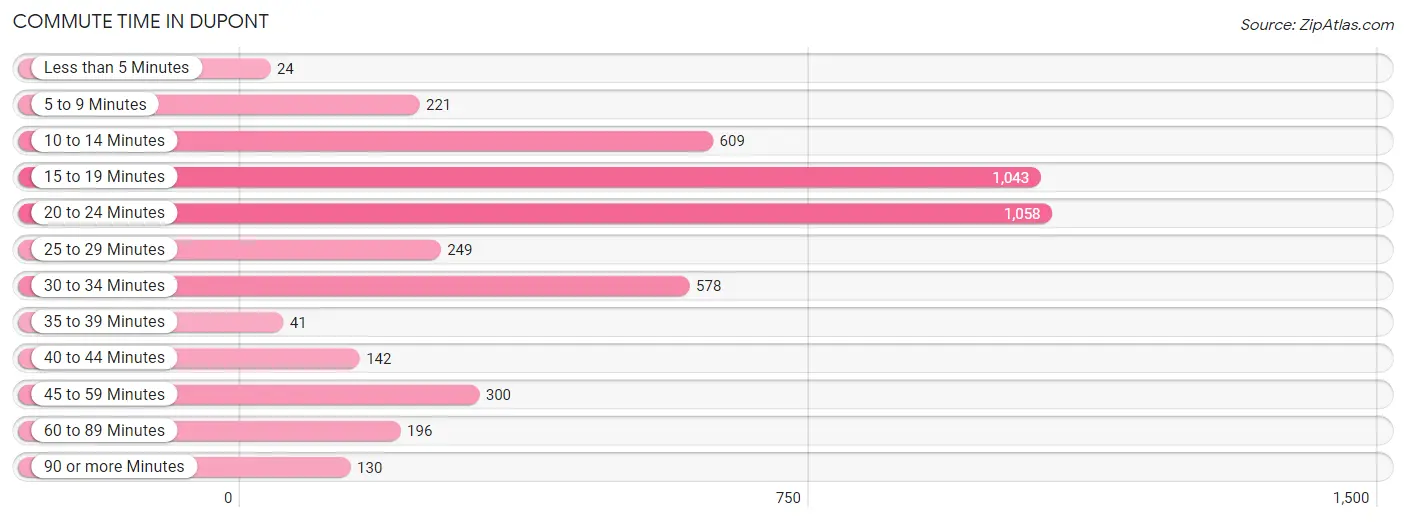
| Commute Time | # Commuters | % Commuters |
| Less than 5 Minutes | 24 | 0.5% |
| 5 to 9 Minutes | 221 | 4.8% |
| 10 to 14 Minutes | 609 | 13.3% |
| 15 to 19 Minutes | 1,043 | 22.7% |
| 20 to 24 Minutes | 1,058 | 23.1% |
| 25 to 29 Minutes | 249 | 5.4% |
| 30 to 34 Minutes | 578 | 12.6% |
| 35 to 39 Minutes | 41 | 0.9% |
| 40 to 44 Minutes | 142 | 3.1% |
| 45 to 59 Minutes | 300 | 6.5% |
| 60 to 89 Minutes | 196 | 4.3% |
| 90 or more Minutes | 130 | 2.8% |
Commute Time by Sex in Dupont
The most common commute times in Dupont are 20 to 24 minutes (700 commuters, 27.8%) for males and 15 to 19 minutes (389 commuters, 18.8%) for females.
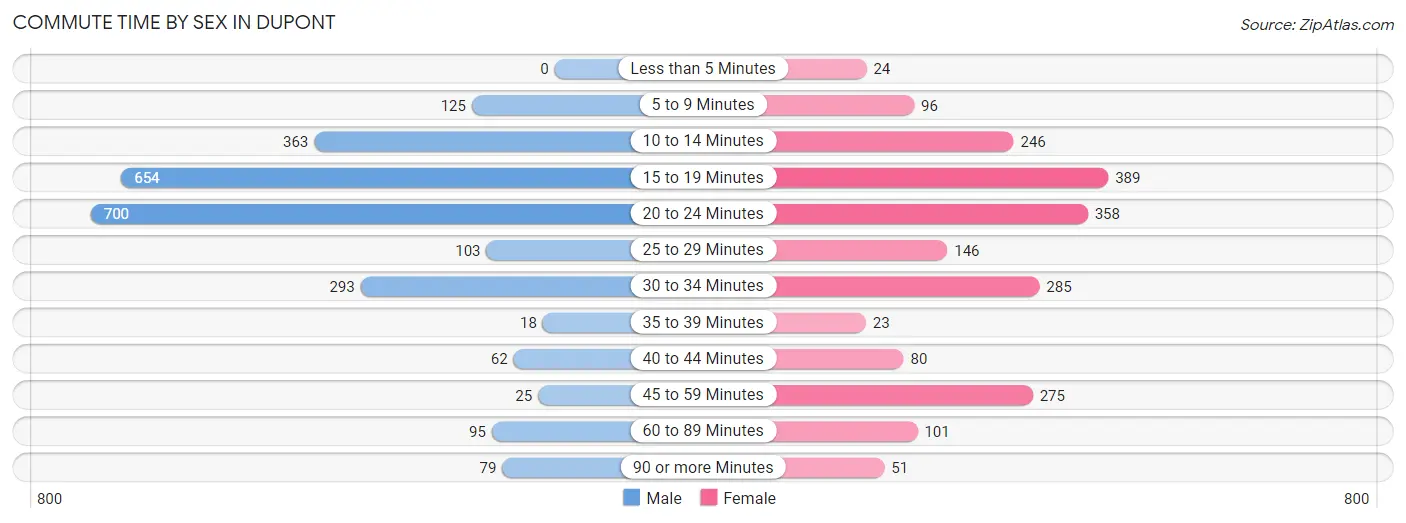
| Commute Time | Male | Female |
| Less than 5 Minutes | 0 (0.0%) | 24 (1.2%) |
| 5 to 9 Minutes | 125 (5.0%) | 96 (4.6%) |
| 10 to 14 Minutes | 363 (14.4%) | 246 (11.9%) |
| 15 to 19 Minutes | 654 (26.0%) | 389 (18.8%) |
| 20 to 24 Minutes | 700 (27.8%) | 358 (17.3%) |
| 25 to 29 Minutes | 103 (4.1%) | 146 (7.0%) |
| 30 to 34 Minutes | 293 (11.6%) | 285 (13.7%) |
| 35 to 39 Minutes | 18 (0.7%) | 23 (1.1%) |
| 40 to 44 Minutes | 62 (2.5%) | 80 (3.9%) |
| 45 to 59 Minutes | 25 (1.0%) | 275 (13.3%) |
| 60 to 89 Minutes | 95 (3.8%) | 101 (4.9%) |
| 90 or more Minutes | 79 (3.1%) | 51 (2.5%) |
Time of Departure to Work by Sex in Dupont
The most frequent times of departure to work in Dupont are 6:00 AM to 6:29 AM (506, 20.1%) for males and 7:00 AM to 7:29 AM (451, 21.7%) for females.
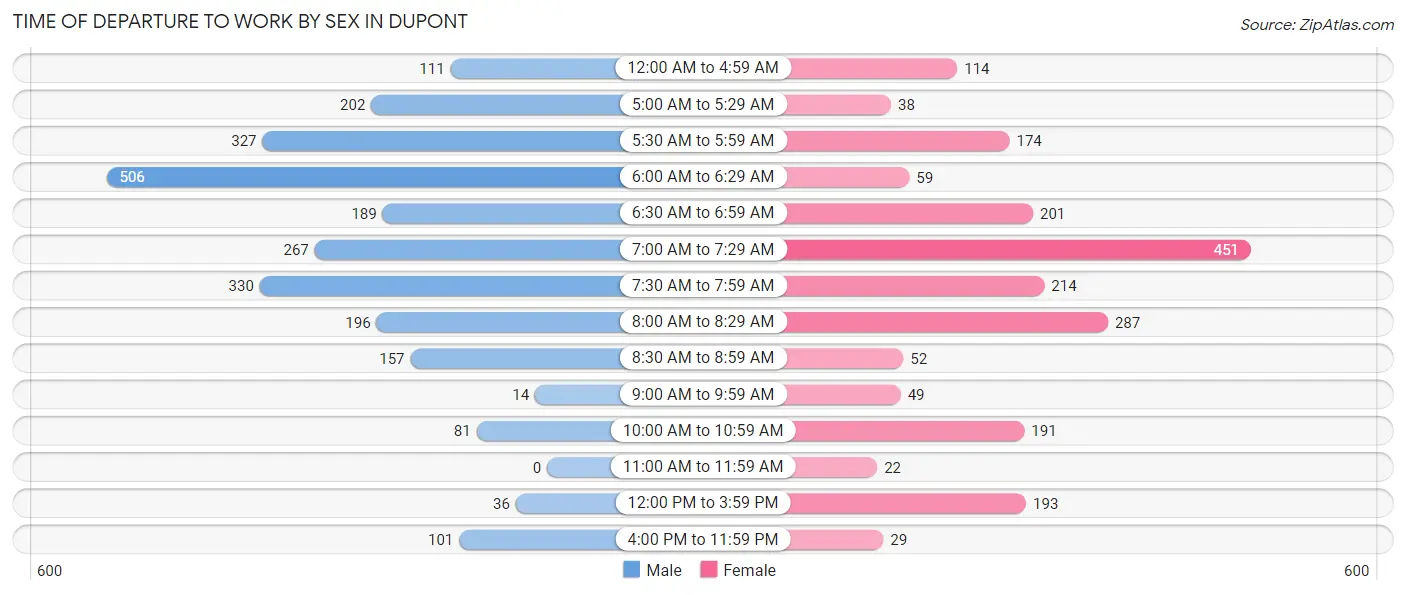
| Time of Departure | Male | Female |
| 12:00 AM to 4:59 AM | 111 (4.4%) | 114 (5.5%) |
| 5:00 AM to 5:29 AM | 202 (8.0%) | 38 (1.8%) |
| 5:30 AM to 5:59 AM | 327 (13.0%) | 174 (8.4%) |
| 6:00 AM to 6:29 AM | 506 (20.1%) | 59 (2.8%) |
| 6:30 AM to 6:59 AM | 189 (7.5%) | 201 (9.7%) |
| 7:00 AM to 7:29 AM | 267 (10.6%) | 451 (21.7%) |
| 7:30 AM to 7:59 AM | 330 (13.1%) | 214 (10.3%) |
| 8:00 AM to 8:29 AM | 196 (7.8%) | 287 (13.8%) |
| 8:30 AM to 8:59 AM | 157 (6.2%) | 52 (2.5%) |
| 9:00 AM to 9:59 AM | 14 (0.6%) | 49 (2.4%) |
| 10:00 AM to 10:59 AM | 81 (3.2%) | 191 (9.2%) |
| 11:00 AM to 11:59 AM | 0 (0.0%) | 22 (1.1%) |
| 12:00 PM to 3:59 PM | 36 (1.4%) | 193 (9.3%) |
| 4:00 PM to 11:59 PM | 101 (4.0%) | 29 (1.4%) |
| Total | 2,517 (100.0%) | 2,074 (100.0%) |
Housing Occupancy in Dupont
Occupancy by Ownership in Dupont
Of the total 4,006 dwellings in Dupont, owner-occupied units account for 2,297 (57.3%), while renter-occupied units make up 1,709 (42.7%).
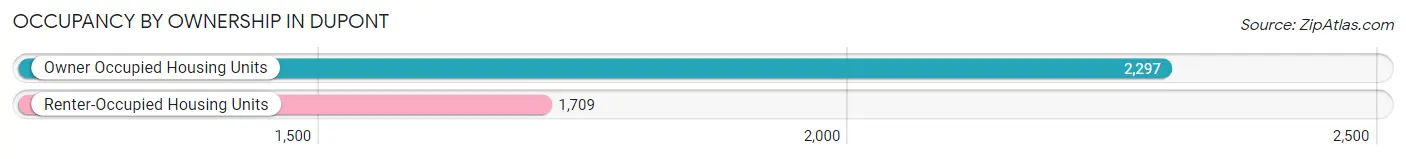
| Occupancy | # Housing Units | % Housing Units |
| Owner Occupied Housing Units | 2,297 | 57.3% |
| Renter-Occupied Housing Units | 1,709 | 42.7% |
| Total Occupied Housing Units | 4,006 | 100.0% |
Occupancy by Household Size in Dupont
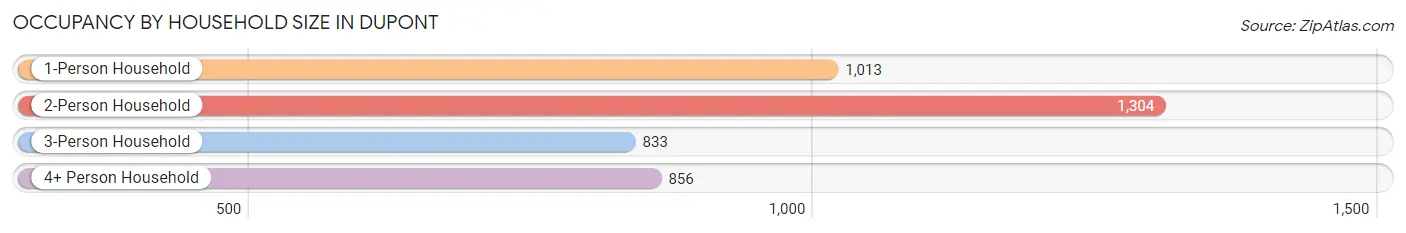
| Household Size | # Housing Units | % Housing Units |
| 1-Person Household | 1,013 | 25.3% |
| 2-Person Household | 1,304 | 32.6% |
| 3-Person Household | 833 | 20.8% |
| 4+ Person Household | 856 | 21.4% |
| Total Housing Units | 4,006 | 100.0% |
Occupancy by Ownership by Household Size in Dupont
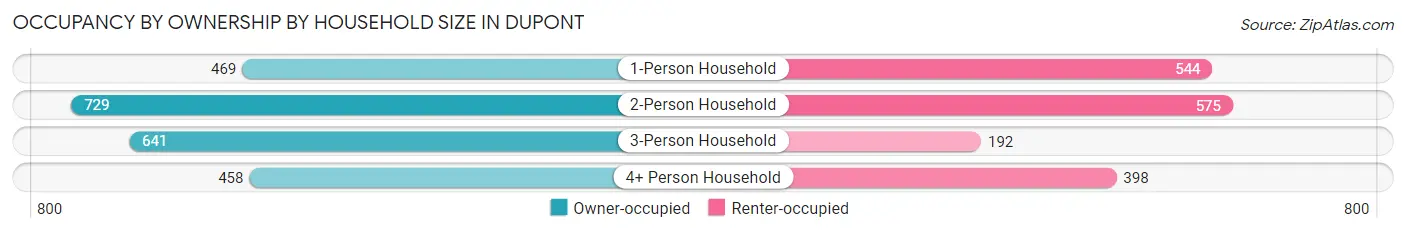
| Household Size | Owner-occupied | Renter-occupied |
| 1-Person Household | 469 (46.3%) | 544 (53.7%) |
| 2-Person Household | 729 (55.9%) | 575 (44.1%) |
| 3-Person Household | 641 (76.9%) | 192 (23.1%) |
| 4+ Person Household | 458 (53.5%) | 398 (46.5%) |
| Total Housing Units | 2,297 (57.3%) | 1,709 (42.7%) |
Occupancy by Educational Attainment in Dupont
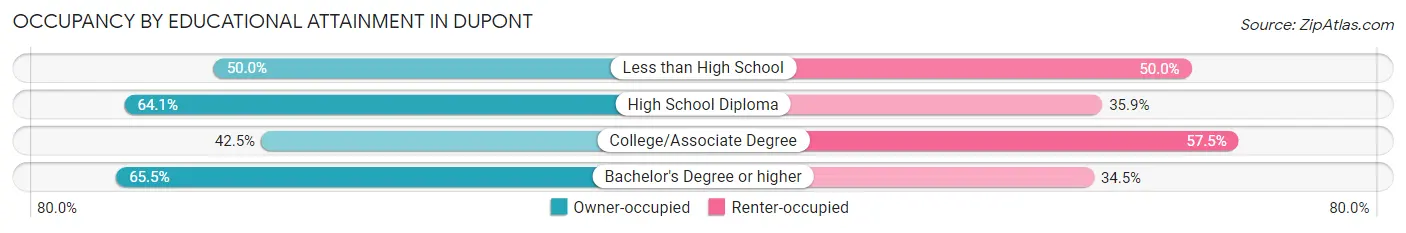
| Household Size | Owner-occupied | Renter-occupied |
| Less than High School | 32 (50.0%) | 32 (50.0%) |
| High School Diploma | 127 (64.1%) | 71 (35.9%) |
| College/Associate Degree | 580 (42.5%) | 784 (57.5%) |
| Bachelor's Degree or higher | 1,558 (65.5%) | 822 (34.5%) |
Occupancy by Age of Householder in Dupont
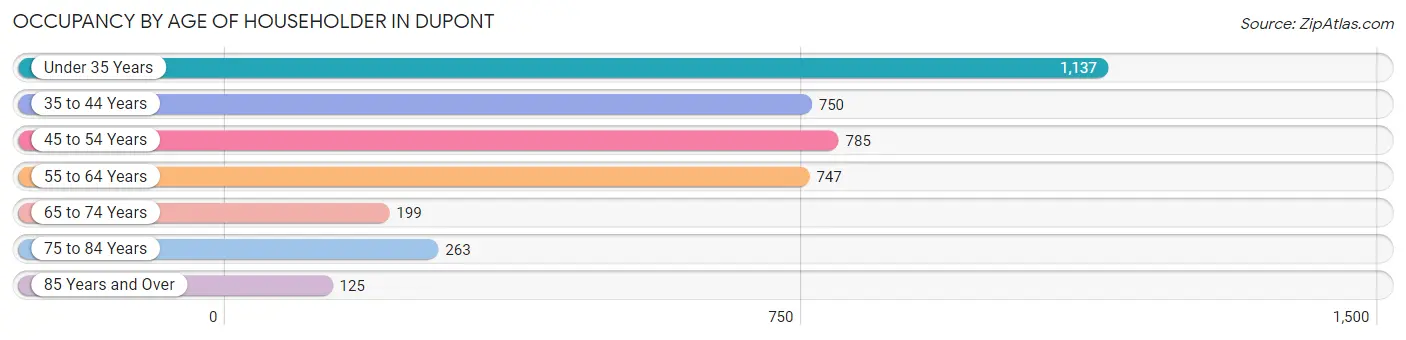
| Age Bracket | # Households | % Households |
| Under 35 Years | 1,137 | 28.4% |
| 35 to 44 Years | 750 | 18.7% |
| 45 to 54 Years | 785 | 19.6% |
| 55 to 64 Years | 747 | 18.6% |
| 65 to 74 Years | 199 | 5.0% |
| 75 to 84 Years | 263 | 6.6% |
| 85 Years and Over | 125 | 3.1% |
| Total | 4,006 | 100.0% |
Housing Finances in Dupont
Median Income by Occupancy in Dupont
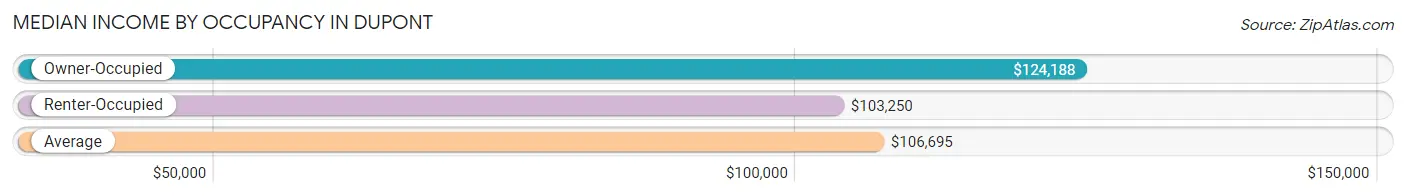
| Occupancy Type | # Households | Median Income |
| Owner-Occupied | 2,297 (57.3%) | $124,188 |
| Renter-Occupied | 1,709 (42.7%) | $103,250 |
| Average | 4,006 (100.0%) | $106,695 |
Occupancy by Householder Income Bracket in Dupont
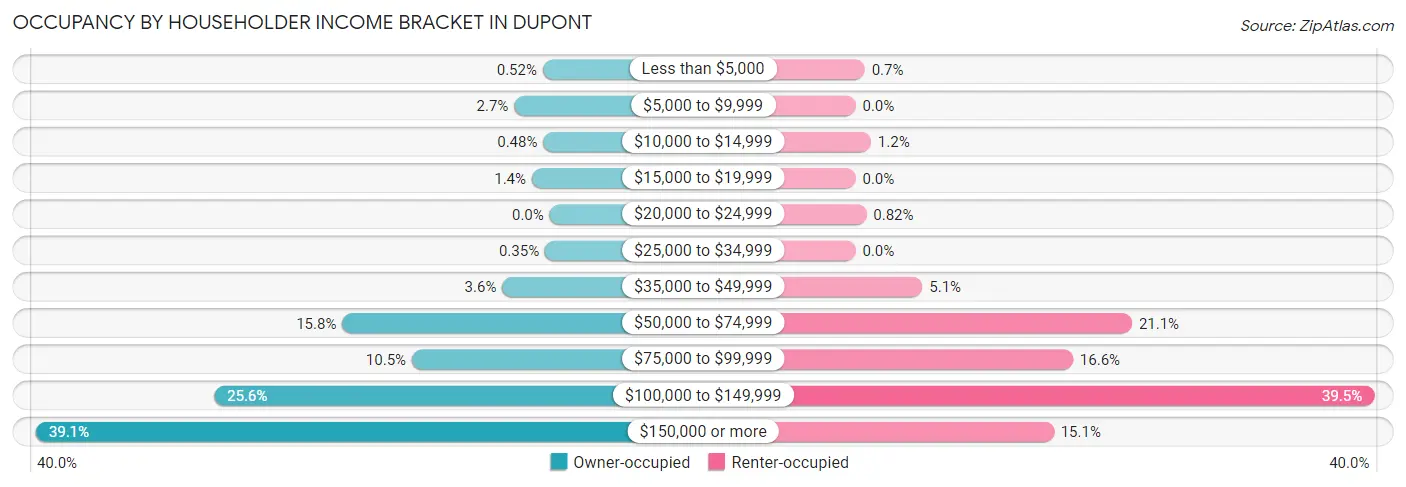
| Income Bracket | Owner-occupied | Renter-occupied |
| Less than $5,000 | 12 (0.5%) | 12 (0.7%) |
| $5,000 to $9,999 | 62 (2.7%) | 0 (0.0%) |
| $10,000 to $14,999 | 11 (0.5%) | 20 (1.2%) |
| $15,000 to $19,999 | 31 (1.3%) | 0 (0.0%) |
| $20,000 to $24,999 | 0 (0.0%) | 14 (0.8%) |
| $25,000 to $34,999 | 8 (0.4%) | 0 (0.0%) |
| $35,000 to $49,999 | 83 (3.6%) | 87 (5.1%) |
| $50,000 to $74,999 | 363 (15.8%) | 360 (21.1%) |
| $75,000 to $99,999 | 241 (10.5%) | 283 (16.6%) |
| $100,000 to $149,999 | 587 (25.6%) | 675 (39.5%) |
| $150,000 or more | 899 (39.1%) | 258 (15.1%) |
| Total | 2,297 (100.0%) | 1,709 (100.0%) |
Monthly Housing Cost Tiers in Dupont
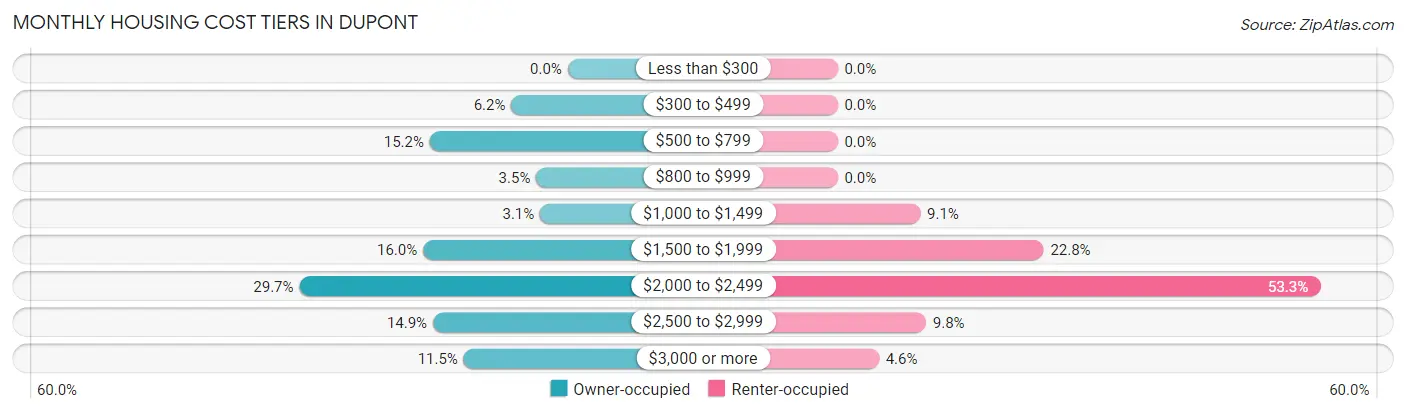
| Monthly Cost | Owner-occupied | Renter-occupied |
| Less than $300 | 0 (0.0%) | 0 (0.0%) |
| $300 to $499 | 143 (6.2%) | 0 (0.0%) |
| $500 to $799 | 350 (15.2%) | 0 (0.0%) |
| $800 to $999 | 80 (3.5%) | 0 (0.0%) |
| $1,000 to $1,499 | 70 (3.0%) | 156 (9.1%) |
| $1,500 to $1,999 | 367 (16.0%) | 389 (22.8%) |
| $2,000 to $2,499 | 681 (29.6%) | 911 (53.3%) |
| $2,500 to $2,999 | 342 (14.9%) | 167 (9.8%) |
| $3,000 or more | 264 (11.5%) | 78 (4.6%) |
| Total | 2,297 (100.0%) | 1,709 (100.0%) |
Physical Housing Characteristics in Dupont
Housing Structures in Dupont
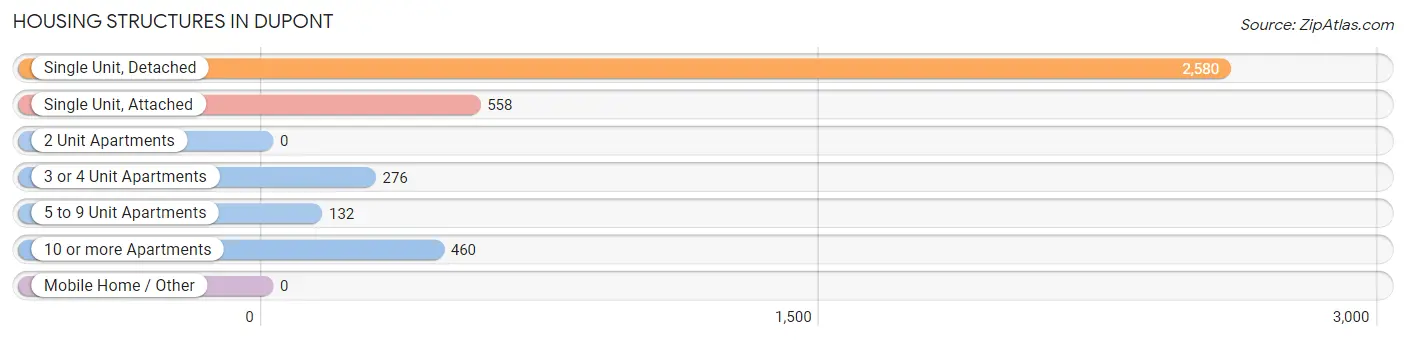
| Structure Type | # Housing Units | % Housing Units |
| Single Unit, Detached | 2,580 | 64.4% |
| Single Unit, Attached | 558 | 13.9% |
| 2 Unit Apartments | 0 | 0.0% |
| 3 or 4 Unit Apartments | 276 | 6.9% |
| 5 to 9 Unit Apartments | 132 | 3.3% |
| 10 or more Apartments | 460 | 11.5% |
| Mobile Home / Other | 0 | 0.0% |
| Total | 4,006 | 100.0% |
Housing Structures by Occupancy in Dupont
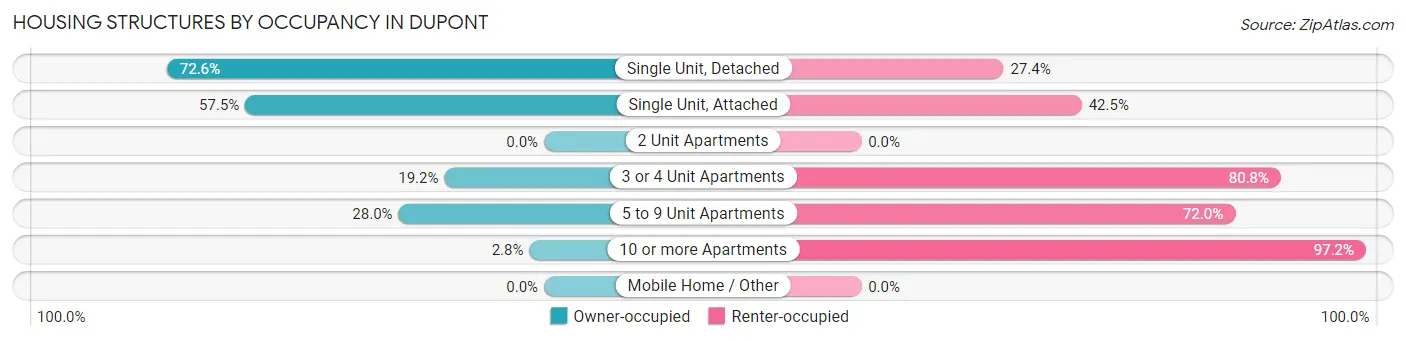
| Structure Type | Owner-occupied | Renter-occupied |
| Single Unit, Detached | 1,873 (72.6%) | 707 (27.4%) |
| Single Unit, Attached | 321 (57.5%) | 237 (42.5%) |
| 2 Unit Apartments | 0 (0.0%) | 0 (0.0%) |
| 3 or 4 Unit Apartments | 53 (19.2%) | 223 (80.8%) |
| 5 to 9 Unit Apartments | 37 (28.0%) | 95 (72.0%) |
| 10 or more Apartments | 13 (2.8%) | 447 (97.2%) |
| Mobile Home / Other | 0 (0.0%) | 0 (0.0%) |
| Total | 2,297 (57.3%) | 1,709 (42.7%) |
Housing Structures by Number of Rooms in Dupont
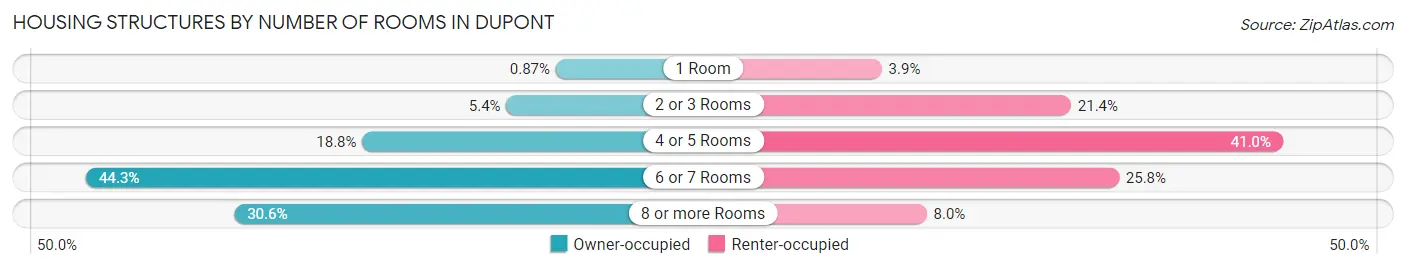
| Number of Rooms | Owner-occupied | Renter-occupied |
| 1 Room | 20 (0.9%) | 66 (3.9%) |
| 2 or 3 Rooms | 125 (5.4%) | 365 (21.4%) |
| 4 or 5 Rooms | 431 (18.8%) | 700 (41.0%) |
| 6 or 7 Rooms | 1,018 (44.3%) | 441 (25.8%) |
| 8 or more Rooms | 703 (30.6%) | 137 (8.0%) |
| Total | 2,297 (100.0%) | 1,709 (100.0%) |
Housing Structure by Heating Type in Dupont
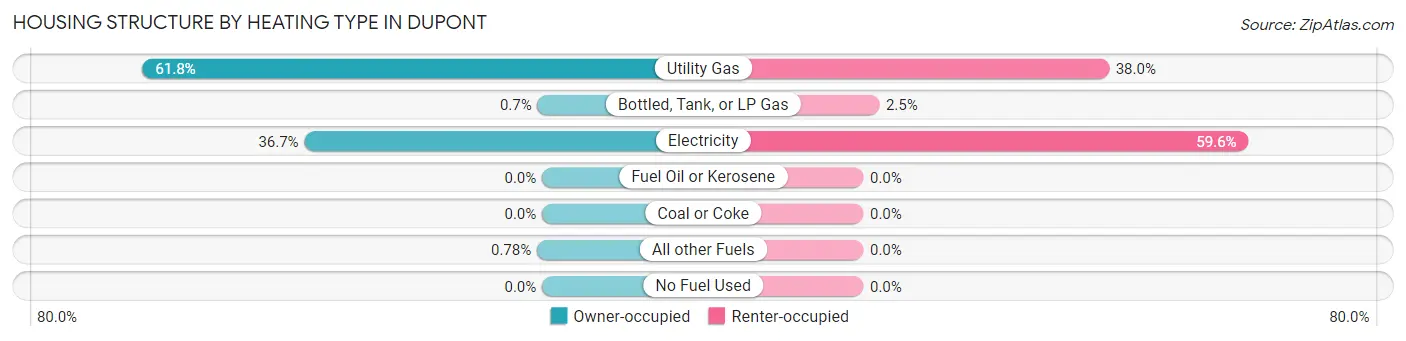
| Heating Type | Owner-occupied | Renter-occupied |
| Utility Gas | 1,419 (61.8%) | 649 (38.0%) |
| Bottled, Tank, or LP Gas | 16 (0.7%) | 42 (2.5%) |
| Electricity | 844 (36.7%) | 1,018 (59.6%) |
| Fuel Oil or Kerosene | 0 (0.0%) | 0 (0.0%) |
| Coal or Coke | 0 (0.0%) | 0 (0.0%) |
| All other Fuels | 18 (0.8%) | 0 (0.0%) |
| No Fuel Used | 0 (0.0%) | 0 (0.0%) |
| Total | 2,297 (100.0%) | 1,709 (100.0%) |
Household Vehicle Usage in Dupont
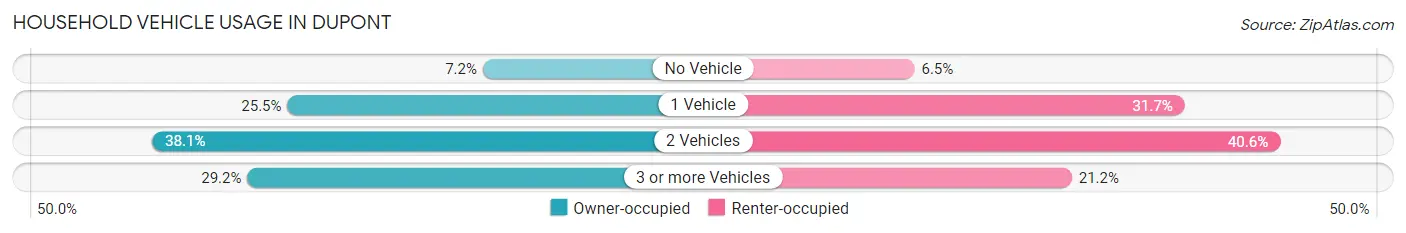
| Vehicles per Household | Owner-occupied | Renter-occupied |
| No Vehicle | 166 (7.2%) | 111 (6.5%) |
| 1 Vehicle | 585 (25.5%) | 542 (31.7%) |
| 2 Vehicles | 875 (38.1%) | 694 (40.6%) |
| 3 or more Vehicles | 671 (29.2%) | 362 (21.2%) |
| Total | 2,297 (100.0%) | 1,709 (100.0%) |
Real Estate & Mortgages in Dupont
Real Estate and Mortgage Overview in Dupont
| Characteristic | Without Mortgage | With Mortgage |
| Housing Units | 520 | 1,777 |
| Median Property Value | $460,600 | $473,100 |
| Median Household Income | $85,083 | $775 |
| Monthly Housing Costs | $587 | $264 |
| Real Estate Taxes | $3,623 | $77 |
Property Value by Mortgage Status in Dupont
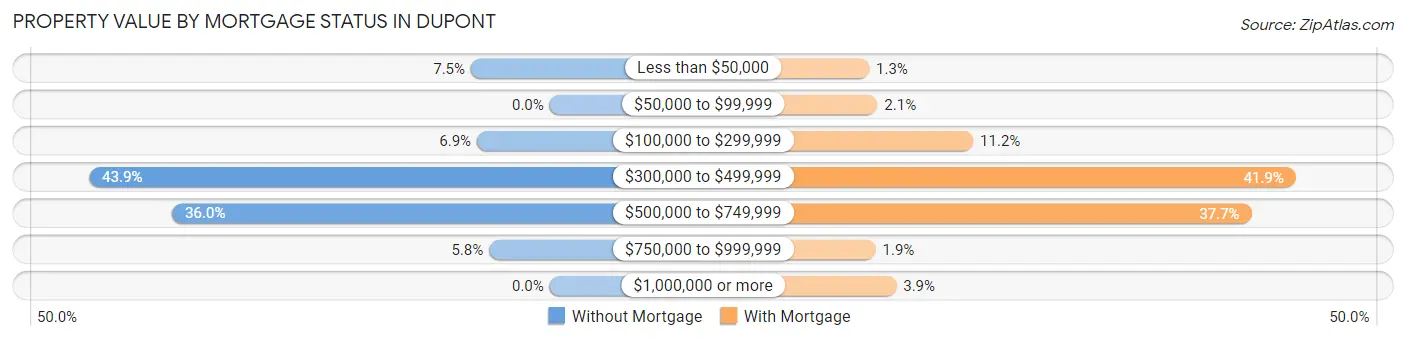
| Property Value | Without Mortgage | With Mortgage |
| Less than $50,000 | 39 (7.5%) | 23 (1.3%) |
| $50,000 to $99,999 | 0 (0.0%) | 37 (2.1%) |
| $100,000 to $299,999 | 36 (6.9%) | 199 (11.2%) |
| $300,000 to $499,999 | 228 (43.9%) | 745 (41.9%) |
| $500,000 to $749,999 | 187 (36.0%) | 670 (37.7%) |
| $750,000 to $999,999 | 30 (5.8%) | 34 (1.9%) |
| $1,000,000 or more | 0 (0.0%) | 69 (3.9%) |
| Total | 520 (100.0%) | 1,777 (100.0%) |
Household Income by Mortgage Status in Dupont
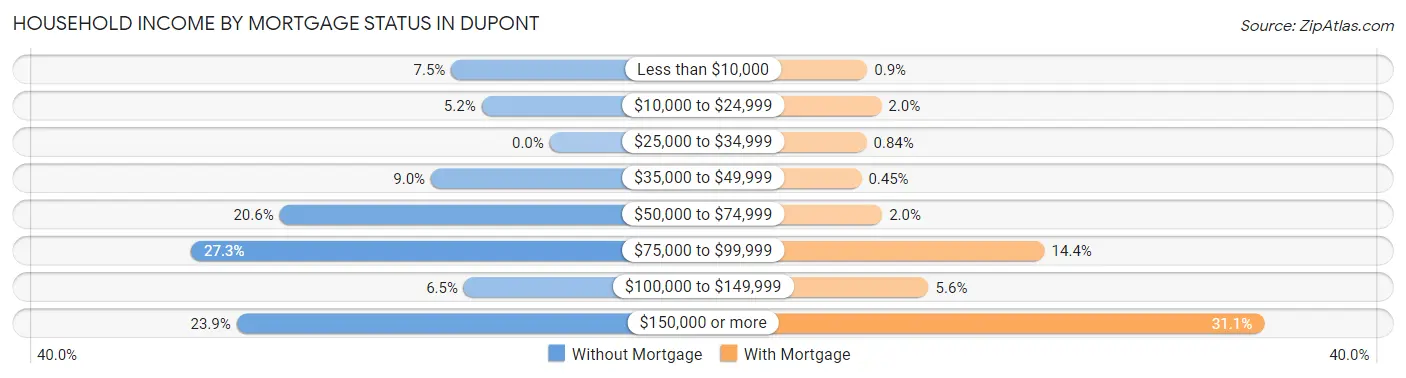
| Household Income | Without Mortgage | With Mortgage |
| Less than $10,000 | 39 (7.5%) | 16 (0.9%) |
| $10,000 to $24,999 | 27 (5.2%) | 35 (2.0%) |
| $25,000 to $34,999 | 0 (0.0%) | 15 (0.8%) |
| $35,000 to $49,999 | 47 (9.0%) | 8 (0.4%) |
| $50,000 to $74,999 | 107 (20.6%) | 36 (2.0%) |
| $75,000 to $99,999 | 142 (27.3%) | 256 (14.4%) |
| $100,000 to $149,999 | 34 (6.5%) | 99 (5.6%) |
| $150,000 or more | 124 (23.8%) | 553 (31.1%) |
| Total | 520 (100.0%) | 1,777 (100.0%) |
Property Value to Household Income Ratio in Dupont
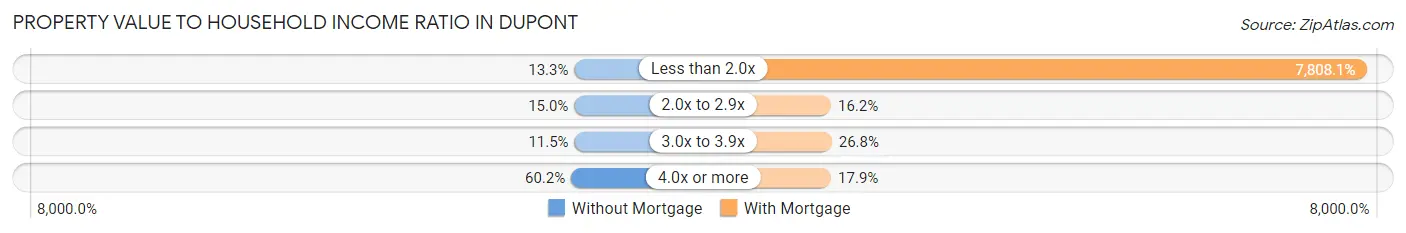
| Value-to-Income Ratio | Without Mortgage | With Mortgage |
| Less than 2.0x | 69 (13.3%) | 138,750 (7,808.1%) |
| 2.0x to 2.9x | 78 (15.0%) | 287 (16.2%) |
| 3.0x to 3.9x | 60 (11.5%) | 476 (26.8%) |
| 4.0x or more | 313 (60.2%) | 318 (17.9%) |
| Total | 520 (100.0%) | 1,777 (100.0%) |
Real Estate Taxes by Mortgage Status in Dupont
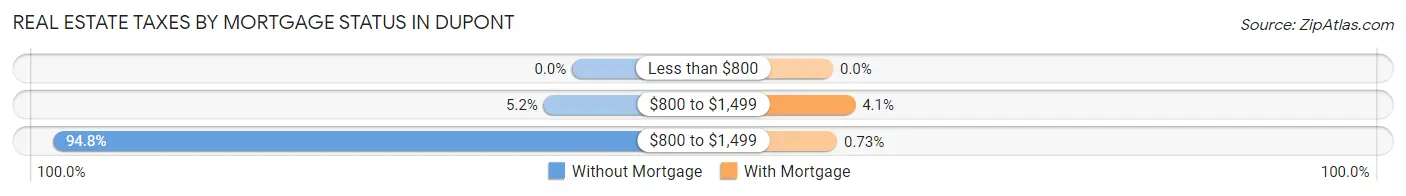
| Property Taxes | Without Mortgage | With Mortgage |
| Less than $800 | 0 (0.0%) | 0 (0.0%) |
| $800 to $1,499 | 27 (5.2%) | 72 (4.1%) |
| $800 to $1,499 | 493 (94.8%) | 13 (0.7%) |
| Total | 520 (100.0%) | 1,777 (100.0%) |
Health & Disability in Dupont
Health Insurance Coverage by Age in Dupont
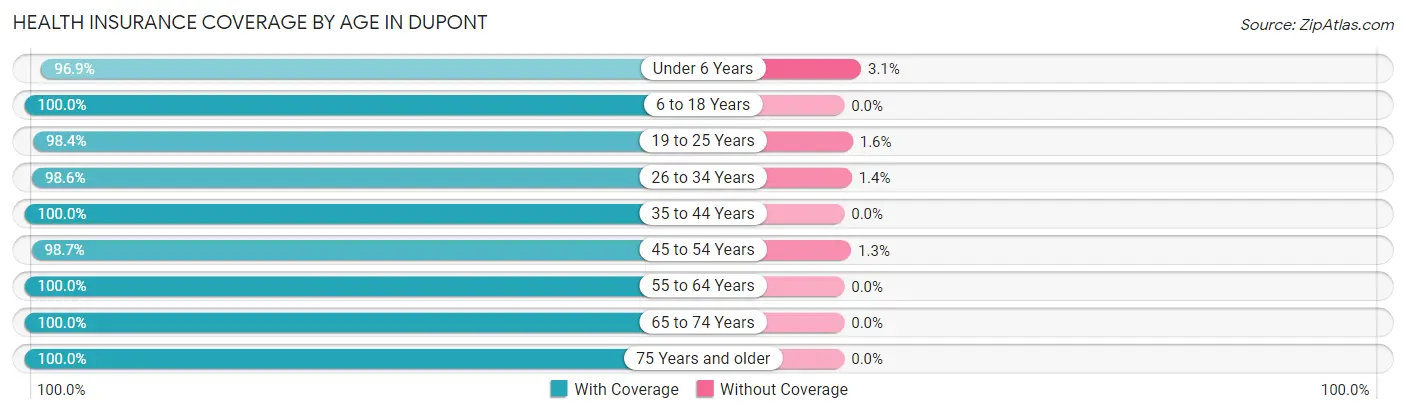
| Age Bracket | With Coverage | Without Coverage |
| Under 6 Years | 713 (96.9%) | 23 (3.1%) |
| 6 to 18 Years | 1,981 (100.0%) | 0 (0.0%) |
| 19 to 25 Years | 684 (98.4%) | 11 (1.6%) |
| 26 to 34 Years | 853 (98.6%) | 12 (1.4%) |
| 35 to 44 Years | 1,015 (100.0%) | 0 (0.0%) |
| 45 to 54 Years | 1,153 (98.7%) | 15 (1.3%) |
| 55 to 64 Years | 1,100 (100.0%) | 0 (0.0%) |
| 65 to 74 Years | 414 (100.0%) | 0 (0.0%) |
| 75 Years and older | 548 (100.0%) | 0 (0.0%) |
| Total | 8,461 (99.3%) | 61 (0.7%) |
Health Insurance Coverage by Citizenship Status in Dupont
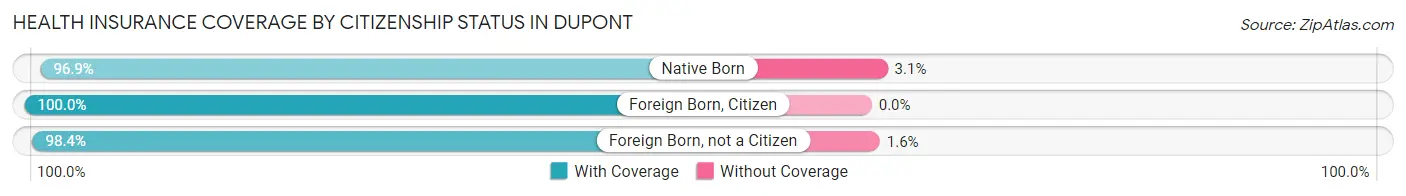
| Citizenship Status | With Coverage | Without Coverage |
| Native Born | 713 (96.9%) | 23 (3.1%) |
| Foreign Born, Citizen | 1,981 (100.0%) | 0 (0.0%) |
| Foreign Born, not a Citizen | 684 (98.4%) | 11 (1.6%) |
Health Insurance Coverage by Household Income in Dupont
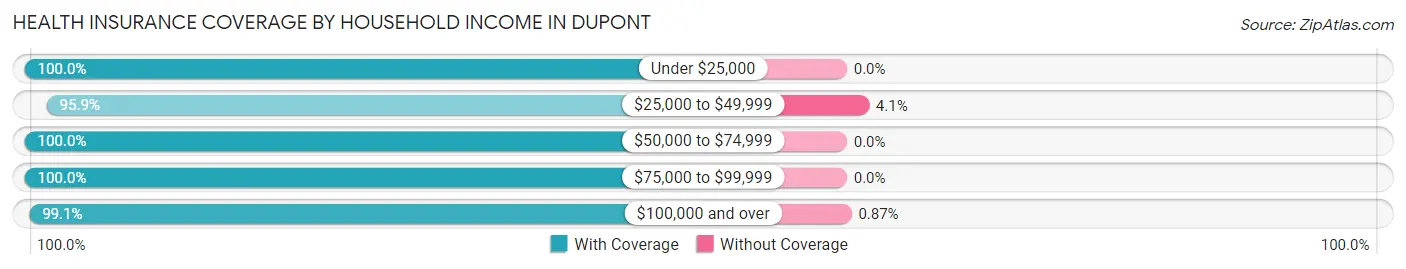
| Household Income | With Coverage | Without Coverage |
| Under $25,000 | 343 (100.0%) | 0 (0.0%) |
| $25,000 to $49,999 | 347 (95.9%) | 15 (4.1%) |
| $50,000 to $74,999 | 1,481 (100.0%) | 0 (0.0%) |
| $75,000 to $99,999 | 1,067 (100.0%) | 0 (0.0%) |
| $100,000 and over | 5,223 (99.1%) | 46 (0.9%) |
Public vs Private Health Insurance Coverage by Age in Dupont
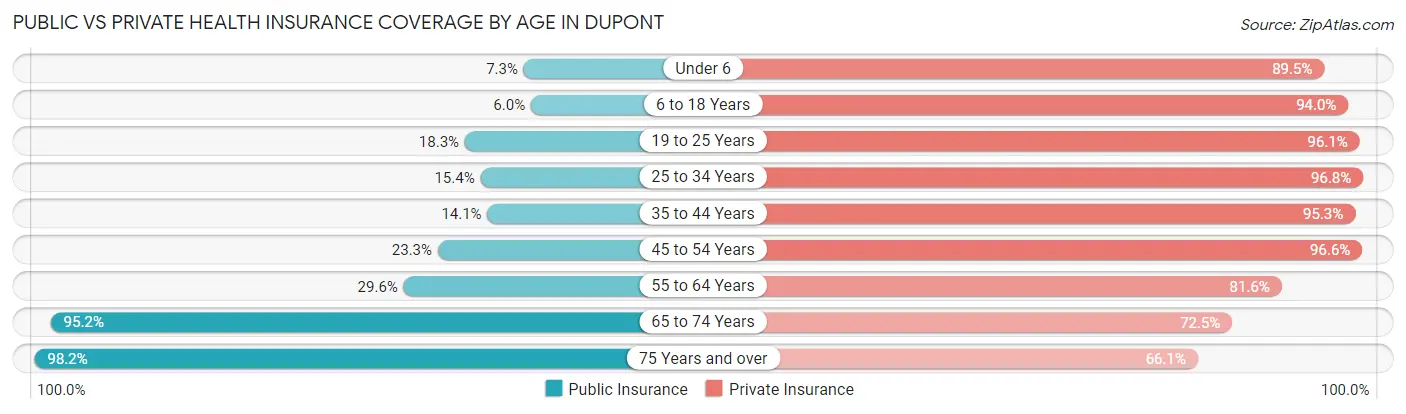
| Age Bracket | Public Insurance | Private Insurance |
| Under 6 | 54 (7.3%) | 659 (89.5%) |
| 6 to 18 Years | 119 (6.0%) | 1,862 (94.0%) |
| 19 to 25 Years | 127 (18.3%) | 668 (96.1%) |
| 25 to 34 Years | 133 (15.4%) | 837 (96.8%) |
| 35 to 44 Years | 143 (14.1%) | 967 (95.3%) |
| 45 to 54 Years | 272 (23.3%) | 1,128 (96.6%) |
| 55 to 64 Years | 326 (29.6%) | 898 (81.6%) |
| 65 to 74 Years | 394 (95.2%) | 300 (72.5%) |
| 75 Years and over | 538 (98.2%) | 362 (66.1%) |
| Total | 2,106 (24.7%) | 7,681 (90.1%) |
Disability Status by Sex by Age in Dupont
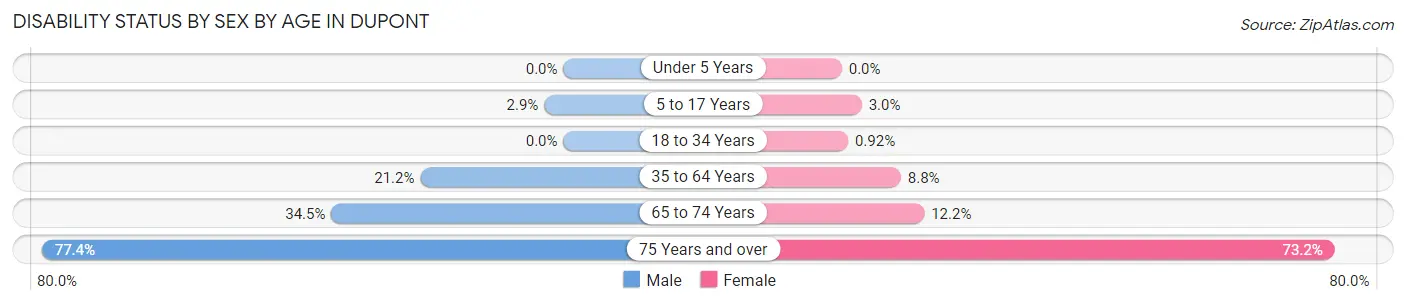
| Age Bracket | Male | Female |
| Under 5 Years | 0 (0.0%) | 0 (0.0%) |
| 5 to 17 Years | 28 (2.9%) | 30 (3.0%) |
| 18 to 34 Years | 0 (0.0%) | 9 (0.9%) |
| 35 to 64 Years | 271 (21.2%) | 176 (8.8%) |
| 65 to 74 Years | 61 (34.5%) | 29 (12.2%) |
| 75 Years and over | 254 (77.4%) | 161 (73.2%) |
Disability Class by Sex by Age in Dupont
Disability Class: Hearing Difficulty
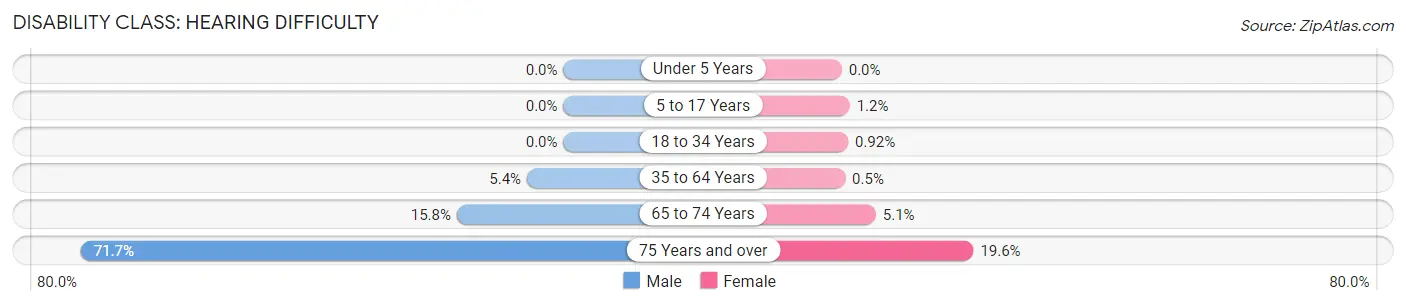
| Age Bracket | Male | Female |
| Under 5 Years | 0 (0.0%) | 0 (0.0%) |
| 5 to 17 Years | 0 (0.0%) | 12 (1.2%) |
| 18 to 34 Years | 0 (0.0%) | 9 (0.9%) |
| 35 to 64 Years | 69 (5.4%) | 10 (0.5%) |
| 65 to 74 Years | 28 (15.8%) | 12 (5.1%) |
| 75 Years and over | 235 (71.7%) | 43 (19.6%) |
Disability Class: Vision Difficulty
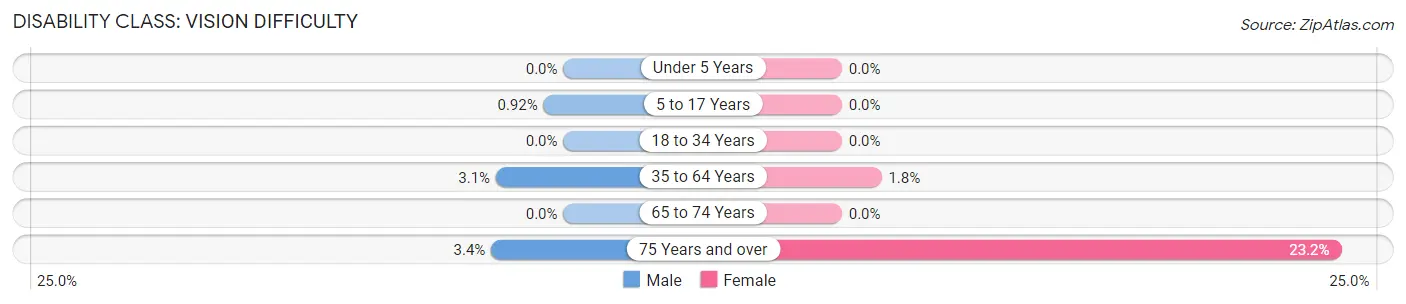
| Age Bracket | Male | Female |
| Under 5 Years | 0 (0.0%) | 0 (0.0%) |
| 5 to 17 Years | 9 (0.9%) | 0 (0.0%) |
| 18 to 34 Years | 0 (0.0%) | 0 (0.0%) |
| 35 to 64 Years | 40 (3.1%) | 37 (1.8%) |
| 65 to 74 Years | 0 (0.0%) | 0 (0.0%) |
| 75 Years and over | 11 (3.4%) | 51 (23.2%) |
Disability Class: Cognitive Difficulty
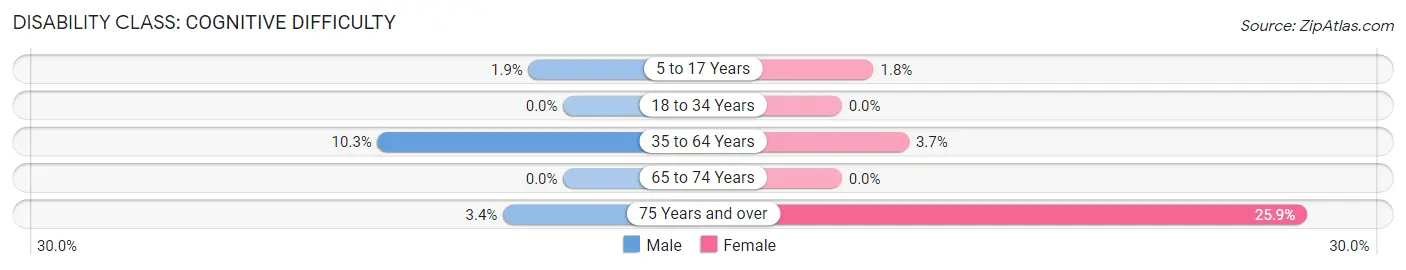
| Age Bracket | Male | Female |
| 5 to 17 Years | 19 (1.9%) | 18 (1.8%) |
| 18 to 34 Years | 0 (0.0%) | 0 (0.0%) |
| 35 to 64 Years | 132 (10.3%) | 75 (3.7%) |
| 65 to 74 Years | 0 (0.0%) | 0 (0.0%) |
| 75 Years and over | 11 (3.4%) | 57 (25.9%) |
Disability Class: Ambulatory Difficulty
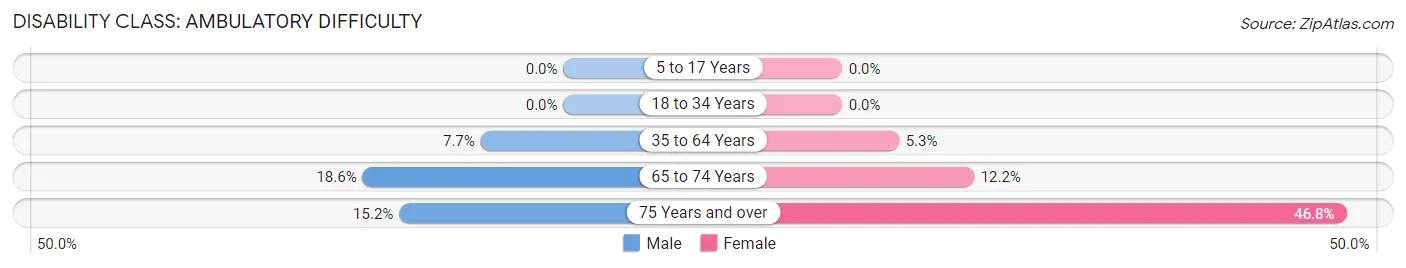
| Age Bracket | Male | Female |
| 5 to 17 Years | 0 (0.0%) | 0 (0.0%) |
| 18 to 34 Years | 0 (0.0%) | 0 (0.0%) |
| 35 to 64 Years | 98 (7.7%) | 106 (5.3%) |
| 65 to 74 Years | 33 (18.6%) | 29 (12.2%) |
| 75 Years and over | 50 (15.2%) | 103 (46.8%) |
Disability Class: Self-Care Difficulty
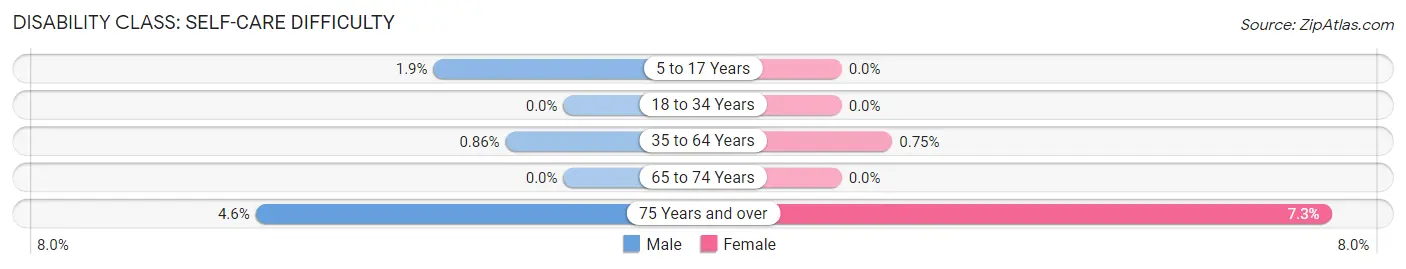
| Age Bracket | Male | Female |
| 5 to 17 Years | 19 (1.9%) | 0 (0.0%) |
| 18 to 34 Years | 0 (0.0%) | 0 (0.0%) |
| 35 to 64 Years | 11 (0.9%) | 15 (0.7%) |
| 65 to 74 Years | 0 (0.0%) | 0 (0.0%) |
| 75 Years and over | 15 (4.6%) | 16 (7.3%) |
Technology Access in Dupont
Computing Device Access in Dupont
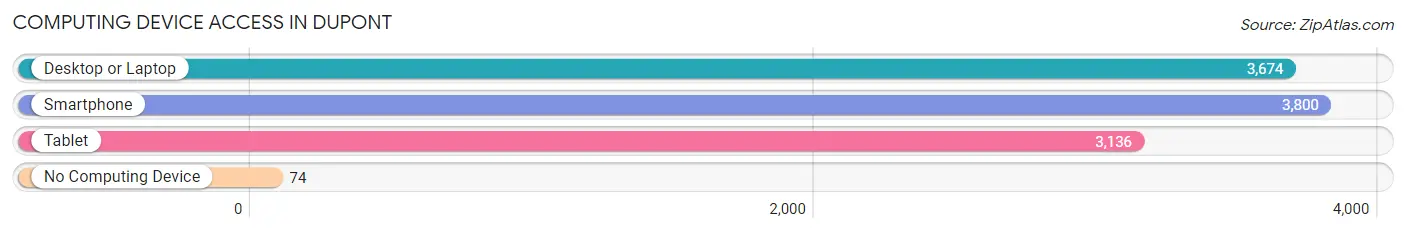
| Device Type | # Households | % Households |
| Desktop or Laptop | 3,674 | 91.7% |
| Smartphone | 3,800 | 94.9% |
| Tablet | 3,136 | 78.3% |
| No Computing Device | 74 | 1.8% |
| Total | 4,006 | 100.0% |
Internet Access in Dupont
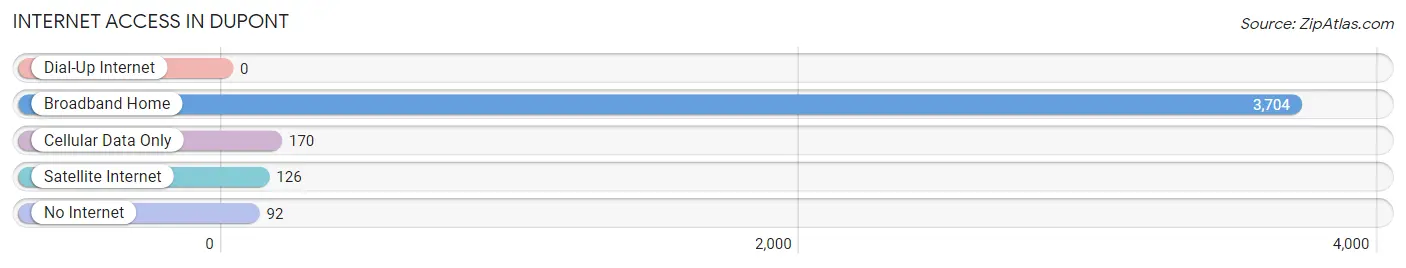
| Internet Type | # Households | % Households |
| Dial-Up Internet | 0 | 0.0% |
| Broadband Home | 3,704 | 92.5% |
| Cellular Data Only | 170 | 4.2% |
| Satellite Internet | 126 | 3.2% |
| No Internet | 92 | 2.3% |
| Total | 4,006 | 100.0% |
Dupont Summary
Dupont, Washington is a city located in Pierce County, Washington, United States. The population was 8,669 at the 2010 census. It is located between the cities of Tacoma and Olympia, and is part of the Seattle metropolitan area.
History
The area that is now Dupont was originally inhabited by the Nisqually people, who were part of the Coast Salish tribe. The first European settlers arrived in the area in the mid-1800s, and the town was officially incorporated in 1912. The town was named after the DuPont Company, which had a large presence in the area.
The town was originally a small farming community, but in the 1950s, the DuPont Company began to expand its presence in the area. The company built a large chemical plant, which brought jobs and economic growth to the area. The town also began to grow, and by the 1970s, it had become a bedroom community for Tacoma and Seattle.
Geography
Dupont is located in western Washington, in Pierce County. It is situated between the cities of Tacoma and Olympia, and is part of the Seattle metropolitan area. The city is located on the banks of the Deschutes River, and is surrounded by forests and wetlands. The city has a total area of 8.3 square miles, of which 8.2 square miles is land and 0.1 square miles is water.
Economy
Dupont’s economy is largely based on the presence of the DuPont Company. The company has a large chemical plant in the city, which provides jobs and economic growth to the area. The city also has a number of small businesses, including restaurants, retail stores, and other services.
Demographics
As of the 2010 census, there were 8,669 people, 3,093 households, and 2,092 families residing in the city. The population density was 1,051.2 people per square mile. The racial makeup of the city was 79.2% White, 8.2% African American, 0.7% Native American, 4.2% Asian, 0.2% Pacific Islander, 3.3% from other races, and 4.2% from two or more races. Hispanic or Latino of any race were 8.2% of the population.
The median income for a household in the city was $60,945, and the median income for a family was $71,945. The per capita income for the city was $27,945. About 4.2% of families and 6.2% of the population were below the poverty line, including 8.2% of those under age 18 and 4.2% of those age 65 or over.
Conclusion
Dupont, Washington is a city located in Pierce County, Washington, United States. The city has a long history, and was originally inhabited by the Nisqually people. The city has grown in recent years, and is now part of the Seattle metropolitan area. The economy of the city is largely based on the presence of the DuPont Company, which has a large chemical plant in the city. The population of the city is 8,669, and the median income for a household is $60,945.
Common Questions
What is Per Capita Income in Dupont?
Per Capita income in Dupont is $50,942.
What is the Median Family Income in Dupont?
Median Family Income in Dupont is $115,847.
What is the Median Household income in Dupont?
Median Household Income in Dupont is $106,695.
What is Income or Wage Gap in Dupont?
Income or Wage Gap in Dupont is 35.2%.
Women in Dupont earn 64.8 cents for every dollar earned by a man.
What is Family Income Deficit in Dupont?
Family Income Deficit in Dupont is $12,358.
Families that are below poverty line in Dupont earn $12,358 less on average than the poverty threshold level.
What is Inequality or Gini Index in Dupont?
Inequality or Gini Index in Dupont is 0.33.
What is the Total Population of Dupont?
Total Population of Dupont is 9,955.
What is the Total Male Population of Dupont?
Total Male Population of Dupont is 4,896.
What is the Total Female Population of Dupont?
Total Female Population of Dupont is 5,059.
What is the Ratio of Males per 100 Females in Dupont?
There are 96.78 Males per 100 Females in Dupont.
What is the Ratio of Females per 100 Males in Dupont?
There are 103.33 Females per 100 Males in Dupont.
What is the Median Population Age in Dupont?
Median Population Age in Dupont is 34.2 Years.
What is the Average Family Size in Dupont
Average Family Size in Dupont is 3.0 People.
What is the Average Household Size in Dupont
Average Household Size in Dupont is 2.5 People.
How Large is the Labor Force in Dupont?
There are 5,276 People in the Labor Forcein in Dupont.
What is the Percentage of People in the Labor Force in Dupont?
69.3% of People are in the Labor Force in Dupont.
What is the Unemployment Rate in Dupont?
Unemployment Rate in Dupont is 4.7%.