Cities with the Lowest Poverty Level Among Children Under the Age of 5 in Mississippi
RELATED REPORTS & OPTIONS
Lowest Poverty | Child 0-5
Mississippi
Compare Cities
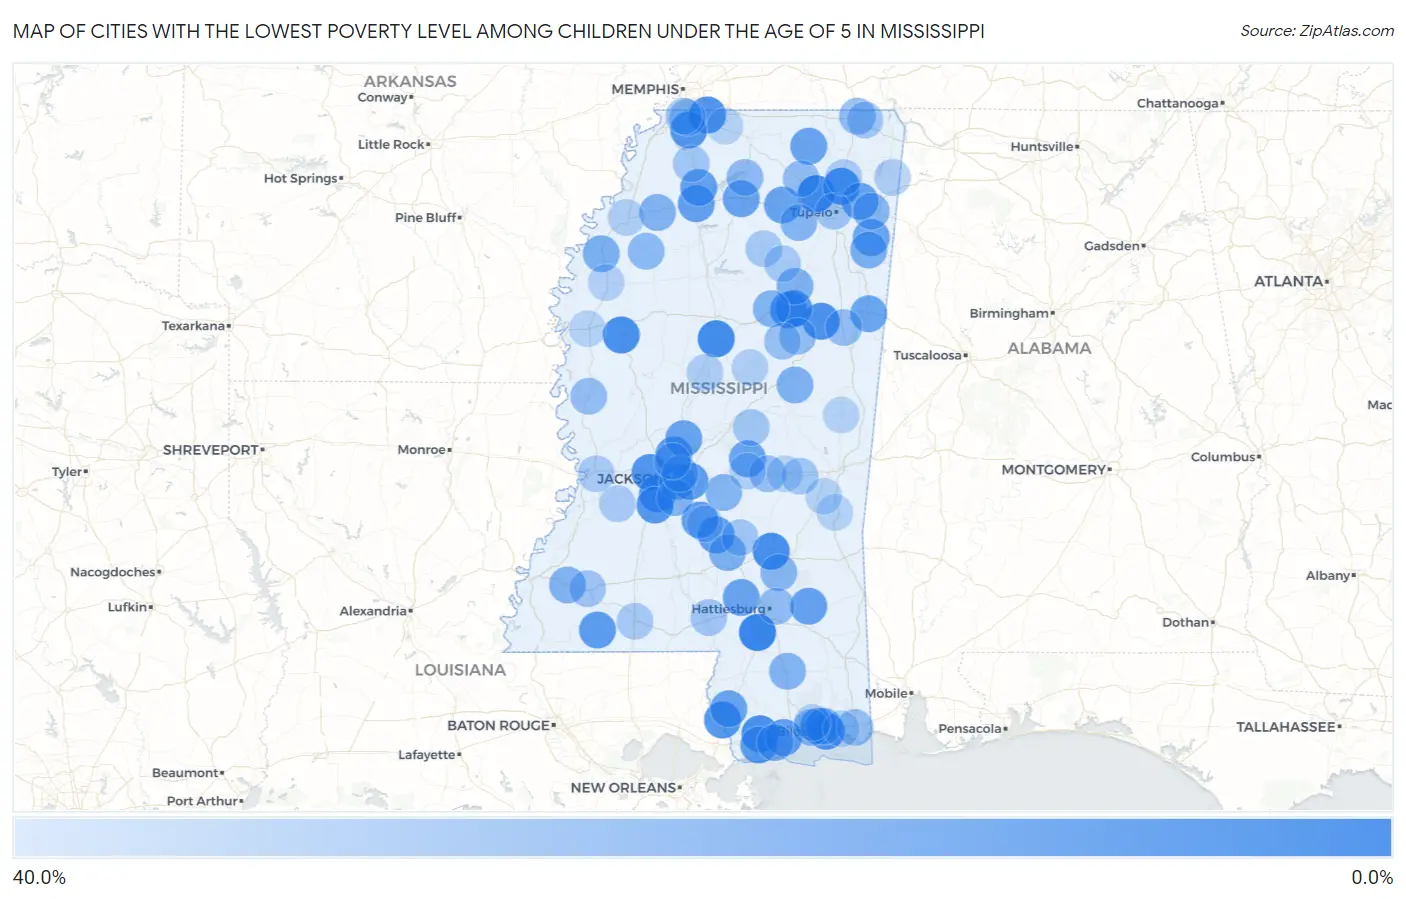
Map of Cities with the Lowest Poverty Level Among Children Under the Age of 5 in Mississippi
40.0%
0.0%
Cities with the Lowest Poverty Level Among Children Under the Age of 5 in Mississippi
| City | Child Poverty | vs State | vs National | |
| 1. | Purvis | 1.3% | 29.3%(-28.0)#1 | 18.1%(-16.7)#166 |
| 2. | Blue Springs | 3.0% | 29.3%(-26.3)#2 | 18.1%(-15.0)#723 |
| 3. | Vaiden | 4.2% | 29.3%(-25.1)#3 | 18.1%(-13.9)#1,194 |
| 4. | Soso | 5.3% | 29.3%(-24.0)#4 | 18.1%(-12.8)#1,692 |
| 5. | Diamondhead | 5.6% | 29.3%(-23.7)#5 | 18.1%(-12.5)#1,828 |
| 6. | Guntown | 5.8% | 29.3%(-23.5)#6 | 18.1%(-12.3)#1,904 |
| 7. | Inverness | 6.2% | 29.3%(-23.1)#7 | 18.1%(-11.9)#2,046 |
| 8. | Starkville | 6.8% | 29.3%(-22.5)#8 | 18.1%(-11.2)#2,343 |
| 9. | Olive Branch | 7.2% | 29.3%(-22.0)#9 | 18.1%(-10.8)#2,523 |
| 10. | Ocean Springs | 7.3% | 29.3%(-21.9)#10 | 18.1%(-10.7)#2,569 |
| 11. | Byram | 7.5% | 29.3%(-21.8)#11 | 18.1%(-10.6)#2,620 |
| 12. | Nicholson | 7.7% | 29.3%(-21.6)#12 | 18.1%(-10.4)#2,704 |
| 13. | Clinton | 8.0% | 29.3%(-21.3)#13 | 18.1%(-10.1)#2,838 |
| 14. | Hernando | 8.5% | 29.3%(-20.8)#14 | 18.1%(-9.60)#3,022 |
| 15. | Mathiston | 9.4% | 29.3%(-19.9)#15 | 18.1%(-8.69)#3,419 |
| 16. | Terry | 9.6% | 29.3%(-19.7)#16 | 18.1%(-8.47)#3,504 |
| 17. | Maben | 9.7% | 29.3%(-19.6)#17 | 18.1%(-8.33)#3,554 |
| 18. | St Martin | 10.0% | 29.3%(-19.2)#18 | 18.1%(-8.01)#3,684 |
| 19. | Madison | 10.2% | 29.3%(-19.1)#19 | 18.1%(-7.88)#3,729 |
| 20. | Liberty | 10.4% | 29.3%(-18.9)#20 | 18.1%(-7.67)#3,804 |
| 21. | Waveland | 10.9% | 29.3%(-18.4)#21 | 18.1%(-7.15)#4,006 |
| 22. | Brandon | 11.1% | 29.3%(-18.2)#22 | 18.1%(-6.93)#4,135 |
| 23. | Long Beach | 11.5% | 29.3%(-17.8)#23 | 18.1%(-6.59)#4,259 |
| 24. | Magee | 11.6% | 29.3%(-17.7)#24 | 18.1%(-6.46)#4,303 |
| 25. | D Lo | 11.8% | 29.3%(-17.5)#25 | 18.1%(-6.30)#4,364 |
| 26. | Richton | 12.8% | 29.3%(-16.5)#26 | 18.1%(-5.30)#4,741 |
| 27. | Batesville | 12.9% | 29.3%(-16.4)#27 | 18.1%(-5.21)#4,779 |
| 28. | Mantachie | 13.1% | 29.3%(-16.2)#28 | 18.1%(-4.95)#4,879 |
| 29. | Sardis | 13.3% | 29.3%(-16.0)#29 | 18.1%(-4.73)#4,942 |
| 30. | Canton | 13.6% | 29.3%(-15.7)#30 | 18.1%(-4.46)#5,049 |
| 31. | Ripley | 13.6% | 29.3%(-15.7)#31 | 18.1%(-4.45)#5,051 |
| 32. | Smithville | 13.6% | 29.3%(-15.6)#32 | 18.1%(-4.43)#5,067 |
| 33. | Thaxton | 13.6% | 29.3%(-15.6)#33 | 18.1%(-4.43)#5,069 |
| 34. | Hillsboro | 13.7% | 29.3%(-15.6)#34 | 18.1%(-4.35)#5,103 |
| 35. | Oxford | 13.9% | 29.3%(-15.3)#35 | 18.1%(-4.12)#5,188 |
| 36. | Hide A Way Lake | 14.1% | 29.3%(-15.2)#36 | 18.1%(-3.93)#5,255 |
| 37. | Sumrall | 14.6% | 29.3%(-14.7)#37 | 18.1%(-3.46)#5,450 |
| 38. | Columbus | 14.9% | 29.3%(-14.3)#38 | 18.1%(-3.12)#5,566 |
| 39. | Shelby | 18.7% | 29.3%(-10.6)#39 | 18.1%(+0.619)#6,840 |
| 40. | Hatley | 18.8% | 29.3%(-10.5)#40 | 18.1%(+0.687)#6,869 |
| 41. | Gulf Hills | 19.1% | 29.3%(-10.1)#41 | 18.1%(+1.07)#6,982 |
| 42. | Mount Olive | 19.4% | 29.3%(-9.93)#42 | 18.1%(+1.29)#7,041 |
| 43. | Noxapater | 19.6% | 29.3%(-9.72)#43 | 18.1%(+1.50)#7,125 |
| 44. | Pass Christian | 19.8% | 29.3%(-9.51)#44 | 18.1%(+1.71)#7,181 |
| 45. | Mantee | 20.0% | 29.3%(-9.29)#45 | 18.1%(+1.94)#7,265 |
| 46. | Roxie | 20.4% | 29.3%(-8.88)#46 | 18.1%(+2.35)#7,389 |
| 47. | Marks | 20.6% | 29.3%(-8.70)#47 | 18.1%(+2.53)#7,444 |
| 48. | Wiggins | 20.6% | 29.3%(-8.67)#48 | 18.1%(+2.56)#7,462 |
| 49. | Pearl | 20.8% | 29.3%(-8.50)#49 | 18.1%(+2.72)#7,503 |
| 50. | Eupora | 21.0% | 29.3%(-8.32)#50 | 18.1%(+2.90)#7,550 |
| 51. | Florence | 21.5% | 29.3%(-7.79)#51 | 18.1%(+3.43)#7,733 |
| 52. | Algoma | 21.5% | 29.3%(-7.78)#52 | 18.1%(+3.44)#7,740 |
| 53. | Polkville | 21.7% | 29.3%(-7.62)#53 | 18.1%(+3.60)#7,787 |
| 54. | Ellisville | 22.1% | 29.3%(-7.22)#54 | 18.1%(+4.00)#7,916 |
| 55. | Fulton | 22.2% | 29.3%(-7.06)#55 | 18.1%(+4.16)#7,945 |
| 56. | Flowood | 22.5% | 29.3%(-6.78)#56 | 18.1%(+4.45)#8,057 |
| 57. | Sumner | 23.1% | 29.3%(-6.21)#57 | 18.1%(+5.01)#8,227 |
| 58. | Biloxi | 23.4% | 29.3%(-5.87)#58 | 18.1%(+5.35)#8,316 |
| 59. | Abbeville | 23.5% | 29.3%(-5.76)#59 | 18.1%(+5.47)#8,352 |
| 60. | Corinth | 24.2% | 29.3%(-5.07)#60 | 18.1%(+6.15)#8,545 |
| 61. | New Albany | 24.8% | 29.3%(-4.45)#61 | 18.1%(+6.77)#8,687 |
| 62. | Petal | 24.9% | 29.3%(-4.39)#62 | 18.1%(+6.83)#8,695 |
| 63. | Rolling Fork | 25.0% | 29.3%(-4.29)#63 | 18.1%(+6.94)#8,719 |
| 64. | Lake | 25.0% | 29.3%(-4.29)#64 | 18.1%(+6.94)#8,766 |
| 65. | Artesia | 25.0% | 29.3%(-4.29)#65 | 18.1%(+6.94)#8,780 |
| 66. | Sturgis | 25.0% | 29.3%(-4.29)#66 | 18.1%(+6.94)#8,812 |
| 67. | Moss Point | 25.9% | 29.3%(-3.41)#67 | 18.1%(+7.81)#8,996 |
| 68. | Ridgeland | 26.3% | 29.3%(-3.03)#68 | 18.1%(+8.19)#9,083 |
| 69. | Ackerman | 27.0% | 29.3%(-2.30)#69 | 18.1%(+8.92)#9,261 |
| 70. | Southaven | 27.4% | 29.3%(-1.90)#70 | 18.1%(+9.33)#9,370 |
| 71. | Meadville | 28.0% | 29.3%(-1.29)#71 | 18.1%(+9.94)#9,518 |
| 72. | Tupelo | 28.0% | 29.3%(-1.27)#72 | 18.1%(+9.95)#9,525 |
| 73. | Horn Lake | 28.3% | 29.3%(-1.03)#73 | 18.1%(+10.2)#9,575 |
| 74. | Columbia | 28.3% | 29.3%(-0.959)#74 | 18.1%(+10.3)#9,590 |
| 75. | Farmington | 28.4% | 29.3%(-0.901)#75 | 18.1%(+10.3)#9,603 |
| 76. | Hickory | 28.6% | 29.3%(-0.714)#76 | 18.1%(+10.5)#9,671 |
| 77. | Mize | 28.6% | 29.3%(-0.714)#77 | 18.1%(+10.5)#9,681 |
| 78. | Standing Pine | 28.8% | 29.3%(-0.439)#78 | 18.1%(+10.8)#9,748 |
| 79. | Senatobia | 29.0% | 29.3%(-0.253)#79 | 18.1%(+11.0)#9,797 |
| 80. | Bruce | 29.9% | 29.3%(+0.629)#80 | 18.1%(+11.9)#9,985 |
| 81. | Vardaman | 30.2% | 29.3%(+0.873)#81 | 18.1%(+12.1)#10,062 |
| 82. | Mccomb | 30.2% | 29.3%(+0.890)#82 | 18.1%(+12.1)#10,065 |
| 83. | Utica | 30.6% | 29.3%(+1.36)#83 | 18.1%(+12.6)#10,164 |
| 84. | Beechwood | 30.8% | 29.3%(+1.52)#84 | 18.1%(+12.7)#10,214 |
| 85. | Baldwyn | 31.0% | 29.3%(+1.75)#85 | 18.1%(+13.0)#10,246 |
| 86. | Belmont | 31.5% | 29.3%(+2.23)#86 | 18.1%(+13.4)#10,349 |
| 87. | Durant | 31.8% | 29.3%(+2.48)#87 | 18.1%(+13.7)#10,392 |
| 88. | Lyon | 32.0% | 29.3%(+2.71)#88 | 18.1%(+13.9)#10,436 |
| 89. | Mendenhall | 32.1% | 29.3%(+2.81)#89 | 18.1%(+14.0)#10,455 |
| 90. | Ethel | 32.3% | 29.3%(+3.02)#90 | 18.1%(+14.2)#10,490 |
| 91. | Forest | 32.6% | 29.3%(+3.29)#91 | 18.1%(+14.5)#10,540 |
| 92. | Gautier | 32.7% | 29.3%(+3.41)#92 | 18.1%(+14.6)#10,571 |
| 93. | Cleveland | 32.9% | 29.3%(+3.57)#93 | 18.1%(+14.8)#10,592 |
| 94. | Leland | 33.3% | 29.3%(+4.05)#94 | 18.1%(+15.3)#10,647 |
| 95. | Byhalia | 33.3% | 29.3%(+4.05)#95 | 18.1%(+15.3)#10,657 |
| 96. | Quitman | 33.3% | 29.3%(+4.05)#96 | 18.1%(+15.3)#10,658 |
| 97. | De Kalb | 33.3% | 29.3%(+4.05)#97 | 18.1%(+15.3)#10,685 |
| 98. | Enterprise | 33.3% | 29.3%(+4.05)#98 | 18.1%(+15.3)#10,706 |
| 99. | Newton | 33.8% | 29.3%(+4.49)#99 | 18.1%(+15.7)#10,841 |
| 100. | D Iberville | 33.9% | 29.3%(+4.62)#100 | 18.1%(+15.8)#10,862 |
Common Questions
What are the Top 10 Cities with the Lowest Poverty Level Among Children Under the Age of 5 in Mississippi?
Top 10 Cities with the Lowest Poverty Level Among Children Under the Age of 5 in Mississippi are:
#1
1.3%
#2
3.0%
#3
4.2%
#4
5.3%
#5
5.6%
#6
5.8%
#7
6.2%
#8
6.8%
#9
7.2%
#10
7.3%
What city has the Lowest Poverty Level Among Children Under the Age of 5 in Mississippi?
Purvis has the Lowest Poverty Level Among Children Under the Age of 5 in Mississippi with 1.3%.
What is the Poverty Level Among Children Under the Age of 5 in the State of Mississippi?
Poverty Level Among Children Under the Age of 5 in Mississippi is 29.3%.
What is the Poverty Level Among Children Under the Age of 5 in the United States?
Poverty Level Among Children Under the Age of 5 in the United States is 18.1%.