Arlington, WA Map & Demographics
Arlington Map
Arlington Overview
$43,785
PER CAPITA INCOME
$104,696
AVG FAMILY INCOME
$89,587
AVG HOUSEHOLD INCOME
50.6%
WAGE / INCOME GAP [ % ]
49.4¢/ $1
WAGE / INCOME GAP [ $ ]
0.43
INEQUALITY / GINI INDEX
20,263
TOTAL POPULATION
9,816
MALE POPULATION
10,447
FEMALE POPULATION
93.96
MALES / 100 FEMALES
106.43
FEMALES / 100 MALES
36.9
MEDIAN AGE
3.2
AVG FAMILY SIZE
2.7
AVG HOUSEHOLD SIZE
10,748
LABOR FORCE [ PEOPLE ]
67.8%
PERCENT IN LABOR FORCE
3.8%
UNEMPLOYMENT RATE
Arlington Zip Codes
Arlington Area Codes
Income in Arlington
Income Overview in Arlington
Per Capita Income in Arlington is $43,785, while median incomes of families and households are $104,696 and $89,587 respectively.
| Characteristic | Number | Measure |
| Per Capita Income | 20,263 | $43,785 |
| Median Family Income | 5,114 | $104,696 |
| Mean Family Income | 5,114 | $133,896 |
| Median Household Income | 7,502 | $89,587 |
| Mean Household Income | 7,502 | $114,059 |
| Income Deficit | 5,114 | $0 |
| Wage / Income Gap (%) | 20,263 | 50.58% |
| Wage / Income Gap ($) | 20,263 | 49.42¢ per $1 |
| Gini / Inequality Index | 20,263 | 0.43 |
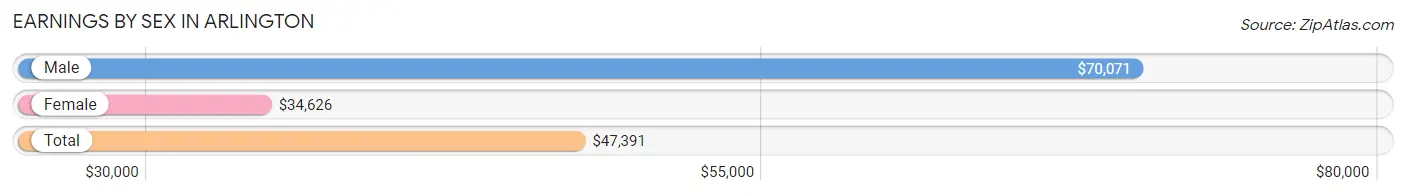
Earnings by Sex in Arlington
Average Earnings in Arlington are $47,391, $70,071 for men and $34,626 for women, a difference of 50.6%.
| Sex | Number | Average Earnings |
| Male | 5,913 (52.1%) | $70,071 |
| Female | 5,435 (47.9%) | $34,626 |
| Total | 11,348 (100.0%) | $47,391 |
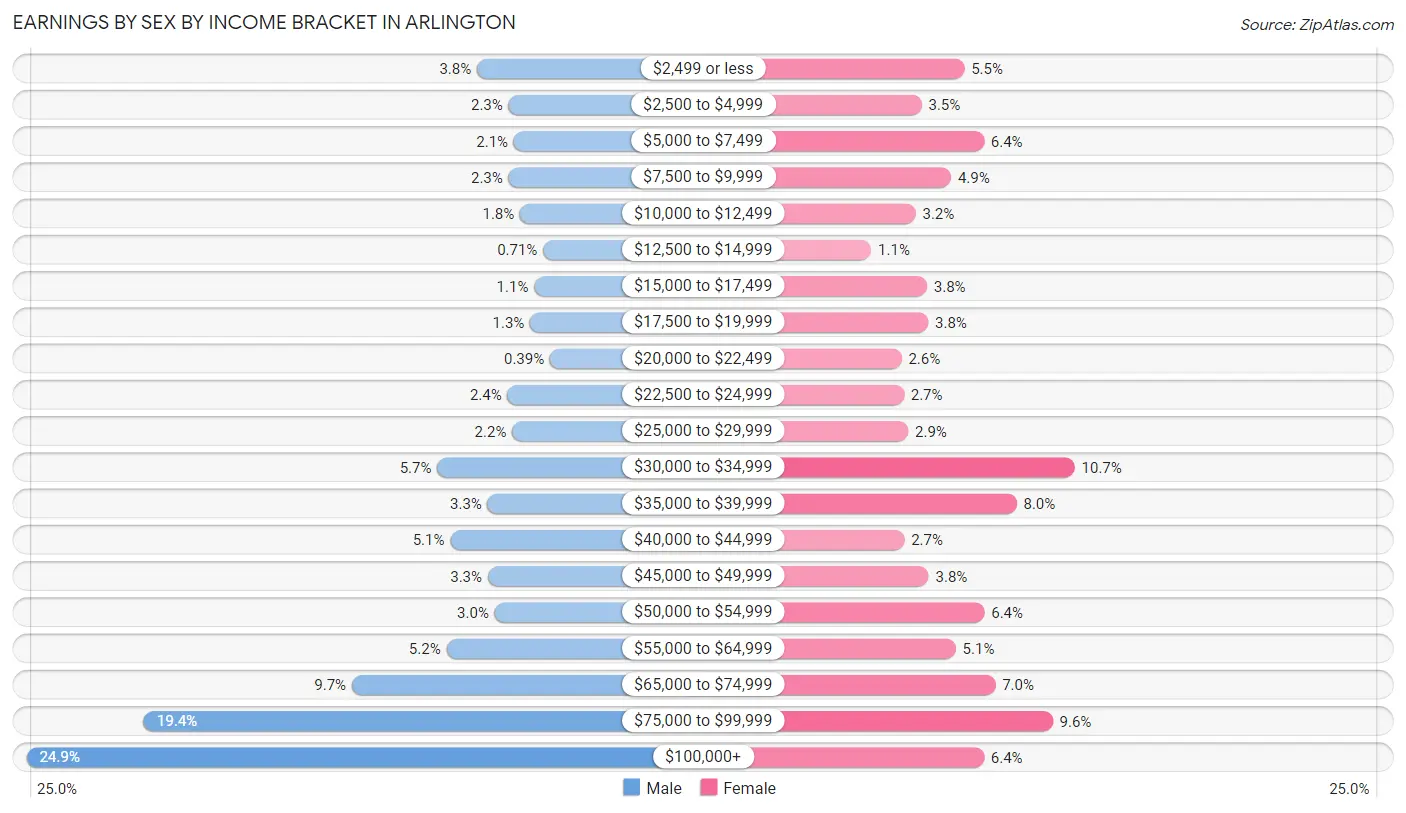
Earnings by Sex by Income Bracket in Arlington
The most common earnings brackets in Arlington are $100,000+ for men (1,473 | 24.9%) and $30,000 to $34,999 for women (580 | 10.7%).
| Income | Male | Female |
| $2,499 or less | 225 (3.8%) | 299 (5.5%) |
| $2,500 to $4,999 | 138 (2.3%) | 190 (3.5%) |
| $5,000 to $7,499 | 123 (2.1%) | 349 (6.4%) |
| $7,500 to $9,999 | 138 (2.3%) | 265 (4.9%) |
| $10,000 to $12,499 | 106 (1.8%) | 175 (3.2%) |
| $12,500 to $14,999 | 42 (0.7%) | 62 (1.1%) |
| $15,000 to $17,499 | 67 (1.1%) | 204 (3.7%) |
| $17,500 to $19,999 | 78 (1.3%) | 207 (3.8%) |
| $20,000 to $22,499 | 23 (0.4%) | 139 (2.6%) |
| $22,500 to $24,999 | 141 (2.4%) | 145 (2.7%) |
| $25,000 to $29,999 | 128 (2.2%) | 156 (2.9%) |
| $30,000 to $34,999 | 335 (5.7%) | 580 (10.7%) |
| $35,000 to $39,999 | 196 (3.3%) | 432 (8.0%) |
| $40,000 to $44,999 | 299 (5.1%) | 146 (2.7%) |
| $45,000 to $49,999 | 195 (3.3%) | 208 (3.8%) |
| $50,000 to $54,999 | 176 (3.0%) | 350 (6.4%) |
| $55,000 to $64,999 | 310 (5.2%) | 277 (5.1%) |
| $65,000 to $74,999 | 572 (9.7%) | 378 (7.0%) |
| $75,000 to $99,999 | 1,148 (19.4%) | 524 (9.6%) |
| $100,000+ | 1,473 (24.9%) | 349 (6.4%) |
| Total | 5,913 (100.0%) | 5,435 (100.0%) |
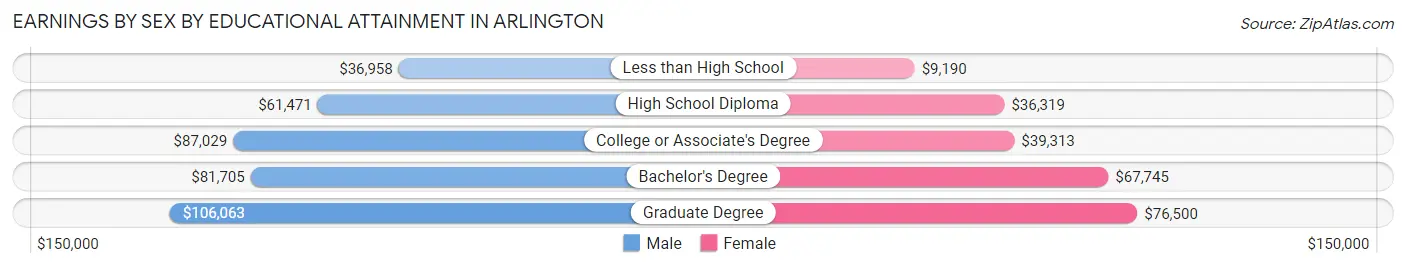
Earnings by Sex by Educational Attainment in Arlington
Average earnings in Arlington are $75,953 for men and $38,598 for women, a difference of 49.2%. Men with an educational attainment of graduate degree enjoy the highest average annual earnings of $106,063, while those with less than high school education earn the least with $36,958. Women with an educational attainment of graduate degree earn the most with the average annual earnings of $76,500, while those with less than high school education have the smallest earnings of $9,190.
| Educational Attainment | Male Income | Female Income |
| Less than High School | $36,958 | $9,190 |
| High School Diploma | $61,471 | $36,319 |
| College or Associate's Degree | $87,029 | $39,313 |
| Bachelor's Degree | $81,705 | $67,745 |
| Graduate Degree | $106,063 | $76,500 |
| Total | $75,953 | $38,598 |
Family Income in Arlington
Family Income Brackets in Arlington
According to the Arlington family income data, there are 1,299 families falling into the $100,000 to $149,999 income range, which is the most common income bracket and makes up 25.4% of all families. Conversely, the $10,000 to $14,999 income bracket is the least frequent group with only 41 families (0.8%) belonging to this category.
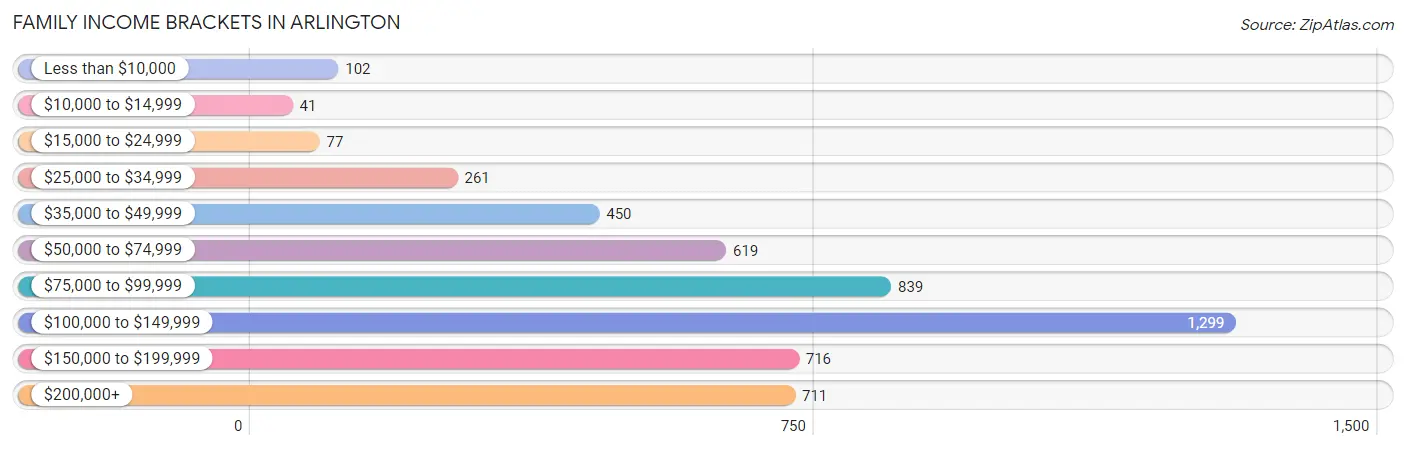
| Income Bracket | # Families | % Families |
| Less than $10,000 | 102 | 2.0% |
| $10,000 to $14,999 | 41 | 0.8% |
| $15,000 to $24,999 | 77 | 1.5% |
| $25,000 to $34,999 | 261 | 5.1% |
| $35,000 to $49,999 | 450 | 8.8% |
| $50,000 to $74,999 | 619 | 12.1% |
| $75,000 to $99,999 | 839 | 16.4% |
| $100,000 to $149,999 | 1,299 | 25.4% |
| $150,000 to $199,999 | 716 | 14.0% |
| $200,000+ | 711 | 13.9% |
Family Income by Famaliy Size in Arlington
4-person families (1,150 | 22.5%) account for the highest median family income in Arlington with $130,500 per family, while 2-person families (2,030 | 39.7%) have the highest median income of $48,603 per family member.
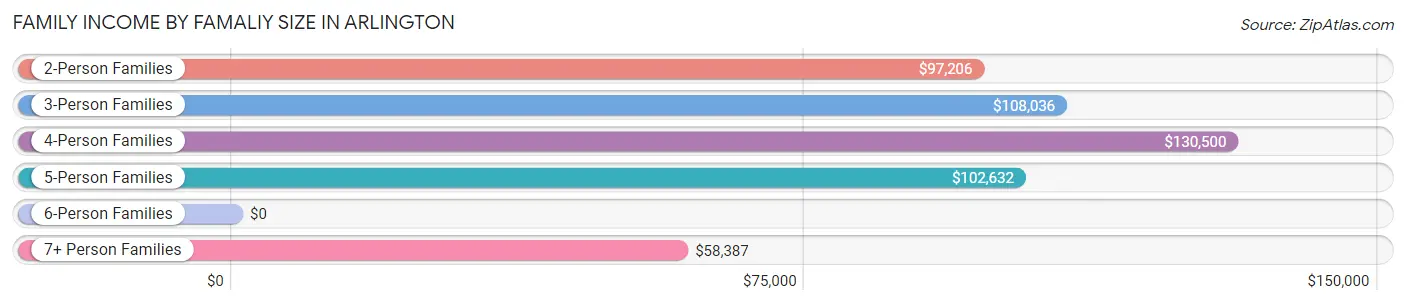
| Income Bracket | # Families | Median Income |
| 2-Person Families | 2,030 (39.7%) | $97,206 |
| 3-Person Families | 1,075 (21.0%) | $108,036 |
| 4-Person Families | 1,150 (22.5%) | $130,500 |
| 5-Person Families | 564 (11.0%) | $102,632 |
| 6-Person Families | 149 (2.9%) | $0 |
| 7+ Person Families | 146 (2.9%) | $58,387 |
| Total | 5,114 (100.0%) | $104,696 |
Family Income by Number of Earners in Arlington
The median family income in Arlington is $104,696, with families comprising 3+ earners (958) having the highest median family income of $146,231, while families with no earners (413) have the lowest median family income of $58,155, accounting for 18.7% and 8.1% of families, respectively.
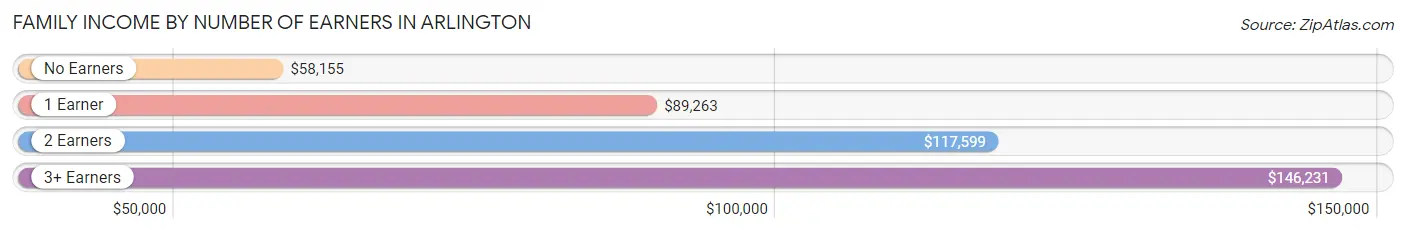
| Number of Earners | # Families | Median Income |
| No Earners | 413 (8.1%) | $58,155 |
| 1 Earner | 1,482 (29.0%) | $89,263 |
| 2 Earners | 2,261 (44.2%) | $117,599 |
| 3+ Earners | 958 (18.7%) | $146,231 |
| Total | 5,114 (100.0%) | $104,696 |
Household Income in Arlington
Household Income Brackets in Arlington
With 1,658 households falling in the category, the $100,000 to $149,999 income range is the most frequent in Arlington, accounting for 22.1% of all households. In contrast, only 98 households (1.3%) fall into the $10,000 to $14,999 income bracket, making it the least populous group.
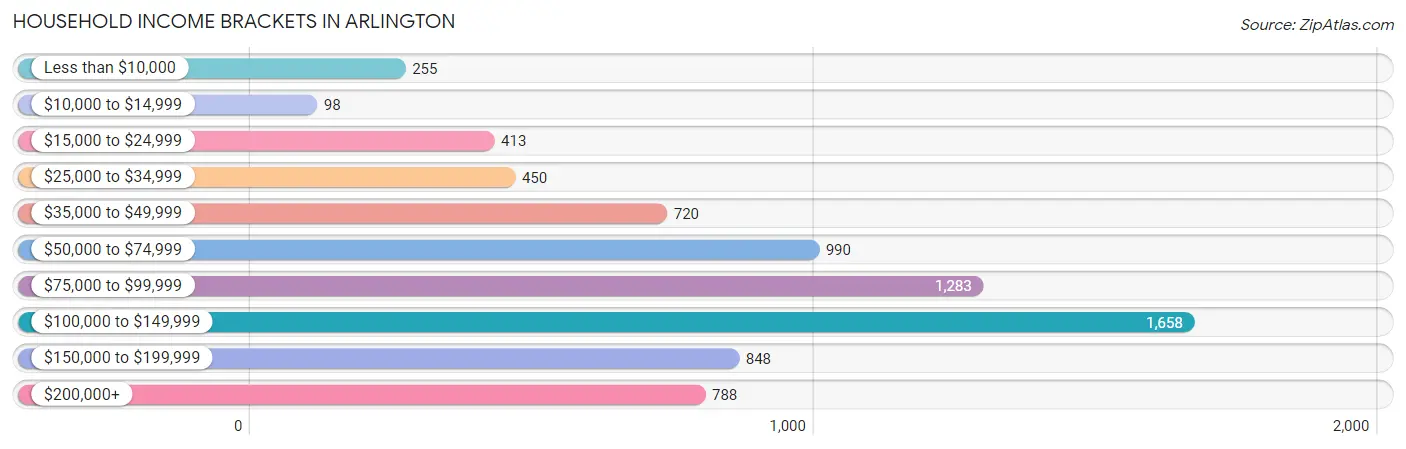
| Income Bracket | # Households | % Households |
| Less than $10,000 | 255 | 3.4% |
| $10,000 to $14,999 | 98 | 1.3% |
| $15,000 to $24,999 | 413 | 5.5% |
| $25,000 to $34,999 | 450 | 6.0% |
| $35,000 to $49,999 | 720 | 9.6% |
| $50,000 to $74,999 | 990 | 13.2% |
| $75,000 to $99,999 | 1,283 | 17.1% |
| $100,000 to $149,999 | 1,658 | 22.1% |
| $150,000 to $199,999 | 848 | 11.3% |
| $200,000+ | 788 | 10.5% |
Household Income by Householder Age in Arlington
The median household income in Arlington is $89,587, with the highest median household income of $103,864 found in the 45 to 64 years age bracket for the primary householder. A total of 3,032 households (40.4%) fall into this category. Meanwhile, the 65+ years age bracket for the primary householder has the lowest median household income of $44,404, with 1,769 households (23.6%) in this group.
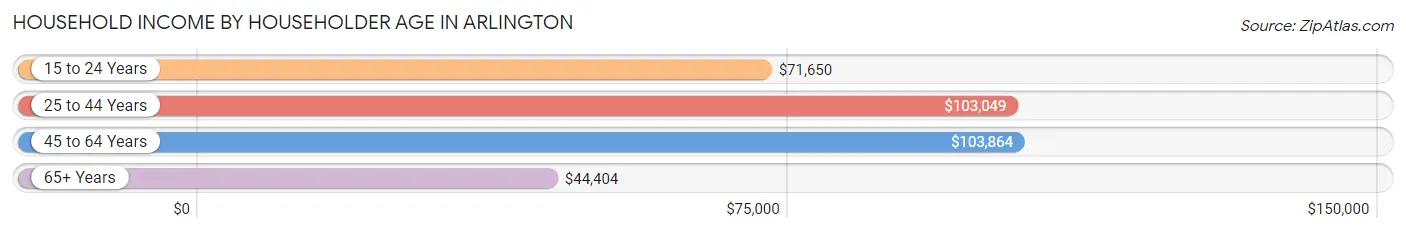
| Income Bracket | # Households | Median Income |
| 15 to 24 Years | 221 (2.9%) | $71,650 |
| 25 to 44 Years | 2,480 (33.1%) | $103,049 |
| 45 to 64 Years | 3,032 (40.4%) | $103,864 |
| 65+ Years | 1,769 (23.6%) | $44,404 |
| Total | 7,502 (100.0%) | $89,587 |
Poverty in Arlington
Income Below Poverty by Sex and Age in Arlington
With 6.2% poverty level for males and 8.6% for females among the residents of Arlington, 12 to 14 year old males and 5 year old females are the most vulnerable to poverty, with 153 males (34.3%) and 24 females (51.1%) in their respective age groups living below the poverty level.
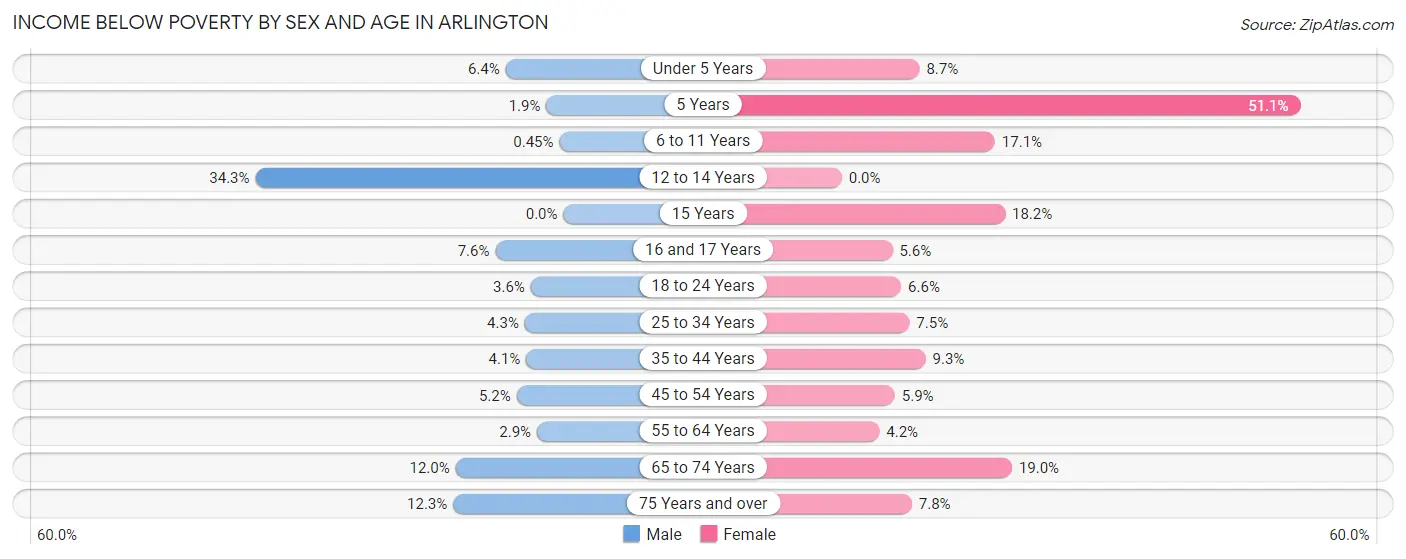
| Age Bracket | Male | Female |
| Under 5 Years | 43 (6.4%) | 53 (8.6%) |
| 5 Years | 3 (1.9%) | 24 (51.1%) |
| 6 to 11 Years | 4 (0.4%) | 141 (17.1%) |
| 12 to 14 Years | 153 (34.3%) | 0 (0.0%) |
| 15 Years | 0 (0.0%) | 22 (18.2%) |
| 16 and 17 Years | 20 (7.6%) | 18 (5.6%) |
| 18 to 24 Years | 34 (3.6%) | 61 (6.6%) |
| 25 to 34 Years | 51 (4.3%) | 97 (7.5%) |
| 35 to 44 Years | 64 (4.1%) | 136 (9.3%) |
| 45 to 54 Years | 77 (5.2%) | 93 (5.9%) |
| 55 to 64 Years | 31 (2.9%) | 53 (4.2%) |
| 65 to 74 Years | 74 (12.0%) | 137 (19.0%) |
| 75 Years and over | 55 (12.3%) | 55 (7.8%) |
| Total | 609 (6.2%) | 890 (8.6%) |
Income Above Poverty by Sex and Age in Arlington
According to the poverty statistics in Arlington, males aged 15 years and females aged 12 to 14 years are the age groups that are most secure financially, with 100.0% of males and 100.0% of females in these age groups living above the poverty line.
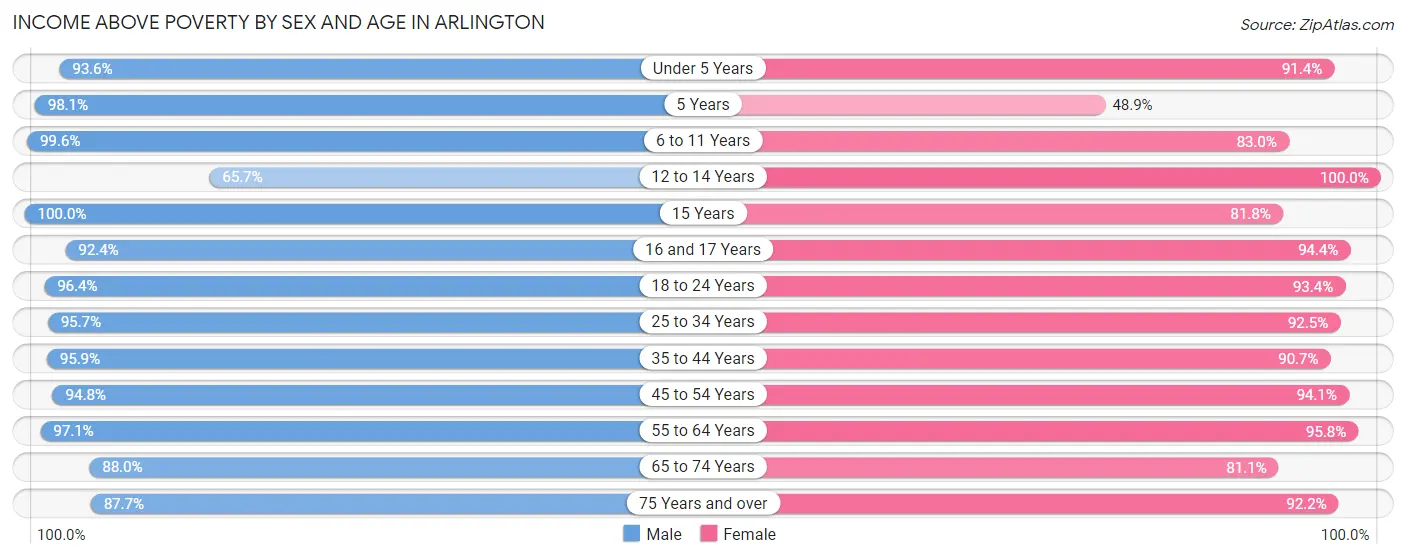
| Age Bracket | Male | Female |
| Under 5 Years | 625 (93.6%) | 560 (91.3%) |
| 5 Years | 155 (98.1%) | 23 (48.9%) |
| 6 to 11 Years | 879 (99.6%) | 686 (83.0%) |
| 12 to 14 Years | 293 (65.7%) | 502 (100.0%) |
| 15 Years | 83 (100.0%) | 99 (81.8%) |
| 16 and 17 Years | 244 (92.4%) | 301 (94.4%) |
| 18 to 24 Years | 900 (96.4%) | 862 (93.4%) |
| 25 to 34 Years | 1,136 (95.7%) | 1,192 (92.5%) |
| 35 to 44 Years | 1,483 (95.9%) | 1,321 (90.7%) |
| 45 to 54 Years | 1,400 (94.8%) | 1,480 (94.1%) |
| 55 to 64 Years | 1,022 (97.1%) | 1,215 (95.8%) |
| 65 to 74 Years | 542 (88.0%) | 586 (81.0%) |
| 75 Years and over | 393 (87.7%) | 650 (92.2%) |
| Total | 9,155 (93.8%) | 9,477 (91.4%) |
Income Below Poverty Among Married-Couple Families in Arlington
The poverty statistics for married-couple families in Arlington show that 2.8% or 114 of the total 4,010 families live below the poverty line. Families with 3 or 4 children have the highest poverty rate of 14.0%, comprising of 66 families. On the other hand, families with 5 or more children have the lowest poverty rate of 0.0%, which includes 0 families.
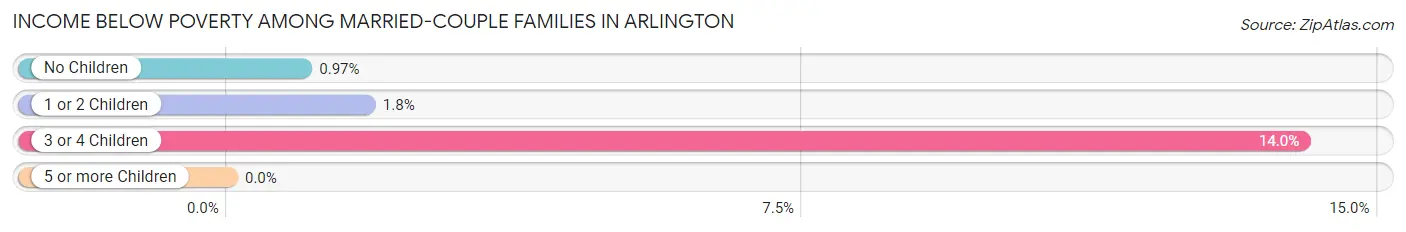
| Children | Above Poverty | Below Poverty |
| No Children | 1,841 (99.0%) | 18 (1.0%) |
| 1 or 2 Children | 1,635 (98.2%) | 30 (1.8%) |
| 3 or 4 Children | 405 (86.0%) | 66 (14.0%) |
| 5 or more Children | 15 (100.0%) | 0 (0.0%) |
| Total | 3,896 (97.2%) | 114 (2.8%) |
Income Below Poverty Among Single-Parent Households in Arlington
According to the poverty data in Arlington, 4.7% or 13 single-father households and 15.7% or 130 single-mother households are living below the poverty line. Among single-father households, those with no children have the highest poverty rate, with 13 households (9.8%) experiencing poverty. Likewise, among single-mother households, those with 1 or 2 children have the highest poverty rate, with 96 households (28.8%) falling below the poverty line.
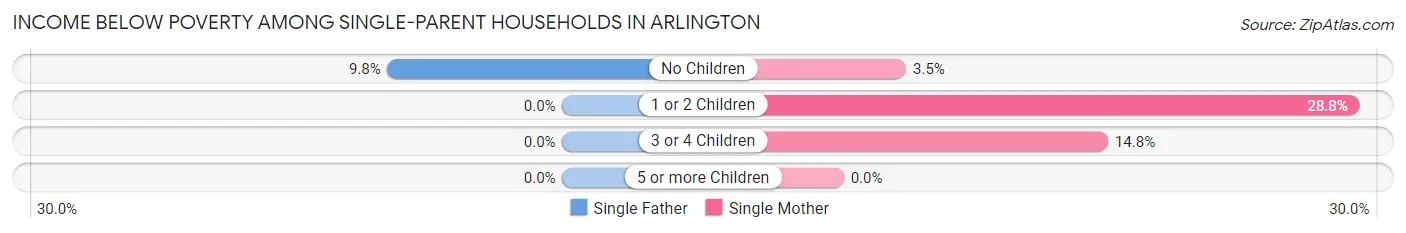
| Children | Single Father | Single Mother |
| No Children | 13 (9.8%) | 12 (3.5%) |
| 1 or 2 Children | 0 (0.0%) | 96 (28.8%) |
| 3 or 4 Children | 0 (0.0%) | 22 (14.8%) |
| 5 or more Children | 0 (0.0%) | 0 (0.0%) |
| Total | 13 (4.7%) | 130 (15.7%) |
Income Below Poverty Among Married-Couple vs Single-Parent Households in Arlington
The poverty data for Arlington shows that 114 of the married-couple family households (2.8%) and 143 of the single-parent households (13.0%) are living below the poverty level. Within the married-couple family households, those with 3 or 4 children have the highest poverty rate, with 66 households (14.0%) falling below the poverty line. Among the single-parent households, those with 1 or 2 children have the highest poverty rate, with 96 household (20.6%) living below poverty.
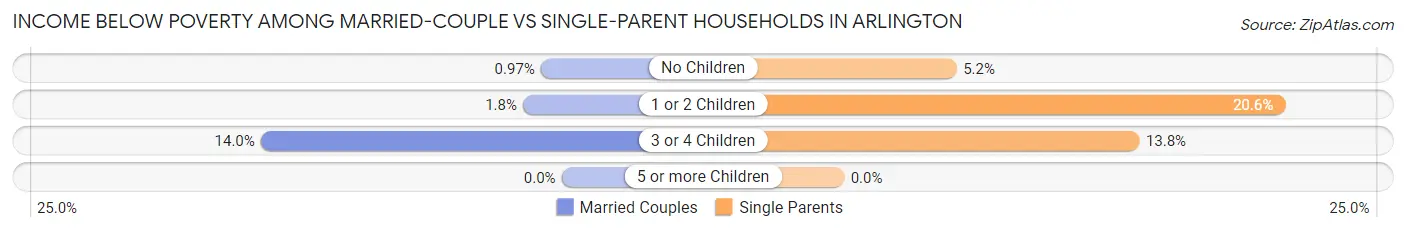
| Children | Married-Couple Families | Single-Parent Households |
| No Children | 18 (1.0%) | 25 (5.2%) |
| 1 or 2 Children | 30 (1.8%) | 96 (20.6%) |
| 3 or 4 Children | 66 (14.0%) | 22 (13.8%) |
| 5 or more Children | 0 (0.0%) | 0 (0.0%) |
| Total | 114 (2.8%) | 143 (13.0%) |
Race in Arlington
The most populous races in Arlington are White / Caucasian (15,510 | 76.5%), Hispanic or Latino (2,959 | 14.6%), and Two or more Races (1,953 | 9.6%).
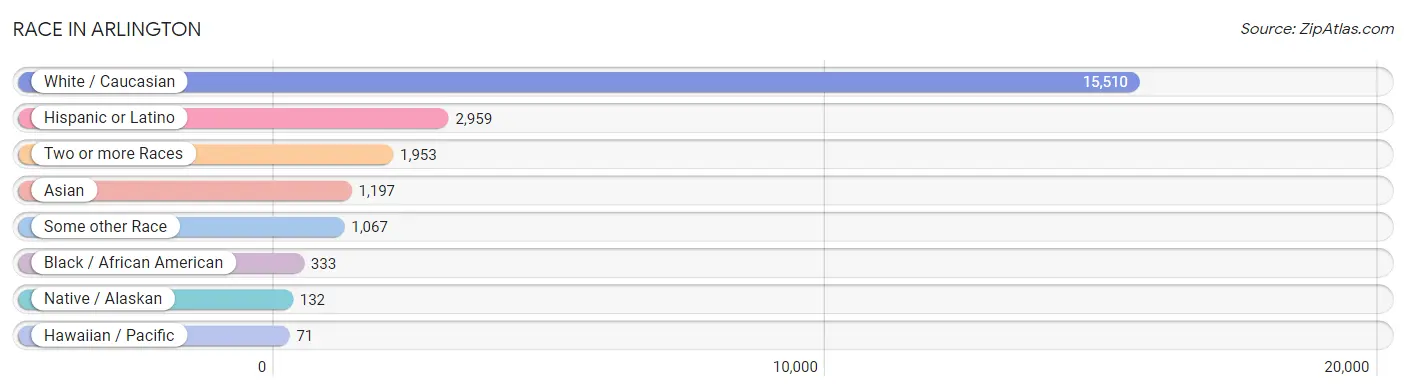
| Race | # Population | % Population |
| Asian | 1,197 | 5.9% |
| Black / African American | 333 | 1.6% |
| Hawaiian / Pacific | 71 | 0.4% |
| Hispanic or Latino | 2,959 | 14.6% |
| Native / Alaskan | 132 | 0.6% |
| White / Caucasian | 15,510 | 76.5% |
| Two or more Races | 1,953 | 9.6% |
| Some other Race | 1,067 | 5.3% |
| Total | 20,263 | 100.0% |
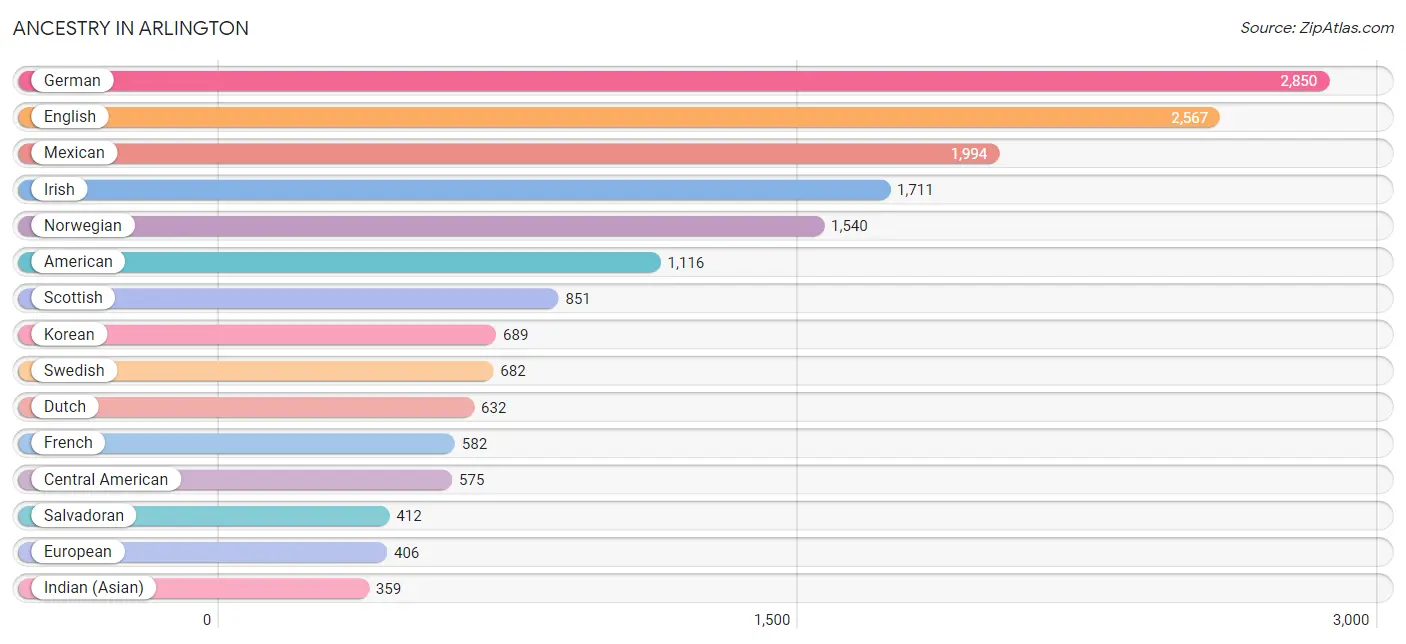
Ancestry in Arlington
The most populous ancestries reported in Arlington are German (2,850 | 14.1%), English (2,567 | 12.7%), Mexican (1,994 | 9.8%), Irish (1,711 | 8.4%), and Norwegian (1,540 | 7.6%), together accounting for 52.6% of all Arlington residents.
| Ancestry | # Population | % Population |
| Afghan | 4 | 0.0% |
| African | 36 | 0.2% |
| Alaska Native | 1 | 0.0% |
| Alaskan Athabascan | 5 | 0.0% |
| American | 1,116 | 5.5% |
| Belgian | 113 | 0.6% |
| Bhutanese | 320 | 1.6% |
| British | 94 | 0.5% |
| Burmese | 134 | 0.7% |
| Cambodian | 8 | 0.0% |
| Canadian | 93 | 0.5% |
| Central American | 575 | 2.8% |
| Cherokee | 9 | 0.0% |
| Choctaw | 78 | 0.4% |
| Colombian | 67 | 0.3% |
| Croatian | 11 | 0.1% |
| Czech | 45 | 0.2% |
| Danish | 266 | 1.3% |
| Delaware | 27 | 0.1% |
| Dominican | 50 | 0.3% |
| Dutch | 632 | 3.1% |
| Eastern European | 30 | 0.2% |
| English | 2,567 | 12.7% |
| European | 406 | 2.0% |
| Finnish | 25 | 0.1% |
| French | 582 | 2.9% |
| French American Indian | 19 | 0.1% |
| French Canadian | 44 | 0.2% |
| German | 2,850 | 14.1% |
| Greek | 139 | 0.7% |
| Guamanian / Chamorro | 112 | 0.5% |
| Guatemalan | 129 | 0.6% |
| Honduran | 9 | 0.0% |
| Hungarian | 81 | 0.4% |
| Indian (Asian) | 359 | 1.8% |
| Inupiat | 4 | 0.0% |
| Irish | 1,711 | 8.4% |
| Italian | 346 | 1.7% |
| Korean | 689 | 3.4% |
| Laotian | 10 | 0.1% |
| Lithuanian | 11 | 0.1% |
| Mexican | 1,994 | 9.8% |
| Native Hawaiian | 169 | 0.8% |
| New Zealander | 62 | 0.3% |
| Nigerian | 89 | 0.4% |
| Northern European | 130 | 0.6% |
| Norwegian | 1,540 | 7.6% |
| Panamanian | 25 | 0.1% |
| Polish | 264 | 1.3% |
| Portuguese | 41 | 0.2% |
| Potawatomi | 26 | 0.1% |
| Puerto Rican | 110 | 0.5% |
| Puget Sound Salish | 129 | 0.6% |
| Romanian | 8 | 0.0% |
| Russian | 120 | 0.6% |
| Salvadoran | 412 | 2.0% |
| Scandinavian | 192 | 0.9% |
| Scotch-Irish | 100 | 0.5% |
| Scottish | 851 | 4.2% |
| Sioux | 9 | 0.0% |
| Slavic | 16 | 0.1% |
| South American | 67 | 0.3% |
| Spaniard | 102 | 0.5% |
| Spanish | 53 | 0.3% |
| Sri Lankan | 134 | 0.7% |
| Subsaharan African | 125 | 0.6% |
| Swedish | 682 | 3.4% |
| Swiss | 57 | 0.3% |
| Thai | 50 | 0.3% |
| Tlingit-Haida | 37 | 0.2% |
| Tsimshian | 50 | 0.3% |
| Ukrainian | 50 | 0.3% |
| Welsh | 99 | 0.5% | View All 73 Rows |
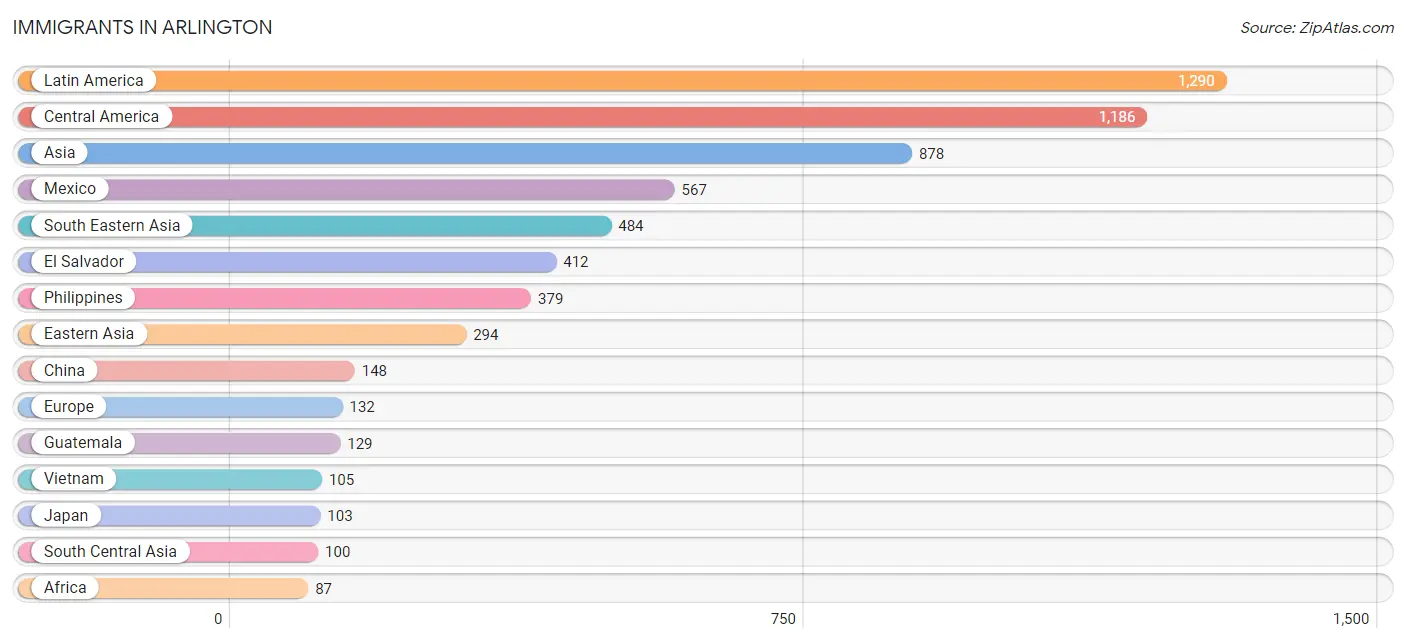
Immigrants in Arlington
The most numerous immigrant groups reported in Arlington came from Latin America (1,290 | 6.4%), Central America (1,186 | 5.9%), Asia (878 | 4.3%), Mexico (567 | 2.8%), and South Eastern Asia (484 | 2.4%), together accounting for 21.7% of all Arlington residents.
| Immigration Origin | # Population | % Population |
| Afghanistan | 13 | 0.1% |
| Africa | 87 | 0.4% |
| Asia | 878 | 4.3% |
| Canada | 43 | 0.2% |
| Caribbean | 32 | 0.2% |
| Central America | 1,186 | 5.9% |
| China | 148 | 0.7% |
| Colombia | 72 | 0.4% |
| Dominica | 32 | 0.2% |
| Eastern Asia | 294 | 1.5% |
| Eastern Europe | 72 | 0.4% |
| El Salvador | 412 | 2.0% |
| England | 6 | 0.0% |
| Europe | 132 | 0.6% |
| Germany | 22 | 0.1% |
| Guatemala | 129 | 0.6% |
| Honduras | 66 | 0.3% |
| India | 28 | 0.1% |
| Italy | 9 | 0.0% |
| Japan | 103 | 0.5% |
| Korea | 43 | 0.2% |
| Latin America | 1,290 | 6.4% |
| Mexico | 567 | 2.8% |
| Nigeria | 52 | 0.3% |
| Northern Europe | 29 | 0.1% |
| Oceania | 30 | 0.2% |
| Panama | 12 | 0.1% |
| Philippines | 379 | 1.9% |
| Russia | 34 | 0.2% |
| South America | 72 | 0.4% |
| South Central Asia | 100 | 0.5% |
| South Eastern Asia | 484 | 2.4% |
| Southern Europe | 9 | 0.0% |
| Sri Lanka | 59 | 0.3% |
| Taiwan | 43 | 0.2% |
| Ukraine | 38 | 0.2% |
| Vietnam | 105 | 0.5% |
| Western Africa | 87 | 0.4% |
| Western Europe | 22 | 0.1% | View All 39 Rows |
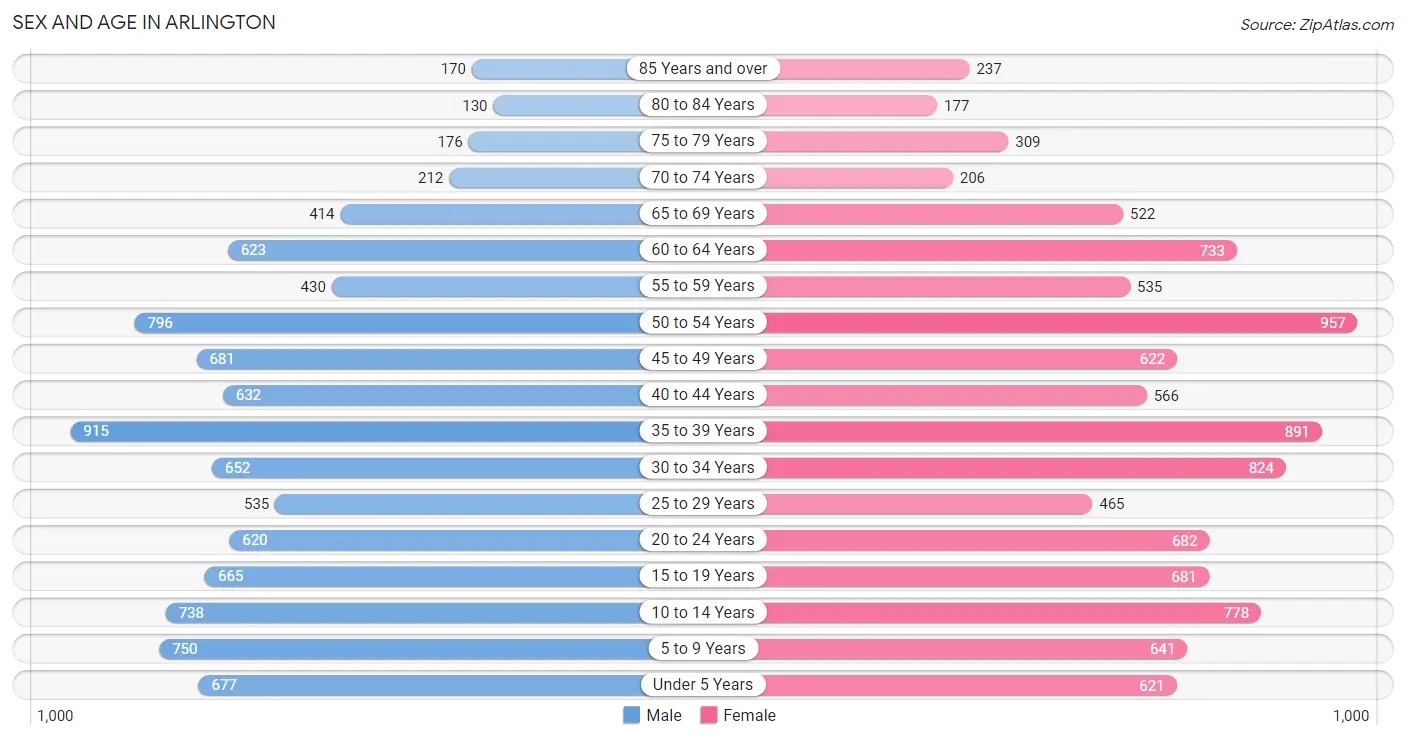
Sex and Age in Arlington
Sex and Age in Arlington
The most populous age groups in Arlington are 35 to 39 Years (915 | 9.3%) for men and 50 to 54 Years (957 | 9.2%) for women.
| Age Bracket | Male | Female |
| Under 5 Years | 677 (6.9%) | 621 (5.9%) |
| 5 to 9 Years | 750 (7.6%) | 641 (6.1%) |
| 10 to 14 Years | 738 (7.5%) | 778 (7.4%) |
| 15 to 19 Years | 665 (6.8%) | 681 (6.5%) |
| 20 to 24 Years | 620 (6.3%) | 682 (6.5%) |
| 25 to 29 Years | 535 (5.4%) | 465 (4.4%) |
| 30 to 34 Years | 652 (6.6%) | 824 (7.9%) |
| 35 to 39 Years | 915 (9.3%) | 891 (8.5%) |
| 40 to 44 Years | 632 (6.4%) | 566 (5.4%) |
| 45 to 49 Years | 681 (6.9%) | 622 (5.9%) |
| 50 to 54 Years | 796 (8.1%) | 957 (9.2%) |
| 55 to 59 Years | 430 (4.4%) | 535 (5.1%) |
| 60 to 64 Years | 623 (6.4%) | 733 (7.0%) |
| 65 to 69 Years | 414 (4.2%) | 522 (5.0%) |
| 70 to 74 Years | 212 (2.2%) | 206 (2.0%) |
| 75 to 79 Years | 176 (1.8%) | 309 (3.0%) |
| 80 to 84 Years | 130 (1.3%) | 177 (1.7%) |
| 85 Years and over | 170 (1.7%) | 237 (2.3%) |
| Total | 9,816 (100.0%) | 10,447 (100.0%) |
Families and Households in Arlington
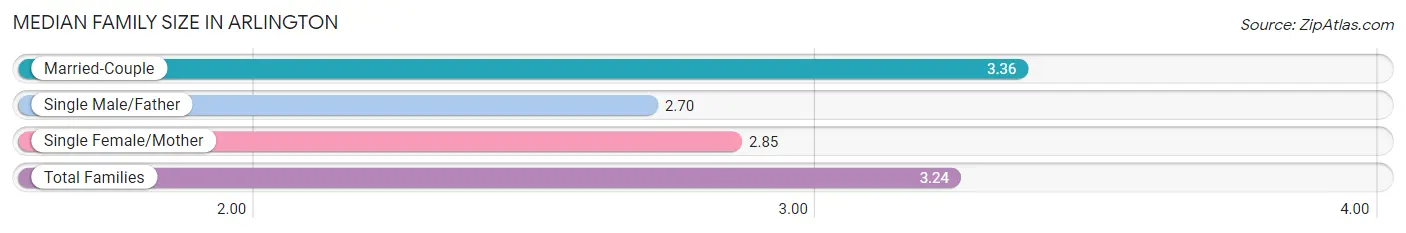
Median Family Size in Arlington
The median family size in Arlington is 3.24 persons per family, with married-couple families (4,010 | 78.4%) accounting for the largest median family size of 3.36 persons per family. On the other hand, single male/father families (278 | 5.4%) represent the smallest median family size with 2.70 persons per family.
| Family Type | # Families | Family Size |
| Married-Couple | 4,010 (78.4%) | 3.36 |
| Single Male/Father | 278 (5.4%) | 2.70 |
| Single Female/Mother | 826 (16.2%) | 2.85 |
| Total Families | 5,114 (100.0%) | 3.24 |
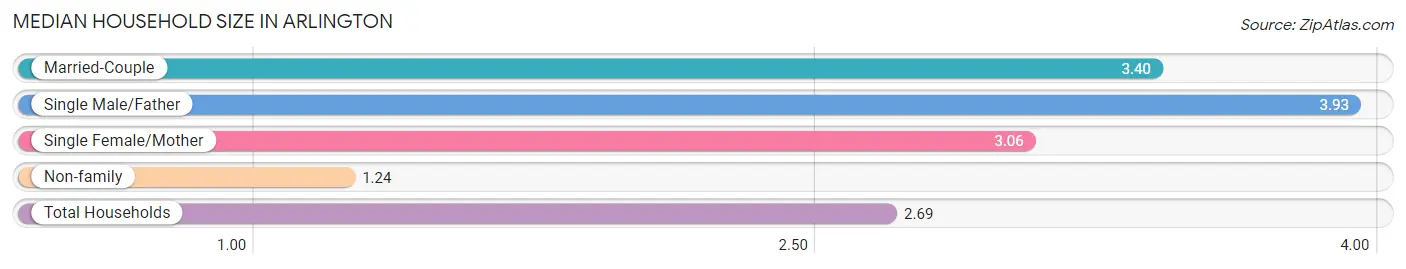
Median Household Size in Arlington
The median household size in Arlington is 2.69 persons per household, with single male/father households (278 | 3.7%) accounting for the largest median household size of 3.93 persons per household. non-family households (2,388 | 31.8%) represent the smallest median household size with 1.24 persons per household.
| Household Type | # Households | Household Size |
| Married-Couple | 4,010 (53.4%) | 3.40 |
| Single Male/Father | 278 (3.7%) | 3.93 |
| Single Female/Mother | 826 (11.0%) | 3.06 |
| Non-family | 2,388 (31.8%) | 1.24 |
| Total Households | 7,502 (100.0%) | 2.69 |
Household Size by Marriage Status in Arlington
Out of a total of 7,502 households in Arlington, 5,114 (68.2%) are family households, while 2,388 (31.8%) are nonfamily households. The most numerous type of family households are 2-person households, comprising 1,850, and the most common type of nonfamily households are 1-person households, comprising 1,960.
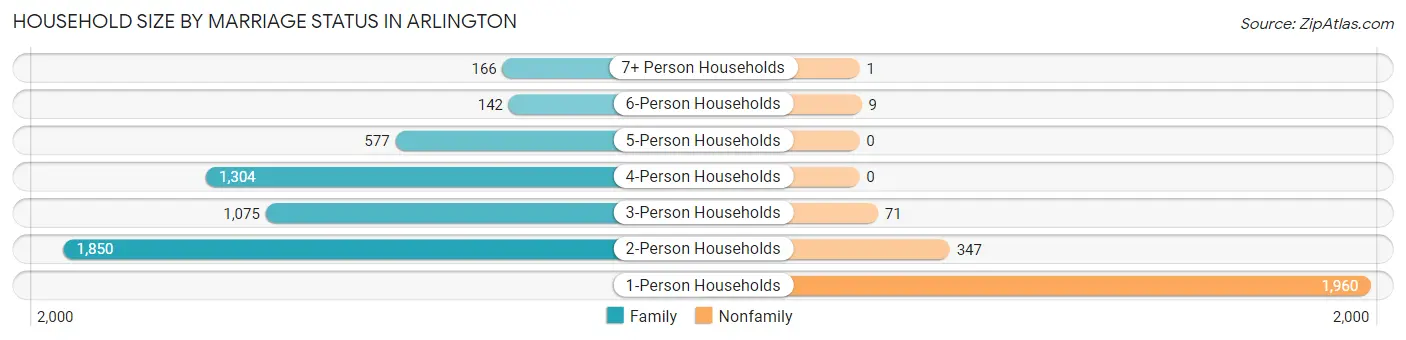
| Household Size | Family Households | Nonfamily Households |
| 1-Person Households | - | 1,960 (26.1%) |
| 2-Person Households | 1,850 (24.7%) | 347 (4.6%) |
| 3-Person Households | 1,075 (14.3%) | 71 (0.9%) |
| 4-Person Households | 1,304 (17.4%) | 0 (0.0%) |
| 5-Person Households | 577 (7.7%) | 0 (0.0%) |
| 6-Person Households | 142 (1.9%) | 9 (0.1%) |
| 7+ Person Households | 166 (2.2%) | 1 (0.0%) |
| Total | 5,114 (68.2%) | 2,388 (31.8%) |
Female Fertility in Arlington
Fertility by Age in Arlington
Average fertility rate in Arlington is 59.0 births per 1,000 women. Women in the age bracket of 20 to 34 years have the highest fertility rate with 78.0 births per 1,000 women. Women in the age bracket of 20 to 34 years acount for 52.0% of all women with births.
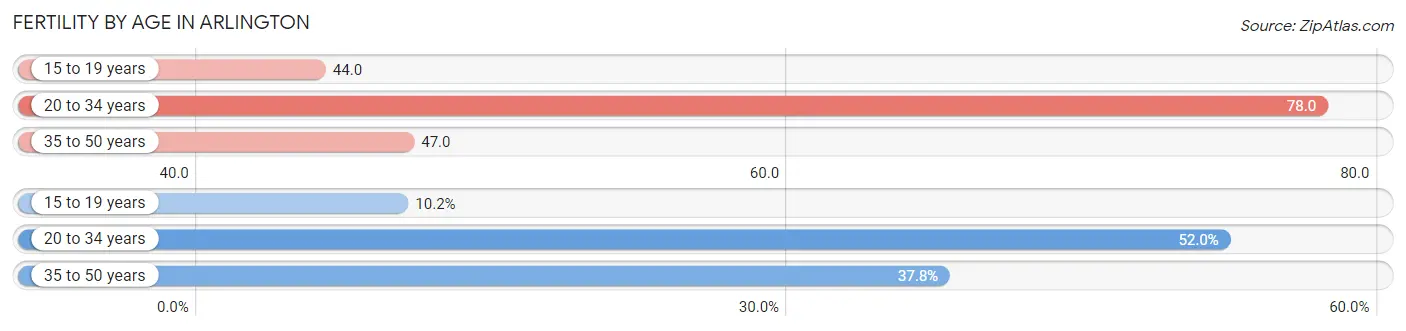
| Age Bracket | Women with Births | Births / 1,000 Women |
| 15 to 19 years | 30 (10.2%) | 44.0 |
| 20 to 34 years | 153 (52.0%) | 78.0 |
| 35 to 50 years | 111 (37.8%) | 47.0 |
| Total | 294 (100.0%) | 59.0 |
Fertility by Age by Marriage Status in Arlington
80.3% of women with births (294) in Arlington are married. The highest percentage of unmarried women with births falls into 15 to 19 years age bracket with 100.0% of them unmarried at the time of birth, while the lowest percentage of unmarried women with births belong to 20 to 34 years age bracket with 0.0% of them unmarried.
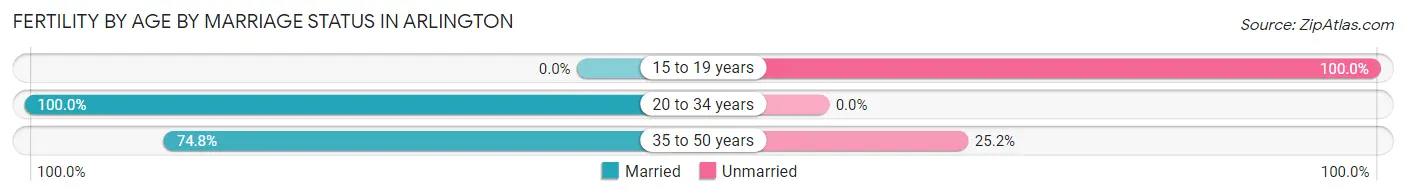
| Age Bracket | Married | Unmarried |
| 15 to 19 years | 0 (0.0%) | 30 (100.0%) |
| 20 to 34 years | 153 (100.0%) | 0 (0.0%) |
| 35 to 50 years | 83 (74.8%) | 28 (25.2%) |
| Total | 236 (80.3%) | 58 (19.7%) |
Fertility by Education in Arlington
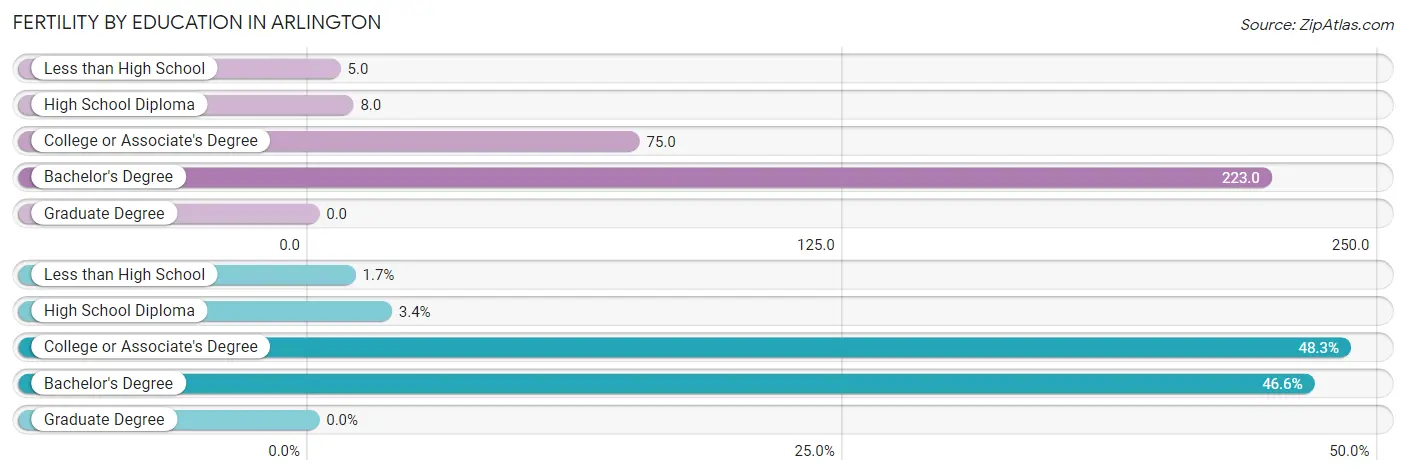
| Educational Attainment | Women with Births | Births / 1,000 Women |
| Less than High School | 5 (1.7%) | 5.0 |
| High School Diploma | 10 (3.4%) | 8.0 |
| College or Associate's Degree | 142 (48.3%) | 75.0 |
| Bachelor's Degree | 137 (46.6%) | 223.0 |
| Graduate Degree | 0 (0.0%) | 0.0 |
| Total | 294 (100.0%) | 59.0 |
Fertility by Education by Marriage Status in Arlington
19.7% of women with births in Arlington are unmarried. Women with the educational attainment of less than high school are most likely to be married with 100.0% of them married at childbirth, while women with the educational attainment of college or associate's degree are least likely to be married with 40.8% of them unmarried at childbirth.
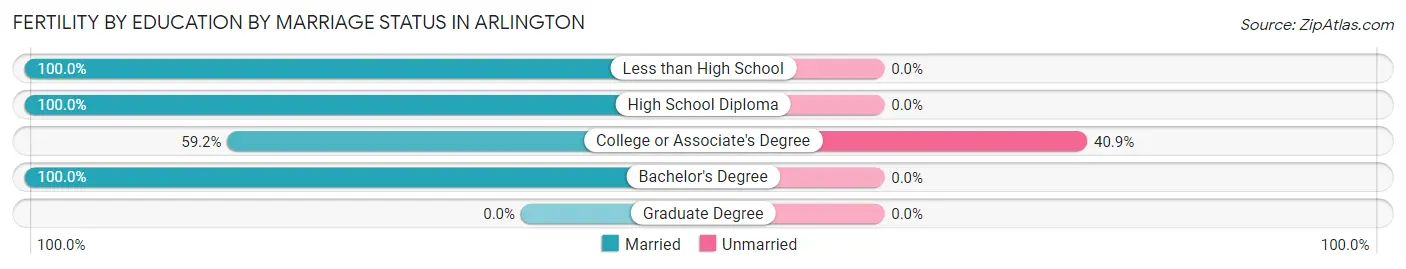
| Educational Attainment | Married | Unmarried |
| Less than High School | 5 (100.0%) | 0 (0.0%) |
| High School Diploma | 10 (100.0%) | 0 (0.0%) |
| College or Associate's Degree | 84 (59.2%) | 58 (40.8%) |
| Bachelor's Degree | 137 (100.0%) | 0 (0.0%) |
| Graduate Degree | 0 (0.0%) | 0 (0.0%) |
| Total | 236 (80.3%) | 58 (19.7%) |
Employment Characteristics in Arlington
Employment by Class of Employer in Arlington
Among the 10,228 employed individuals in Arlington, private company employees (7,562 | 73.9%), local government employees (808 | 7.9%), and not-for-profit organizations (627 | 6.1%) make up the most common classes of employment.
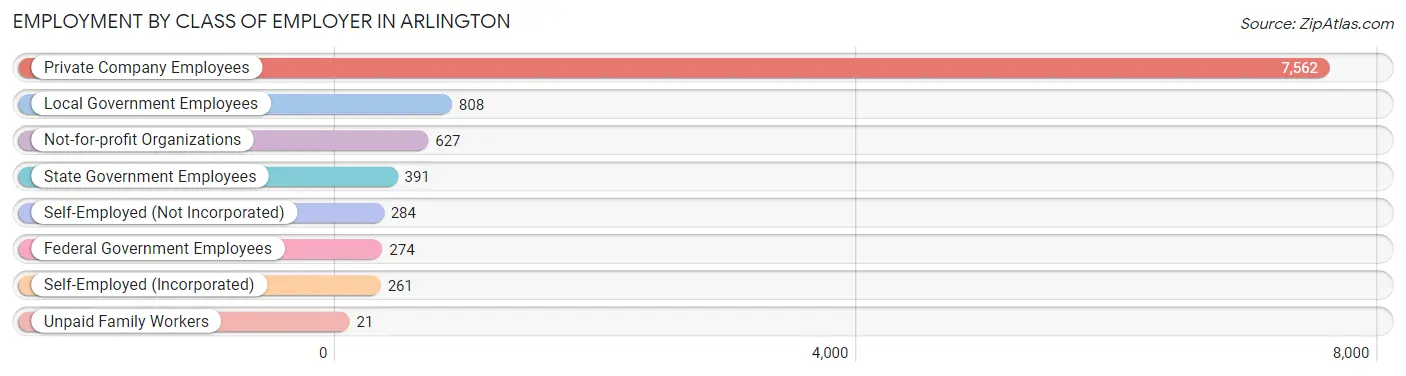
| Employer Class | # Employees | % Employees |
| Private Company Employees | 7,562 | 73.9% |
| Self-Employed (Incorporated) | 261 | 2.5% |
| Self-Employed (Not Incorporated) | 284 | 2.8% |
| Not-for-profit Organizations | 627 | 6.1% |
| Local Government Employees | 808 | 7.9% |
| State Government Employees | 391 | 3.8% |
| Federal Government Employees | 274 | 2.7% |
| Unpaid Family Workers | 21 | 0.2% |
| Total | 10,228 | 100.0% |
Employment Status by Age in Arlington
According to the labor force statistics for Arlington, out of the total population over 16 years of age (15,852), 67.8% or 10,748 individuals are in the labor force, with 3.8% or 408 of them unemployed. The age group with the highest labor force participation rate is 25 to 29 years, with 90.9% or 909 individuals in the labor force. Within the labor force, the 20 to 24 years age range has the highest percentage of unemployed individuals, with 15.9% or 183 of them being unemployed.
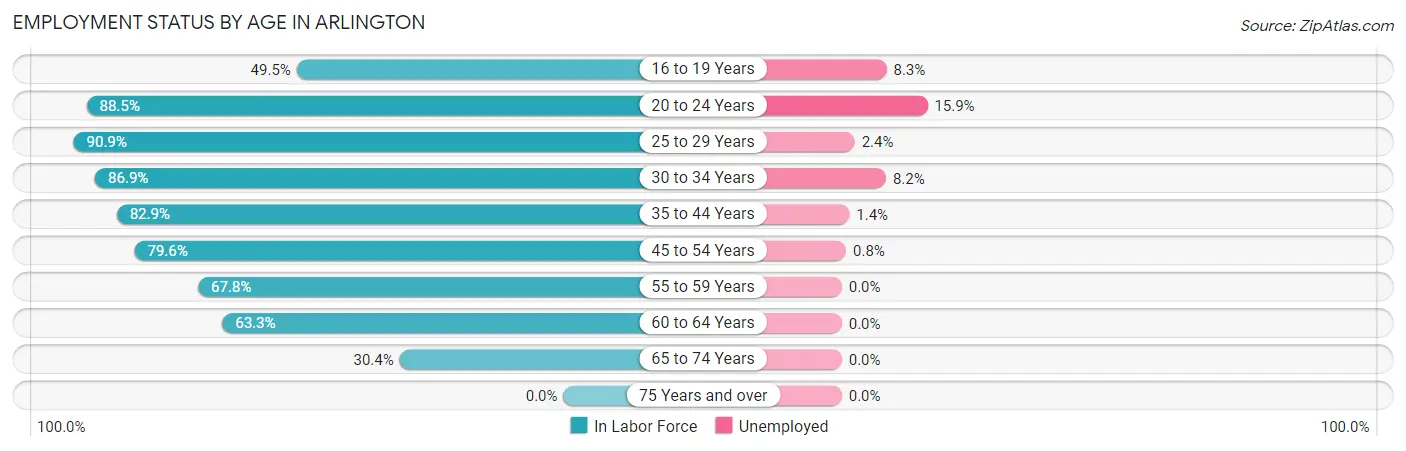
| Age Bracket | In Labor Force | Unemployed |
| 16 to 19 Years | 564 (49.5%) | 47 (8.3%) |
| 20 to 24 Years | 1,152 (88.5%) | 183 (15.9%) |
| 25 to 29 Years | 909 (90.9%) | 22 (2.4%) |
| 30 to 34 Years | 1,283 (86.9%) | 105 (8.2%) |
| 35 to 44 Years | 2,490 (82.9%) | 35 (1.4%) |
| 45 to 54 Years | 2,433 (79.6%) | 19 (0.8%) |
| 55 to 59 Years | 654 (67.8%) | 0 (0.0%) |
| 60 to 64 Years | 858 (63.3%) | 0 (0.0%) |
| 65 to 74 Years | 412 (30.4%) | 0 (0.0%) |
| 75 Years and over | 0 (0.0%) | 0 (0.0%) |
| Total | 10,748 (67.8%) | 408 (3.8%) |
Employment Status by Educational Attainment in Arlington
According to labor force statistics for Arlington, 79.4% of individuals (8,620) out of the total population between 25 and 64 years of age (10,857) are in the labor force, with 2.1% or 181 of them being unemployed. The group with the highest labor force participation rate are those with the educational attainment of bachelor's degree or higher, with 87.1% or 2,070 individuals in the labor force. Within the labor force, individuals with less than high school education have the highest percentage of unemployment, with 14.7% or 105 of them being unemployed.
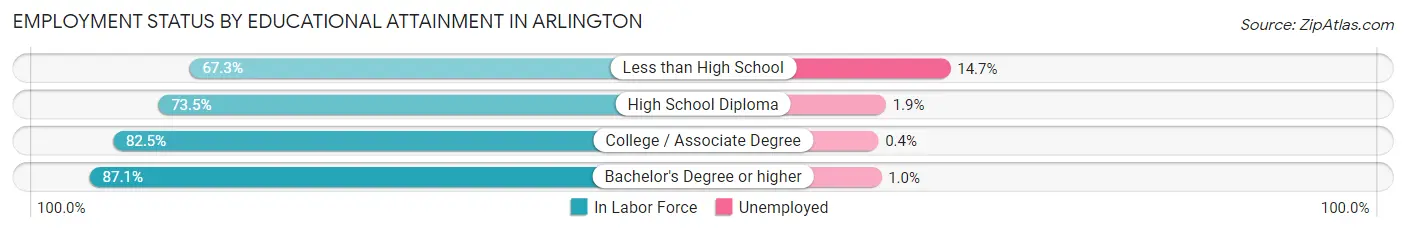
| Educational Attainment | In Labor Force | Unemployed |
| Less than High School | 713 (67.3%) | 156 (14.7%) |
| High School Diploma | 2,309 (73.5%) | 60 (1.9%) |
| College / Associate Degree | 3,531 (82.5%) | 17 (0.4%) |
| Bachelor's Degree or higher | 2,070 (87.1%) | 24 (1.0%) |
| Total | 8,620 (79.4%) | 228 (2.1%) |
Employment Occupations by Sex in Arlington
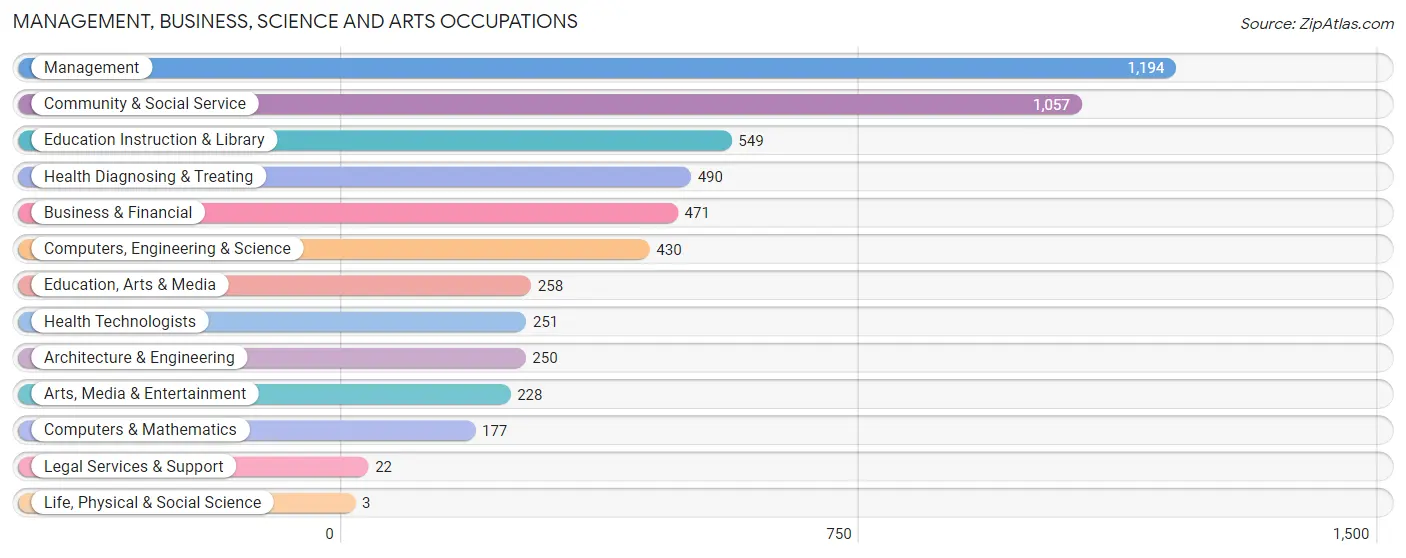
Management, Business, Science and Arts Occupations
The most common Management, Business, Science and Arts occupations in Arlington are Management (1,194 | 11.6%), Community & Social Service (1,057 | 10.3%), Education Instruction & Library (549 | 5.3%), Health Diagnosing & Treating (490 | 4.8%), and Business & Financial (471 | 4.6%).
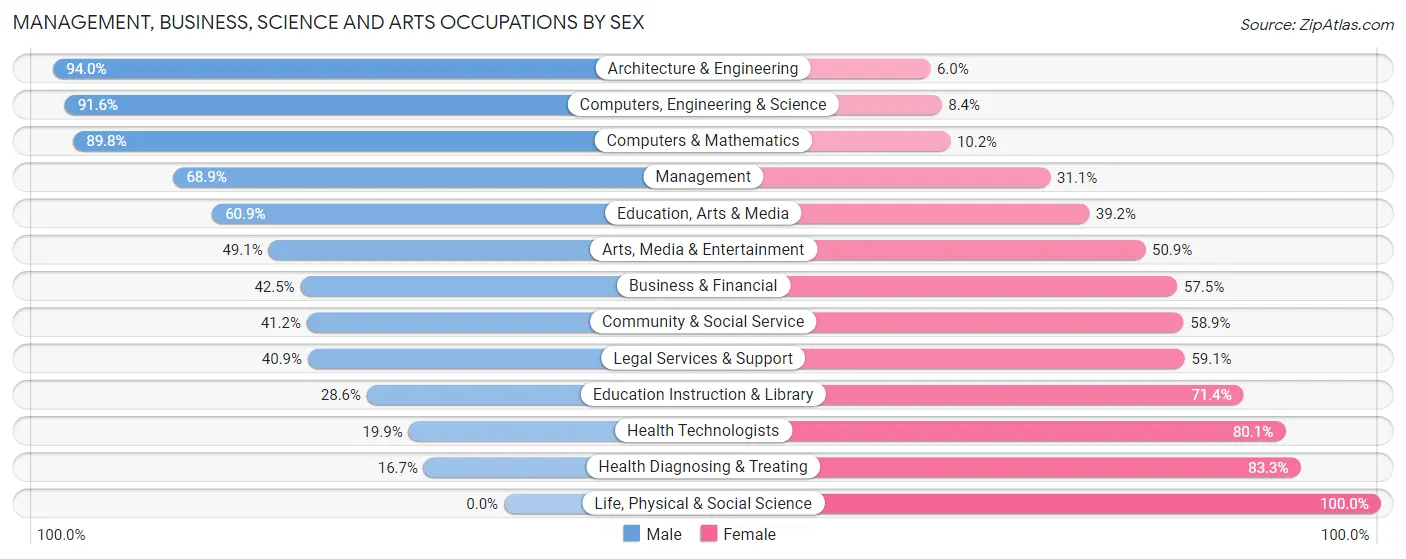
Management, Business, Science and Arts Occupations by Sex
Within the Management, Business, Science and Arts occupations in Arlington, the most male-oriented occupations are Architecture & Engineering (94.0%), Computers, Engineering & Science (91.6%), and Computers & Mathematics (89.8%), while the most female-oriented occupations are Life, Physical & Social Science (100.0%), Health Diagnosing & Treating (83.3%), and Health Technologists (80.1%).
| Occupation | Male | Female |
| Management | 823 (68.9%) | 371 (31.1%) |
| Business & Financial | 200 (42.5%) | 271 (57.5%) |
| Computers, Engineering & Science | 394 (91.6%) | 36 (8.4%) |
| Computers & Mathematics | 159 (89.8%) | 18 (10.2%) |
| Architecture & Engineering | 235 (94.0%) | 15 (6.0%) |
| Life, Physical & Social Science | 0 (0.0%) | 3 (100.0%) |
| Community & Social Service | 435 (41.1%) | 622 (58.9%) |
| Education, Arts & Media | 157 (60.9%) | 101 (39.2%) |
| Legal Services & Support | 9 (40.9%) | 13 (59.1%) |
| Education Instruction & Library | 157 (28.6%) | 392 (71.4%) |
| Arts, Media & Entertainment | 112 (49.1%) | 116 (50.9%) |
| Health Diagnosing & Treating | 82 (16.7%) | 408 (83.3%) |
| Health Technologists | 50 (19.9%) | 201 (80.1%) |
| Total (Category) | 1,934 (53.1%) | 1,708 (46.9%) |
| Total (Overall) | 5,436 (52.8%) | 4,861 (47.2%) |
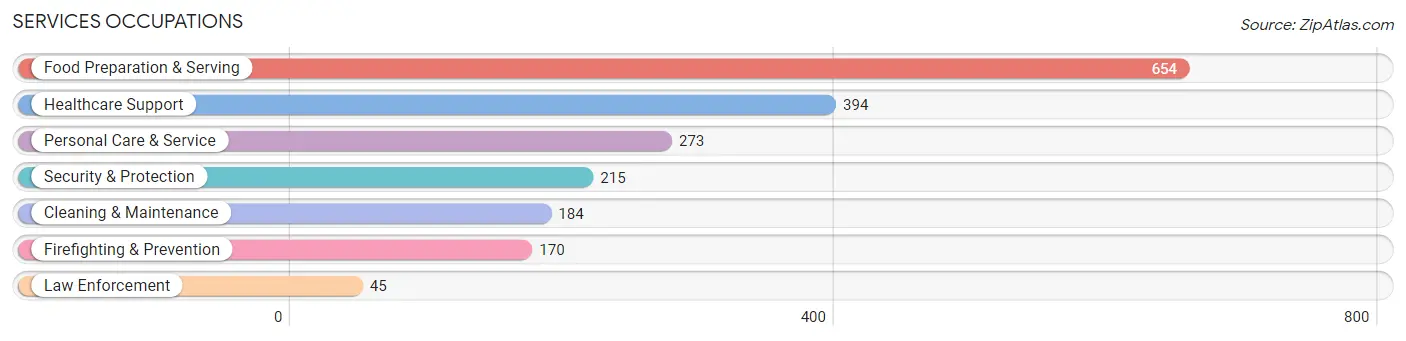
Services Occupations
The most common Services occupations in Arlington are Food Preparation & Serving (654 | 6.4%), Healthcare Support (394 | 3.8%), Personal Care & Service (273 | 2.6%), Security & Protection (215 | 2.1%), and Cleaning & Maintenance (184 | 1.8%).
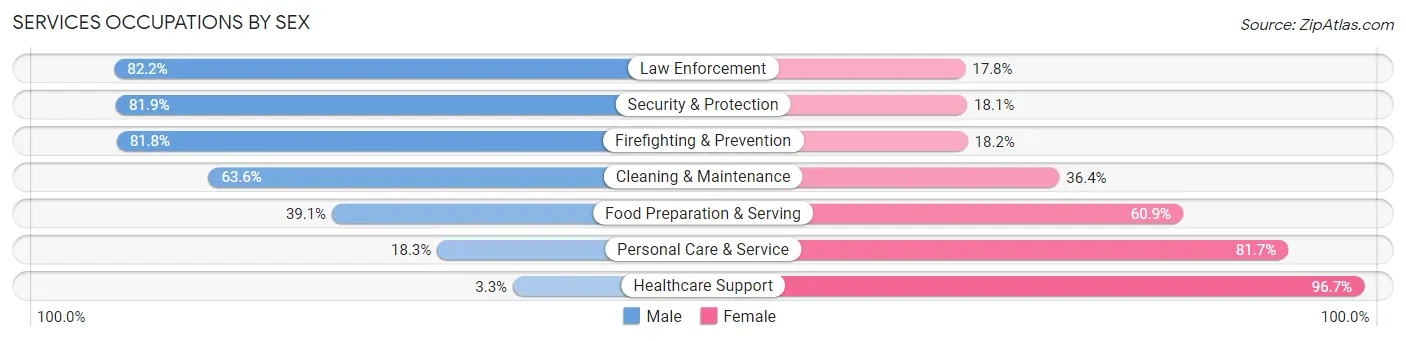
Services Occupations by Sex
Within the Services occupations in Arlington, the most male-oriented occupations are Law Enforcement (82.2%), Security & Protection (81.9%), and Firefighting & Prevention (81.8%), while the most female-oriented occupations are Healthcare Support (96.7%), Personal Care & Service (81.7%), and Food Preparation & Serving (60.9%).
| Occupation | Male | Female |
| Healthcare Support | 13 (3.3%) | 381 (96.7%) |
| Security & Protection | 176 (81.9%) | 39 (18.1%) |
| Firefighting & Prevention | 139 (81.8%) | 31 (18.2%) |
| Law Enforcement | 37 (82.2%) | 8 (17.8%) |
| Food Preparation & Serving | 256 (39.1%) | 398 (60.9%) |
| Cleaning & Maintenance | 117 (63.6%) | 67 (36.4%) |
| Personal Care & Service | 50 (18.3%) | 223 (81.7%) |
| Total (Category) | 612 (35.6%) | 1,108 (64.4%) |
| Total (Overall) | 5,436 (52.8%) | 4,861 (47.2%) |
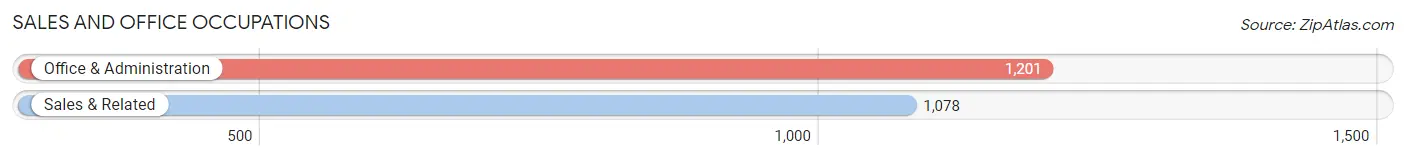
Sales and Office Occupations
The most common Sales and Office occupations in Arlington are Office & Administration (1,201 | 11.7%), and Sales & Related (1,078 | 10.5%).
Sales and Office Occupations by Sex
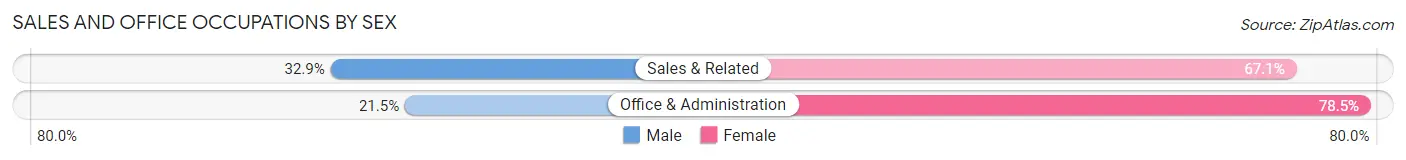
| Occupation | Male | Female |
| Sales & Related | 355 (32.9%) | 723 (67.1%) |
| Office & Administration | 258 (21.5%) | 943 (78.5%) |
| Total (Category) | 613 (26.9%) | 1,666 (73.1%) |
| Total (Overall) | 5,436 (52.8%) | 4,861 (47.2%) |
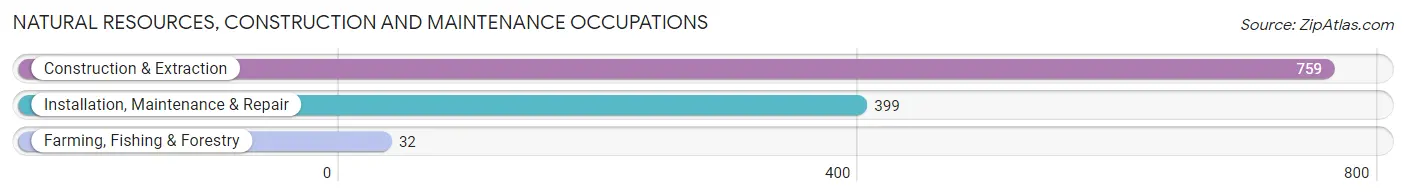
Natural Resources, Construction and Maintenance Occupations
The most common Natural Resources, Construction and Maintenance occupations in Arlington are Construction & Extraction (759 | 7.4%), Installation, Maintenance & Repair (399 | 3.9%), and Farming, Fishing & Forestry (32 | 0.3%).
Natural Resources, Construction and Maintenance Occupations by Sex
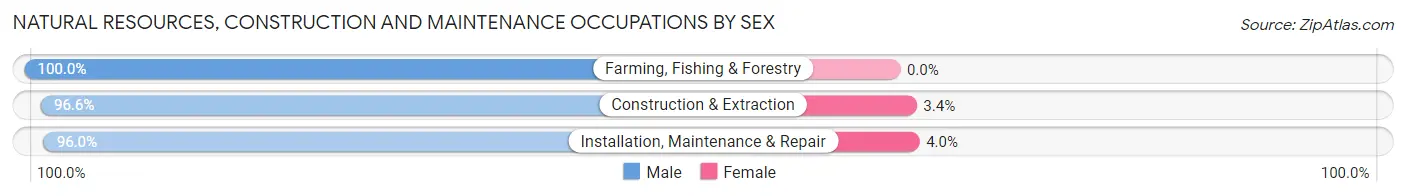
| Occupation | Male | Female |
| Farming, Fishing & Forestry | 32 (100.0%) | 0 (0.0%) |
| Construction & Extraction | 733 (96.6%) | 26 (3.4%) |
| Installation, Maintenance & Repair | 383 (96.0%) | 16 (4.0%) |
| Total (Category) | 1,148 (96.5%) | 42 (3.5%) |
| Total (Overall) | 5,436 (52.8%) | 4,861 (47.2%) |
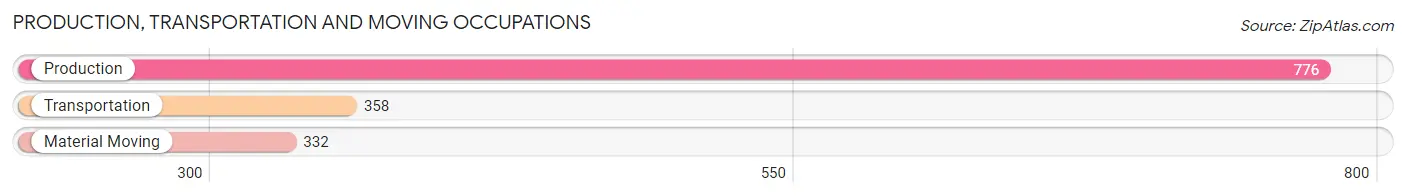
Production, Transportation and Moving Occupations
The most common Production, Transportation and Moving occupations in Arlington are Production (776 | 7.5%), Transportation (358 | 3.5%), and Material Moving (332 | 3.2%).
Production, Transportation and Moving Occupations by Sex
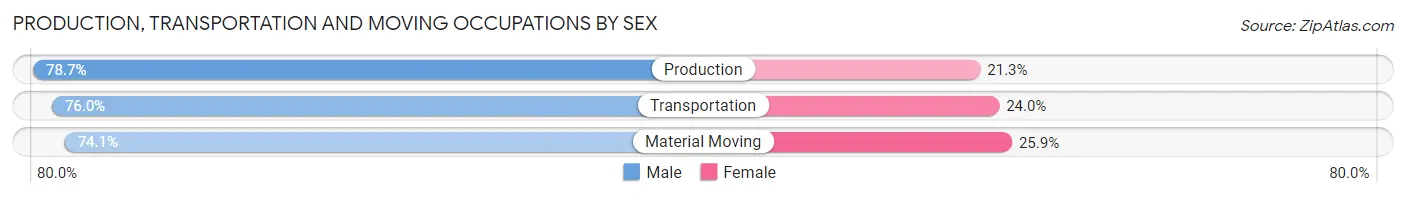
| Occupation | Male | Female |
| Production | 611 (78.7%) | 165 (21.3%) |
| Transportation | 272 (76.0%) | 86 (24.0%) |
| Material Moving | 246 (74.1%) | 86 (25.9%) |
| Total (Category) | 1,129 (77.0%) | 337 (23.0%) |
| Total (Overall) | 5,436 (52.8%) | 4,861 (47.2%) |
Employment Industries by Sex in Arlington
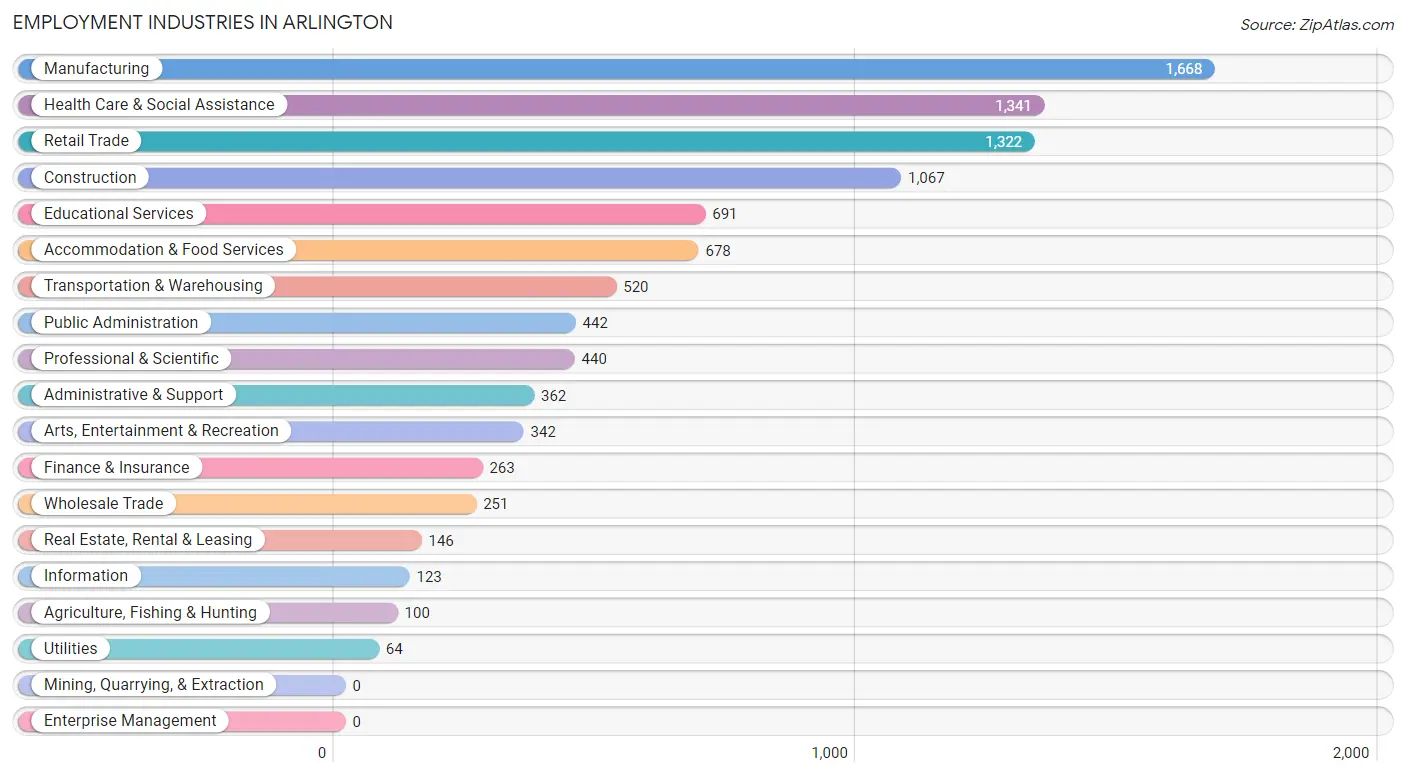
Employment Industries in Arlington
The major employment industries in Arlington include Manufacturing (1,668 | 16.2%), Health Care & Social Assistance (1,341 | 13.0%), Retail Trade (1,322 | 12.8%), Construction (1,067 | 10.4%), and Educational Services (691 | 6.7%).
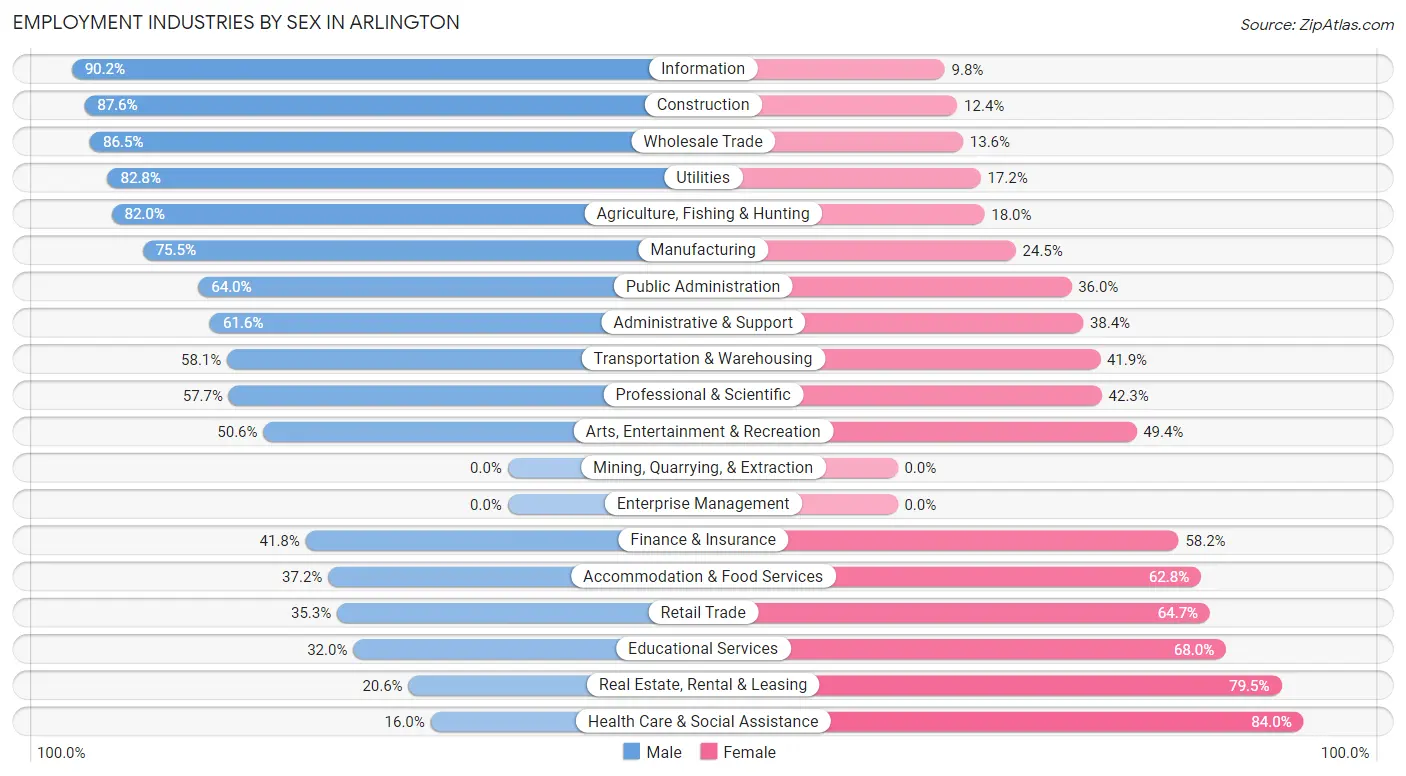
Employment Industries by Sex in Arlington
The Arlington industries that see more men than women are Information (90.2%), Construction (87.6%), and Wholesale Trade (86.5%), whereas the industries that tend to have a higher number of women are Health Care & Social Assistance (84.0%), Real Estate, Rental & Leasing (79.4%), and Educational Services (68.0%).
| Industry | Male | Female |
| Agriculture, Fishing & Hunting | 82 (82.0%) | 18 (18.0%) |
| Mining, Quarrying, & Extraction | 0 (0.0%) | 0 (0.0%) |
| Construction | 935 (87.6%) | 132 (12.4%) |
| Manufacturing | 1,260 (75.5%) | 408 (24.5%) |
| Wholesale Trade | 217 (86.5%) | 34 (13.6%) |
| Retail Trade | 467 (35.3%) | 855 (64.7%) |
| Transportation & Warehousing | 302 (58.1%) | 218 (41.9%) |
| Utilities | 53 (82.8%) | 11 (17.2%) |
| Information | 111 (90.2%) | 12 (9.8%) |
| Finance & Insurance | 110 (41.8%) | 153 (58.2%) |
| Real Estate, Rental & Leasing | 30 (20.5%) | 116 (79.4%) |
| Professional & Scientific | 254 (57.7%) | 186 (42.3%) |
| Enterprise Management | 0 (0.0%) | 0 (0.0%) |
| Administrative & Support | 223 (61.6%) | 139 (38.4%) |
| Educational Services | 221 (32.0%) | 470 (68.0%) |
| Health Care & Social Assistance | 214 (16.0%) | 1,127 (84.0%) |
| Arts, Entertainment & Recreation | 173 (50.6%) | 169 (49.4%) |
| Accommodation & Food Services | 252 (37.2%) | 426 (62.8%) |
| Public Administration | 283 (64.0%) | 159 (36.0%) |
| Total | 5,436 (52.8%) | 4,861 (47.2%) |
Education in Arlington
School Enrollment in Arlington
The most common levels of schooling among the 5,034 students in Arlington are middle school (1,304 | 25.9%), elementary school (1,067 | 21.2%), and high school (967 | 19.2%).
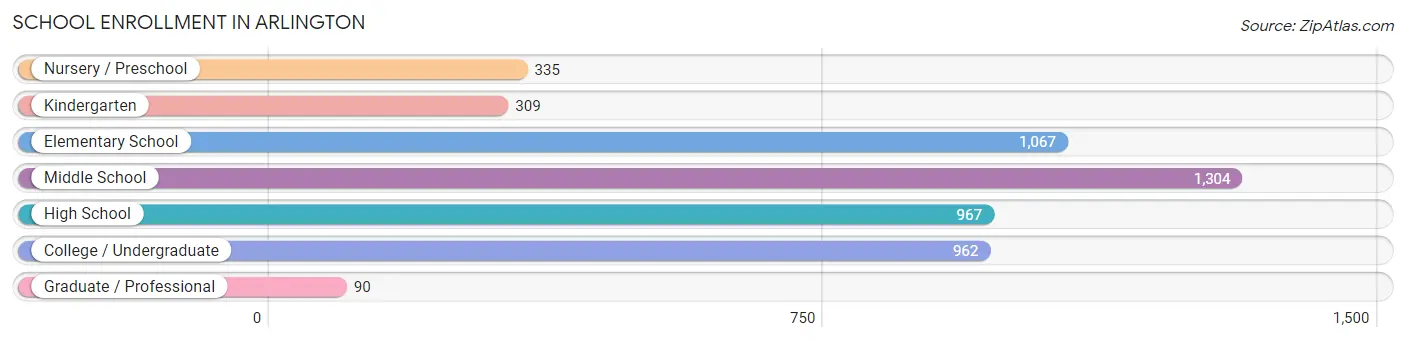
| School Level | # Students | % Students |
| Nursery / Preschool | 335 | 6.7% |
| Kindergarten | 309 | 6.1% |
| Elementary School | 1,067 | 21.2% |
| Middle School | 1,304 | 25.9% |
| High School | 967 | 19.2% |
| College / Undergraduate | 962 | 19.1% |
| Graduate / Professional | 90 | 1.8% |
| Total | 5,034 | 100.0% |
School Enrollment by Age by Funding Source in Arlington
Out of a total of 5,034 students who are enrolled in schools in Arlington, 604 (12.0%) attend a private institution, while the remaining 4,430 (88.0%) are enrolled in public schools. The age group of 25 to 34 year olds has the highest likelihood of being enrolled in private schools, with 58 (21.5% in the age bracket) enrolled. Conversely, the age group of 10 to 14 year olds has the lowest likelihood of being enrolled in a private school, with 1,395 (94.5% in the age bracket) attending a public institution.
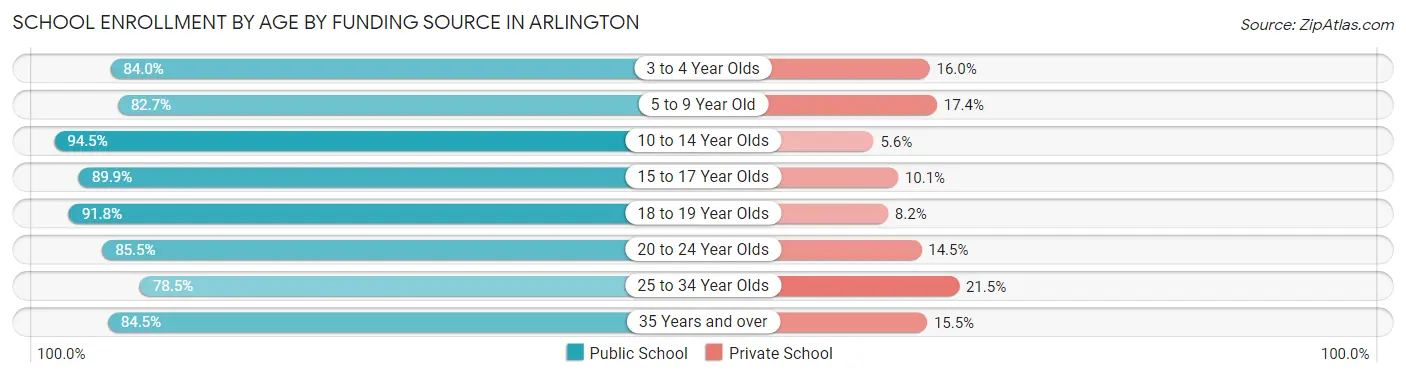
| Age Bracket | Public School | Private School |
| 3 to 4 Year Olds | 226 (84.0%) | 43 (16.0%) |
| 5 to 9 Year Old | 1,096 (82.7%) | 230 (17.3%) |
| 10 to 14 Year Olds | 1,395 (94.5%) | 82 (5.6%) |
| 15 to 17 Year Olds | 676 (89.9%) | 76 (10.1%) |
| 18 to 19 Year Olds | 323 (91.8%) | 29 (8.2%) |
| 20 to 24 Year Olds | 343 (85.5%) | 58 (14.5%) |
| 25 to 34 Year Olds | 212 (78.5%) | 58 (21.5%) |
| 35 Years and over | 158 (84.5%) | 29 (15.5%) |
| Total | 4,430 (88.0%) | 604 (12.0%) |
Educational Attainment by Field of Study in Arlington
Business (591 | 18.4%), education (530 | 16.6%), science & technology (288 | 9.0%), arts & humanities (273 | 8.5%), and social sciences (239 | 7.5%) are the most common fields of study among 3,203 individuals in Arlington who have obtained a bachelor's degree or higher.
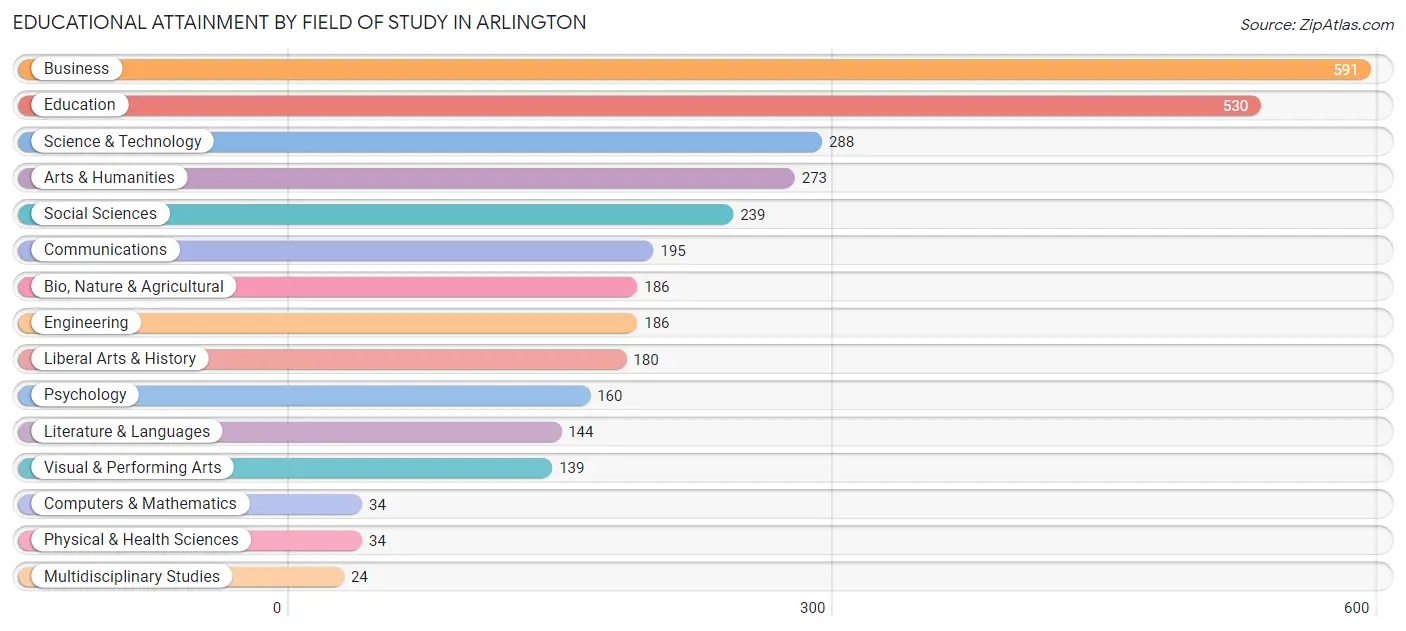
| Field of Study | # Graduates | % Graduates |
| Computers & Mathematics | 34 | 1.1% |
| Bio, Nature & Agricultural | 186 | 5.8% |
| Physical & Health Sciences | 34 | 1.1% |
| Psychology | 160 | 5.0% |
| Social Sciences | 239 | 7.5% |
| Engineering | 186 | 5.8% |
| Multidisciplinary Studies | 24 | 0.7% |
| Science & Technology | 288 | 9.0% |
| Business | 591 | 18.4% |
| Education | 530 | 16.6% |
| Literature & Languages | 144 | 4.5% |
| Liberal Arts & History | 180 | 5.6% |
| Visual & Performing Arts | 139 | 4.3% |
| Communications | 195 | 6.1% |
| Arts & Humanities | 273 | 8.5% |
| Total | 3,203 | 100.0% |
Transportation & Commute in Arlington
Vehicle Availability by Sex in Arlington
The most prevalent vehicle ownership categories in Arlington are males with 2 vehicles (2,436, accounting for 44.8%) and females with 2 vehicles (1,921, making up 50.8%).
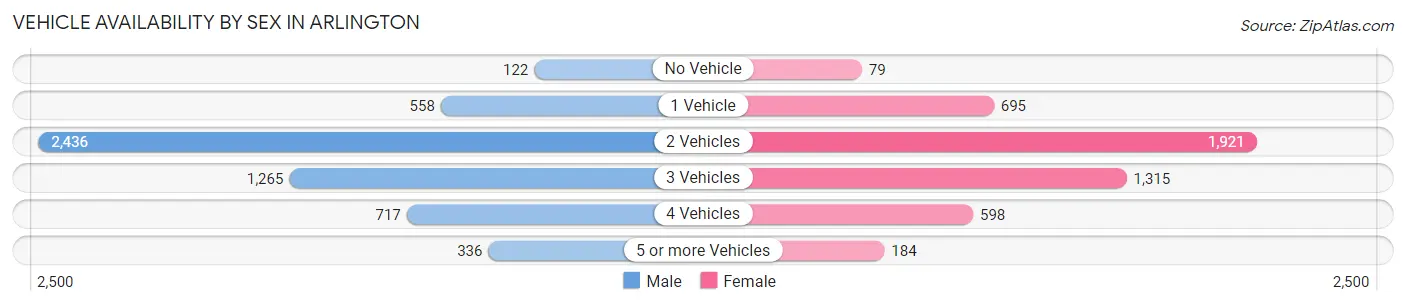
| Vehicles Available | Male | Female |
| No Vehicle | 122 (2.2%) | 79 (1.7%) |
| 1 Vehicle | 558 (10.3%) | 695 (14.5%) |
| 2 Vehicles | 2,436 (44.8%) | 1,921 (40.1%) |
| 3 Vehicles | 1,265 (23.3%) | 1,315 (27.4%) |
| 4 Vehicles | 717 (13.2%) | 598 (12.5%) |
| 5 or more Vehicles | 336 (6.2%) | 184 (3.8%) |
| Total | 5,434 (100.0%) | 4,792 (100.0%) |
Commute Time in Arlington
The most frequently occuring commute durations in Arlington are 30 to 34 minutes (1,654 commuters, 18.3%), 15 to 19 minutes (1,158 commuters, 12.8%), and 10 to 14 minutes (1,042 commuters, 11.5%).
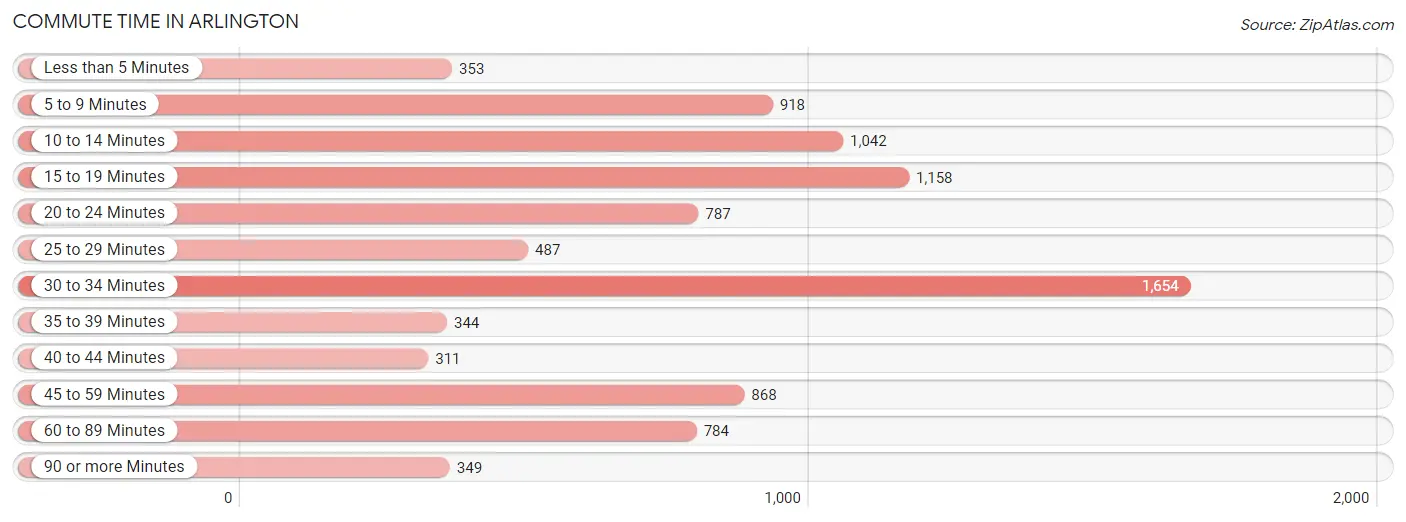
| Commute Time | # Commuters | % Commuters |
| Less than 5 Minutes | 353 | 3.9% |
| 5 to 9 Minutes | 918 | 10.1% |
| 10 to 14 Minutes | 1,042 | 11.5% |
| 15 to 19 Minutes | 1,158 | 12.8% |
| 20 to 24 Minutes | 787 | 8.7% |
| 25 to 29 Minutes | 487 | 5.4% |
| 30 to 34 Minutes | 1,654 | 18.3% |
| 35 to 39 Minutes | 344 | 3.8% |
| 40 to 44 Minutes | 311 | 3.4% |
| 45 to 59 Minutes | 868 | 9.6% |
| 60 to 89 Minutes | 784 | 8.7% |
| 90 or more Minutes | 349 | 3.8% |
Commute Time by Sex in Arlington
The most common commute times in Arlington are 30 to 34 minutes (841 commuters, 17.0%) for males and 30 to 34 minutes (813 commuters, 19.8%) for females.
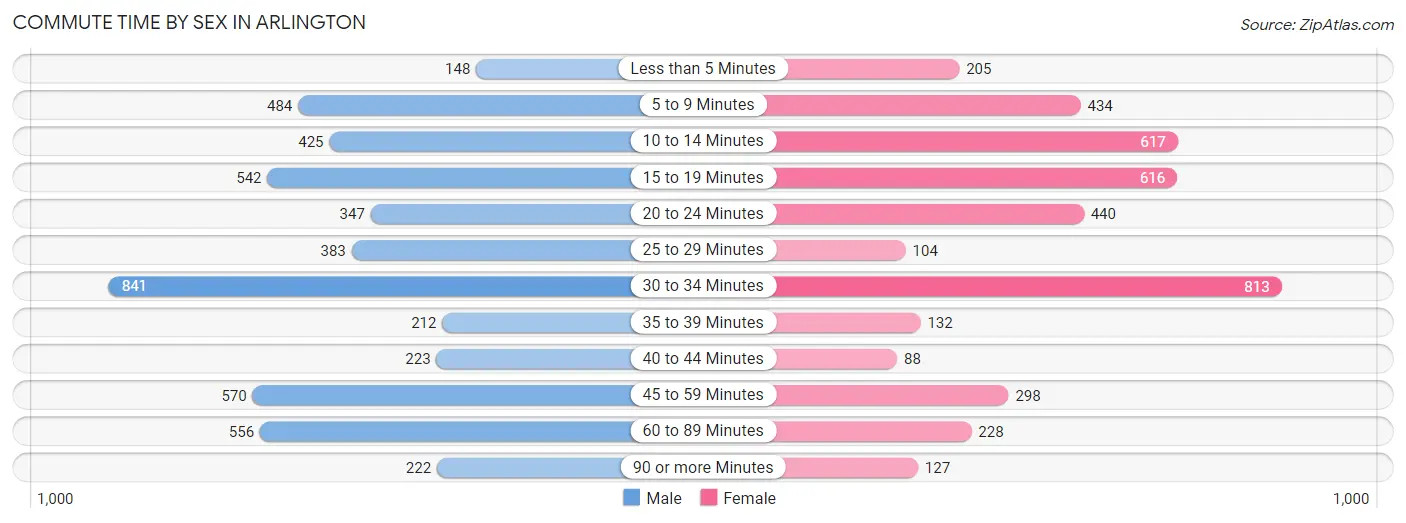
| Commute Time | Male | Female |
| Less than 5 Minutes | 148 (3.0%) | 205 (5.0%) |
| 5 to 9 Minutes | 484 (9.8%) | 434 (10.6%) |
| 10 to 14 Minutes | 425 (8.6%) | 617 (15.0%) |
| 15 to 19 Minutes | 542 (10.9%) | 616 (15.0%) |
| 20 to 24 Minutes | 347 (7.0%) | 440 (10.7%) |
| 25 to 29 Minutes | 383 (7.7%) | 104 (2.5%) |
| 30 to 34 Minutes | 841 (17.0%) | 813 (19.8%) |
| 35 to 39 Minutes | 212 (4.3%) | 132 (3.2%) |
| 40 to 44 Minutes | 223 (4.5%) | 88 (2.1%) |
| 45 to 59 Minutes | 570 (11.5%) | 298 (7.3%) |
| 60 to 89 Minutes | 556 (11.2%) | 228 (5.6%) |
| 90 or more Minutes | 222 (4.5%) | 127 (3.1%) |
Time of Departure to Work by Sex in Arlington
The most frequent times of departure to work in Arlington are 12:00 AM to 4:59 AM (839, 16.9%) for males and 7:00 AM to 7:29 AM (619, 15.1%) for females.
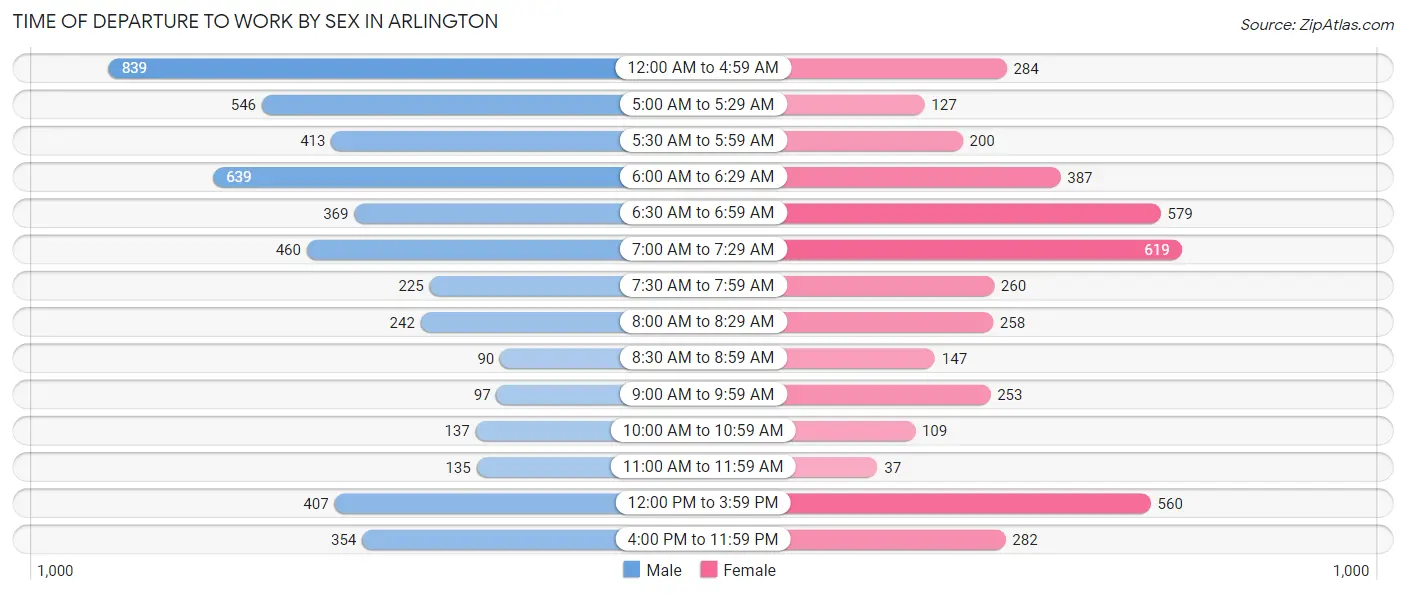
| Time of Departure | Male | Female |
| 12:00 AM to 4:59 AM | 839 (16.9%) | 284 (6.9%) |
| 5:00 AM to 5:29 AM | 546 (11.0%) | 127 (3.1%) |
| 5:30 AM to 5:59 AM | 413 (8.3%) | 200 (4.9%) |
| 6:00 AM to 6:29 AM | 639 (12.9%) | 387 (9.4%) |
| 6:30 AM to 6:59 AM | 369 (7.4%) | 579 (14.1%) |
| 7:00 AM to 7:29 AM | 460 (9.3%) | 619 (15.1%) |
| 7:30 AM to 7:59 AM | 225 (4.5%) | 260 (6.3%) |
| 8:00 AM to 8:29 AM | 242 (4.9%) | 258 (6.3%) |
| 8:30 AM to 8:59 AM | 90 (1.8%) | 147 (3.6%) |
| 9:00 AM to 9:59 AM | 97 (2.0%) | 253 (6.2%) |
| 10:00 AM to 10:59 AM | 137 (2.8%) | 109 (2.7%) |
| 11:00 AM to 11:59 AM | 135 (2.7%) | 37 (0.9%) |
| 12:00 PM to 3:59 PM | 407 (8.2%) | 560 (13.7%) |
| 4:00 PM to 11:59 PM | 354 (7.1%) | 282 (6.9%) |
| Total | 4,953 (100.0%) | 4,102 (100.0%) |
Housing Occupancy in Arlington
Occupancy by Ownership in Arlington
Of the total 7,502 dwellings in Arlington, owner-occupied units account for 4,983 (66.4%), while renter-occupied units make up 2,519 (33.6%).
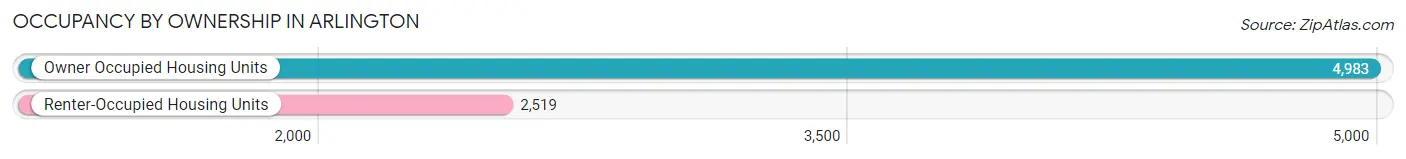
| Occupancy | # Housing Units | % Housing Units |
| Owner Occupied Housing Units | 4,983 | 66.4% |
| Renter-Occupied Housing Units | 2,519 | 33.6% |
| Total Occupied Housing Units | 7,502 | 100.0% |
Occupancy by Household Size in Arlington
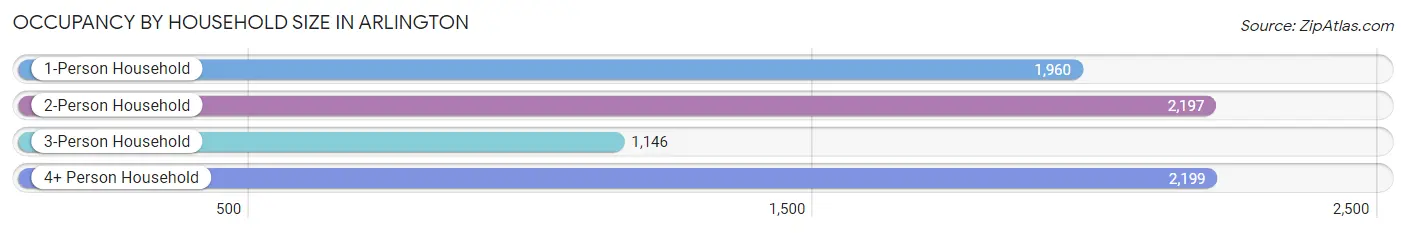
| Household Size | # Housing Units | % Housing Units |
| 1-Person Household | 1,960 | 26.1% |
| 2-Person Household | 2,197 | 29.3% |
| 3-Person Household | 1,146 | 15.3% |
| 4+ Person Household | 2,199 | 29.3% |
| Total Housing Units | 7,502 | 100.0% |
Occupancy by Ownership by Household Size in Arlington
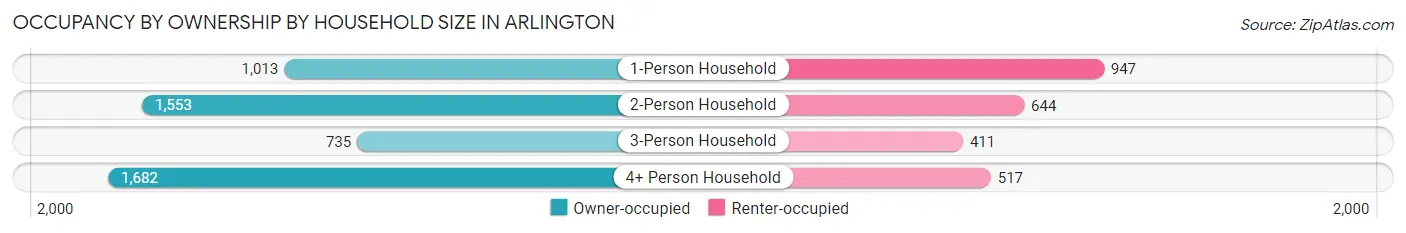
| Household Size | Owner-occupied | Renter-occupied |
| 1-Person Household | 1,013 (51.7%) | 947 (48.3%) |
| 2-Person Household | 1,553 (70.7%) | 644 (29.3%) |
| 3-Person Household | 735 (64.1%) | 411 (35.9%) |
| 4+ Person Household | 1,682 (76.5%) | 517 (23.5%) |
| Total Housing Units | 4,983 (66.4%) | 2,519 (33.6%) |
Occupancy by Educational Attainment in Arlington
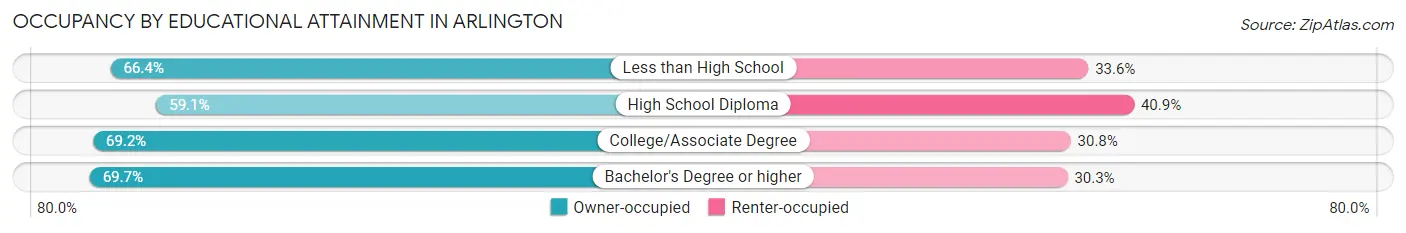
| Household Size | Owner-occupied | Renter-occupied |
| Less than High School | 379 (66.4%) | 192 (33.6%) |
| High School Diploma | 1,165 (59.1%) | 806 (40.9%) |
| College/Associate Degree | 2,204 (69.2%) | 983 (30.8%) |
| Bachelor's Degree or higher | 1,235 (69.7%) | 538 (30.3%) |
Occupancy by Age of Householder in Arlington
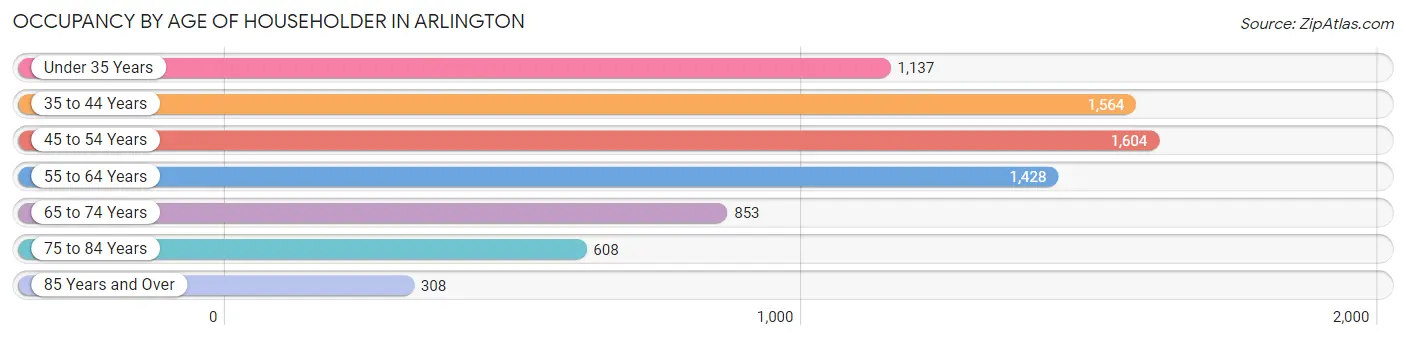
| Age Bracket | # Households | % Households |
| Under 35 Years | 1,137 | 15.2% |
| 35 to 44 Years | 1,564 | 20.8% |
| 45 to 54 Years | 1,604 | 21.4% |
| 55 to 64 Years | 1,428 | 19.0% |
| 65 to 74 Years | 853 | 11.4% |
| 75 to 84 Years | 608 | 8.1% |
| 85 Years and Over | 308 | 4.1% |
| Total | 7,502 | 100.0% |
Housing Finances in Arlington
Median Income by Occupancy in Arlington
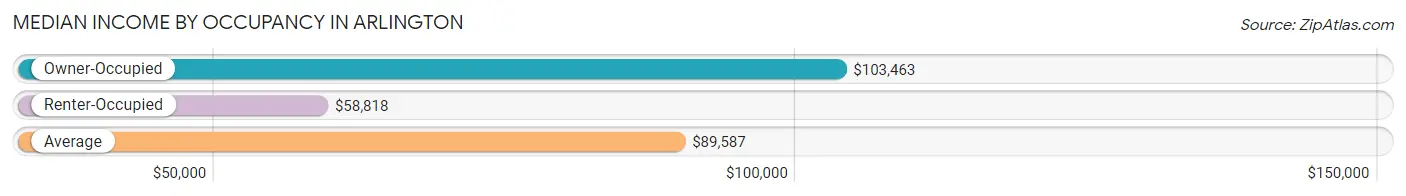
| Occupancy Type | # Households | Median Income |
| Owner-Occupied | 4,983 (66.4%) | $103,463 |
| Renter-Occupied | 2,519 (33.6%) | $58,818 |
| Average | 7,502 (100.0%) | $89,587 |
Occupancy by Householder Income Bracket in Arlington
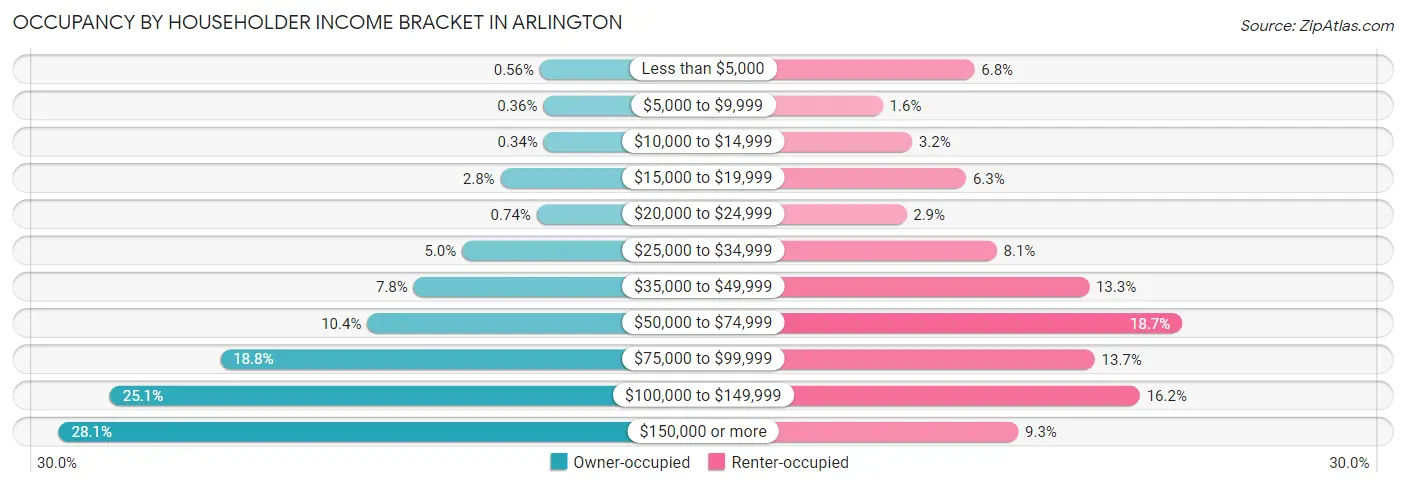
| Income Bracket | Owner-occupied | Renter-occupied |
| Less than $5,000 | 28 (0.6%) | 171 (6.8%) |
| $5,000 to $9,999 | 18 (0.4%) | 39 (1.5%) |
| $10,000 to $14,999 | 17 (0.3%) | 81 (3.2%) |
| $15,000 to $19,999 | 140 (2.8%) | 159 (6.3%) |
| $20,000 to $24,999 | 37 (0.7%) | 73 (2.9%) |
| $25,000 to $34,999 | 249 (5.0%) | 203 (8.1%) |
| $35,000 to $49,999 | 387 (7.8%) | 336 (13.3%) |
| $50,000 to $74,999 | 519 (10.4%) | 470 (18.7%) |
| $75,000 to $99,999 | 938 (18.8%) | 344 (13.7%) |
| $100,000 to $149,999 | 1,252 (25.1%) | 409 (16.2%) |
| $150,000 or more | 1,398 (28.1%) | 234 (9.3%) |
| Total | 4,983 (100.0%) | 2,519 (100.0%) |
Monthly Housing Cost Tiers in Arlington
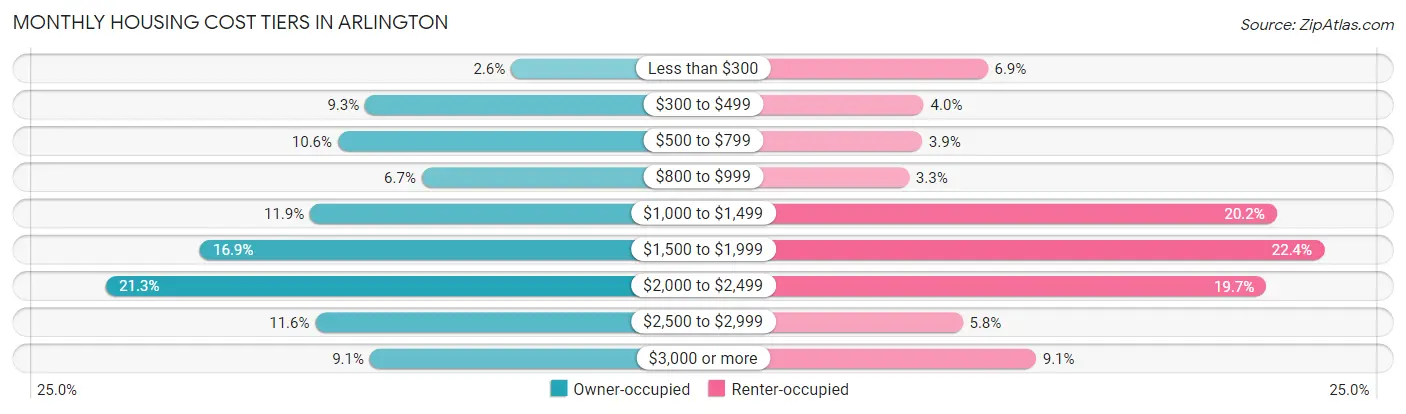
| Monthly Cost | Owner-occupied | Renter-occupied |
| Less than $300 | 130 (2.6%) | 174 (6.9%) |
| $300 to $499 | 465 (9.3%) | 100 (4.0%) |
| $500 to $799 | 527 (10.6%) | 98 (3.9%) |
| $800 to $999 | 335 (6.7%) | 83 (3.3%) |
| $1,000 to $1,499 | 591 (11.9%) | 509 (20.2%) |
| $1,500 to $1,999 | 843 (16.9%) | 564 (22.4%) |
| $2,000 to $2,499 | 1,059 (21.2%) | 497 (19.7%) |
| $2,500 to $2,999 | 579 (11.6%) | 145 (5.8%) |
| $3,000 or more | 454 (9.1%) | 230 (9.1%) |
| Total | 4,983 (100.0%) | 2,519 (100.0%) |
Physical Housing Characteristics in Arlington
Housing Structures in Arlington
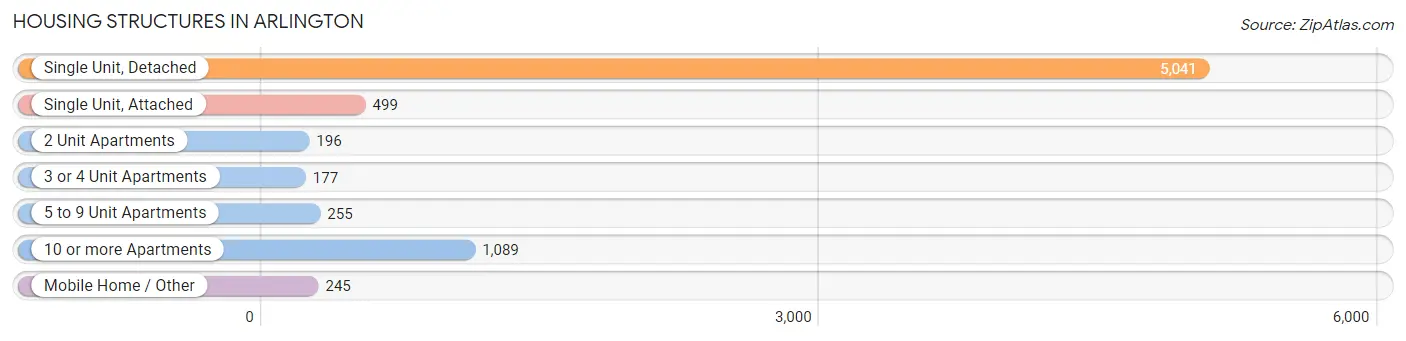
| Structure Type | # Housing Units | % Housing Units |
| Single Unit, Detached | 5,041 | 67.2% |
| Single Unit, Attached | 499 | 6.7% |
| 2 Unit Apartments | 196 | 2.6% |
| 3 or 4 Unit Apartments | 177 | 2.4% |
| 5 to 9 Unit Apartments | 255 | 3.4% |
| 10 or more Apartments | 1,089 | 14.5% |
| Mobile Home / Other | 245 | 3.3% |
| Total | 7,502 | 100.0% |
Housing Structures by Occupancy in Arlington
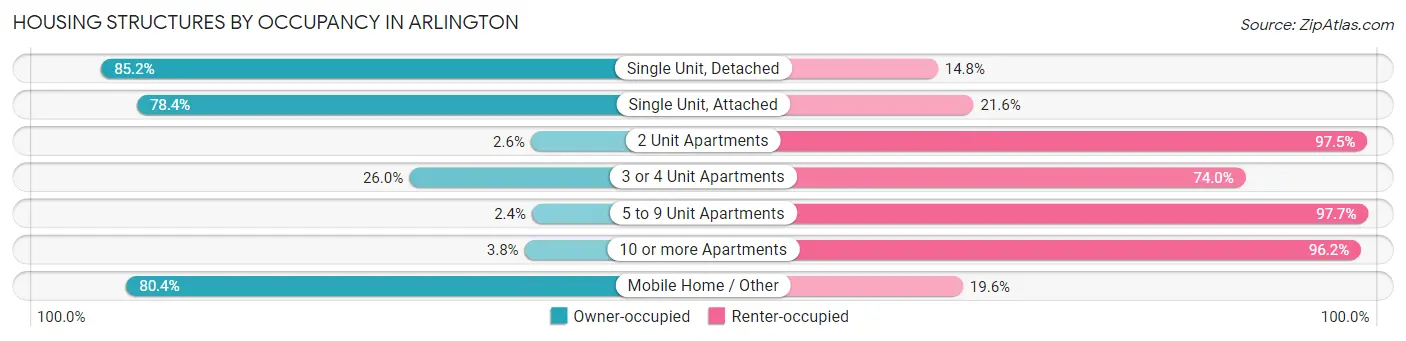
| Structure Type | Owner-occupied | Renter-occupied |
| Single Unit, Detached | 4,297 (85.2%) | 744 (14.8%) |
| Single Unit, Attached | 391 (78.4%) | 108 (21.6%) |
| 2 Unit Apartments | 5 (2.5%) | 191 (97.5%) |
| 3 or 4 Unit Apartments | 46 (26.0%) | 131 (74.0%) |
| 5 to 9 Unit Apartments | 6 (2.4%) | 249 (97.7%) |
| 10 or more Apartments | 41 (3.8%) | 1,048 (96.2%) |
| Mobile Home / Other | 197 (80.4%) | 48 (19.6%) |
| Total | 4,983 (66.4%) | 2,519 (33.6%) |
Housing Structures by Number of Rooms in Arlington
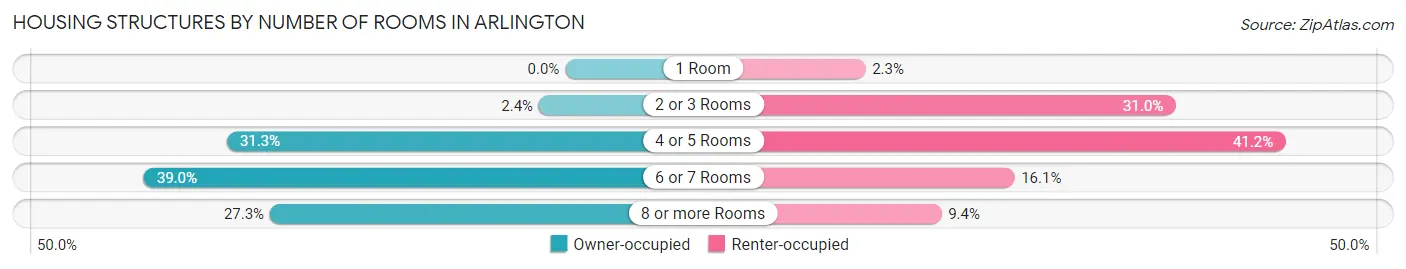
| Number of Rooms | Owner-occupied | Renter-occupied |
| 1 Room | 0 (0.0%) | 59 (2.3%) |
| 2 or 3 Rooms | 121 (2.4%) | 781 (31.0%) |
| 4 or 5 Rooms | 1,559 (31.3%) | 1,037 (41.2%) |
| 6 or 7 Rooms | 1,942 (39.0%) | 406 (16.1%) |
| 8 or more Rooms | 1,361 (27.3%) | 236 (9.4%) |
| Total | 4,983 (100.0%) | 2,519 (100.0%) |
Housing Structure by Heating Type in Arlington
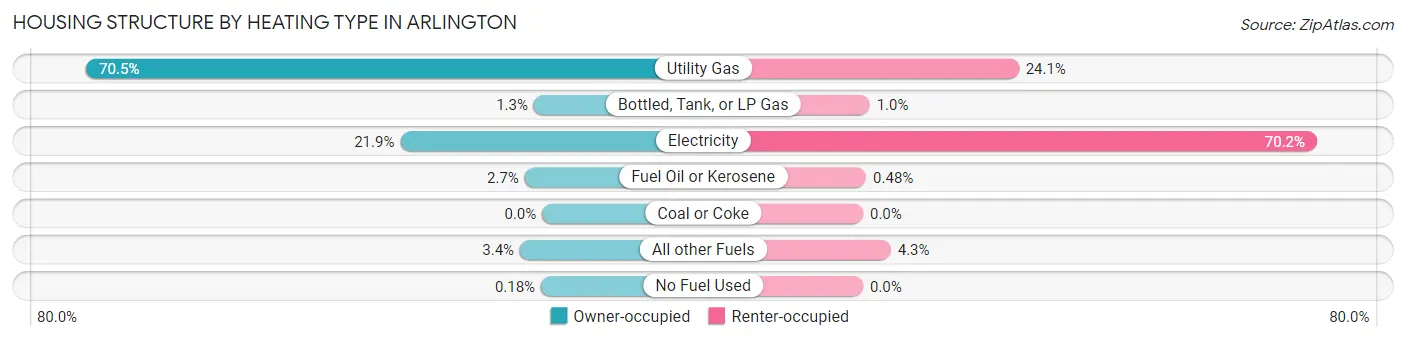
| Heating Type | Owner-occupied | Renter-occupied |
| Utility Gas | 3,512 (70.5%) | 606 (24.1%) |
| Bottled, Tank, or LP Gas | 64 (1.3%) | 26 (1.0%) |
| Electricity | 1,093 (21.9%) | 1,767 (70.2%) |
| Fuel Oil or Kerosene | 134 (2.7%) | 12 (0.5%) |
| Coal or Coke | 0 (0.0%) | 0 (0.0%) |
| All other Fuels | 171 (3.4%) | 108 (4.3%) |
| No Fuel Used | 9 (0.2%) | 0 (0.0%) |
| Total | 4,983 (100.0%) | 2,519 (100.0%) |
Household Vehicle Usage in Arlington
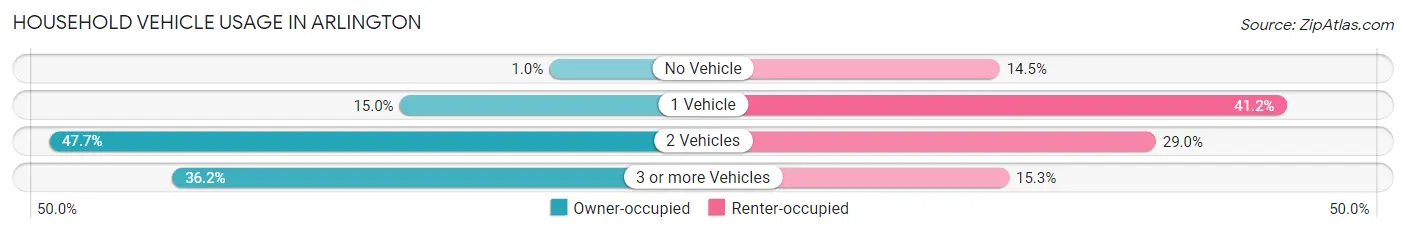
| Vehicles per Household | Owner-occupied | Renter-occupied |
| No Vehicle | 52 (1.0%) | 364 (14.4%) |
| 1 Vehicle | 748 (15.0%) | 1,038 (41.2%) |
| 2 Vehicles | 2,378 (47.7%) | 731 (29.0%) |
| 3 or more Vehicles | 1,805 (36.2%) | 386 (15.3%) |
| Total | 4,983 (100.0%) | 2,519 (100.0%) |
Real Estate & Mortgages in Arlington
Real Estate and Mortgage Overview in Arlington
| Characteristic | Without Mortgage | With Mortgage |
| Housing Units | 1,347 | 3,636 |
| Median Property Value | $381,300 | $463,600 |
| Median Household Income | $71,635 | $1,176 |
| Monthly Housing Costs | $594 | $446 |
| Real Estate Taxes | $2,717 | $56 |
Property Value by Mortgage Status in Arlington
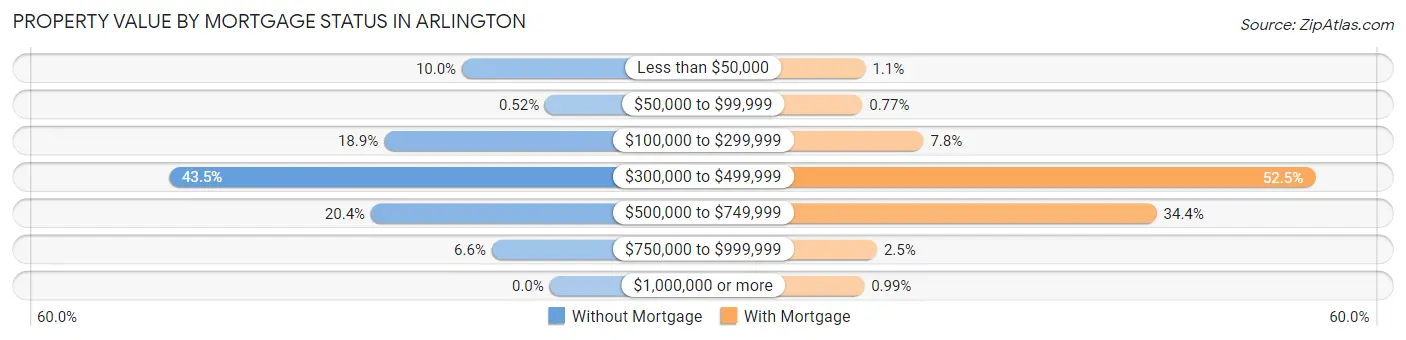
| Property Value | Without Mortgage | With Mortgage |
| Less than $50,000 | 135 (10.0%) | 41 (1.1%) |
| $50,000 to $99,999 | 7 (0.5%) | 28 (0.8%) |
| $100,000 to $299,999 | 255 (18.9%) | 282 (7.8%) |
| $300,000 to $499,999 | 586 (43.5%) | 1,909 (52.5%) |
| $500,000 to $749,999 | 275 (20.4%) | 1,251 (34.4%) |
| $750,000 to $999,999 | 89 (6.6%) | 89 (2.5%) |
| $1,000,000 or more | 0 (0.0%) | 36 (1.0%) |
| Total | 1,347 (100.0%) | 3,636 (100.0%) |
Household Income by Mortgage Status in Arlington
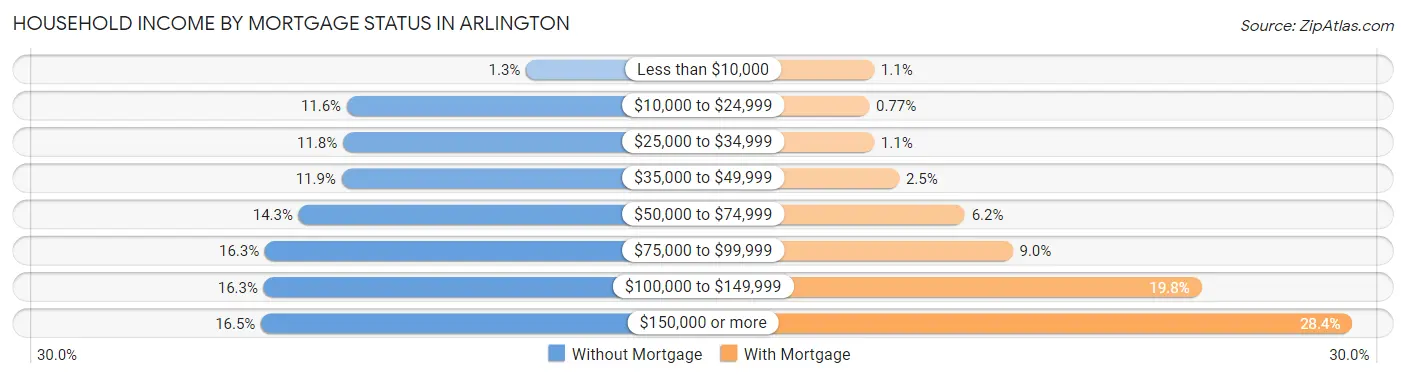
| Household Income | Without Mortgage | With Mortgage |
| Less than $10,000 | 18 (1.3%) | 38 (1.1%) |
| $10,000 to $24,999 | 156 (11.6%) | 28 (0.8%) |
| $25,000 to $34,999 | 159 (11.8%) | 38 (1.1%) |
| $35,000 to $49,999 | 160 (11.9%) | 90 (2.5%) |
| $50,000 to $74,999 | 193 (14.3%) | 227 (6.2%) |
| $75,000 to $99,999 | 219 (16.3%) | 326 (9.0%) |
| $100,000 to $149,999 | 220 (16.3%) | 719 (19.8%) |
| $150,000 or more | 222 (16.5%) | 1,032 (28.4%) |
| Total | 1,347 (100.0%) | 3,636 (100.0%) |
Property Value to Household Income Ratio in Arlington
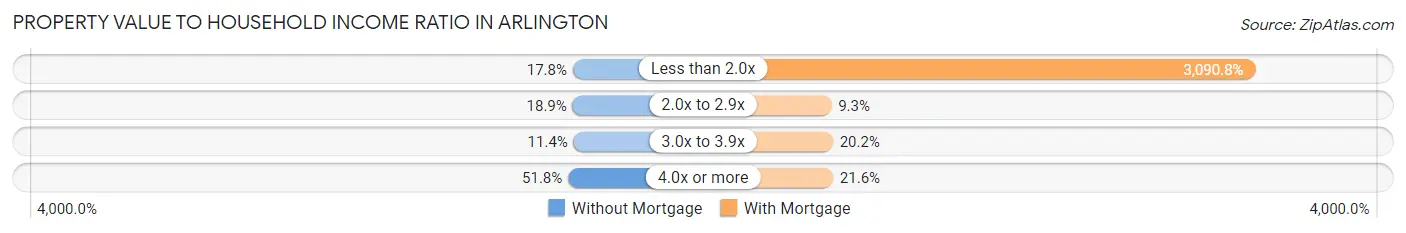
| Value-to-Income Ratio | Without Mortgage | With Mortgage |
| Less than 2.0x | 240 (17.8%) | 112,381 (3,090.8%) |
| 2.0x to 2.9x | 255 (18.9%) | 337 (9.3%) |
| 3.0x to 3.9x | 154 (11.4%) | 735 (20.2%) |
| 4.0x or more | 698 (51.8%) | 787 (21.6%) |
| Total | 1,347 (100.0%) | 3,636 (100.0%) |
Real Estate Taxes by Mortgage Status in Arlington
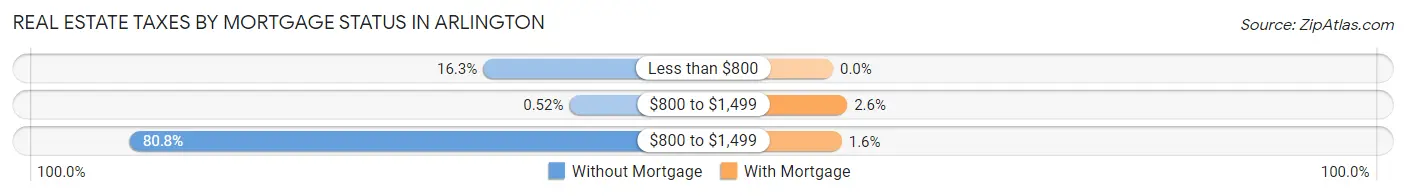
| Property Taxes | Without Mortgage | With Mortgage |
| Less than $800 | 219 (16.3%) | 0 (0.0%) |
| $800 to $1,499 | 7 (0.5%) | 94 (2.6%) |
| $800 to $1,499 | 1,088 (80.8%) | 58 (1.6%) |
| Total | 1,347 (100.0%) | 3,636 (100.0%) |
Health & Disability in Arlington
Health Insurance Coverage by Age in Arlington
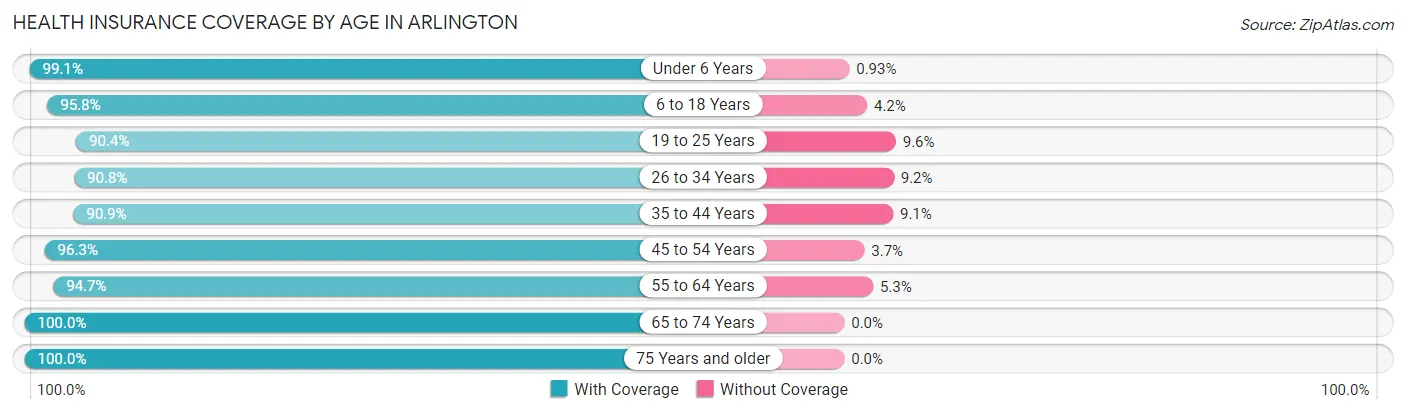
| Age Bracket | With Coverage | Without Coverage |
| Under 6 Years | 1,488 (99.1%) | 14 (0.9%) |
| 6 to 18 Years | 3,593 (95.8%) | 159 (4.2%) |
| 19 to 25 Years | 1,544 (90.4%) | 164 (9.6%) |
| 26 to 34 Years | 2,143 (90.8%) | 218 (9.2%) |
| 35 to 44 Years | 2,691 (90.9%) | 269 (9.1%) |
| 45 to 54 Years | 2,936 (96.3%) | 114 (3.7%) |
| 55 to 64 Years | 2,197 (94.7%) | 124 (5.3%) |
| 65 to 74 Years | 1,339 (100.0%) | 0 (0.0%) |
| 75 Years and older | 1,153 (100.0%) | 0 (0.0%) |
| Total | 19,084 (94.7%) | 1,062 (5.3%) |
Health Insurance Coverage by Citizenship Status in Arlington
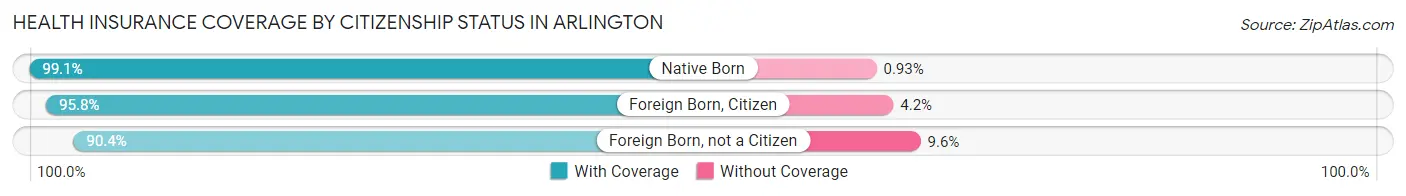
| Citizenship Status | With Coverage | Without Coverage |
| Native Born | 1,488 (99.1%) | 14 (0.9%) |
| Foreign Born, Citizen | 3,593 (95.8%) | 159 (4.2%) |
| Foreign Born, not a Citizen | 1,544 (90.4%) | 164 (9.6%) |
Health Insurance Coverage by Household Income in Arlington
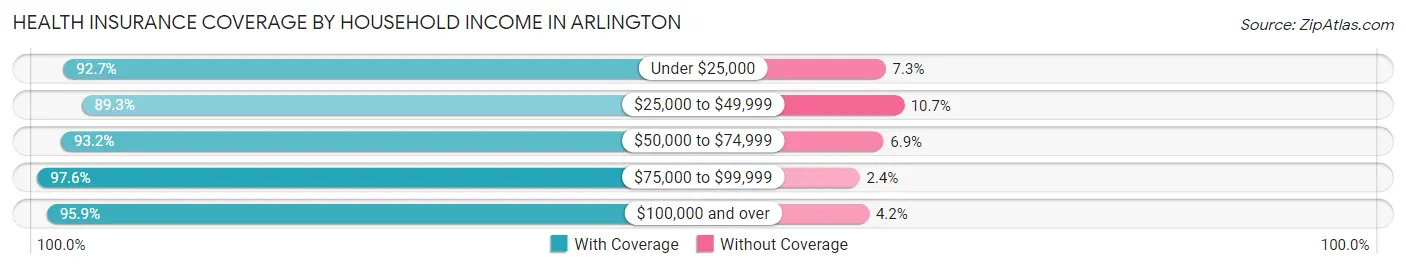
| Household Income | With Coverage | Without Coverage |
| Under $25,000 | 1,031 (92.7%) | 81 (7.3%) |
| $25,000 to $49,999 | 2,599 (89.3%) | 310 (10.7%) |
| $50,000 to $74,999 | 2,026 (93.1%) | 149 (6.9%) |
| $75,000 to $99,999 | 3,143 (97.6%) | 77 (2.4%) |
| $100,000 and over | 10,280 (95.9%) | 445 (4.2%) |
Public vs Private Health Insurance Coverage by Age in Arlington
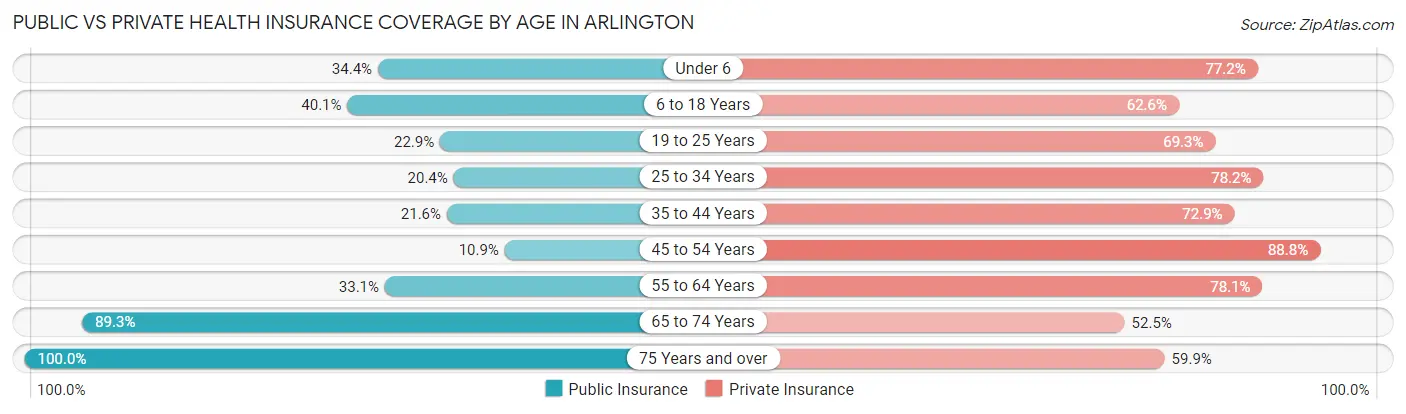
| Age Bracket | Public Insurance | Private Insurance |
| Under 6 | 517 (34.4%) | 1,159 (77.2%) |
| 6 to 18 Years | 1,504 (40.1%) | 2,347 (62.5%) |
| 19 to 25 Years | 391 (22.9%) | 1,184 (69.3%) |
| 25 to 34 Years | 481 (20.4%) | 1,847 (78.2%) |
| 35 to 44 Years | 640 (21.6%) | 2,157 (72.9%) |
| 45 to 54 Years | 332 (10.9%) | 2,707 (88.7%) |
| 55 to 64 Years | 769 (33.1%) | 1,812 (78.1%) |
| 65 to 74 Years | 1,196 (89.3%) | 703 (52.5%) |
| 75 Years and over | 1,153 (100.0%) | 691 (59.9%) |
| Total | 6,983 (34.7%) | 14,607 (72.5%) |
Disability Status by Sex by Age in Arlington
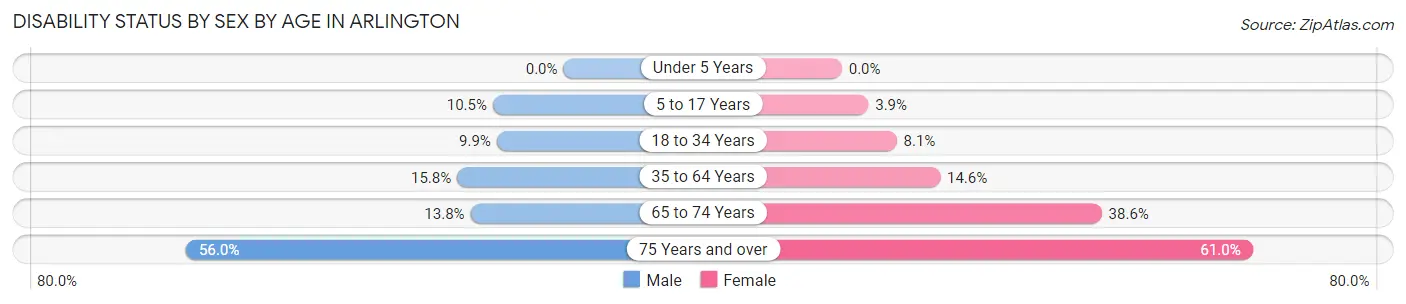
| Age Bracket | Male | Female |
| Under 5 Years | 0 (0.0%) | 0 (0.0%) |
| 5 to 17 Years | 192 (10.5%) | 73 (3.9%) |
| 18 to 34 Years | 210 (9.9%) | 180 (8.1%) |
| 35 to 64 Years | 637 (15.8%) | 627 (14.6%) |
| 65 to 74 Years | 85 (13.8%) | 279 (38.6%) |
| 75 Years and over | 251 (56.0%) | 430 (61.0%) |
Disability Class by Sex by Age in Arlington
Disability Class: Hearing Difficulty
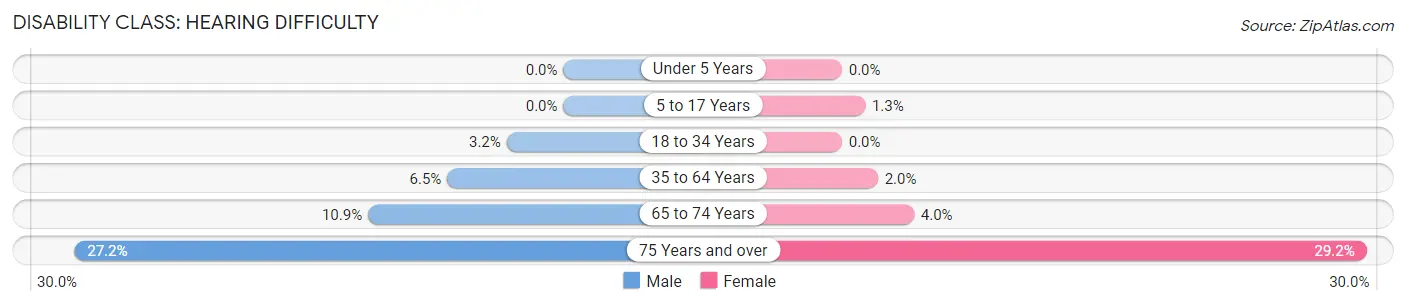
| Age Bracket | Male | Female |
| Under 5 Years | 0 (0.0%) | 0 (0.0%) |
| 5 to 17 Years | 0 (0.0%) | 24 (1.3%) |
| 18 to 34 Years | 67 (3.2%) | 0 (0.0%) |
| 35 to 64 Years | 261 (6.5%) | 86 (2.0%) |
| 65 to 74 Years | 67 (10.9%) | 29 (4.0%) |
| 75 Years and over | 122 (27.2%) | 206 (29.2%) |
Disability Class: Vision Difficulty
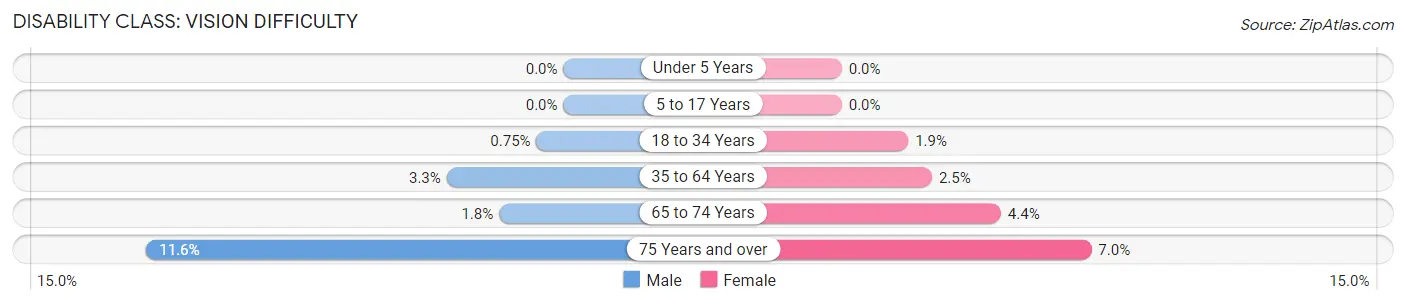
| Age Bracket | Male | Female |
| Under 5 Years | 0 (0.0%) | 0 (0.0%) |
| 5 to 17 Years | 0 (0.0%) | 0 (0.0%) |
| 18 to 34 Years | 16 (0.7%) | 41 (1.8%) |
| 35 to 64 Years | 131 (3.3%) | 108 (2.5%) |
| 65 to 74 Years | 11 (1.8%) | 32 (4.4%) |
| 75 Years and over | 52 (11.6%) | 49 (7.0%) |
Disability Class: Cognitive Difficulty
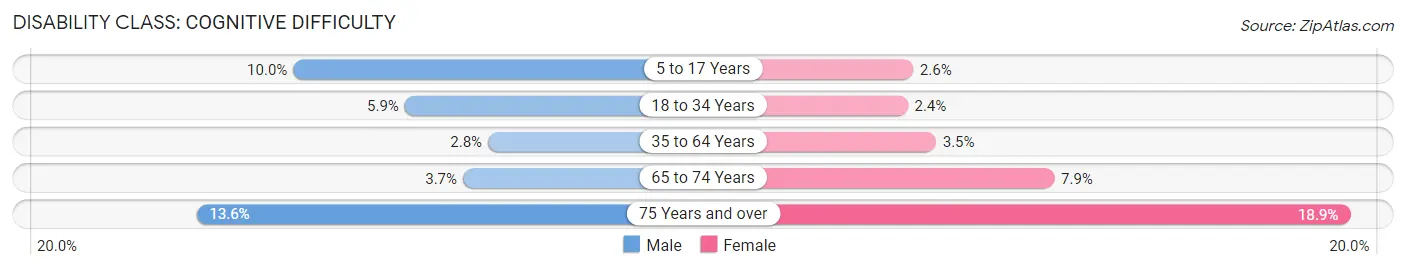
| Age Bracket | Male | Female |
| 5 to 17 Years | 184 (10.0%) | 49 (2.6%) |
| 18 to 34 Years | 125 (5.9%) | 54 (2.4%) |
| 35 to 64 Years | 113 (2.8%) | 150 (3.5%) |
| 65 to 74 Years | 23 (3.7%) | 57 (7.9%) |
| 75 Years and over | 61 (13.6%) | 133 (18.9%) |
Disability Class: Ambulatory Difficulty
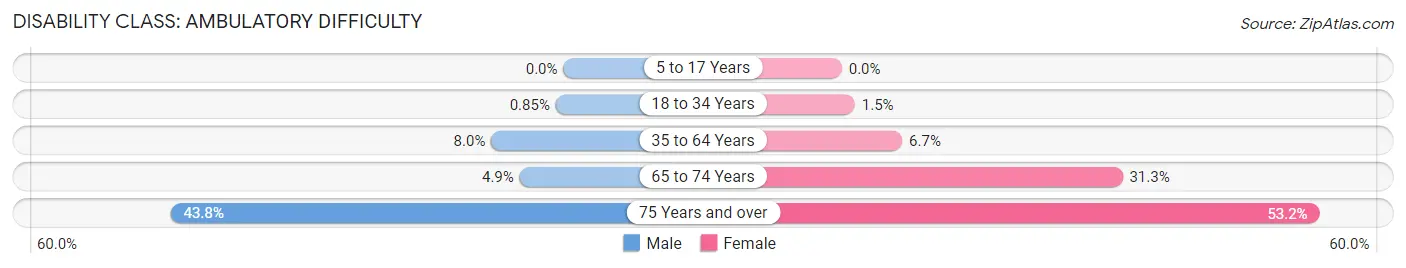
| Age Bracket | Male | Female |
| 5 to 17 Years | 0 (0.0%) | 0 (0.0%) |
| 18 to 34 Years | 18 (0.9%) | 32 (1.5%) |
| 35 to 64 Years | 324 (8.0%) | 289 (6.7%) |
| 65 to 74 Years | 30 (4.9%) | 226 (31.3%) |
| 75 Years and over | 196 (43.8%) | 375 (53.2%) |
Disability Class: Self-Care Difficulty
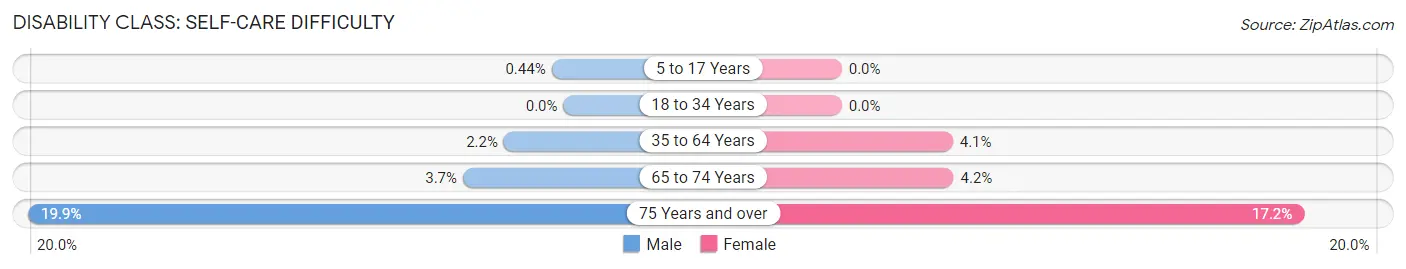
| Age Bracket | Male | Female |
| 5 to 17 Years | 8 (0.4%) | 0 (0.0%) |
| 18 to 34 Years | 0 (0.0%) | 0 (0.0%) |
| 35 to 64 Years | 89 (2.2%) | 177 (4.1%) |
| 65 to 74 Years | 23 (3.7%) | 30 (4.2%) |
| 75 Years and over | 89 (19.9%) | 121 (17.2%) |
Technology Access in Arlington
Computing Device Access in Arlington
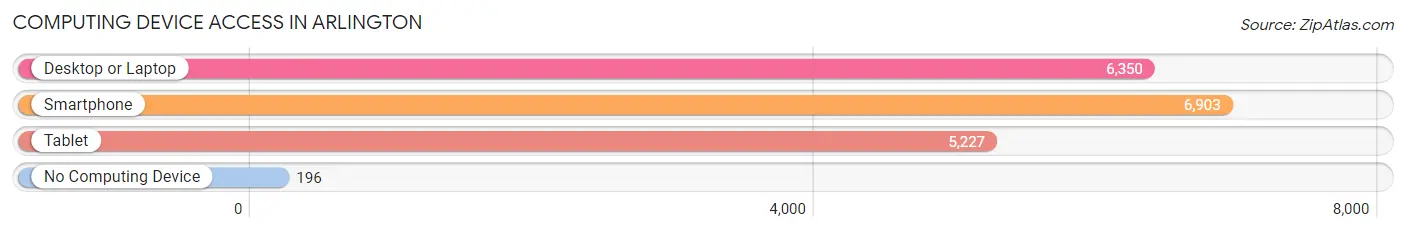
| Device Type | # Households | % Households |
| Desktop or Laptop | 6,350 | 84.6% |
| Smartphone | 6,903 | 92.0% |
| Tablet | 5,227 | 69.7% |
| No Computing Device | 196 | 2.6% |
| Total | 7,502 | 100.0% |
Internet Access in Arlington
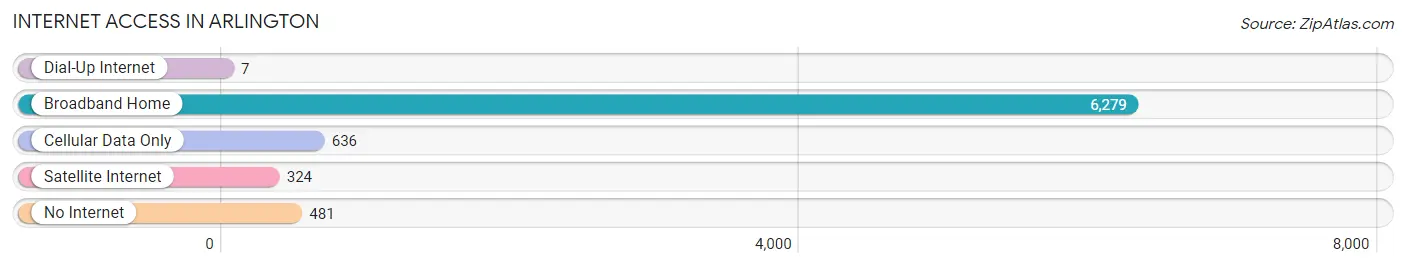
| Internet Type | # Households | % Households |
| Dial-Up Internet | 7 | 0.1% |
| Broadband Home | 6,279 | 83.7% |
| Cellular Data Only | 636 | 8.5% |
| Satellite Internet | 324 | 4.3% |
| No Internet | 481 | 6.4% |
| Total | 7,502 | 100.0% |
Arlington Summary
Arlington is a city located in Snohomish County, Washington, United States. It is situated in the Stillaguamish Valley, approximately 40 miles north of Seattle. The city is bordered by the cities of Marysville to the south, Stanwood to the north, and Darrington to the east. As of the 2010 census, the population of Arlington was 17,926.
History
Arlington was first settled in the late 1800s by homesteaders who were attracted to the fertile soil of the Stillaguamish Valley. The first post office was established in 1891, and the town was officially incorporated in 1903. The city was named after the Arlington Hotel, which was built in 1891 and was the first hotel in the area.
In the early 1900s, Arlington was a thriving agricultural community, with dairy farms, poultry farms, and berry farms. The city was also home to several sawmills and logging camps. In the 1920s, the city began to experience a population boom, as people moved to the area to take advantage of the booming timber industry.
Geography
Arlington is located in the Stillaguamish Valley, at the confluence of the Stillaguamish and Pilchuck Rivers. The city is situated at an elevation of approximately 200 feet above sea level. The city covers an area of 8.7 square miles, and is bordered by the cities of Marysville to the south, Stanwood to the north, and Darrington to the east.
The city is located in a temperate climate zone, with mild winters and warm summers. The average annual temperature is approximately 50 degrees Fahrenheit. The average annual precipitation is approximately 40 inches.
Economy
Arlington’s economy is largely based on agriculture and manufacturing. The city is home to several large agricultural operations, including dairy farms, poultry farms, and berry farms. The city is also home to several manufacturing companies, including a paper mill, a wood products plant, and a plastics plant.
The city is also home to several retail stores, restaurants, and other businesses. The city is served by several major highways, including Interstate 5, State Route 9, and State Route 530.
Demographics
As of the 2010 census, the population of Arlington was 17,926. The racial makeup of the city was 87.3% White, 1.3% African American, 1.2% Native American, 3.2% Asian, 0.3% Pacific Islander, 3.2% from other races, and 3.7% from two or more races. Hispanic or Latino of any race were 8.2% of the population.
The median income for a household in the city was $50,945, and the median income for a family was $60,945. The per capita income for the city was $25,945. About 8.2% of families and 10.3% of the population were below the poverty line, including 14.2% of those under age 18 and 6.2% of those age 65 or over.
Common Questions
What is Per Capita Income in Arlington?
Per Capita income in Arlington is $43,785.
What is the Median Family Income in Arlington?
Median Family Income in Arlington is $104,696.
What is the Median Household income in Arlington?
Median Household Income in Arlington is $89,587.
What is Income or Wage Gap in Arlington?
Income or Wage Gap in Arlington is 50.6%.
Women in Arlington earn 49.4 cents for every dollar earned by a man.
What is Inequality or Gini Index in Arlington?
Inequality or Gini Index in Arlington is 0.43.
What is the Total Population of Arlington?
Total Population of Arlington is 20,263.
What is the Total Male Population of Arlington?
Total Male Population of Arlington is 9,816.
What is the Total Female Population of Arlington?
Total Female Population of Arlington is 10,447.
What is the Ratio of Males per 100 Females in Arlington?
There are 93.96 Males per 100 Females in Arlington.
What is the Ratio of Females per 100 Males in Arlington?
There are 106.43 Females per 100 Males in Arlington.
What is the Median Population Age in Arlington?
Median Population Age in Arlington is 36.9 Years.
What is the Average Family Size in Arlington
Average Family Size in Arlington is 3.2 People.
What is the Average Household Size in Arlington
Average Household Size in Arlington is 2.7 People.
How Large is the Labor Force in Arlington?
There are 10,748 People in the Labor Forcein in Arlington.
What is the Percentage of People in the Labor Force in Arlington?
67.8% of People are in the Labor Force in Arlington.
What is the Unemployment Rate in Arlington?
Unemployment Rate in Arlington is 3.8%.