Everett, WA Map & Demographics
Everett Map
Everett Overview
$40,215
PER CAPITA INCOME
$90,928
AVG FAMILY INCOME
$77,806
AVG HOUSEHOLD INCOME
24.7%
WAGE / INCOME GAP [ % ]
75.3¢/ $1
WAGE / INCOME GAP [ $ ]
$10,537
FAMILY INCOME DEFICIT
0.43
INEQUALITY / GINI INDEX
110,847
TOTAL POPULATION
57,265
MALE POPULATION
53,582
FEMALE POPULATION
106.87
MALES / 100 FEMALES
93.57
FEMALES / 100 MALES
36.4
MEDIAN AGE
3.1
AVG FAMILY SIZE
2.4
AVG HOUSEHOLD SIZE
61,465
LABOR FORCE [ PEOPLE ]
67.5%
PERCENT IN LABOR FORCE
5.8%
UNEMPLOYMENT RATE
Everett Area Codes
Income in Everett
Income Overview in Everett
Per Capita Income in Everett is $40,215, while median incomes of families and households are $90,928 and $77,806 respectively.
| Characteristic | Number | Measure |
| Per Capita Income | 110,847 | $40,215 |
| Median Family Income | 24,476 | $90,928 |
| Mean Family Income | 24,476 | $111,832 |
| Median Household Income | 43,840 | $77,806 |
| Mean Household Income | 43,840 | $97,271 |
| Income Deficit | 24,476 | $10,537 |
| Wage / Income Gap (%) | 110,847 | 24.67% |
| Wage / Income Gap ($) | 110,847 | 75.33¢ per $1 |
| Gini / Inequality Index | 110,847 | 0.43 |
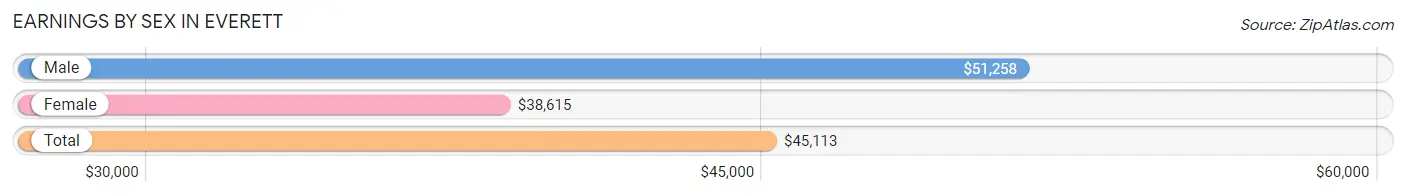
Earnings by Sex in Everett
Average Earnings in Everett are $45,113, $51,258 for men and $38,615 for women, a difference of 24.7%.
| Sex | Number | Average Earnings |
| Male | 35,378 (55.9%) | $51,258 |
| Female | 27,937 (44.1%) | $38,615 |
| Total | 63,315 (100.0%) | $45,113 |
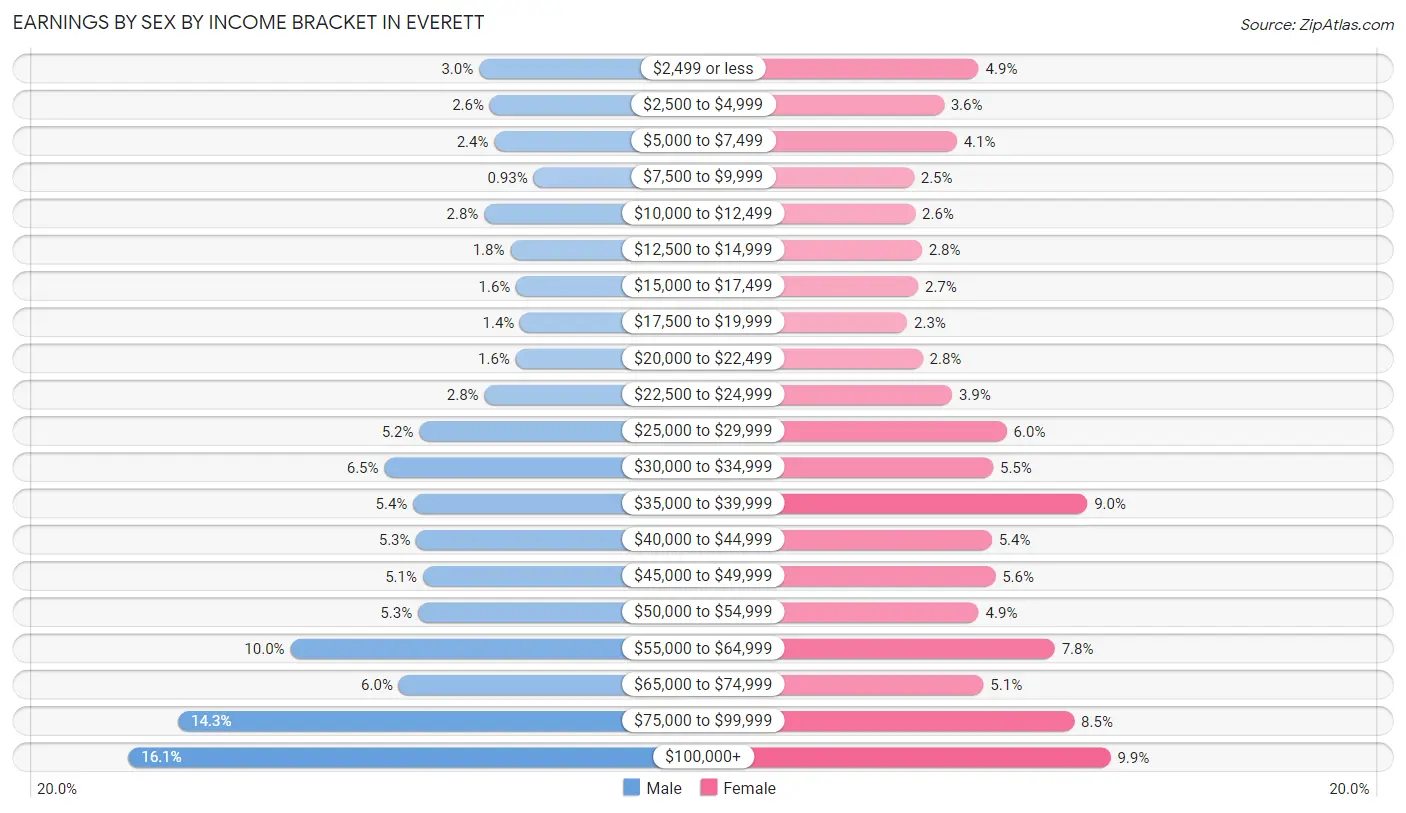
Earnings by Sex by Income Bracket in Everett
The most common earnings brackets in Everett are $100,000+ for men (5,699 | 16.1%) and $100,000+ for women (2,761 | 9.9%).
| Income | Male | Female |
| $2,499 or less | 1,049 (3.0%) | 1,380 (4.9%) |
| $2,500 to $4,999 | 909 (2.6%) | 1,015 (3.6%) |
| $5,000 to $7,499 | 848 (2.4%) | 1,152 (4.1%) |
| $7,500 to $9,999 | 329 (0.9%) | 701 (2.5%) |
| $10,000 to $12,499 | 982 (2.8%) | 715 (2.6%) |
| $12,500 to $14,999 | 638 (1.8%) | 784 (2.8%) |
| $15,000 to $17,499 | 559 (1.6%) | 745 (2.7%) |
| $17,500 to $19,999 | 505 (1.4%) | 631 (2.3%) |
| $20,000 to $22,499 | 567 (1.6%) | 793 (2.8%) |
| $22,500 to $24,999 | 979 (2.8%) | 1,102 (3.9%) |
| $25,000 to $29,999 | 1,842 (5.2%) | 1,674 (6.0%) |
| $30,000 to $34,999 | 2,305 (6.5%) | 1,530 (5.5%) |
| $35,000 to $39,999 | 1,923 (5.4%) | 2,516 (9.0%) |
| $40,000 to $44,999 | 1,881 (5.3%) | 1,516 (5.4%) |
| $45,000 to $49,999 | 1,796 (5.1%) | 1,554 (5.6%) |
| $50,000 to $54,999 | 1,862 (5.3%) | 1,381 (4.9%) |
| $55,000 to $64,999 | 3,551 (10.0%) | 2,177 (7.8%) |
| $65,000 to $74,999 | 2,114 (6.0%) | 1,430 (5.1%) |
| $75,000 to $99,999 | 5,040 (14.2%) | 2,380 (8.5%) |
| $100,000+ | 5,699 (16.1%) | 2,761 (9.9%) |
| Total | 35,378 (100.0%) | 27,937 (100.0%) |
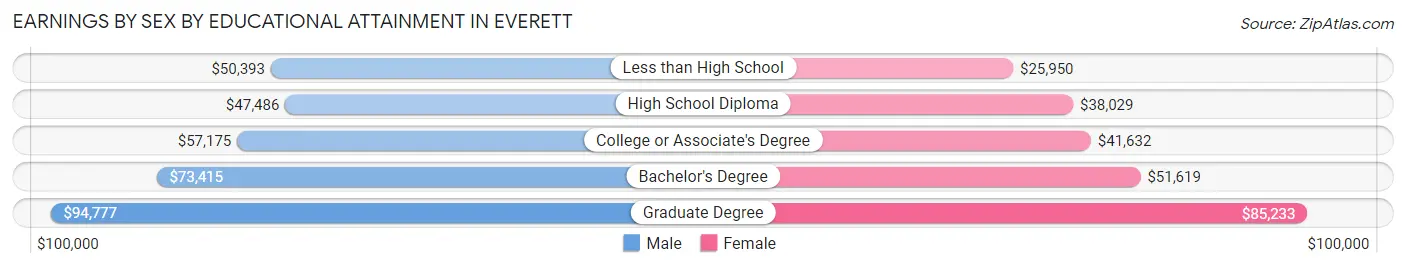
Earnings by Sex by Educational Attainment in Everett
Average earnings in Everett are $56,659 for men and $43,453 for women, a difference of 23.3%. Men with an educational attainment of graduate degree enjoy the highest average annual earnings of $94,777, while those with high school diploma education earn the least with $47,486. Women with an educational attainment of graduate degree earn the most with the average annual earnings of $85,233, while those with less than high school education have the smallest earnings of $25,950.
| Educational Attainment | Male Income | Female Income |
| Less than High School | $50,393 | $25,950 |
| High School Diploma | $47,486 | $38,029 |
| College or Associate's Degree | $57,175 | $41,632 |
| Bachelor's Degree | $73,415 | $51,619 |
| Graduate Degree | $94,777 | $85,233 |
| Total | $56,659 | $43,453 |
Family Income in Everett
Family Income Brackets in Everett
According to the Everett family income data, there are 5,262 families falling into the $100,000 to $149,999 income range, which is the most common income bracket and makes up 21.5% of all families. Conversely, the $10,000 to $14,999 income bracket is the least frequent group with only 587 families (2.4%) belonging to this category.
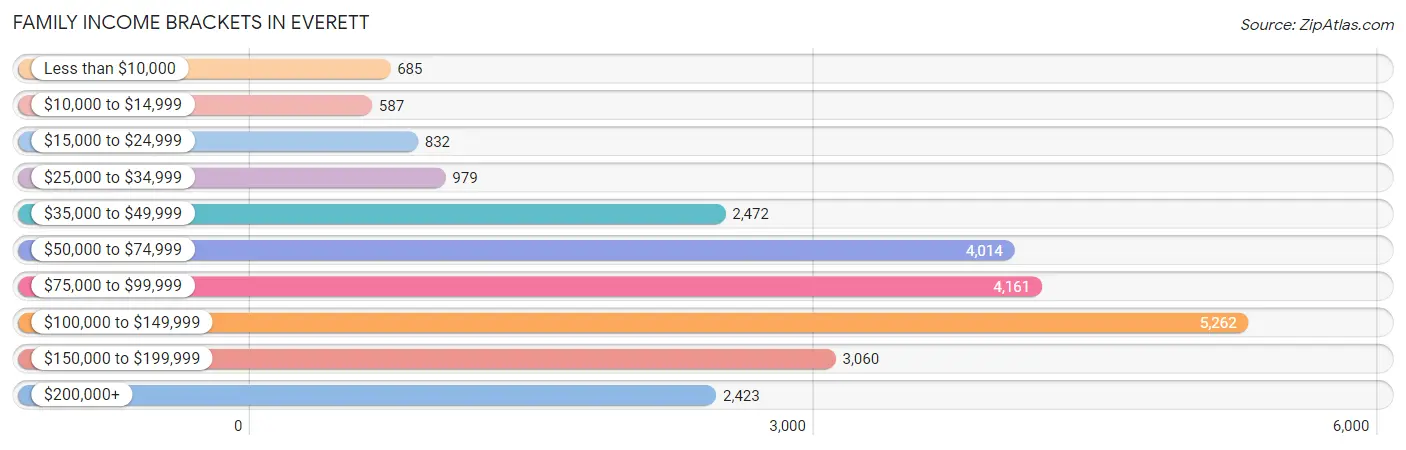
| Income Bracket | # Families | % Families |
| Less than $10,000 | 685 | 2.8% |
| $10,000 to $14,999 | 587 | 2.4% |
| $15,000 to $24,999 | 832 | 3.4% |
| $25,000 to $34,999 | 979 | 4.0% |
| $35,000 to $49,999 | 2,472 | 10.1% |
| $50,000 to $74,999 | 4,014 | 16.4% |
| $75,000 to $99,999 | 4,161 | 17.0% |
| $100,000 to $149,999 | 5,262 | 21.5% |
| $150,000 to $199,999 | 3,060 | 12.5% |
| $200,000+ | 2,423 | 9.9% |
Family Income by Famaliy Size in Everett
7+ person families (487 | 2.0%) account for the highest median family income in Everett with $118,495 per family, while 2-person families (11,082 | 45.3%) have the highest median income of $42,724 per family member.
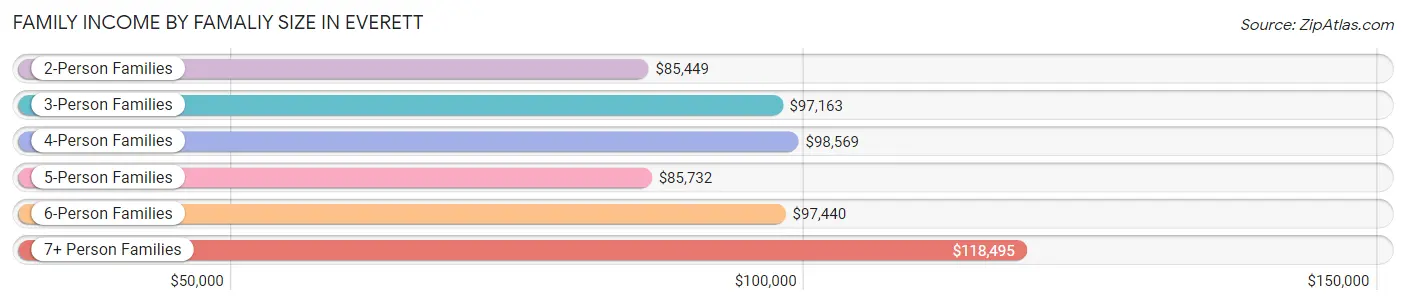
| Income Bracket | # Families | Median Income |
| 2-Person Families | 11,082 (45.3%) | $85,449 |
| 3-Person Families | 5,807 (23.7%) | $97,163 |
| 4-Person Families | 4,110 (16.8%) | $98,569 |
| 5-Person Families | 2,165 (8.8%) | $85,732 |
| 6-Person Families | 825 (3.4%) | $97,440 |
| 7+ Person Families | 487 (2.0%) | $118,495 |
| Total | 24,476 (100.0%) | $90,928 |
Family Income by Number of Earners in Everett
The median family income in Everett is $90,928, with families comprising 3+ earners (3,079) having the highest median family income of $147,267, while families with no earners (2,947) have the lowest median family income of $31,916, accounting for 12.6% and 12.0% of families, respectively.
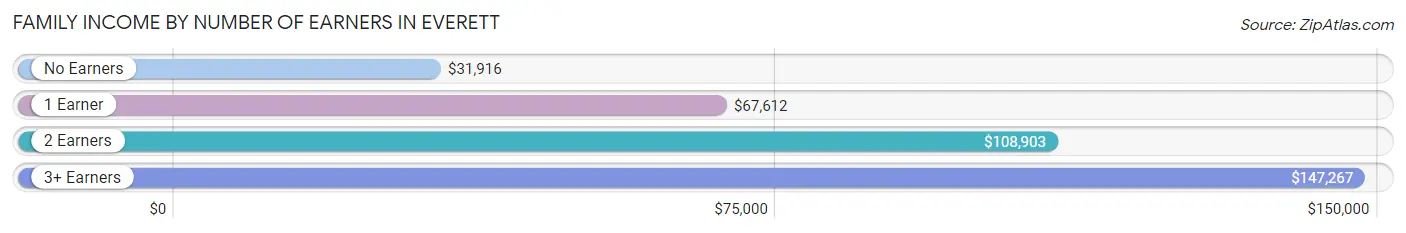
| Number of Earners | # Families | Median Income |
| No Earners | 2,947 (12.0%) | $31,916 |
| 1 Earner | 7,470 (30.5%) | $67,612 |
| 2 Earners | 10,980 (44.9%) | $108,903 |
| 3+ Earners | 3,079 (12.6%) | $147,267 |
| Total | 24,476 (100.0%) | $90,928 |
Household Income in Everett
Household Income Brackets in Everett
With 8,330 households falling in the category, the $100,000 to $149,999 income range is the most frequent in Everett, accounting for 19.0% of all households. In contrast, only 1,534 households (3.5%) fall into the less than $10,000 income bracket, making it the least populous group.
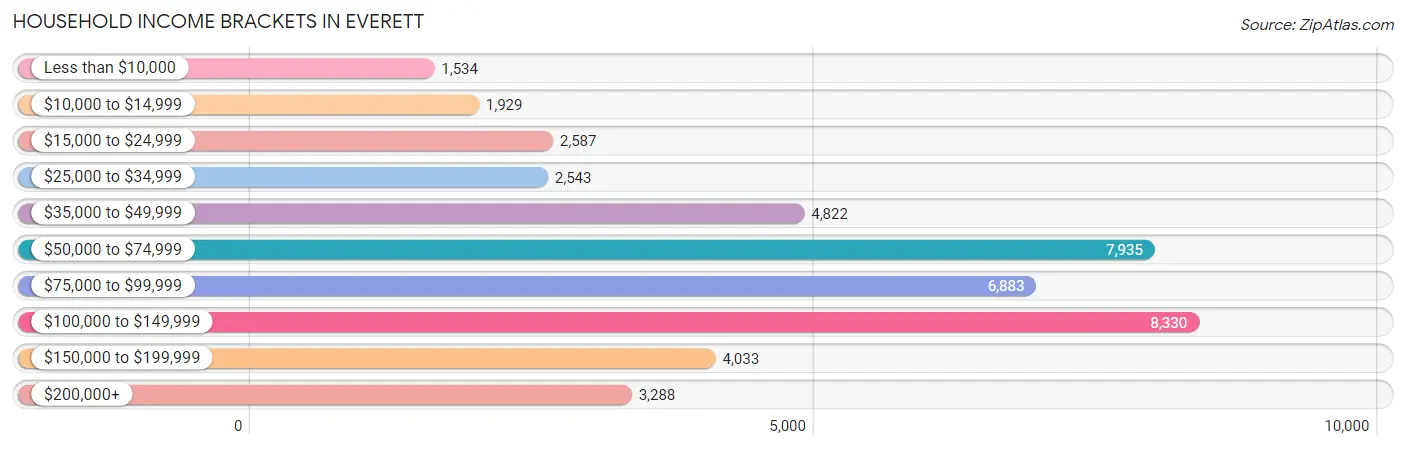
| Income Bracket | # Households | % Households |
| Less than $10,000 | 1,534 | 3.5% |
| $10,000 to $14,999 | 1,929 | 4.4% |
| $15,000 to $24,999 | 2,587 | 5.9% |
| $25,000 to $34,999 | 2,543 | 5.8% |
| $35,000 to $49,999 | 4,822 | 11.0% |
| $50,000 to $74,999 | 7,935 | 18.1% |
| $75,000 to $99,999 | 6,883 | 15.7% |
| $100,000 to $149,999 | 8,330 | 19.0% |
| $150,000 to $199,999 | 4,033 | 9.2% |
| $200,000+ | 3,288 | 7.5% |
Household Income by Householder Age in Everett
The median household income in Everett is $77,806, with the highest median household income of $88,912 found in the 45 to 64 years age bracket for the primary householder. A total of 15,562 households (35.5%) fall into this category. Meanwhile, the 65+ years age bracket for the primary householder has the lowest median household income of $47,426, with 9,562 households (21.8%) in this group.
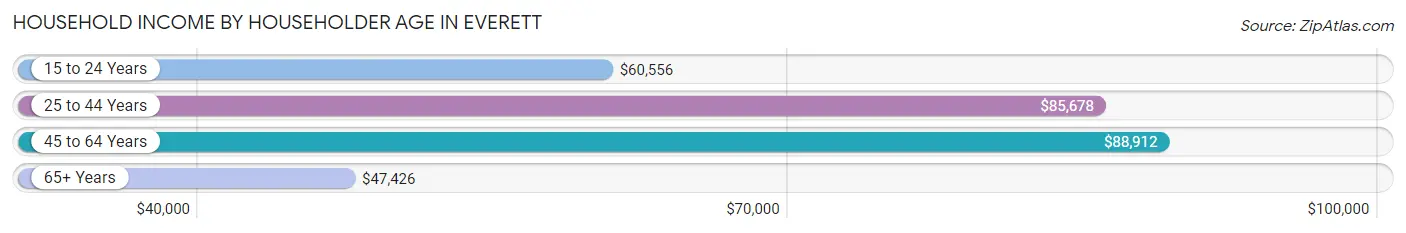
| Income Bracket | # Households | Median Income |
| 15 to 24 Years | 1,452 (3.3%) | $60,556 |
| 25 to 44 Years | 17,264 (39.4%) | $85,678 |
| 45 to 64 Years | 15,562 (35.5%) | $88,912 |
| 65+ Years | 9,562 (21.8%) | $47,426 |
| Total | 43,840 (100.0%) | $77,806 |
Poverty in Everett
Income Below Poverty by Sex and Age in Everett
With 10.8% poverty level for males and 13.5% for females among the residents of Everett, 16 and 17 year old males and 12 to 14 year old females are the most vulnerable to poverty, with 236 males (18.8%) and 316 females (18.9%) in their respective age groups living below the poverty level.
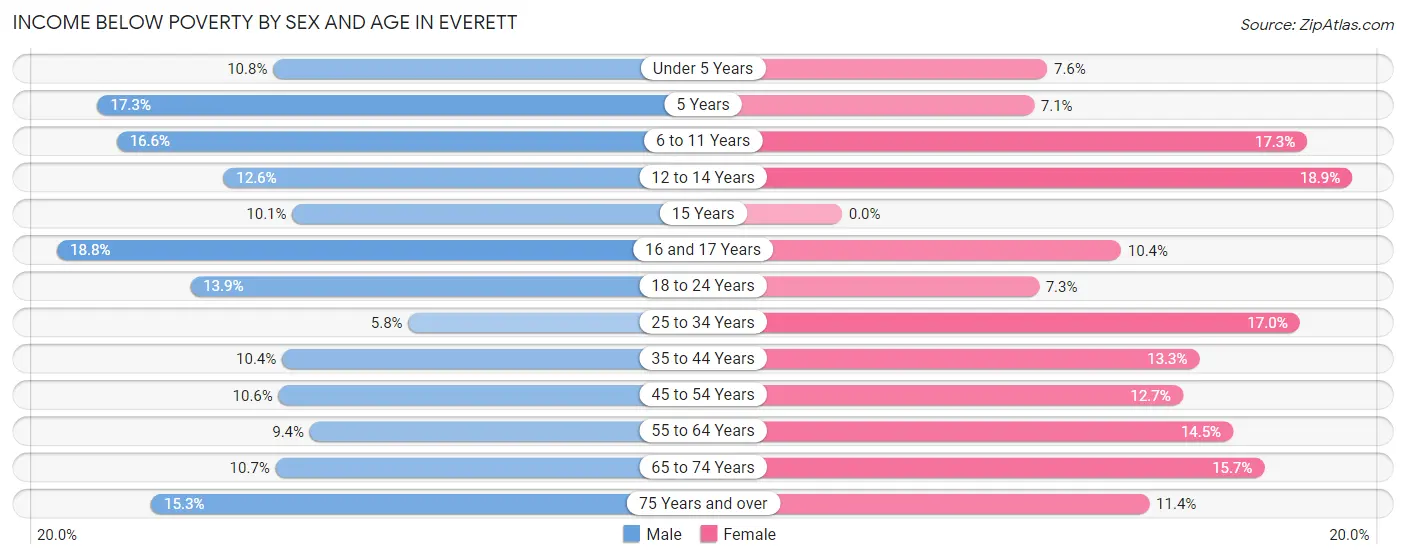
| Age Bracket | Male | Female |
| Under 5 Years | 382 (10.8%) | 204 (7.6%) |
| 5 Years | 115 (17.3%) | 36 (7.1%) |
| 6 to 11 Years | 642 (16.6%) | 549 (17.3%) |
| 12 to 14 Years | 218 (12.6%) | 316 (18.9%) |
| 15 Years | 67 (10.1%) | 0 (0.0%) |
| 16 and 17 Years | 236 (18.8%) | 149 (10.4%) |
| 18 to 24 Years | 674 (13.9%) | 321 (7.3%) |
| 25 to 34 Years | 579 (5.8%) | 1,667 (17.0%) |
| 35 to 44 Years | 801 (10.4%) | 905 (13.3%) |
| 45 to 54 Years | 712 (10.6%) | 804 (12.7%) |
| 55 to 64 Years | 654 (9.4%) | 966 (14.5%) |
| 65 to 74 Years | 532 (10.7%) | 774 (15.7%) |
| 75 Years and over | 312 (15.3%) | 364 (11.4%) |
| Total | 5,924 (10.8%) | 7,055 (13.5%) |
Income Above Poverty by Sex and Age in Everett
According to the poverty statistics in Everett, males aged 25 to 34 years and females aged 15 years are the age groups that are most secure financially, with 94.3% of males and 100.0% of females in these age groups living above the poverty line.
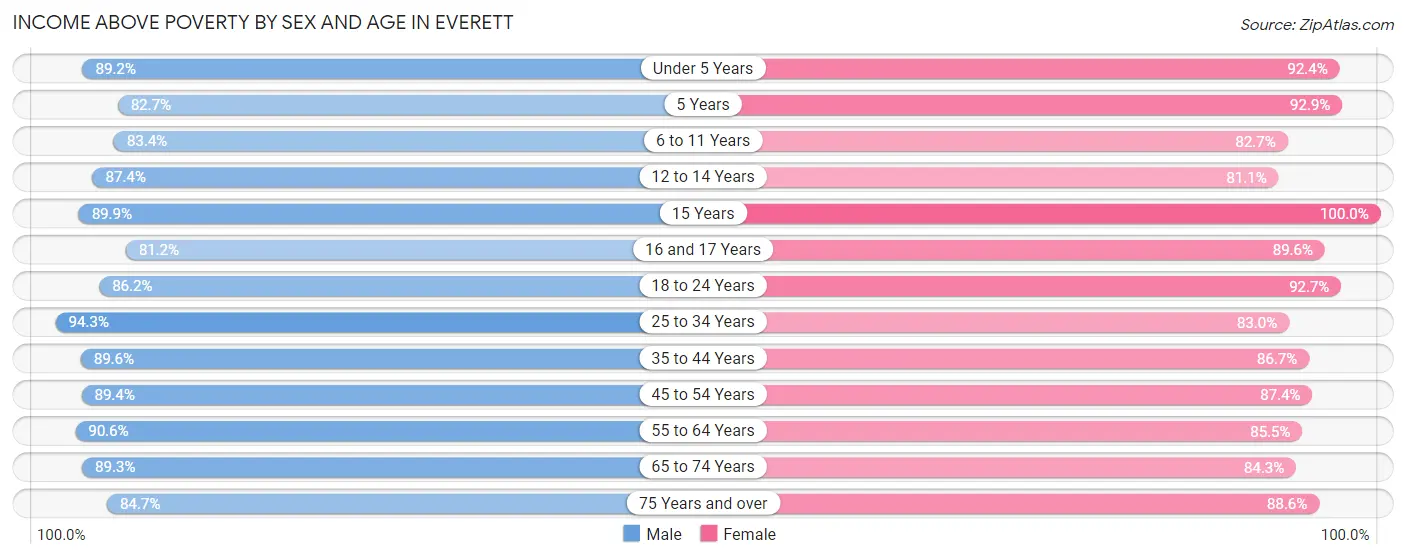
| Age Bracket | Male | Female |
| Under 5 Years | 3,165 (89.2%) | 2,472 (92.4%) |
| 5 Years | 550 (82.7%) | 469 (92.9%) |
| 6 to 11 Years | 3,230 (83.4%) | 2,630 (82.7%) |
| 12 to 14 Years | 1,509 (87.4%) | 1,352 (81.1%) |
| 15 Years | 599 (89.9%) | 623 (100.0%) |
| 16 and 17 Years | 1,020 (81.2%) | 1,289 (89.6%) |
| 18 to 24 Years | 4,192 (86.2%) | 4,068 (92.7%) |
| 25 to 34 Years | 9,497 (94.3%) | 8,143 (83.0%) |
| 35 to 44 Years | 6,873 (89.6%) | 5,917 (86.7%) |
| 45 to 54 Years | 6,023 (89.4%) | 5,552 (87.4%) |
| 55 to 64 Years | 6,293 (90.6%) | 5,685 (85.5%) |
| 65 to 74 Years | 4,448 (89.3%) | 4,163 (84.3%) |
| 75 Years and over | 1,727 (84.7%) | 2,827 (88.6%) |
| Total | 49,126 (89.2%) | 45,190 (86.5%) |
Income Below Poverty Among Married-Couple Families in Everett
The poverty statistics for married-couple families in Everett show that 4.8% or 806 of the total 16,837 families live below the poverty line. Families with 5 or more children have the highest poverty rate of 39.6%, comprising of 19 families. On the other hand, families with 1 or 2 children have the lowest poverty rate of 2.1%, which includes 124 families.
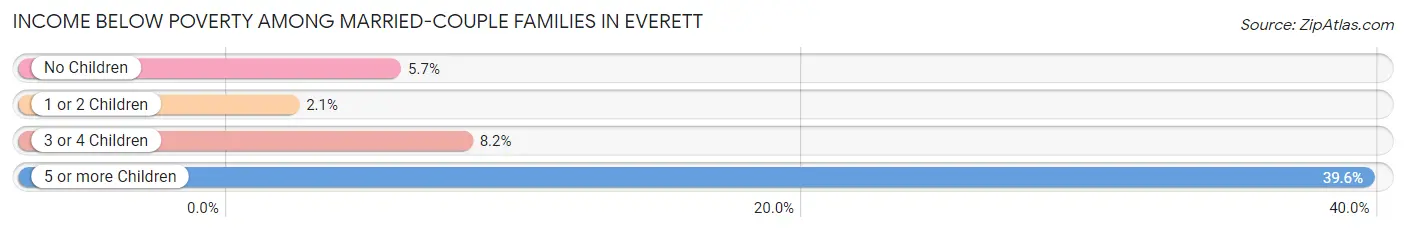
| Children | Above Poverty | Below Poverty |
| No Children | 8,818 (94.3%) | 531 (5.7%) |
| 1 or 2 Children | 5,701 (97.9%) | 124 (2.1%) |
| 3 or 4 Children | 1,483 (91.8%) | 132 (8.2%) |
| 5 or more Children | 29 (60.4%) | 19 (39.6%) |
| Total | 16,031 (95.2%) | 806 (4.8%) |
Income Below Poverty Among Single-Parent Households in Everett
According to the poverty data in Everett, 6.5% or 186 single-father households and 24.4% or 1,164 single-mother households are living below the poverty line. Among single-father households, those with 1 or 2 children have the highest poverty rate, with 141 households (10.3%) experiencing poverty. Likewise, among single-mother households, those with 1 or 2 children have the highest poverty rate, with 823 households (34.5%) falling below the poverty line.
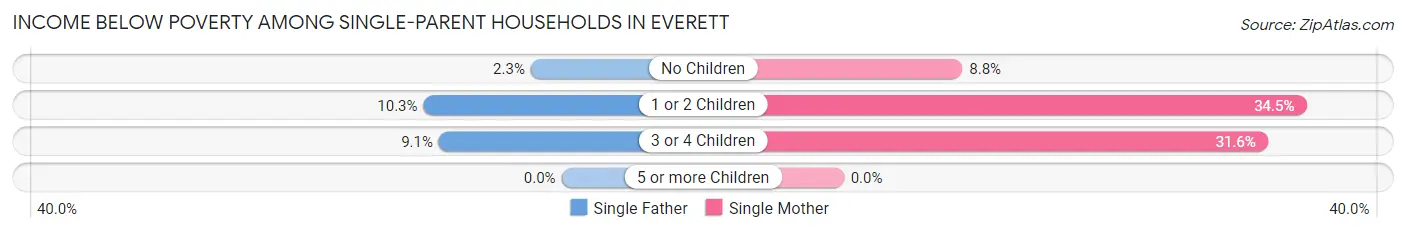
| Children | Single Father | Single Mother |
| No Children | 29 (2.3%) | 160 (8.8%) |
| 1 or 2 Children | 141 (10.3%) | 823 (34.5%) |
| 3 or 4 Children | 16 (9.1%) | 181 (31.6%) |
| 5 or more Children | 0 (0.0%) | 0 (0.0%) |
| Total | 186 (6.5%) | 1,164 (24.4%) |
Income Below Poverty Among Married-Couple vs Single-Parent Households in Everett
The poverty data for Everett shows that 806 of the married-couple family households (4.8%) and 1,350 of the single-parent households (17.7%) are living below the poverty level. Within the married-couple family households, those with 5 or more children have the highest poverty rate, with 19 households (39.6%) falling below the poverty line. Among the single-parent households, those with 3 or 4 children have the highest poverty rate, with 197 household (26.3%) living below poverty.
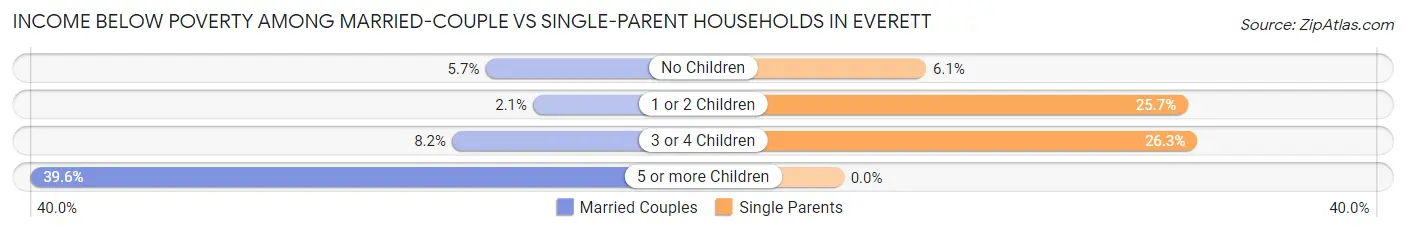
| Children | Married-Couple Families | Single-Parent Households |
| No Children | 531 (5.7%) | 189 (6.1%) |
| 1 or 2 Children | 124 (2.1%) | 964 (25.7%) |
| 3 or 4 Children | 132 (8.2%) | 197 (26.3%) |
| 5 or more Children | 19 (39.6%) | 0 (0.0%) |
| Total | 806 (4.8%) | 1,350 (17.7%) |
Race in Everett
The most populous races in Everett are White / Caucasian (70,592 | 63.7%), Hispanic or Latino (18,686 | 16.9%), and Two or more Races (11,651 | 10.5%).
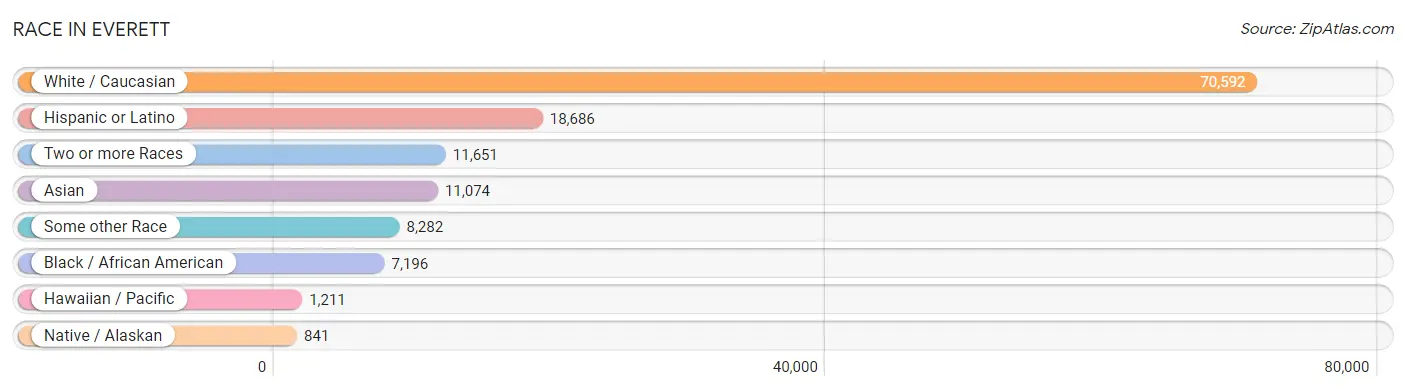
| Race | # Population | % Population |
| Asian | 11,074 | 10.0% |
| Black / African American | 7,196 | 6.5% |
| Hawaiian / Pacific | 1,211 | 1.1% |
| Hispanic or Latino | 18,686 | 16.9% |
| Native / Alaskan | 841 | 0.8% |
| White / Caucasian | 70,592 | 63.7% |
| Two or more Races | 11,651 | 10.5% |
| Some other Race | 8,282 | 7.5% |
| Total | 110,847 | 100.0% |
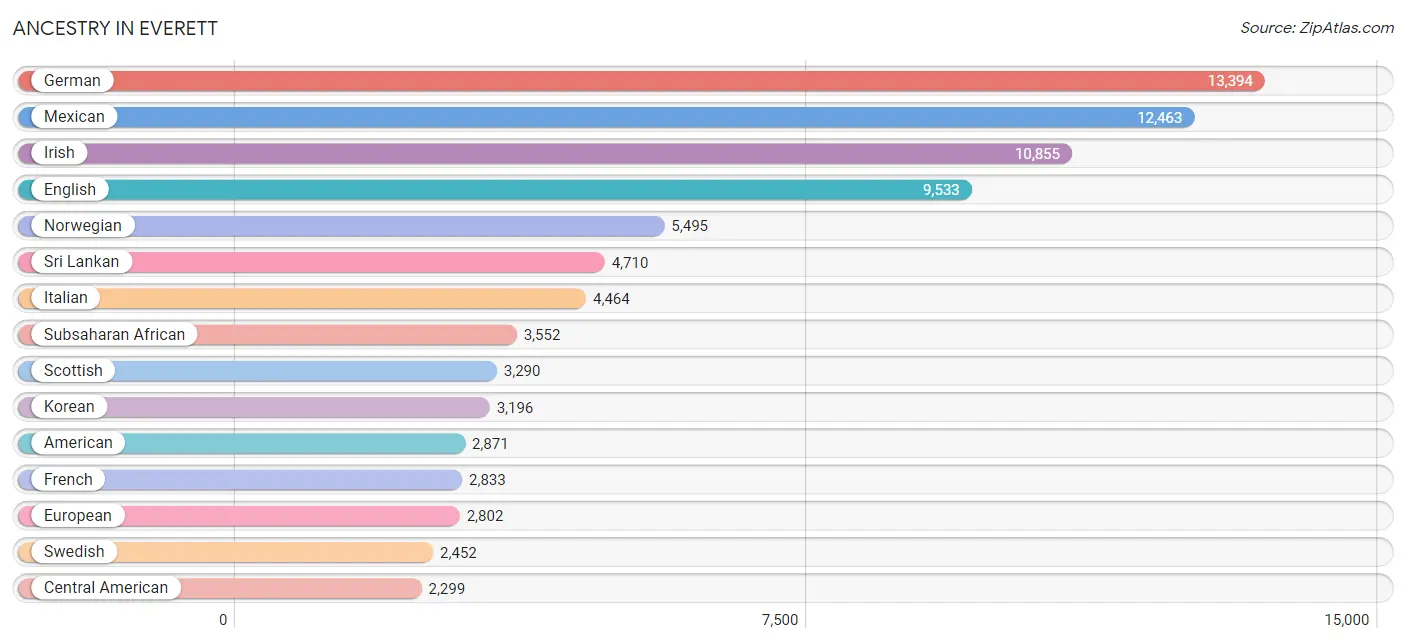
Ancestry in Everett
The most populous ancestries reported in Everett are German (13,394 | 12.1%), Mexican (12,463 | 11.2%), Irish (10,855 | 9.8%), English (9,533 | 8.6%), and Norwegian (5,495 | 5.0%), together accounting for 46.7% of all Everett residents.
| Ancestry | # Population | % Population |
| African | 923 | 0.8% |
| Alaska Native | 60 | 0.1% |
| Alaskan Athabascan | 13 | 0.0% |
| Albanian | 68 | 0.1% |
| Aleut | 47 | 0.0% |
| Alsatian | 16 | 0.0% |
| American | 2,871 | 2.6% |
| Apache | 79 | 0.1% |
| Arab | 696 | 0.6% |
| Argentinean | 154 | 0.1% |
| Armenian | 62 | 0.1% |
| Australian | 11 | 0.0% |
| Austrian | 238 | 0.2% |
| Bangladeshi | 124 | 0.1% |
| Barbadian | 8 | 0.0% |
| Basque | 92 | 0.1% |
| Belgian | 152 | 0.1% |
| Belizean | 113 | 0.1% |
| Bhutanese | 984 | 0.9% |
| Blackfeet | 304 | 0.3% |
| Bolivian | 35 | 0.0% |
| Brazilian | 235 | 0.2% |
| British | 853 | 0.8% |
| Bulgarian | 39 | 0.0% |
| Burmese | 1,452 | 1.3% |
| Cajun | 10 | 0.0% |
| Cambodian | 24 | 0.0% |
| Canadian | 349 | 0.3% |
| Celtic | 11 | 0.0% |
| Central American | 2,299 | 2.1% |
| Central American Indian | 30 | 0.0% |
| Cherokee | 428 | 0.4% |
| Cheyenne | 55 | 0.1% |
| Chickasaw | 46 | 0.0% |
| Chilean | 36 | 0.0% |
| Chinese | 12 | 0.0% |
| Chippewa | 34 | 0.0% |
| Choctaw | 122 | 0.1% |
| Colombian | 638 | 0.6% |
| Colville | 24 | 0.0% |
| Costa Rican | 29 | 0.0% |
| Creek | 21 | 0.0% |
| Croatian | 114 | 0.1% |
| Cuban | 273 | 0.3% |
| Czech | 250 | 0.2% |
| Czechoslovakian | 92 | 0.1% |
| Danish | 810 | 0.7% |
| Dominican | 157 | 0.1% |
| Dutch | 1,327 | 1.2% |
| Eastern European | 99 | 0.1% |
| Ecuadorian | 136 | 0.1% |
| Egyptian | 31 | 0.0% |
| English | 9,533 | 8.6% |
| Estonian | 17 | 0.0% |
| Ethiopian | 951 | 0.9% |
| European | 2,802 | 2.5% |
| Fijian | 437 | 0.4% |
| Filipino | 45 | 0.0% |
| Finnish | 584 | 0.5% |
| French | 2,833 | 2.6% |
| French American Indian | 66 | 0.1% |
| French Canadian | 701 | 0.6% |
| German | 13,394 | 12.1% |
| Ghanaian | 6 | 0.0% |
| Greek | 280 | 0.3% |
| Guamanian / Chamorro | 314 | 0.3% |
| Guatemalan | 1,051 | 0.9% |
| Guyanese | 8 | 0.0% |
| Haitian | 34 | 0.0% |
| Honduran | 409 | 0.4% |
| Hungarian | 138 | 0.1% |
| Icelander | 90 | 0.1% |
| Indian (Asian) | 1,141 | 1.0% |
| Indonesian | 57 | 0.1% |
| Inupiat | 71 | 0.1% |
| Iranian | 289 | 0.3% |
| Iraqi | 272 | 0.3% |
| Irish | 10,855 | 9.8% |
| Iroquois | 17 | 0.0% |
| Italian | 4,464 | 4.0% |
| Jamaican | 73 | 0.1% |
| Japanese | 959 | 0.9% |
| Jordanian | 9 | 0.0% |
| Kenyan | 475 | 0.4% |
| Korean | 3,196 | 2.9% |
| Laotian | 155 | 0.1% |
| Latvian | 18 | 0.0% |
| Lebanese | 111 | 0.1% |
| Liberian | 21 | 0.0% |
| Lithuanian | 135 | 0.1% |
| Luxembourger | 31 | 0.0% |
| Malaysian | 849 | 0.8% |
| Maltese | 24 | 0.0% |
| Marshallese | 13 | 0.0% |
| Mexican | 12,463 | 11.2% |
| Mexican American Indian | 188 | 0.2% |
| Mongolian | 54 | 0.1% |
| Moroccan | 96 | 0.1% |
| Native Hawaiian | 360 | 0.3% |
| Navajo | 84 | 0.1% |
| Nicaraguan | 172 | 0.2% |
| Nigerian | 190 | 0.2% |
| Northern European | 511 | 0.5% |
| Norwegian | 5,495 | 5.0% |
| Osage | 10 | 0.0% |
| Pakistani | 166 | 0.2% |
| Palestinian | 41 | 0.0% |
| Panamanian | 5 | 0.0% |
| Paraguayan | 17 | 0.0% |
| Pennsylvania German | 21 | 0.0% |
| Peruvian | 538 | 0.5% |
| Polish | 1,426 | 1.3% |
| Portuguese | 278 | 0.3% |
| Puerto Rican | 731 | 0.7% |
| Puget Sound Salish | 588 | 0.5% |
| Romanian | 348 | 0.3% |
| Russian | 1,769 | 1.6% |
| Salvadoran | 633 | 0.6% |
| Samoan | 166 | 0.2% |
| Scandinavian | 862 | 0.8% |
| Scotch-Irish | 1,186 | 1.1% |
| Scottish | 3,290 | 3.0% |
| Seminole | 87 | 0.1% |
| Senegalese | 24 | 0.0% |
| Serbian | 30 | 0.0% |
| Sierra Leonean | 70 | 0.1% |
| Sioux | 246 | 0.2% |
| Slavic | 97 | 0.1% |
| Slovak | 67 | 0.1% |
| Somali | 2 | 0.0% |
| South American | 1,681 | 1.5% |
| South American Indian | 21 | 0.0% |
| Spaniard | 203 | 0.2% |
| Spanish | 396 | 0.4% |
| Spanish American | 101 | 0.1% |
| Sri Lankan | 4,710 | 4.3% |
| Subsaharan African | 3,552 | 3.2% |
| Sudanese | 63 | 0.1% |
| Swedish | 2,452 | 2.2% |
| Swiss | 292 | 0.3% |
| Syrian | 21 | 0.0% |
| Thai | 953 | 0.9% |
| Tlingit-Haida | 162 | 0.2% |
| Tongan | 15 | 0.0% |
| Turkish | 21 | 0.0% |
| Ugandan | 35 | 0.0% |
| Ukrainian | 1,393 | 1.3% |
| Venezuelan | 127 | 0.1% |
| Welsh | 616 | 0.6% |
| West Indian | 58 | 0.1% |
| Yakama | 27 | 0.0% |
| Yugoslavian | 32 | 0.0% |
| Yup'ik | 10 | 0.0% | View All 153 Rows |
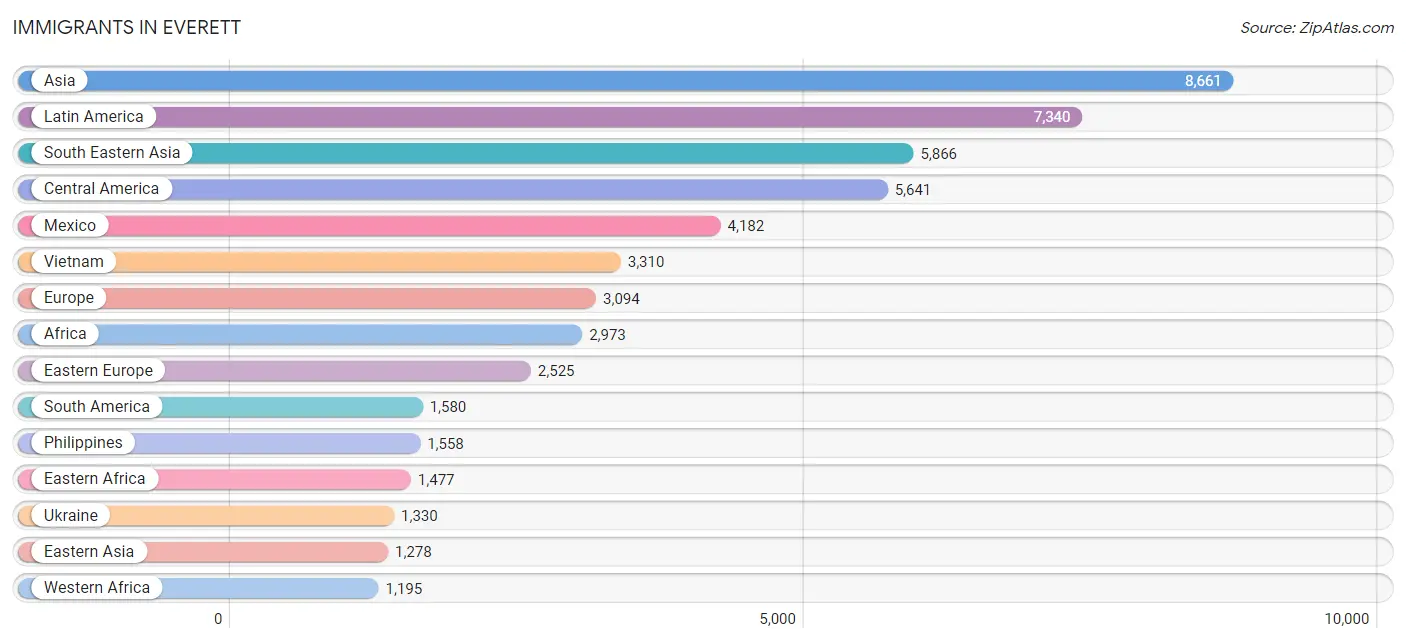
Immigrants in Everett
The most numerous immigrant groups reported in Everett came from Asia (8,661 | 7.8%), Latin America (7,340 | 6.6%), South Eastern Asia (5,866 | 5.3%), Central America (5,641 | 5.1%), and Mexico (4,182 | 3.8%), together accounting for 28.6% of all Everett residents.
| Immigration Origin | # Population | % Population |
| Africa | 2,973 | 2.7% |
| Albania | 39 | 0.0% |
| Argentina | 44 | 0.0% |
| Asia | 8,661 | 7.8% |
| Belarus | 75 | 0.1% |
| Belgium | 83 | 0.1% |
| Bolivia | 35 | 0.0% |
| Brazil | 305 | 0.3% |
| Bulgaria | 39 | 0.0% |
| Cambodia | 370 | 0.3% |
| Canada | 293 | 0.3% |
| Caribbean | 119 | 0.1% |
| Central America | 5,641 | 5.1% |
| Chile | 13 | 0.0% |
| China | 234 | 0.2% |
| Colombia | 439 | 0.4% |
| Congo | 25 | 0.0% |
| Costa Rica | 29 | 0.0% |
| Cuba | 25 | 0.0% |
| Czechoslovakia | 17 | 0.0% |
| Denmark | 7 | 0.0% |
| Dominican Republic | 56 | 0.1% |
| Eastern Africa | 1,477 | 1.3% |
| Eastern Asia | 1,278 | 1.1% |
| Eastern Europe | 2,525 | 2.3% |
| Ecuador | 17 | 0.0% |
| Egypt | 5 | 0.0% |
| El Salvador | 474 | 0.4% |
| England | 83 | 0.1% |
| Eritrea | 10 | 0.0% |
| Ethiopia | 892 | 0.8% |
| Europe | 3,094 | 2.8% |
| Fiji | 139 | 0.1% |
| France | 31 | 0.0% |
| Germany | 181 | 0.2% |
| Ghana | 122 | 0.1% |
| Greece | 5 | 0.0% |
| Guatemala | 759 | 0.7% |
| Haiti | 25 | 0.0% |
| Honduras | 168 | 0.2% |
| Hong Kong | 23 | 0.0% |
| India | 479 | 0.4% |
| Indonesia | 105 | 0.1% |
| Iran | 315 | 0.3% |
| Iraq | 230 | 0.2% |
| Ireland | 20 | 0.0% |
| Jamaica | 13 | 0.0% |
| Japan | 122 | 0.1% |
| Jordan | 20 | 0.0% |
| Kenya | 543 | 0.5% |
| Korea | 922 | 0.8% |
| Kuwait | 41 | 0.0% |
| Laos | 318 | 0.3% |
| Latin America | 7,340 | 6.6% |
| Latvia | 18 | 0.0% |
| Liberia | 21 | 0.0% |
| Lithuania | 11 | 0.0% |
| Malaysia | 54 | 0.1% |
| Mexico | 4,182 | 3.8% |
| Micronesia | 3 | 0.0% |
| Middle Africa | 172 | 0.2% |
| Morocco | 32 | 0.0% |
| Netherlands | 12 | 0.0% |
| Nicaragua | 29 | 0.0% |
| Nigeria | 143 | 0.1% |
| Northern Africa | 110 | 0.1% |
| Northern Europe | 246 | 0.2% |
| Norway | 23 | 0.0% |
| Oceania | 697 | 0.6% |
| Pakistan | 68 | 0.1% |
| Peru | 583 | 0.5% |
| Philippines | 1,558 | 1.4% |
| Poland | 48 | 0.0% |
| Romania | 178 | 0.2% |
| Russia | 758 | 0.7% |
| Saudi Arabia | 23 | 0.0% |
| Scotland | 11 | 0.0% |
| Senegal | 24 | 0.0% |
| Sierra Leone | 26 | 0.0% |
| Somalia | 2 | 0.0% |
| South America | 1,580 | 1.4% |
| South Central Asia | 1,050 | 0.9% |
| South Eastern Asia | 5,866 | 5.3% |
| Southern Europe | 9 | 0.0% |
| Spain | 4 | 0.0% |
| Sri Lanka | 8 | 0.0% |
| Sudan | 73 | 0.1% |
| Syria | 14 | 0.0% |
| Taiwan | 17 | 0.0% |
| Thailand | 109 | 0.1% |
| Turkey | 9 | 0.0% |
| Uganda | 15 | 0.0% |
| Ukraine | 1,330 | 1.2% |
| Uzbekistan | 43 | 0.0% |
| Venezuela | 127 | 0.1% |
| Vietnam | 3,310 | 3.0% |
| Western Africa | 1,195 | 1.1% |
| Western Asia | 467 | 0.4% |
| Western Europe | 307 | 0.3% |
| Zaire | 80 | 0.1% | View All 100 Rows |
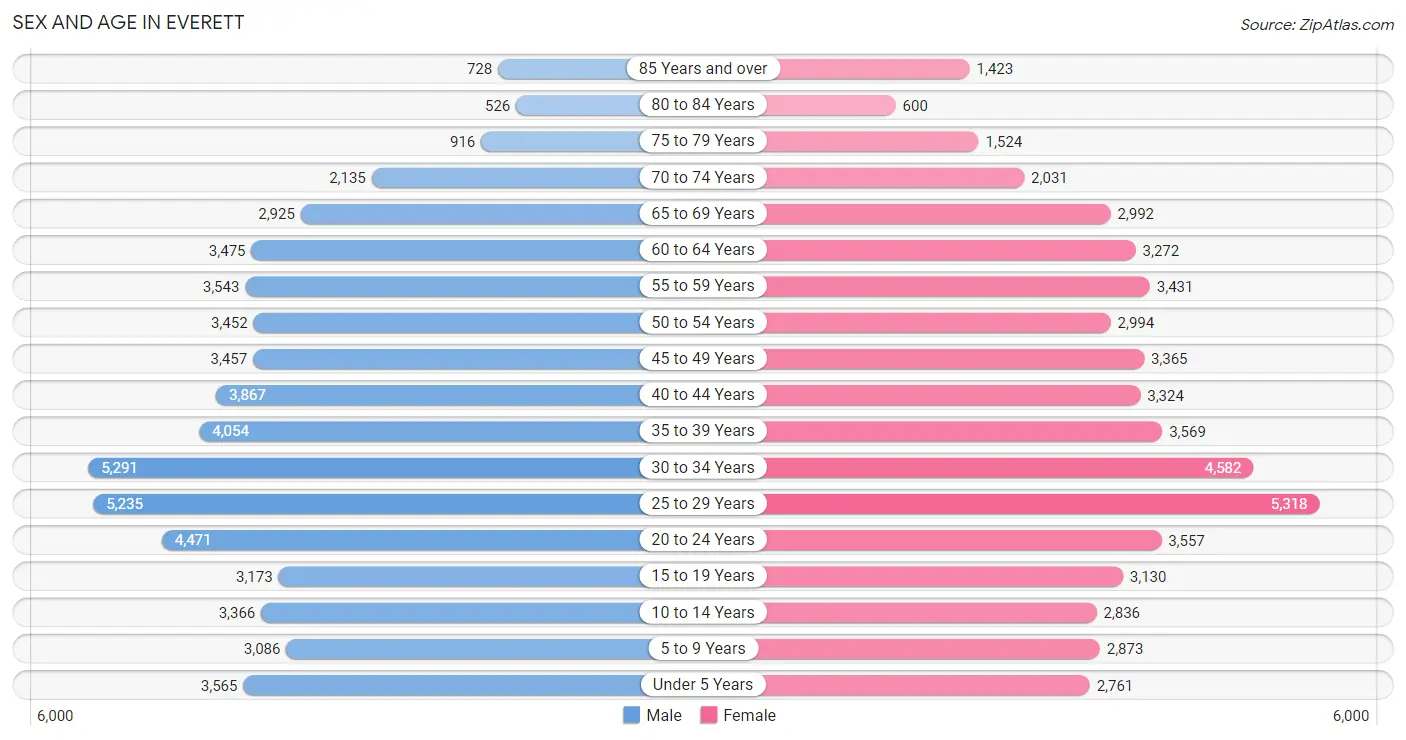
Sex and Age in Everett
Sex and Age in Everett
The most populous age groups in Everett are 30 to 34 Years (5,291 | 9.2%) for men and 25 to 29 Years (5,318 | 9.9%) for women.
| Age Bracket | Male | Female |
| Under 5 Years | 3,565 (6.2%) | 2,761 (5.1%) |
| 5 to 9 Years | 3,086 (5.4%) | 2,873 (5.4%) |
| 10 to 14 Years | 3,366 (5.9%) | 2,836 (5.3%) |
| 15 to 19 Years | 3,173 (5.5%) | 3,130 (5.8%) |
| 20 to 24 Years | 4,471 (7.8%) | 3,557 (6.6%) |
| 25 to 29 Years | 5,235 (9.1%) | 5,318 (9.9%) |
| 30 to 34 Years | 5,291 (9.2%) | 4,582 (8.6%) |
| 35 to 39 Years | 4,054 (7.1%) | 3,569 (6.7%) |
| 40 to 44 Years | 3,867 (6.8%) | 3,324 (6.2%) |
| 45 to 49 Years | 3,457 (6.0%) | 3,365 (6.3%) |
| 50 to 54 Years | 3,452 (6.0%) | 2,994 (5.6%) |
| 55 to 59 Years | 3,543 (6.2%) | 3,431 (6.4%) |
| 60 to 64 Years | 3,475 (6.1%) | 3,272 (6.1%) |
| 65 to 69 Years | 2,925 (5.1%) | 2,992 (5.6%) |
| 70 to 74 Years | 2,135 (3.7%) | 2,031 (3.8%) |
| 75 to 79 Years | 916 (1.6%) | 1,524 (2.8%) |
| 80 to 84 Years | 526 (0.9%) | 600 (1.1%) |
| 85 Years and over | 728 (1.3%) | 1,423 (2.7%) |
| Total | 57,265 (100.0%) | 53,582 (100.0%) |
Families and Households in Everett
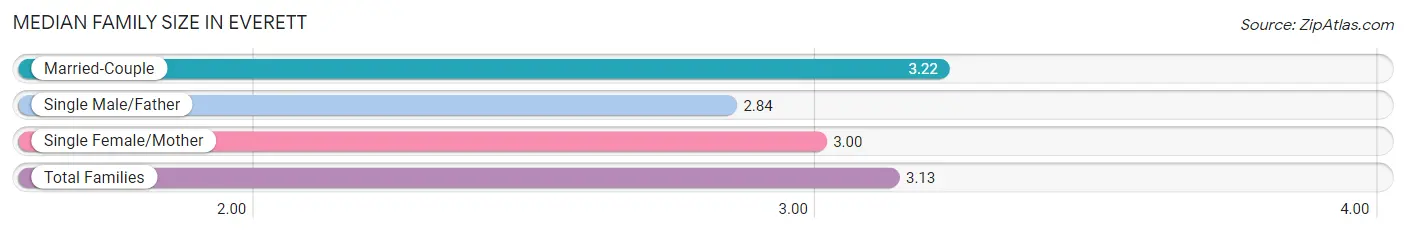
Median Family Size in Everett
The median family size in Everett is 3.13 persons per family, with married-couple families (16,837 | 68.8%) accounting for the largest median family size of 3.22 persons per family. On the other hand, single male/father families (2,869 | 11.7%) represent the smallest median family size with 2.84 persons per family.
| Family Type | # Families | Family Size |
| Married-Couple | 16,837 (68.8%) | 3.22 |
| Single Male/Father | 2,869 (11.7%) | 2.84 |
| Single Female/Mother | 4,770 (19.5%) | 3.00 |
| Total Families | 24,476 (100.0%) | 3.13 |
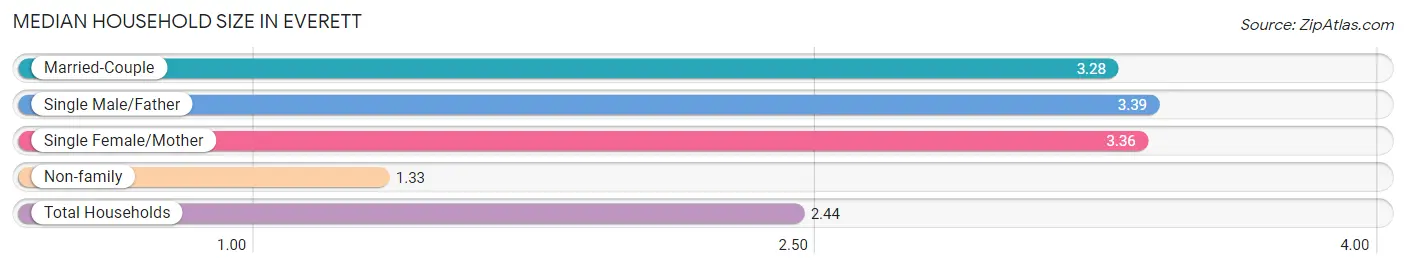
Median Household Size in Everett
The median household size in Everett is 2.44 persons per household, with single male/father households (2,869 | 6.5%) accounting for the largest median household size of 3.39 persons per household. non-family households (19,364 | 44.2%) represent the smallest median household size with 1.33 persons per household.
| Household Type | # Households | Household Size |
| Married-Couple | 16,837 (38.4%) | 3.28 |
| Single Male/Father | 2,869 (6.5%) | 3.39 |
| Single Female/Mother | 4,770 (10.9%) | 3.36 |
| Non-family | 19,364 (44.2%) | 1.33 |
| Total Households | 43,840 (100.0%) | 2.44 |
Household Size by Marriage Status in Everett
Out of a total of 43,840 households in Everett, 24,476 (55.8%) are family households, while 19,364 (44.2%) are nonfamily households. The most numerous type of family households are 2-person households, comprising 9,378, and the most common type of nonfamily households are 1-person households, comprising 14,204.
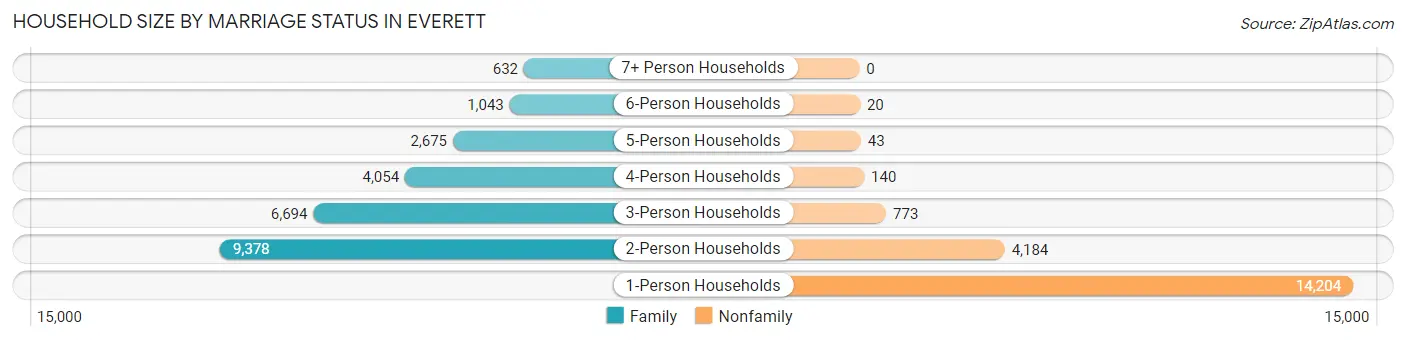
| Household Size | Family Households | Nonfamily Households |
| 1-Person Households | - | 14,204 (32.4%) |
| 2-Person Households | 9,378 (21.4%) | 4,184 (9.5%) |
| 3-Person Households | 6,694 (15.3%) | 773 (1.8%) |
| 4-Person Households | 4,054 (9.2%) | 140 (0.3%) |
| 5-Person Households | 2,675 (6.1%) | 43 (0.1%) |
| 6-Person Households | 1,043 (2.4%) | 20 (0.1%) |
| 7+ Person Households | 632 (1.4%) | 0 (0.0%) |
| Total | 24,476 (55.8%) | 19,364 (44.2%) |
Female Fertility in Everett
Fertility by Age in Everett
Average fertility rate in Everett is 40.0 births per 1,000 women. Women in the age bracket of 20 to 34 years have the highest fertility rate with 63.0 births per 1,000 women. Women in the age bracket of 20 to 34 years acount for 75.8% of all women with births.
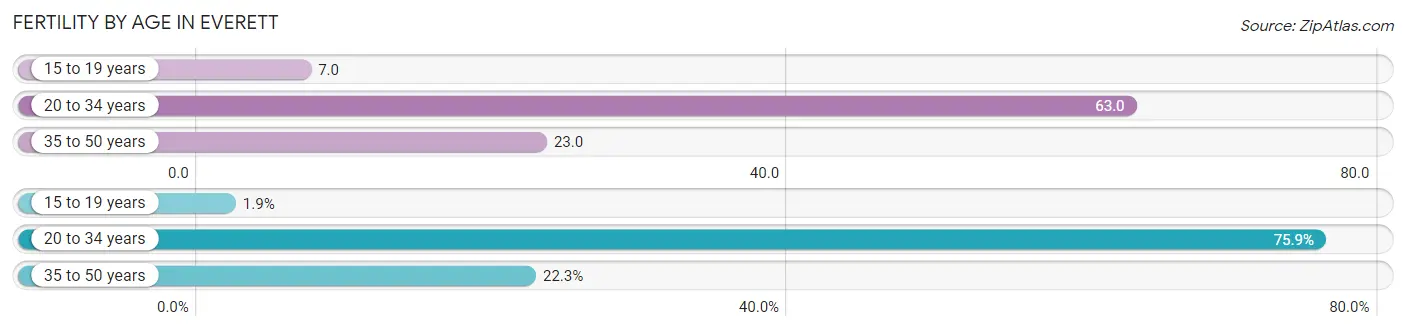
| Age Bracket | Women with Births | Births / 1,000 Women |
| 15 to 19 years | 21 (1.9%) | 7.0 |
| 20 to 34 years | 845 (75.8%) | 63.0 |
| 35 to 50 years | 248 (22.3%) | 23.0 |
| Total | 1,114 (100.0%) | 40.0 |
Fertility by Age by Marriage Status in Everett
86.5% of women with births (1,114) in Everett are married. The highest percentage of unmarried women with births falls into 15 to 19 years age bracket with 100.0% of them unmarried at the time of birth, while the lowest percentage of unmarried women with births belong to 35 to 50 years age bracket with 1.2% of them unmarried.
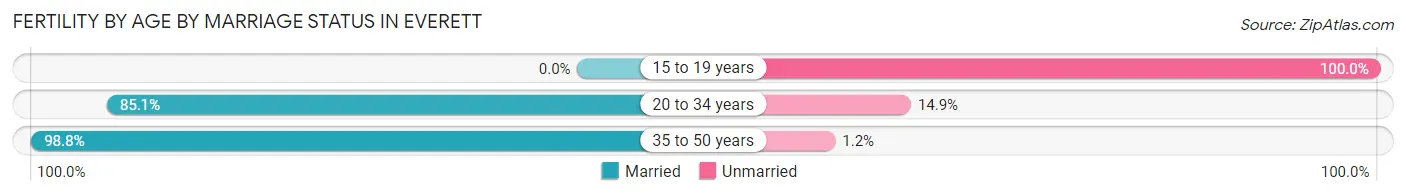
| Age Bracket | Married | Unmarried |
| 15 to 19 years | 0 (0.0%) | 21 (100.0%) |
| 20 to 34 years | 719 (85.1%) | 126 (14.9%) |
| 35 to 50 years | 245 (98.8%) | 3 (1.2%) |
| Total | 964 (86.5%) | 150 (13.5%) |
Fertility by Education in Everett
Average fertility rate in Everett is 40.0 births per 1,000 women. Women with the education attainment of bachelor's degree have the highest fertility rate of 59.0 births per 1,000 women, while women with the education attainment of graduate degree have the lowest fertility at 19.0 births per 1,000 women. Women with the education attainment of college or associate's degree represent 30.2% of all women with births.
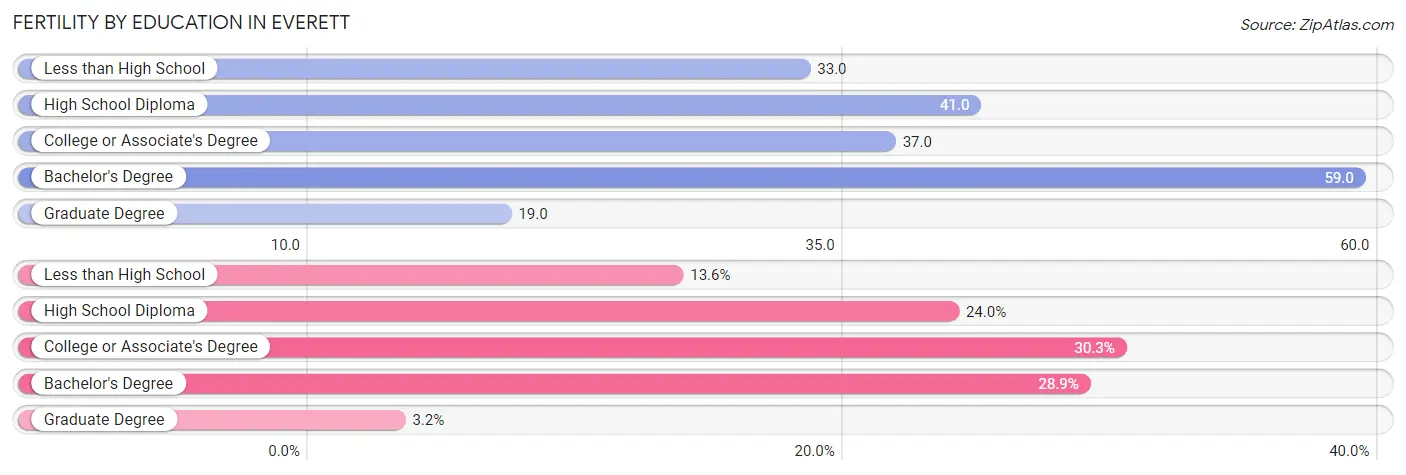
| Educational Attainment | Women with Births | Births / 1,000 Women |
| Less than High School | 152 (13.6%) | 33.0 |
| High School Diploma | 267 (24.0%) | 41.0 |
| College or Associate's Degree | 337 (30.2%) | 37.0 |
| Bachelor's Degree | 322 (28.9%) | 59.0 |
| Graduate Degree | 36 (3.2%) | 19.0 |
| Total | 1,114 (100.0%) | 40.0 |
Fertility by Education by Marriage Status in Everett
13.5% of women with births in Everett are unmarried. Women with the educational attainment of bachelor's degree are most likely to be married with 100.0% of them married at childbirth, while women with the educational attainment of high school diploma are least likely to be married with 28.1% of them unmarried at childbirth.
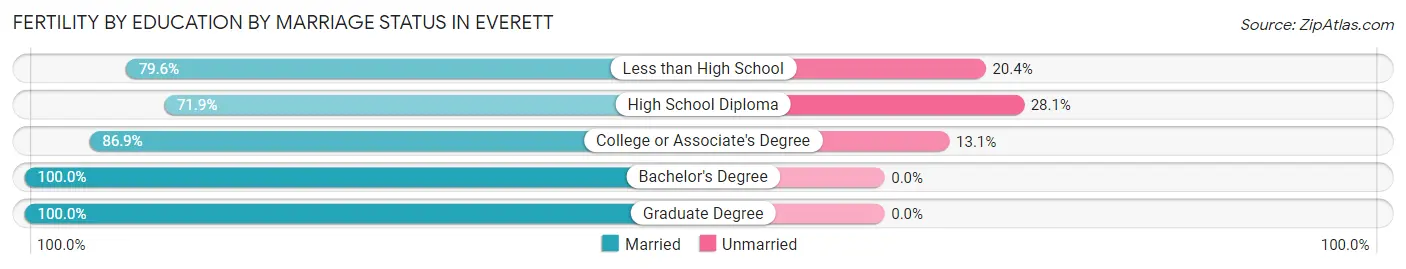
| Educational Attainment | Married | Unmarried |
| Less than High School | 121 (79.6%) | 31 (20.4%) |
| High School Diploma | 192 (71.9%) | 75 (28.1%) |
| College or Associate's Degree | 293 (86.9%) | 44 (13.1%) |
| Bachelor's Degree | 322 (100.0%) | 0 (0.0%) |
| Graduate Degree | 36 (100.0%) | 0 (0.0%) |
| Total | 964 (86.5%) | 150 (13.5%) |
Employment Characteristics in Everett
Employment by Class of Employer in Everett
Among the 56,672 employed individuals in Everett, private company employees (39,124 | 69.0%), not-for-profit organizations (4,770 | 8.4%), and local government employees (3,858 | 6.8%) make up the most common classes of employment.
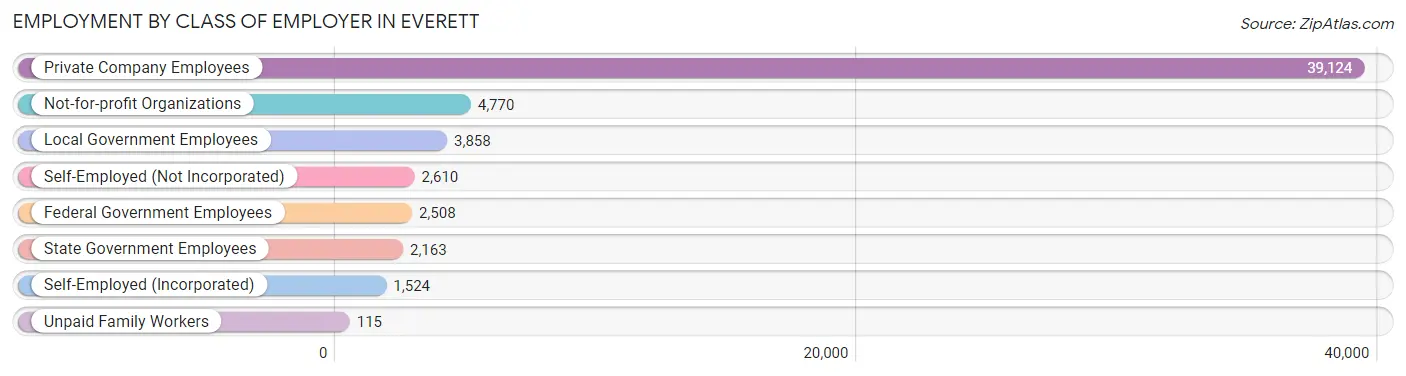
| Employer Class | # Employees | % Employees |
| Private Company Employees | 39,124 | 69.0% |
| Self-Employed (Incorporated) | 1,524 | 2.7% |
| Self-Employed (Not Incorporated) | 2,610 | 4.6% |
| Not-for-profit Organizations | 4,770 | 8.4% |
| Local Government Employees | 3,858 | 6.8% |
| State Government Employees | 2,163 | 3.8% |
| Federal Government Employees | 2,508 | 4.4% |
| Unpaid Family Workers | 115 | 0.2% |
| Total | 56,672 | 100.0% |
Employment Status by Age in Everett
According to the labor force statistics for Everett, out of the total population over 16 years of age (91,059), 67.5% or 61,465 individuals are in the labor force, with 5.8% or 3,565 of them unemployed. The age group with the highest labor force participation rate is 25 to 29 years, with 88.2% or 9,308 individuals in the labor force. Within the labor force, the 16 to 19 years age range has the highest percentage of unemployed individuals, with 24.2% or 478 of them being unemployed.
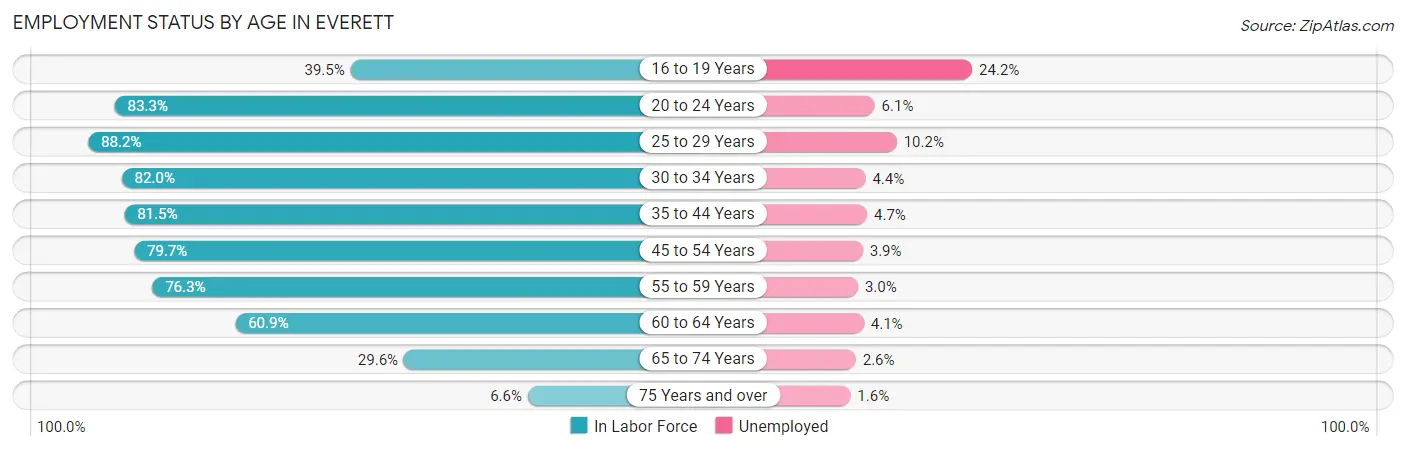
| Age Bracket | In Labor Force | Unemployed |
| 16 to 19 Years | 1,976 (39.5%) | 478 (24.2%) |
| 20 to 24 Years | 6,687 (83.3%) | 408 (6.1%) |
| 25 to 29 Years | 9,308 (88.2%) | 949 (10.2%) |
| 30 to 34 Years | 8,096 (82.0%) | 356 (4.4%) |
| 35 to 44 Years | 12,073 (81.5%) | 567 (4.7%) |
| 45 to 54 Years | 10,575 (79.7%) | 412 (3.9%) |
| 55 to 59 Years | 5,321 (76.3%) | 160 (3.0%) |
| 60 to 64 Years | 4,109 (60.9%) | 168 (4.1%) |
| 65 to 74 Years | 2,985 (29.6%) | 78 (2.6%) |
| 75 Years and over | 377 (6.6%) | 6 (1.6%) |
| Total | 61,465 (67.5%) | 3,565 (5.8%) |
Employment Status by Educational Attainment in Everett
According to labor force statistics for Everett, 79.5% of individuals (49,472) out of the total population between 25 and 64 years of age (62,229) are in the labor force, with 5.2% or 2,573 of them being unemployed. The group with the highest labor force participation rate are those with the educational attainment of bachelor's degree or higher, with 89.3% or 15,176 individuals in the labor force. Within the labor force, individuals with college / associate degree education have the highest percentage of unemployment, with 7.2% or 1,295 of them being unemployed.
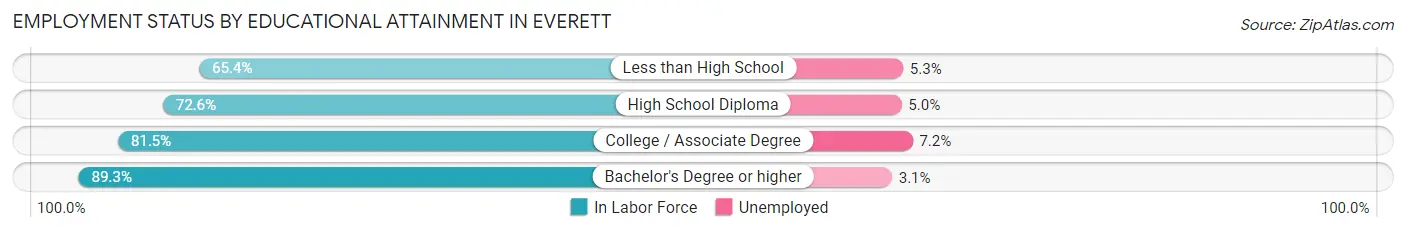
| Educational Attainment | In Labor Force | Unemployed |
| Less than High School | 4,597 (65.4%) | 373 (5.3%) |
| High School Diploma | 11,716 (72.6%) | 807 (5.0%) |
| College / Associate Degree | 17,985 (81.5%) | 1,589 (7.2%) |
| Bachelor's Degree or higher | 15,176 (89.3%) | 527 (3.1%) |
| Total | 49,472 (79.5%) | 3,236 (5.2%) |
Employment Occupations by Sex in Everett
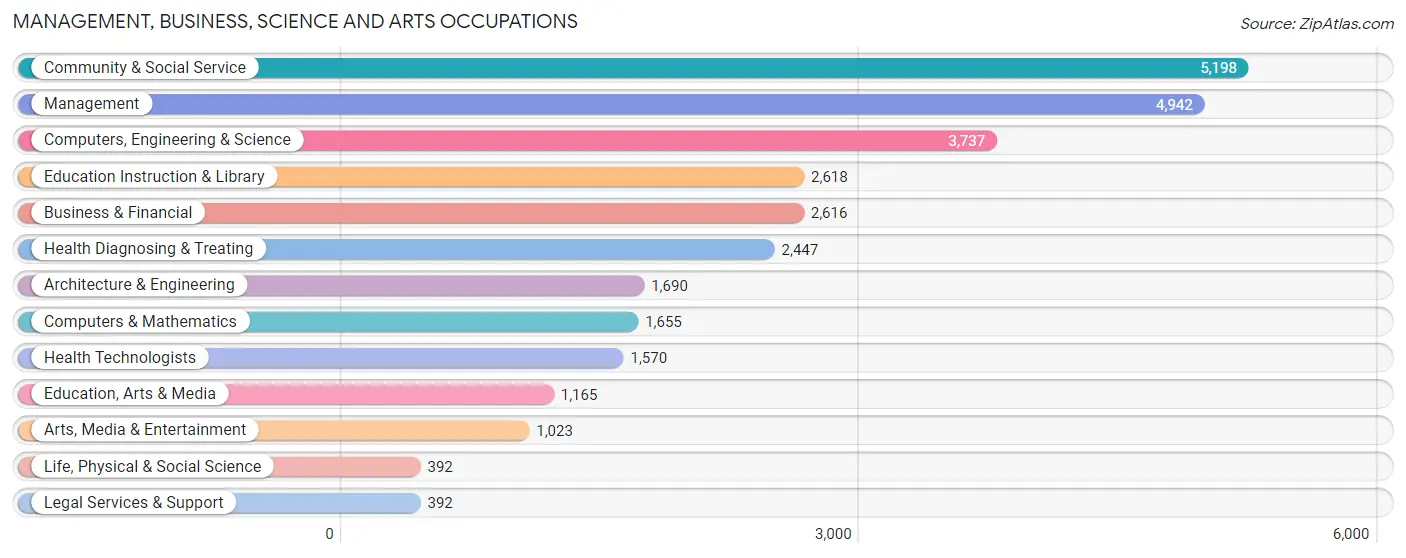
Management, Business, Science and Arts Occupations
The most common Management, Business, Science and Arts occupations in Everett are Community & Social Service (5,198 | 9.2%), Management (4,942 | 8.8%), Computers, Engineering & Science (3,737 | 6.6%), Education Instruction & Library (2,618 | 4.6%), and Business & Financial (2,616 | 4.6%).
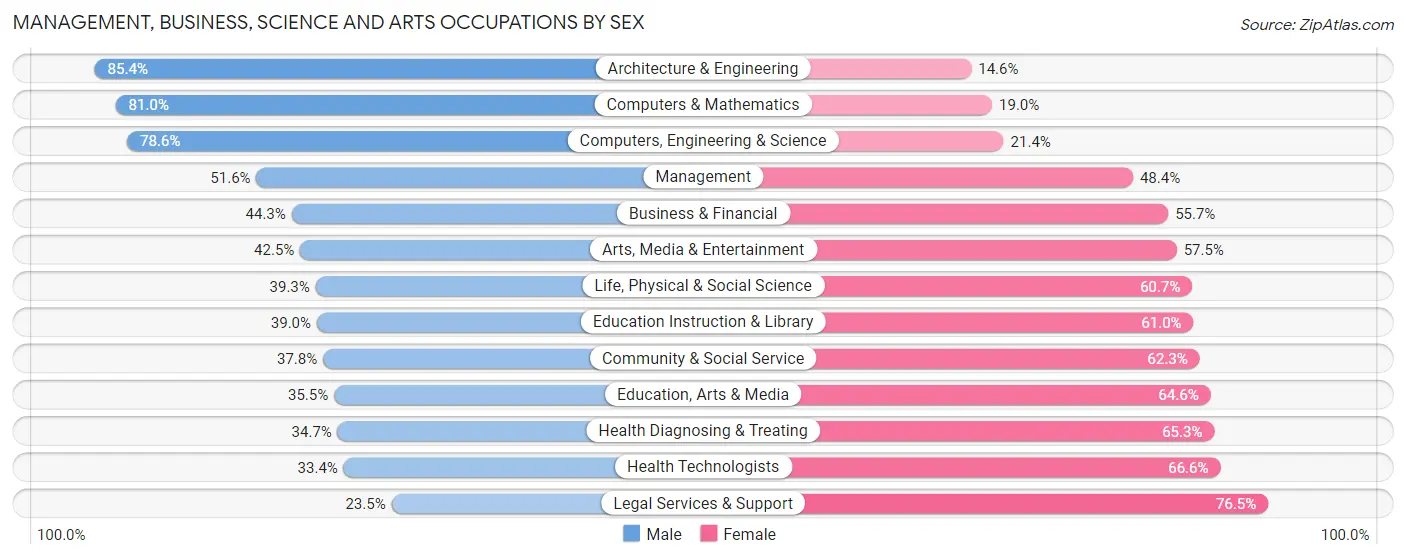
Management, Business, Science and Arts Occupations by Sex
Within the Management, Business, Science and Arts occupations in Everett, the most male-oriented occupations are Architecture & Engineering (85.4%), Computers & Mathematics (81.0%), and Computers, Engineering & Science (78.6%), while the most female-oriented occupations are Legal Services & Support (76.5%), Health Technologists (66.6%), and Health Diagnosing & Treating (65.3%).
| Occupation | Male | Female |
| Management | 2,552 (51.6%) | 2,390 (48.4%) |
| Business & Financial | 1,159 (44.3%) | 1,457 (55.7%) |
| Computers, Engineering & Science | 2,938 (78.6%) | 799 (21.4%) |
| Computers & Mathematics | 1,341 (81.0%) | 314 (19.0%) |
| Architecture & Engineering | 1,443 (85.4%) | 247 (14.6%) |
| Life, Physical & Social Science | 154 (39.3%) | 238 (60.7%) |
| Community & Social Service | 1,962 (37.8%) | 3,236 (62.3%) |
| Education, Arts & Media | 413 (35.4%) | 752 (64.5%) |
| Legal Services & Support | 92 (23.5%) | 300 (76.5%) |
| Education Instruction & Library | 1,022 (39.0%) | 1,596 (61.0%) |
| Arts, Media & Entertainment | 435 (42.5%) | 588 (57.5%) |
| Health Diagnosing & Treating | 849 (34.7%) | 1,598 (65.3%) |
| Health Technologists | 525 (33.4%) | 1,045 (66.6%) |
| Total (Category) | 9,460 (49.9%) | 9,480 (50.0%) |
| Total (Overall) | 31,143 (55.2%) | 25,221 (44.8%) |
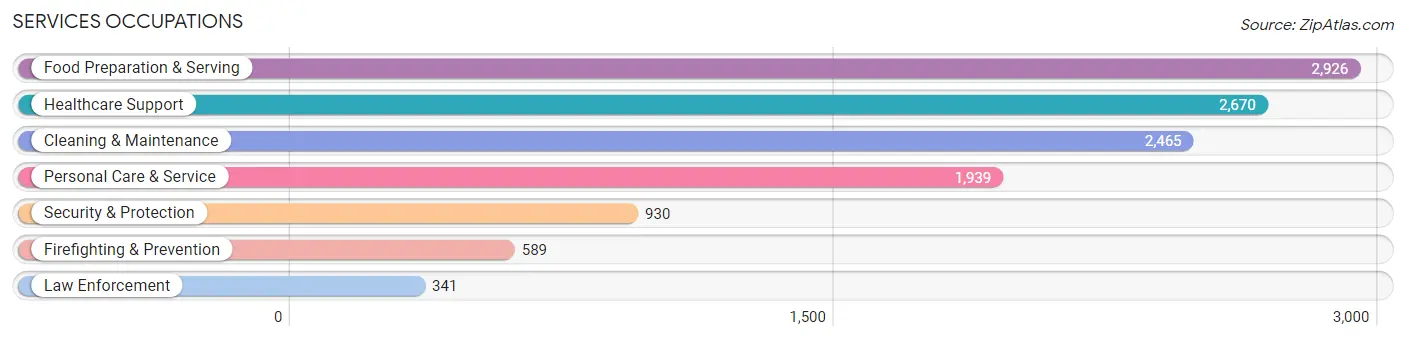
Services Occupations
The most common Services occupations in Everett are Food Preparation & Serving (2,926 | 5.2%), Healthcare Support (2,670 | 4.7%), Cleaning & Maintenance (2,465 | 4.4%), Personal Care & Service (1,939 | 3.4%), and Security & Protection (930 | 1.7%).
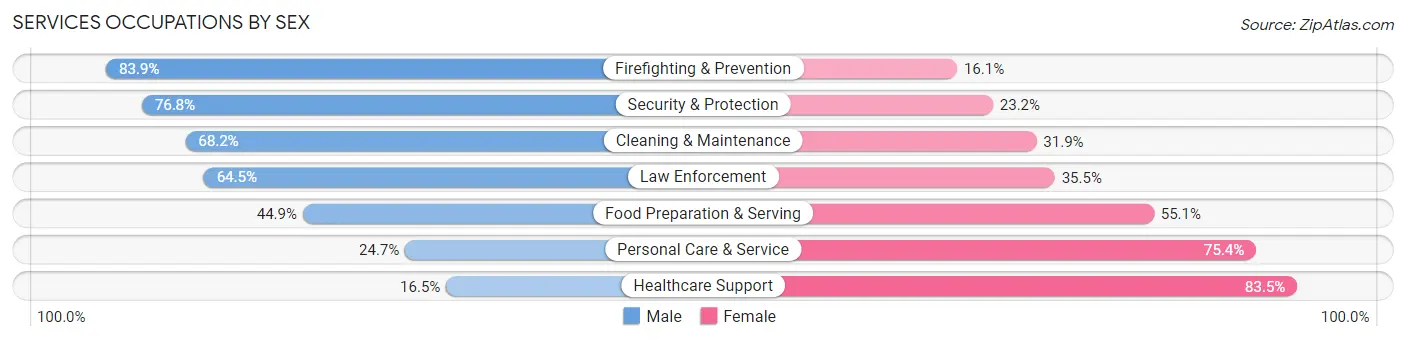
Services Occupations by Sex
Within the Services occupations in Everett, the most male-oriented occupations are Firefighting & Prevention (83.9%), Security & Protection (76.8%), and Cleaning & Maintenance (68.1%), while the most female-oriented occupations are Healthcare Support (83.5%), Personal Care & Service (75.3%), and Food Preparation & Serving (55.1%).
| Occupation | Male | Female |
| Healthcare Support | 441 (16.5%) | 2,229 (83.5%) |
| Security & Protection | 714 (76.8%) | 216 (23.2%) |
| Firefighting & Prevention | 494 (83.9%) | 95 (16.1%) |
| Law Enforcement | 220 (64.5%) | 121 (35.5%) |
| Food Preparation & Serving | 1,314 (44.9%) | 1,612 (55.1%) |
| Cleaning & Maintenance | 1,680 (68.1%) | 785 (31.9%) |
| Personal Care & Service | 478 (24.6%) | 1,461 (75.3%) |
| Total (Category) | 4,627 (42.3%) | 6,303 (57.7%) |
| Total (Overall) | 31,143 (55.2%) | 25,221 (44.8%) |
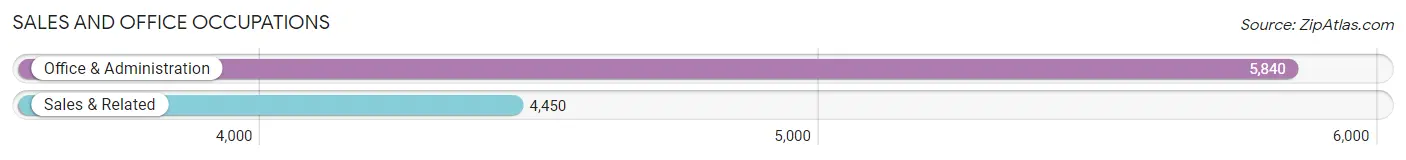
Sales and Office Occupations
The most common Sales and Office occupations in Everett are Office & Administration (5,840 | 10.4%), and Sales & Related (4,450 | 7.9%).
Sales and Office Occupations by Sex
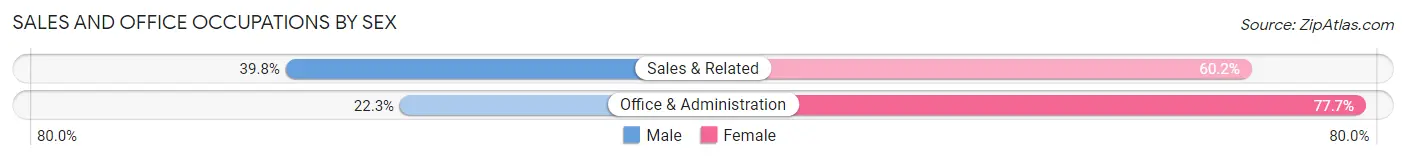
| Occupation | Male | Female |
| Sales & Related | 1,773 (39.8%) | 2,677 (60.2%) |
| Office & Administration | 1,300 (22.3%) | 4,540 (77.7%) |
| Total (Category) | 3,073 (29.9%) | 7,217 (70.1%) |
| Total (Overall) | 31,143 (55.2%) | 25,221 (44.8%) |
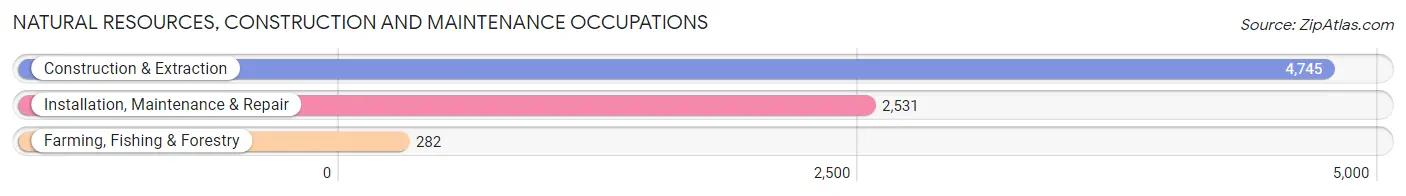
Natural Resources, Construction and Maintenance Occupations
The most common Natural Resources, Construction and Maintenance occupations in Everett are Construction & Extraction (4,745 | 8.4%), Installation, Maintenance & Repair (2,531 | 4.5%), and Farming, Fishing & Forestry (282 | 0.5%).
Natural Resources, Construction and Maintenance Occupations by Sex
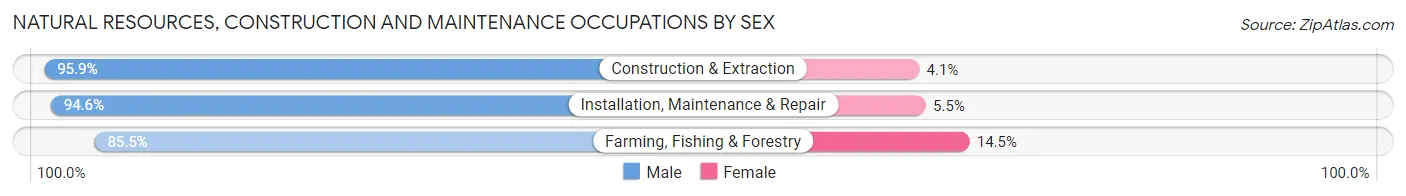
| Occupation | Male | Female |
| Farming, Fishing & Forestry | 241 (85.5%) | 41 (14.5%) |
| Construction & Extraction | 4,551 (95.9%) | 194 (4.1%) |
| Installation, Maintenance & Repair | 2,393 (94.6%) | 138 (5.4%) |
| Total (Category) | 7,185 (95.1%) | 373 (4.9%) |
| Total (Overall) | 31,143 (55.2%) | 25,221 (44.8%) |
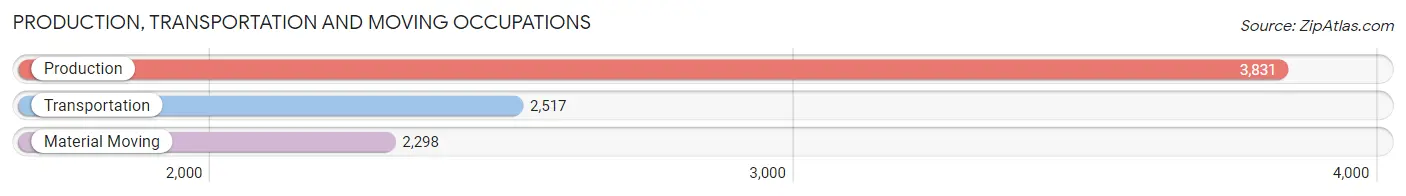
Production, Transportation and Moving Occupations
The most common Production, Transportation and Moving occupations in Everett are Production (3,831 | 6.8%), Transportation (2,517 | 4.5%), and Material Moving (2,298 | 4.1%).
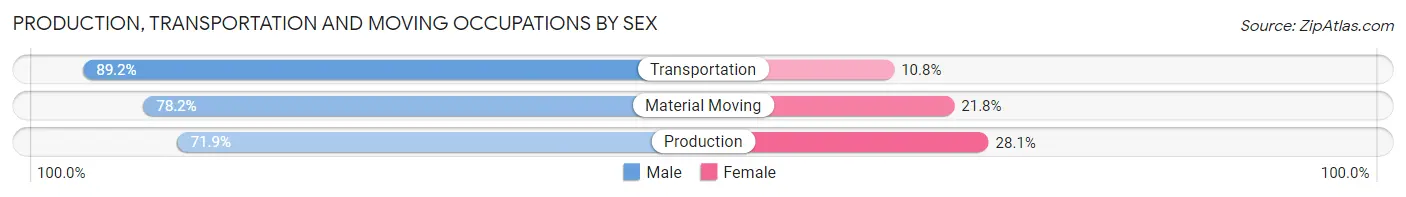
Production, Transportation and Moving Occupations by Sex
| Occupation | Male | Female |
| Production | 2,755 (71.9%) | 1,076 (28.1%) |
| Transportation | 2,246 (89.2%) | 271 (10.8%) |
| Material Moving | 1,797 (78.2%) | 501 (21.8%) |
| Total (Category) | 6,798 (78.6%) | 1,848 (21.4%) |
| Total (Overall) | 31,143 (55.2%) | 25,221 (44.8%) |
Employment Industries by Sex in Everett
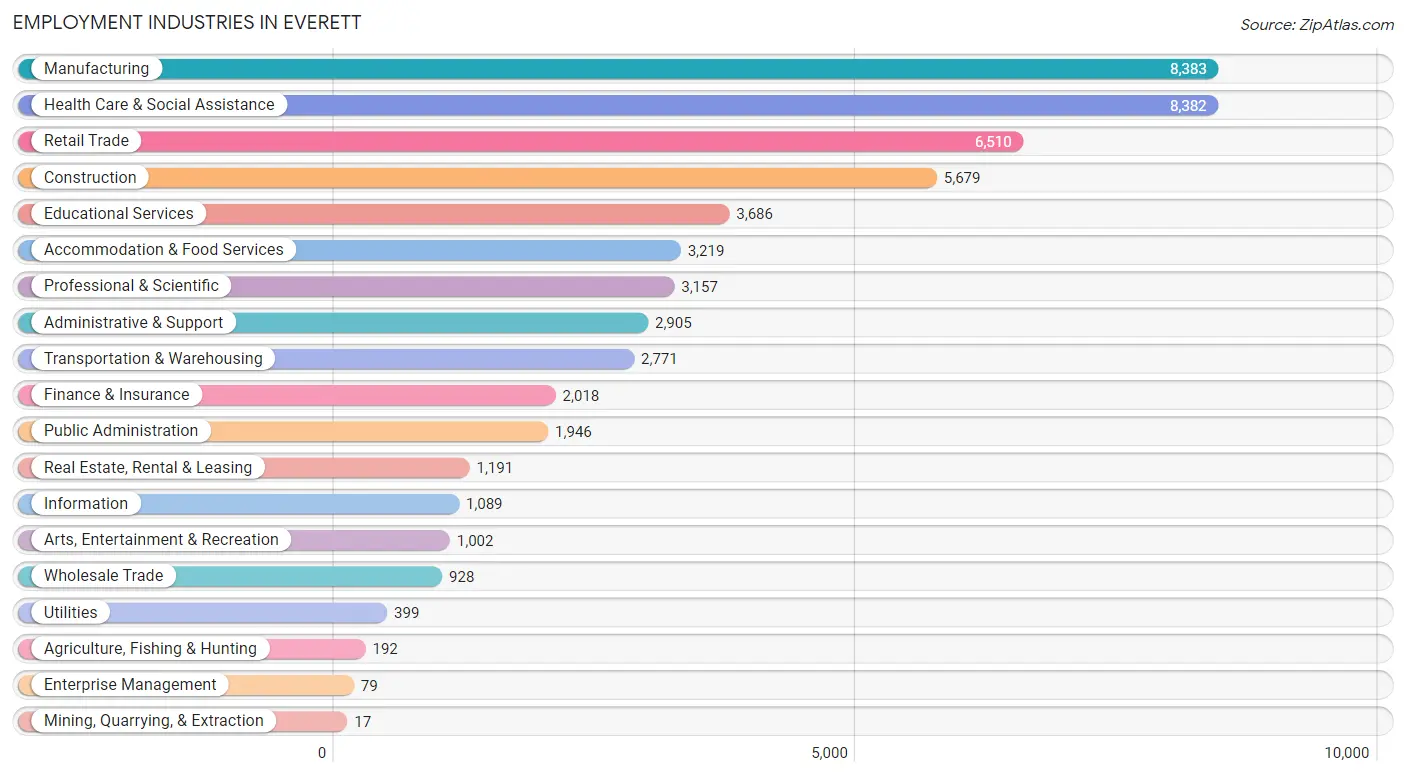
Employment Industries in Everett
The major employment industries in Everett include Manufacturing (8,383 | 14.9%), Health Care & Social Assistance (8,382 | 14.9%), Retail Trade (6,510 | 11.6%), Construction (5,679 | 10.1%), and Educational Services (3,686 | 6.5%).
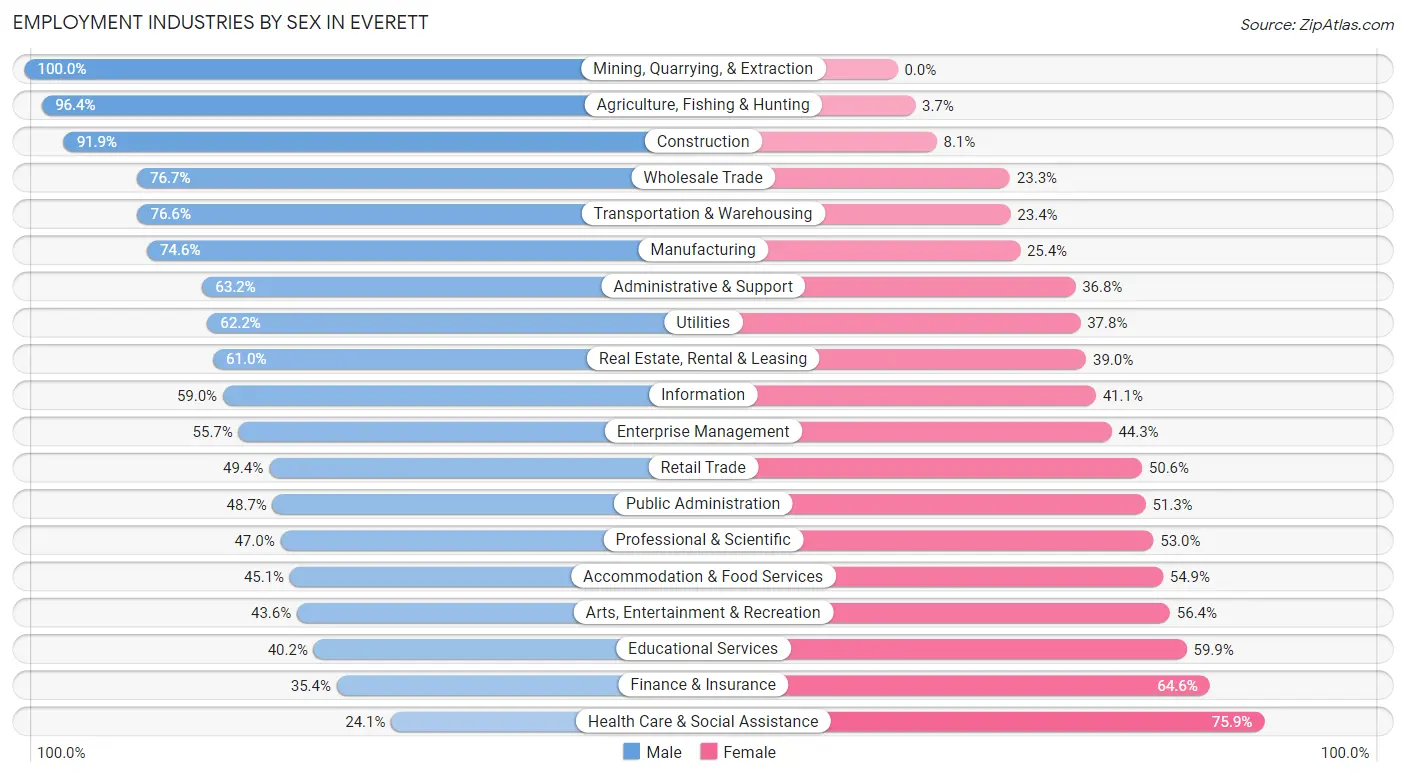
Employment Industries by Sex in Everett
The Everett industries that see more men than women are Mining, Quarrying, & Extraction (100.0%), Agriculture, Fishing & Hunting (96.4%), and Construction (91.9%), whereas the industries that tend to have a higher number of women are Health Care & Social Assistance (75.9%), Finance & Insurance (64.6%), and Educational Services (59.9%).
| Industry | Male | Female |
| Agriculture, Fishing & Hunting | 185 (96.4%) | 7 (3.6%) |
| Mining, Quarrying, & Extraction | 17 (100.0%) | 0 (0.0%) |
| Construction | 5,219 (91.9%) | 460 (8.1%) |
| Manufacturing | 6,257 (74.6%) | 2,126 (25.4%) |
| Wholesale Trade | 712 (76.7%) | 216 (23.3%) |
| Retail Trade | 3,216 (49.4%) | 3,294 (50.6%) |
| Transportation & Warehousing | 2,123 (76.6%) | 648 (23.4%) |
| Utilities | 248 (62.2%) | 151 (37.8%) |
| Information | 642 (59.0%) | 447 (41.0%) |
| Finance & Insurance | 714 (35.4%) | 1,304 (64.6%) |
| Real Estate, Rental & Leasing | 726 (61.0%) | 465 (39.0%) |
| Professional & Scientific | 1,485 (47.0%) | 1,672 (53.0%) |
| Enterprise Management | 44 (55.7%) | 35 (44.3%) |
| Administrative & Support | 1,836 (63.2%) | 1,069 (36.8%) |
| Educational Services | 1,480 (40.2%) | 2,206 (59.9%) |
| Health Care & Social Assistance | 2,020 (24.1%) | 6,362 (75.9%) |
| Arts, Entertainment & Recreation | 437 (43.6%) | 565 (56.4%) |
| Accommodation & Food Services | 1,451 (45.1%) | 1,768 (54.9%) |
| Public Administration | 947 (48.7%) | 999 (51.3%) |
| Total | 31,143 (55.2%) | 25,221 (44.8%) |
Education in Everett
School Enrollment in Everett
The most common levels of schooling among the 23,636 students in Everett are college / undergraduate (5,578 | 23.6%), high school (5,034 | 21.3%), and middle school (4,842 | 20.5%).
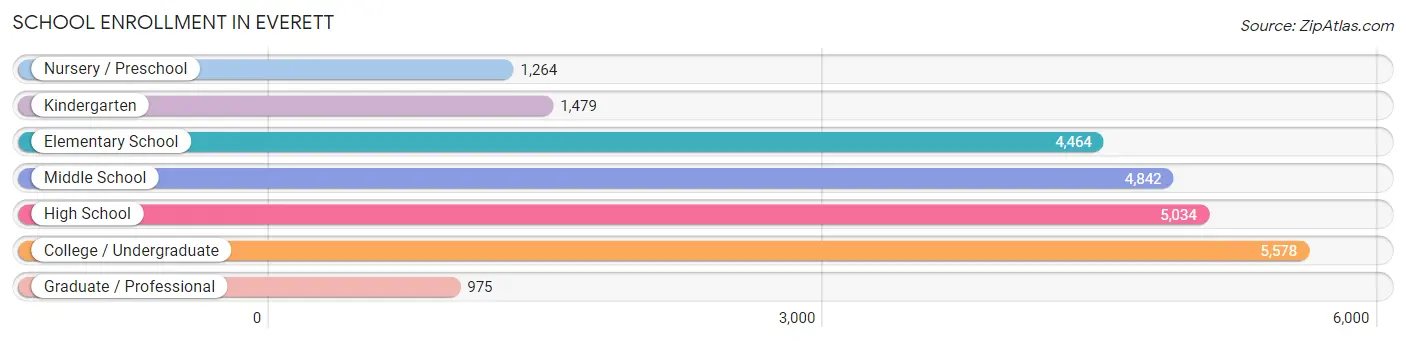
| School Level | # Students | % Students |
| Nursery / Preschool | 1,264 | 5.3% |
| Kindergarten | 1,479 | 6.3% |
| Elementary School | 4,464 | 18.9% |
| Middle School | 4,842 | 20.5% |
| High School | 5,034 | 21.3% |
| College / Undergraduate | 5,578 | 23.6% |
| Graduate / Professional | 975 | 4.1% |
| Total | 23,636 | 100.0% |
School Enrollment by Age by Funding Source in Everett
Out of a total of 23,636 students who are enrolled in schools in Everett, 3,404 (14.4%) attend a private institution, while the remaining 20,232 (85.6%) are enrolled in public schools. The age group of 3 to 4 year olds has the highest likelihood of being enrolled in private schools, with 593 (57.0% in the age bracket) enrolled. Conversely, the age group of 15 to 17 year olds has the lowest likelihood of being enrolled in a private school, with 3,564 (92.5% in the age bracket) attending a public institution.
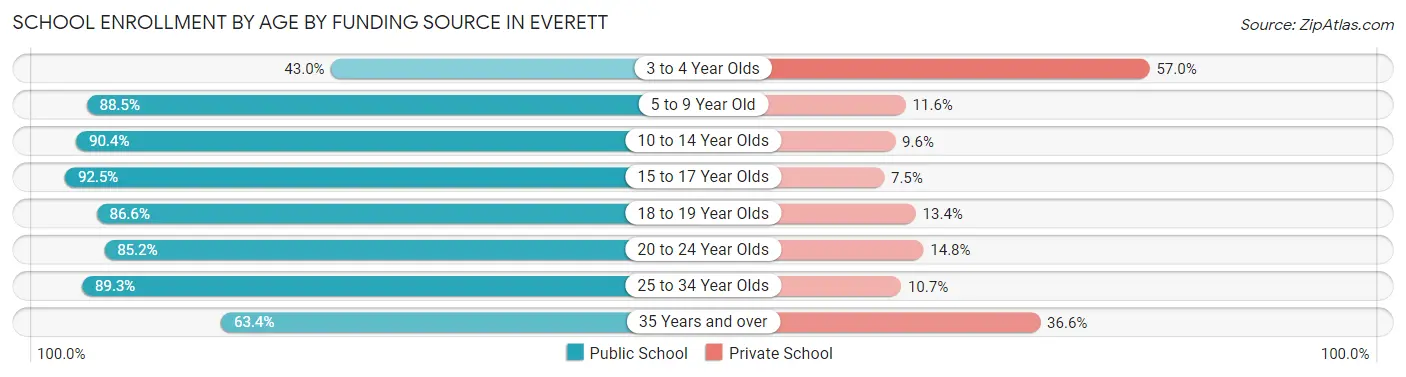
| Age Bracket | Public School | Private School |
| 3 to 4 Year Olds | 448 (43.0%) | 593 (57.0%) |
| 5 to 9 Year Old | 4,855 (88.4%) | 634 (11.6%) |
| 10 to 14 Year Olds | 5,537 (90.4%) | 587 (9.6%) |
| 15 to 17 Year Olds | 3,564 (92.5%) | 290 (7.5%) |
| 18 to 19 Year Olds | 1,091 (86.6%) | 169 (13.4%) |
| 20 to 24 Year Olds | 1,744 (85.2%) | 304 (14.8%) |
| 25 to 34 Year Olds | 1,965 (89.3%) | 235 (10.7%) |
| 35 Years and over | 1,027 (63.4%) | 593 (36.6%) |
| Total | 20,232 (85.6%) | 3,404 (14.4%) |
Educational Attainment by Field of Study in Everett
Business (3,642 | 16.1%), engineering (2,247 | 9.9%), science & technology (2,124 | 9.4%), social sciences (1,857 | 8.2%), and education (1,827 | 8.1%) are the most common fields of study among 22,683 individuals in Everett who have obtained a bachelor's degree or higher.
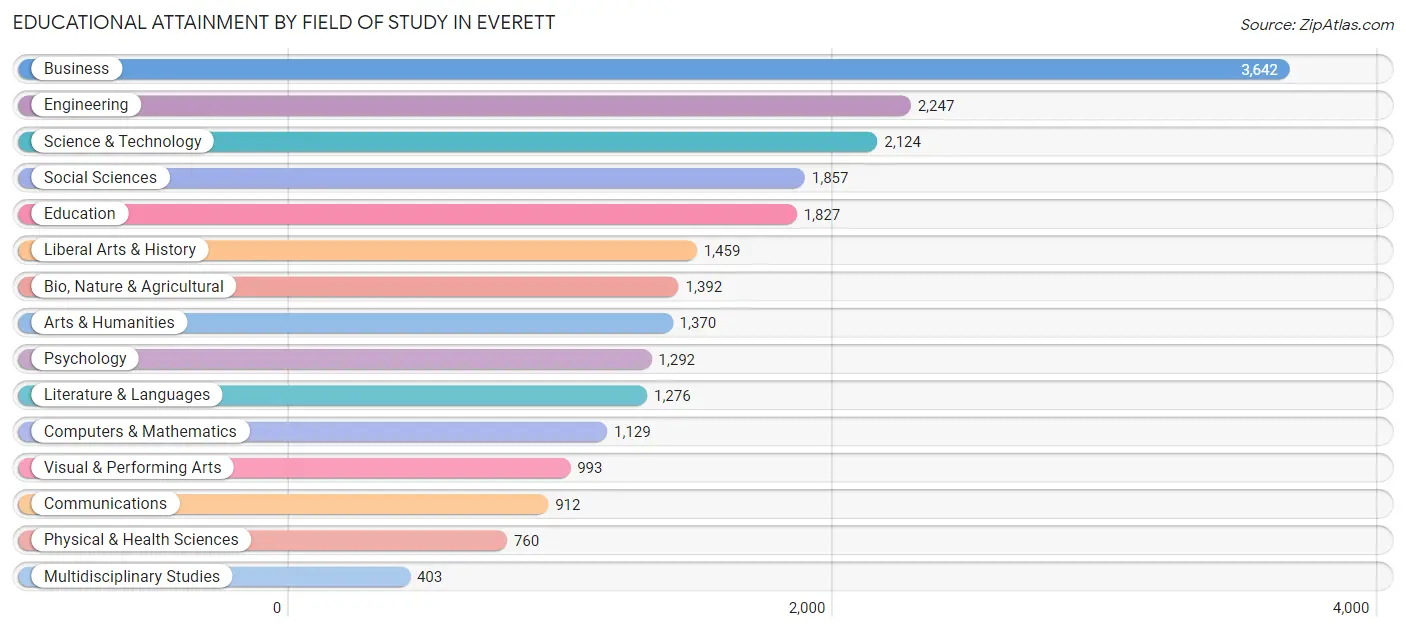
| Field of Study | # Graduates | % Graduates |
| Computers & Mathematics | 1,129 | 5.0% |
| Bio, Nature & Agricultural | 1,392 | 6.1% |
| Physical & Health Sciences | 760 | 3.4% |
| Psychology | 1,292 | 5.7% |
| Social Sciences | 1,857 | 8.2% |
| Engineering | 2,247 | 9.9% |
| Multidisciplinary Studies | 403 | 1.8% |
| Science & Technology | 2,124 | 9.4% |
| Business | 3,642 | 16.1% |
| Education | 1,827 | 8.1% |
| Literature & Languages | 1,276 | 5.6% |
| Liberal Arts & History | 1,459 | 6.4% |
| Visual & Performing Arts | 993 | 4.4% |
| Communications | 912 | 4.0% |
| Arts & Humanities | 1,370 | 6.0% |
| Total | 22,683 | 100.0% |
Transportation & Commute in Everett
Vehicle Availability by Sex in Everett
The most prevalent vehicle ownership categories in Everett are males with 2 vehicles (12,024, accounting for 39.4%) and females with 2 vehicles (9,317, making up 48.7%).
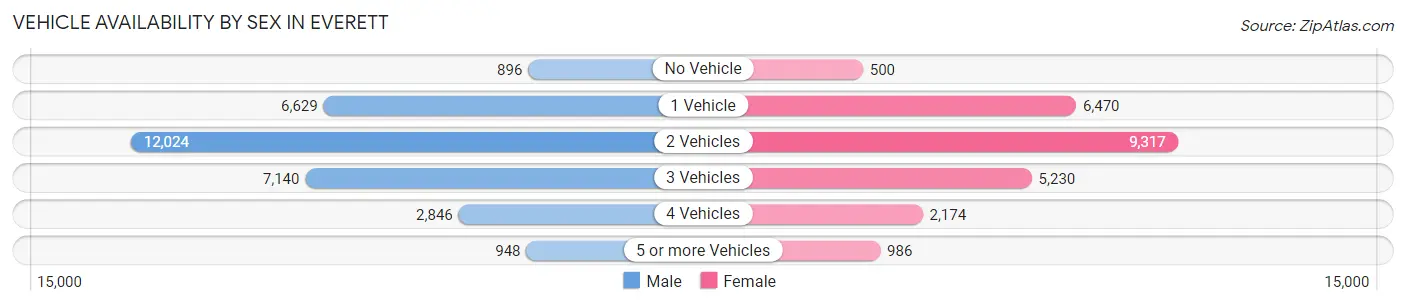
| Vehicles Available | Male | Female |
| No Vehicle | 896 (2.9%) | 500 (2.0%) |
| 1 Vehicle | 6,629 (21.7%) | 6,470 (26.2%) |
| 2 Vehicles | 12,024 (39.4%) | 9,317 (37.8%) |
| 3 Vehicles | 7,140 (23.4%) | 5,230 (21.2%) |
| 4 Vehicles | 2,846 (9.3%) | 2,174 (8.8%) |
| 5 or more Vehicles | 948 (3.1%) | 986 (4.0%) |
| Total | 30,483 (100.0%) | 24,677 (100.0%) |
Commute Time in Everett
The most frequently occuring commute durations in Everett are 10 to 14 minutes (7,876 commuters, 15.6%), 15 to 19 minutes (7,843 commuters, 15.5%), and 20 to 24 minutes (6,919 commuters, 13.7%).
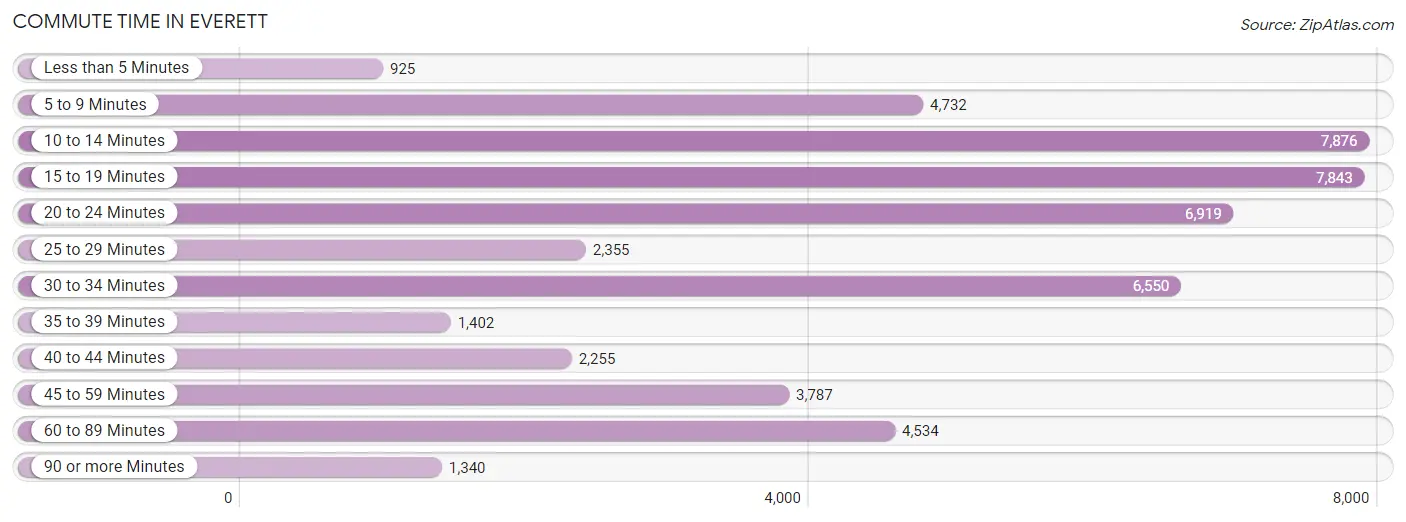
| Commute Time | # Commuters | % Commuters |
| Less than 5 Minutes | 925 | 1.8% |
| 5 to 9 Minutes | 4,732 | 9.4% |
| 10 to 14 Minutes | 7,876 | 15.6% |
| 15 to 19 Minutes | 7,843 | 15.5% |
| 20 to 24 Minutes | 6,919 | 13.7% |
| 25 to 29 Minutes | 2,355 | 4.7% |
| 30 to 34 Minutes | 6,550 | 13.0% |
| 35 to 39 Minutes | 1,402 | 2.8% |
| 40 to 44 Minutes | 2,255 | 4.5% |
| 45 to 59 Minutes | 3,787 | 7.5% |
| 60 to 89 Minutes | 4,534 | 9.0% |
| 90 or more Minutes | 1,340 | 2.6% |
Commute Time by Sex in Everett
The most common commute times in Everett are 15 to 19 minutes (4,687 commuters, 16.2%) for males and 10 to 14 minutes (3,852 commuters, 17.8%) for females.
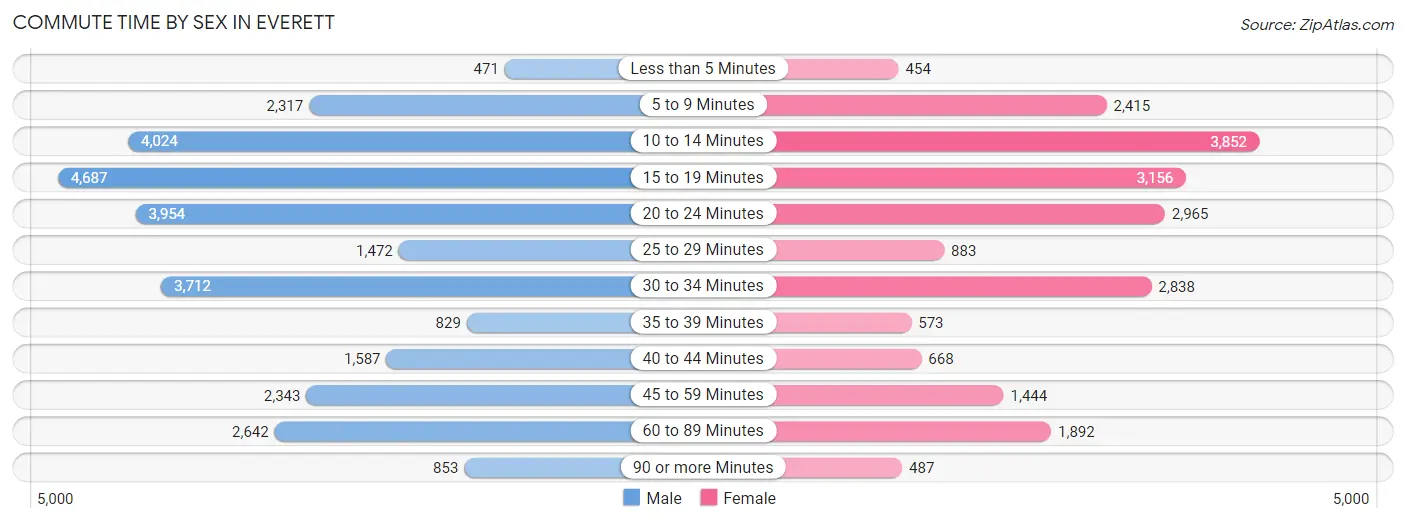
| Commute Time | Male | Female |
| Less than 5 Minutes | 471 (1.6%) | 454 (2.1%) |
| 5 to 9 Minutes | 2,317 (8.0%) | 2,415 (11.2%) |
| 10 to 14 Minutes | 4,024 (13.9%) | 3,852 (17.8%) |
| 15 to 19 Minutes | 4,687 (16.2%) | 3,156 (14.6%) |
| 20 to 24 Minutes | 3,954 (13.7%) | 2,965 (13.7%) |
| 25 to 29 Minutes | 1,472 (5.1%) | 883 (4.1%) |
| 30 to 34 Minutes | 3,712 (12.9%) | 2,838 (13.1%) |
| 35 to 39 Minutes | 829 (2.9%) | 573 (2.6%) |
| 40 to 44 Minutes | 1,587 (5.5%) | 668 (3.1%) |
| 45 to 59 Minutes | 2,343 (8.1%) | 1,444 (6.7%) |
| 60 to 89 Minutes | 2,642 (9.1%) | 1,892 (8.7%) |
| 90 or more Minutes | 853 (2.9%) | 487 (2.2%) |
Time of Departure to Work by Sex in Everett
The most frequent times of departure to work in Everett are 5:00 AM to 5:29 AM (3,269, 11.3%) for males and 7:30 AM to 7:59 AM (2,720, 12.6%) for females.
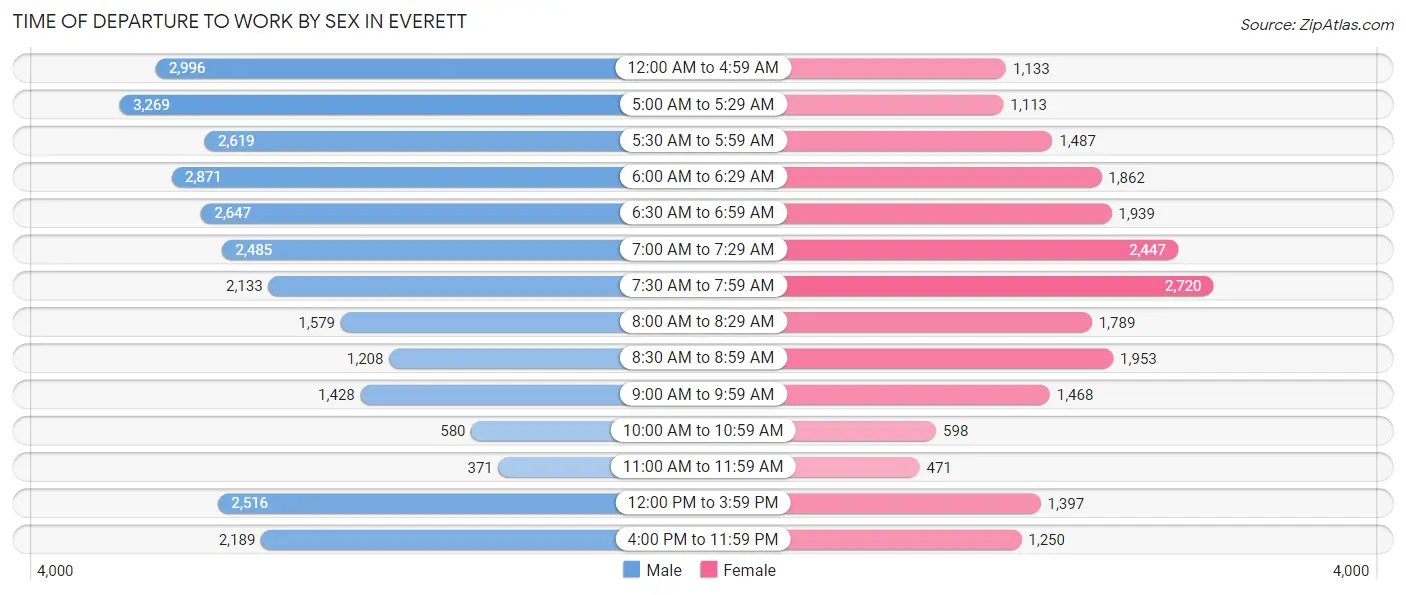
| Time of Departure | Male | Female |
| 12:00 AM to 4:59 AM | 2,996 (10.4%) | 1,133 (5.2%) |
| 5:00 AM to 5:29 AM | 3,269 (11.3%) | 1,113 (5.1%) |
| 5:30 AM to 5:59 AM | 2,619 (9.1%) | 1,487 (6.9%) |
| 6:00 AM to 6:29 AM | 2,871 (9.9%) | 1,862 (8.6%) |
| 6:30 AM to 6:59 AM | 2,647 (9.2%) | 1,939 (9.0%) |
| 7:00 AM to 7:29 AM | 2,485 (8.6%) | 2,447 (11.3%) |
| 7:30 AM to 7:59 AM | 2,133 (7.4%) | 2,720 (12.6%) |
| 8:00 AM to 8:29 AM | 1,579 (5.5%) | 1,789 (8.3%) |
| 8:30 AM to 8:59 AM | 1,208 (4.2%) | 1,953 (9.0%) |
| 9:00 AM to 9:59 AM | 1,428 (4.9%) | 1,468 (6.8%) |
| 10:00 AM to 10:59 AM | 580 (2.0%) | 598 (2.8%) |
| 11:00 AM to 11:59 AM | 371 (1.3%) | 471 (2.2%) |
| 12:00 PM to 3:59 PM | 2,516 (8.7%) | 1,397 (6.5%) |
| 4:00 PM to 11:59 PM | 2,189 (7.6%) | 1,250 (5.8%) |
| Total | 28,891 (100.0%) | 21,627 (100.0%) |
Housing Occupancy in Everett
Occupancy by Ownership in Everett
Of the total 43,840 dwellings in Everett, owner-occupied units account for 21,267 (48.5%), while renter-occupied units make up 22,573 (51.5%).
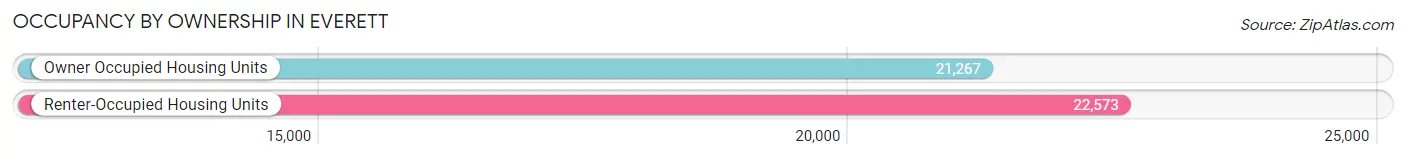
| Occupancy | # Housing Units | % Housing Units |
| Owner Occupied Housing Units | 21,267 | 48.5% |
| Renter-Occupied Housing Units | 22,573 | 51.5% |
| Total Occupied Housing Units | 43,840 | 100.0% |
Occupancy by Household Size in Everett
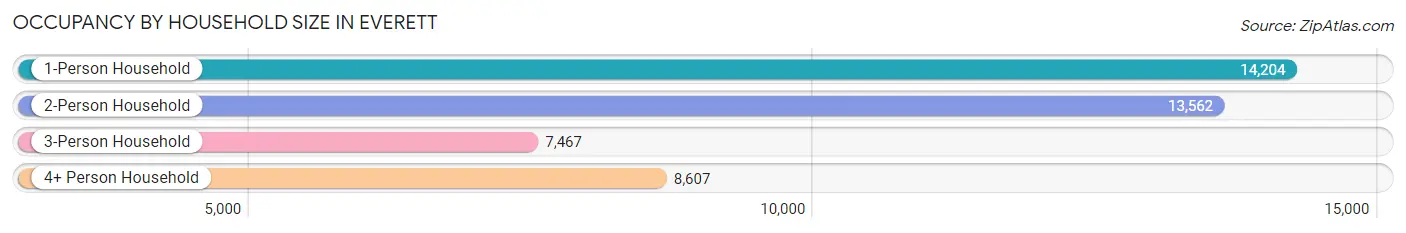
| Household Size | # Housing Units | % Housing Units |
| 1-Person Household | 14,204 | 32.4% |
| 2-Person Household | 13,562 | 30.9% |
| 3-Person Household | 7,467 | 17.0% |
| 4+ Person Household | 8,607 | 19.6% |
| Total Housing Units | 43,840 | 100.0% |
Occupancy by Ownership by Household Size in Everett
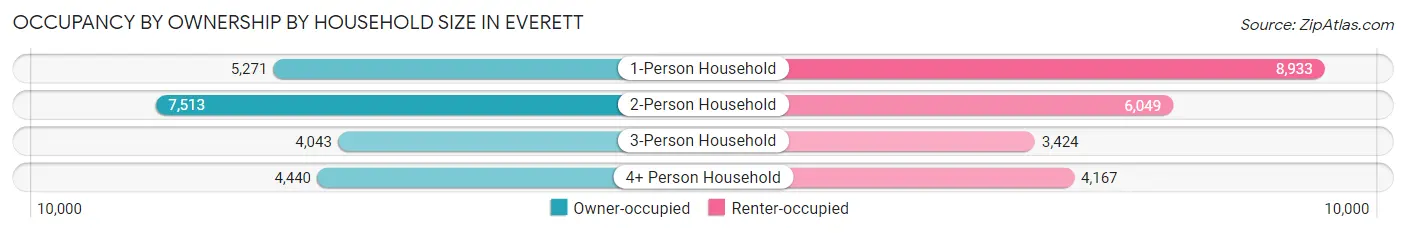
| Household Size | Owner-occupied | Renter-occupied |
| 1-Person Household | 5,271 (37.1%) | 8,933 (62.9%) |
| 2-Person Household | 7,513 (55.4%) | 6,049 (44.6%) |
| 3-Person Household | 4,043 (54.1%) | 3,424 (45.9%) |
| 4+ Person Household | 4,440 (51.6%) | 4,167 (48.4%) |
| Total Housing Units | 21,267 (48.5%) | 22,573 (51.5%) |
Occupancy by Educational Attainment in Everett
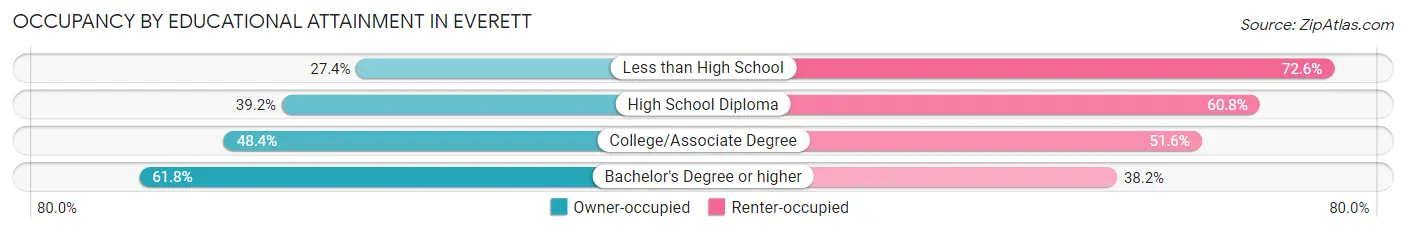
| Household Size | Owner-occupied | Renter-occupied |
| Less than High School | 1,083 (27.4%) | 2,872 (72.6%) |
| High School Diploma | 3,759 (39.2%) | 5,833 (60.8%) |
| College/Associate Degree | 8,285 (48.4%) | 8,838 (51.6%) |
| Bachelor's Degree or higher | 8,140 (61.8%) | 5,030 (38.2%) |
Occupancy by Age of Householder in Everett
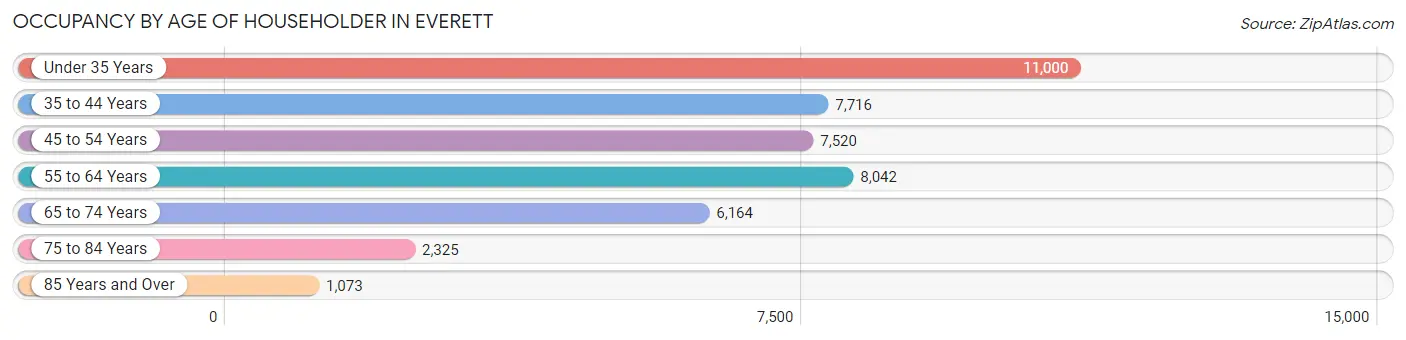
| Age Bracket | # Households | % Households |
| Under 35 Years | 11,000 | 25.1% |
| 35 to 44 Years | 7,716 | 17.6% |
| 45 to 54 Years | 7,520 | 17.2% |
| 55 to 64 Years | 8,042 | 18.3% |
| 65 to 74 Years | 6,164 | 14.1% |
| 75 to 84 Years | 2,325 | 5.3% |
| 85 Years and Over | 1,073 | 2.5% |
| Total | 43,840 | 100.0% |
Housing Finances in Everett
Median Income by Occupancy in Everett
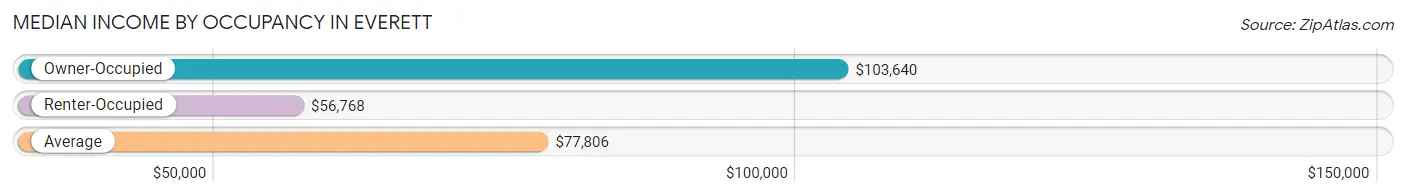
| Occupancy Type | # Households | Median Income |
| Owner-Occupied | 21,267 (48.5%) | $103,640 |
| Renter-Occupied | 22,573 (51.5%) | $56,768 |
| Average | 43,840 (100.0%) | $77,806 |
Occupancy by Householder Income Bracket in Everett
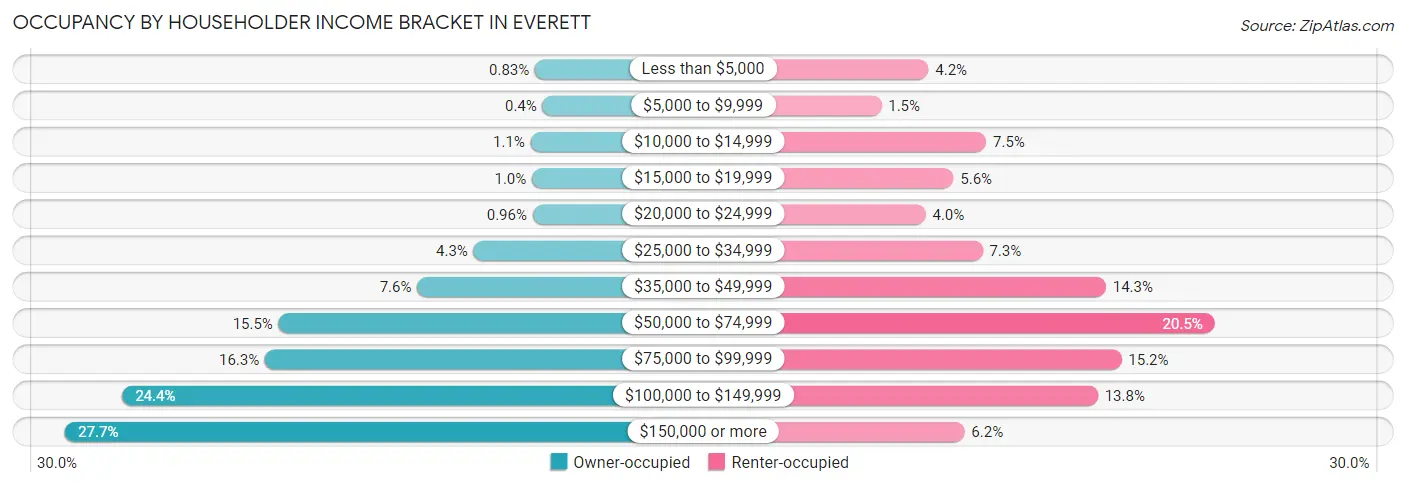
| Income Bracket | Owner-occupied | Renter-occupied |
| Less than $5,000 | 176 (0.8%) | 940 (4.2%) |
| $5,000 to $9,999 | 85 (0.4%) | 331 (1.5%) |
| $10,000 to $14,999 | 229 (1.1%) | 1,683 (7.5%) |
| $15,000 to $19,999 | 212 (1.0%) | 1,262 (5.6%) |
| $20,000 to $24,999 | 205 (1.0%) | 904 (4.0%) |
| $25,000 to $34,999 | 923 (4.3%) | 1,637 (7.2%) |
| $35,000 to $49,999 | 1,607 (7.6%) | 3,227 (14.3%) |
| $50,000 to $74,999 | 3,293 (15.5%) | 4,632 (20.5%) |
| $75,000 to $99,999 | 3,457 (16.3%) | 3,428 (15.2%) |
| $100,000 to $149,999 | 5,193 (24.4%) | 3,124 (13.8%) |
| $150,000 or more | 5,887 (27.7%) | 1,405 (6.2%) |
| Total | 21,267 (100.0%) | 22,573 (100.0%) |
Monthly Housing Cost Tiers in Everett
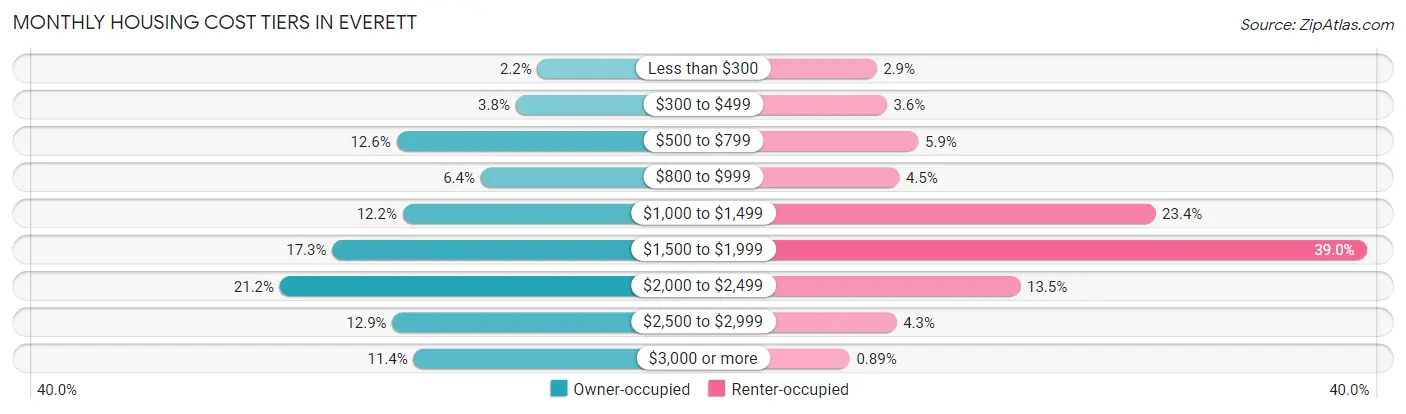
| Monthly Cost | Owner-occupied | Renter-occupied |
| Less than $300 | 473 (2.2%) | 646 (2.9%) |
| $300 to $499 | 815 (3.8%) | 816 (3.6%) |
| $500 to $799 | 2,681 (12.6%) | 1,341 (5.9%) |
| $800 to $999 | 1,361 (6.4%) | 1,023 (4.5%) |
| $1,000 to $1,499 | 2,583 (12.1%) | 5,282 (23.4%) |
| $1,500 to $1,999 | 3,688 (17.3%) | 8,794 (39.0%) |
| $2,000 to $2,499 | 4,508 (21.2%) | 3,037 (13.5%) |
| $2,500 to $2,999 | 2,745 (12.9%) | 977 (4.3%) |
| $3,000 or more | 2,413 (11.4%) | 201 (0.9%) |
| Total | 21,267 (100.0%) | 22,573 (100.0%) |
Physical Housing Characteristics in Everett
Housing Structures in Everett
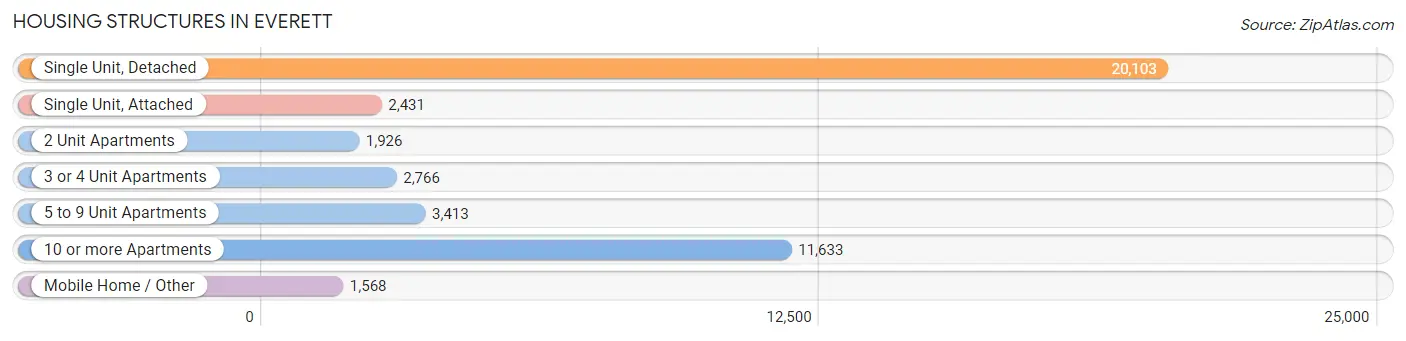
| Structure Type | # Housing Units | % Housing Units |
| Single Unit, Detached | 20,103 | 45.9% |
| Single Unit, Attached | 2,431 | 5.6% |
| 2 Unit Apartments | 1,926 | 4.4% |
| 3 or 4 Unit Apartments | 2,766 | 6.3% |
| 5 to 9 Unit Apartments | 3,413 | 7.8% |
| 10 or more Apartments | 11,633 | 26.5% |
| Mobile Home / Other | 1,568 | 3.6% |
| Total | 43,840 | 100.0% |
Housing Structures by Occupancy in Everett
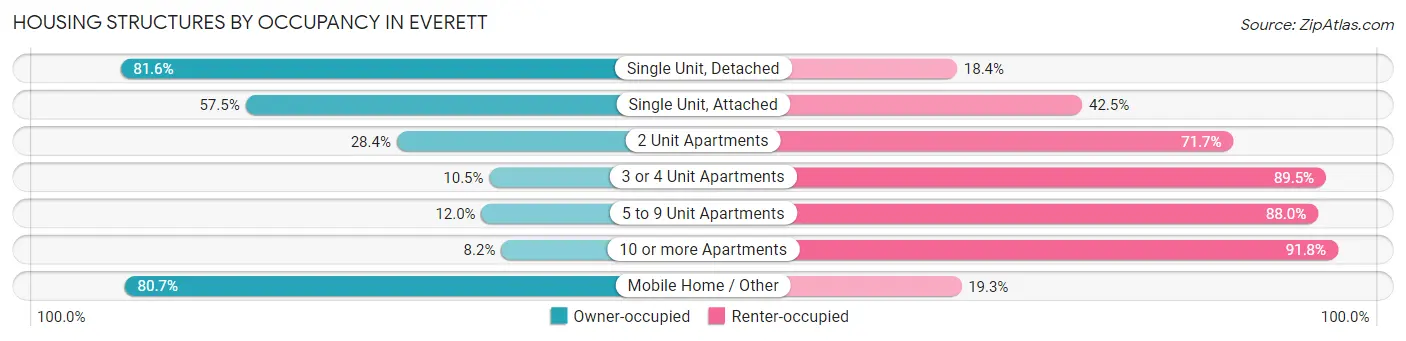
| Structure Type | Owner-occupied | Renter-occupied |
| Single Unit, Detached | 16,399 (81.6%) | 3,704 (18.4%) |
| Single Unit, Attached | 1,397 (57.5%) | 1,034 (42.5%) |
| 2 Unit Apartments | 546 (28.3%) | 1,380 (71.7%) |
| 3 or 4 Unit Apartments | 291 (10.5%) | 2,475 (89.5%) |
| 5 to 9 Unit Apartments | 411 (12.0%) | 3,002 (88.0%) |
| 10 or more Apartments | 957 (8.2%) | 10,676 (91.8%) |
| Mobile Home / Other | 1,266 (80.7%) | 302 (19.3%) |
| Total | 21,267 (48.5%) | 22,573 (51.5%) |
Housing Structures by Number of Rooms in Everett
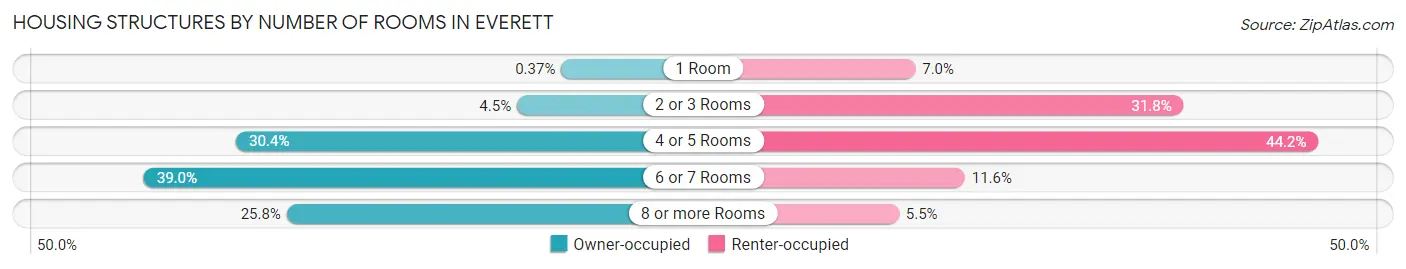
| Number of Rooms | Owner-occupied | Renter-occupied |
| 1 Room | 79 (0.4%) | 1,574 (7.0%) |
| 2 or 3 Rooms | 949 (4.5%) | 7,174 (31.8%) |
| 4 or 5 Rooms | 6,473 (30.4%) | 9,986 (44.2%) |
| 6 or 7 Rooms | 8,288 (39.0%) | 2,608 (11.6%) |
| 8 or more Rooms | 5,478 (25.8%) | 1,231 (5.4%) |
| Total | 21,267 (100.0%) | 22,573 (100.0%) |
Housing Structure by Heating Type in Everett
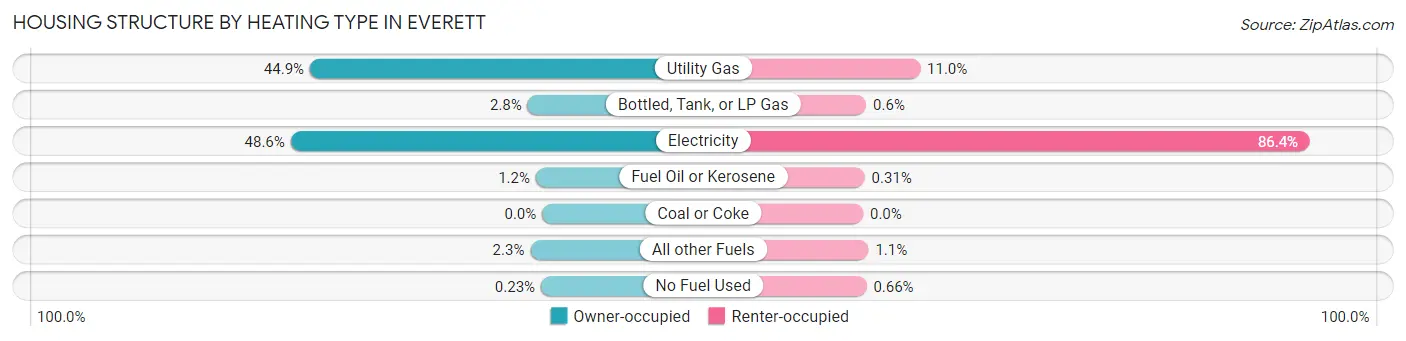
| Heating Type | Owner-occupied | Renter-occupied |
| Utility Gas | 9,542 (44.9%) | 2,490 (11.0%) |
| Bottled, Tank, or LP Gas | 595 (2.8%) | 135 (0.6%) |
| Electricity | 10,336 (48.6%) | 19,491 (86.4%) |
| Fuel Oil or Kerosene | 260 (1.2%) | 70 (0.3%) |
| Coal or Coke | 0 (0.0%) | 0 (0.0%) |
| All other Fuels | 486 (2.3%) | 238 (1.1%) |
| No Fuel Used | 48 (0.2%) | 149 (0.7%) |
| Total | 21,267 (100.0%) | 22,573 (100.0%) |
Household Vehicle Usage in Everett
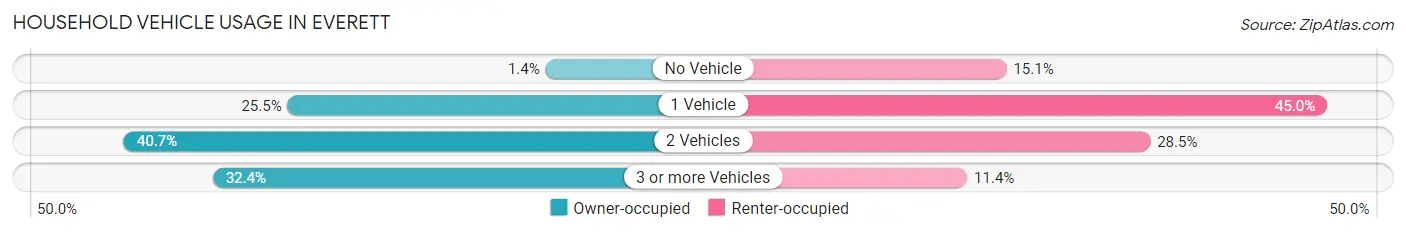
| Vehicles per Household | Owner-occupied | Renter-occupied |
| No Vehicle | 291 (1.4%) | 3,404 (15.1%) |
| 1 Vehicle | 5,415 (25.5%) | 10,161 (45.0%) |
| 2 Vehicles | 8,661 (40.7%) | 6,433 (28.5%) |
| 3 or more Vehicles | 6,900 (32.4%) | 2,575 (11.4%) |
| Total | 21,267 (100.0%) | 22,573 (100.0%) |
Real Estate & Mortgages in Everett
Real Estate and Mortgage Overview in Everett
| Characteristic | Without Mortgage | With Mortgage |
| Housing Units | 6,019 | 15,248 |
| Median Property Value | $449,800 | $476,100 |
| Median Household Income | $77,696 | $4,519 |
| Monthly Housing Costs | $720 | $2,352 |
| Real Estate Taxes | $3,723 | $292 |
Property Value by Mortgage Status in Everett
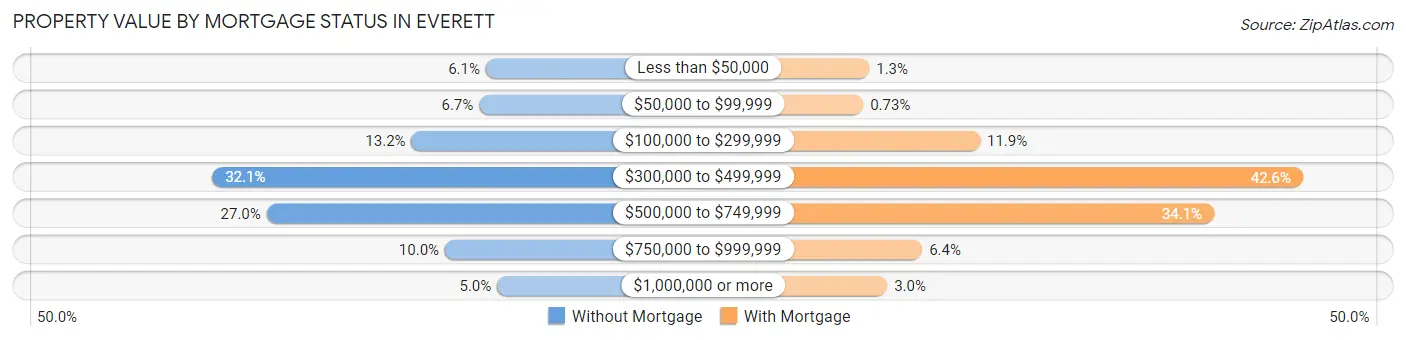
| Property Value | Without Mortgage | With Mortgage |
| Less than $50,000 | 366 (6.1%) | 200 (1.3%) |
| $50,000 to $99,999 | 404 (6.7%) | 112 (0.7%) |
| $100,000 to $299,999 | 792 (13.2%) | 1,809 (11.9%) |
| $300,000 to $499,999 | 1,934 (32.1%) | 6,494 (42.6%) |
| $500,000 to $749,999 | 1,622 (27.0%) | 5,204 (34.1%) |
| $750,000 to $999,999 | 600 (10.0%) | 968 (6.4%) |
| $1,000,000 or more | 301 (5.0%) | 461 (3.0%) |
| Total | 6,019 (100.0%) | 15,248 (100.0%) |
Household Income by Mortgage Status in Everett
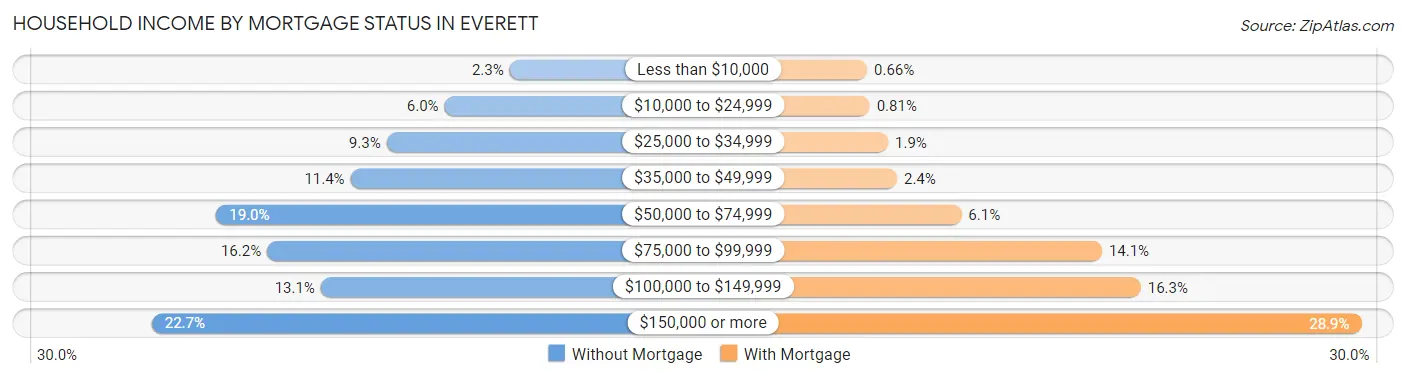
| Household Income | Without Mortgage | With Mortgage |
| Less than $10,000 | 138 (2.3%) | 101 (0.7%) |
| $10,000 to $24,999 | 362 (6.0%) | 123 (0.8%) |
| $25,000 to $34,999 | 561 (9.3%) | 284 (1.9%) |
| $35,000 to $49,999 | 685 (11.4%) | 362 (2.4%) |
| $50,000 to $74,999 | 1,146 (19.0%) | 922 (6.0%) |
| $75,000 to $99,999 | 972 (16.2%) | 2,147 (14.1%) |
| $100,000 to $149,999 | 787 (13.1%) | 2,485 (16.3%) |
| $150,000 or more | 1,368 (22.7%) | 4,406 (28.9%) |
| Total | 6,019 (100.0%) | 15,248 (100.0%) |
Property Value to Household Income Ratio in Everett
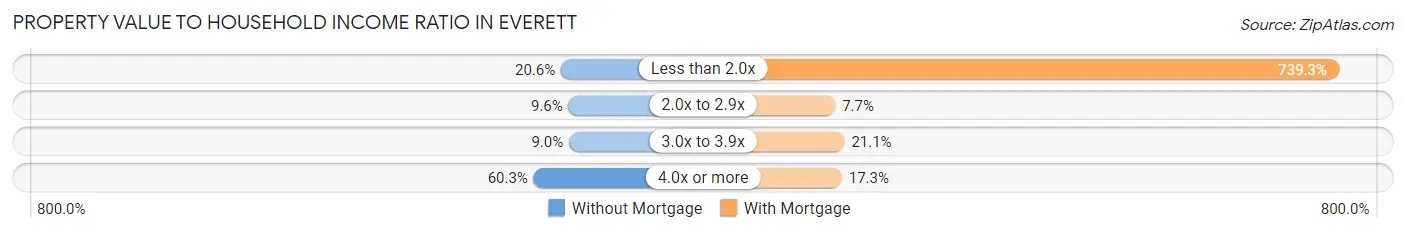
| Value-to-Income Ratio | Without Mortgage | With Mortgage |
| Less than 2.0x | 1,239 (20.6%) | 112,734 (739.3%) |
| 2.0x to 2.9x | 580 (9.6%) | 1,178 (7.7%) |
| 3.0x to 3.9x | 540 (9.0%) | 3,223 (21.1%) |
| 4.0x or more | 3,630 (60.3%) | 2,638 (17.3%) |
| Total | 6,019 (100.0%) | 15,248 (100.0%) |
Real Estate Taxes by Mortgage Status in Everett
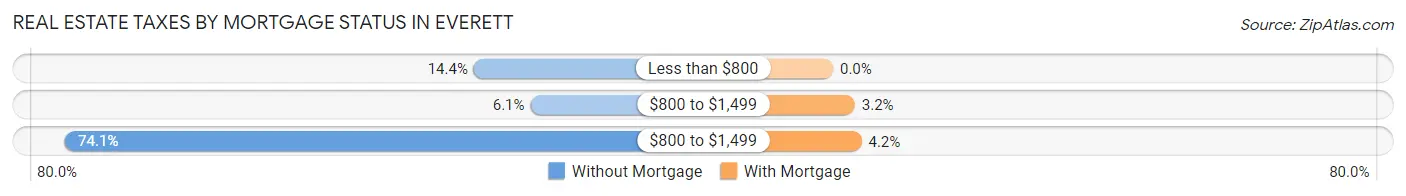
| Property Taxes | Without Mortgage | With Mortgage |
| Less than $800 | 865 (14.4%) | 0 (0.0%) |
| $800 to $1,499 | 367 (6.1%) | 486 (3.2%) |
| $800 to $1,499 | 4,458 (74.1%) | 635 (4.2%) |
| Total | 6,019 (100.0%) | 15,248 (100.0%) |
Health & Disability in Everett
Health Insurance Coverage by Age in Everett
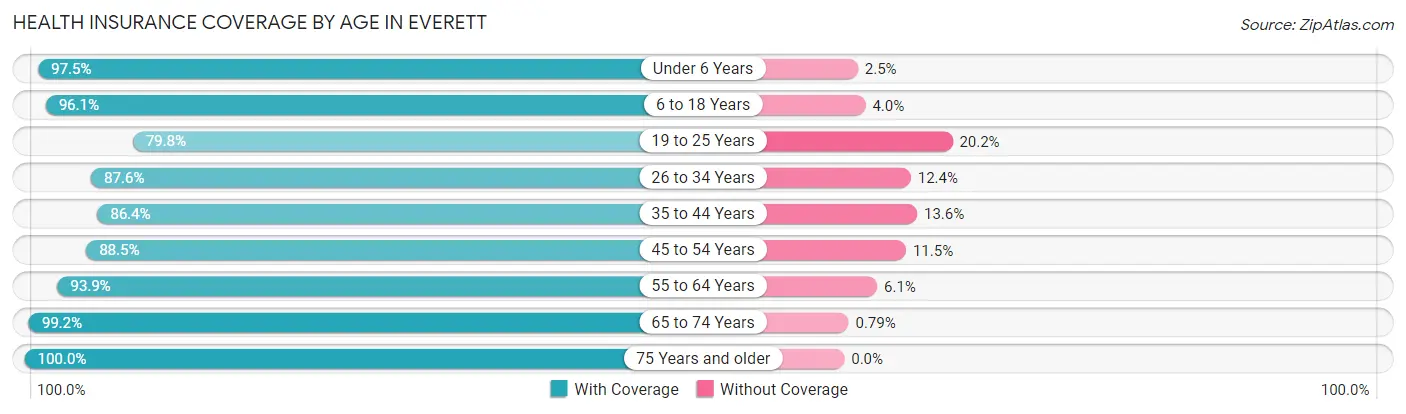
| Age Bracket | With Coverage | Without Coverage |
| Under 6 Years | 7,306 (97.5%) | 190 (2.5%) |
| 6 to 18 Years | 15,739 (96.1%) | 648 (4.0%) |
| 19 to 25 Years | 7,679 (79.8%) | 1,940 (20.2%) |
| 26 to 34 Years | 15,549 (87.6%) | 2,201 (12.4%) |
| 35 to 44 Years | 12,495 (86.4%) | 1,960 (13.6%) |
| 45 to 54 Years | 11,581 (88.5%) | 1,505 (11.5%) |
| 55 to 64 Years | 12,766 (93.9%) | 832 (6.1%) |
| 65 to 74 Years | 9,839 (99.2%) | 78 (0.8%) |
| 75 Years and older | 5,230 (100.0%) | 0 (0.0%) |
| Total | 98,184 (91.3%) | 9,354 (8.7%) |
Health Insurance Coverage by Citizenship Status in Everett
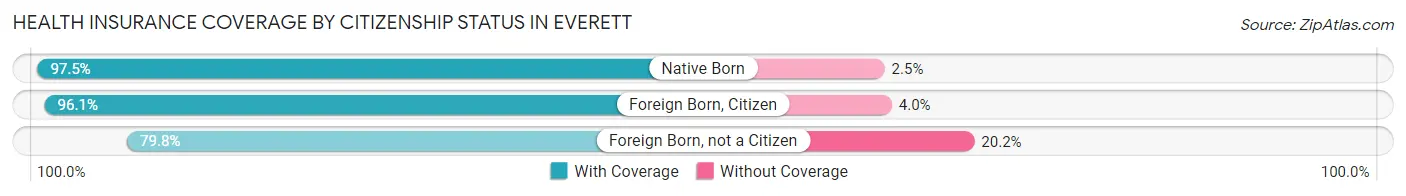
| Citizenship Status | With Coverage | Without Coverage |
| Native Born | 7,306 (97.5%) | 190 (2.5%) |
| Foreign Born, Citizen | 15,739 (96.1%) | 648 (4.0%) |
| Foreign Born, not a Citizen | 7,679 (79.8%) | 1,940 (20.2%) |
Health Insurance Coverage by Household Income in Everett
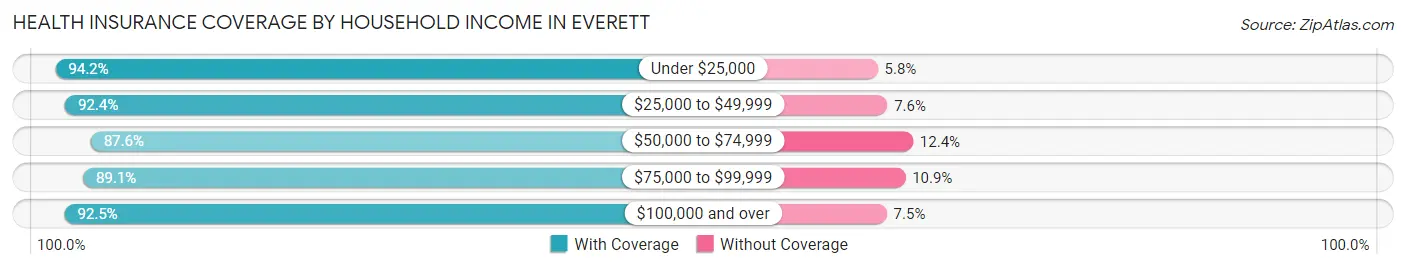
| Household Income | With Coverage | Without Coverage |
| Under $25,000 | 9,152 (94.2%) | 560 (5.8%) |
| $25,000 to $49,999 | 13,241 (92.4%) | 1,084 (7.6%) |
| $50,000 to $74,999 | 16,297 (87.6%) | 2,305 (12.4%) |
| $75,000 to $99,999 | 15,351 (89.1%) | 1,885 (10.9%) |
| $100,000 and over | 42,926 (92.5%) | 3,467 (7.5%) |
Public vs Private Health Insurance Coverage by Age in Everett
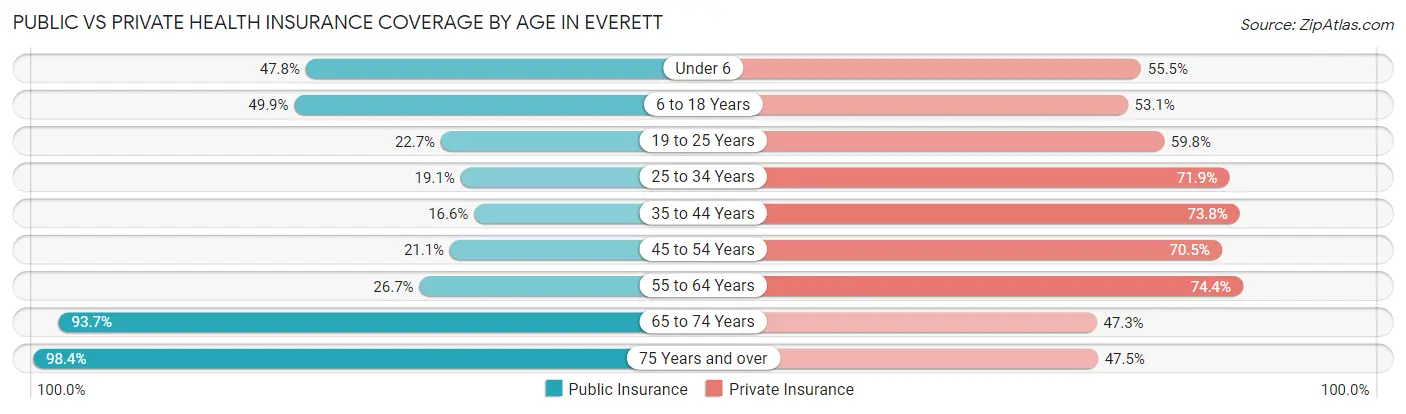
| Age Bracket | Public Insurance | Private Insurance |
| Under 6 | 3,583 (47.8%) | 4,161 (55.5%) |
| 6 to 18 Years | 8,182 (49.9%) | 8,694 (53.0%) |
| 19 to 25 Years | 2,185 (22.7%) | 5,750 (59.8%) |
| 25 to 34 Years | 3,383 (19.1%) | 12,757 (71.9%) |
| 35 to 44 Years | 2,392 (16.6%) | 10,674 (73.8%) |
| 45 to 54 Years | 2,754 (21.0%) | 9,226 (70.5%) |
| 55 to 64 Years | 3,633 (26.7%) | 10,122 (74.4%) |
| 65 to 74 Years | 9,289 (93.7%) | 4,688 (47.3%) |
| 75 Years and over | 5,148 (98.4%) | 2,484 (47.5%) |
| Total | 40,549 (37.7%) | 68,556 (63.7%) |
Disability Status by Sex by Age in Everett
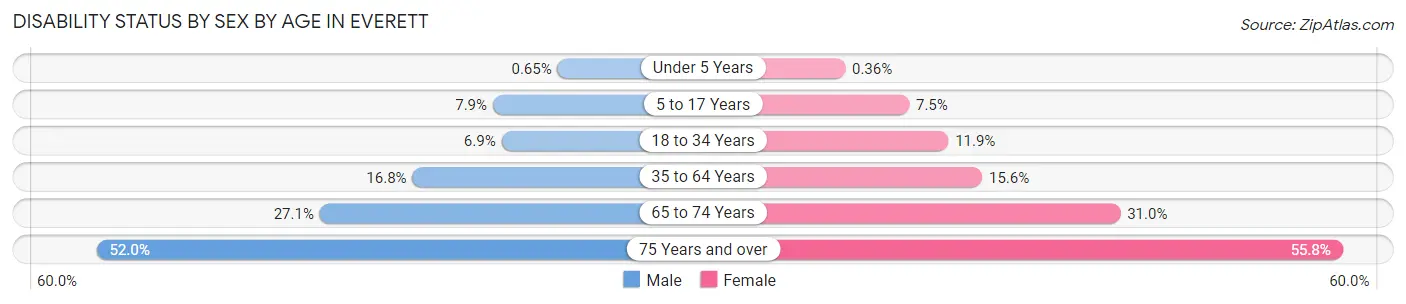
| Age Bracket | Male | Female |
| Under 5 Years | 23 (0.6%) | 10 (0.4%) |
| 5 to 17 Years | 657 (7.9%) | 582 (7.5%) |
| 18 to 34 Years | 1,010 (6.9%) | 1,674 (11.8%) |
| 35 to 64 Years | 3,582 (16.8%) | 3,098 (15.6%) |
| 65 to 74 Years | 1,351 (27.1%) | 1,531 (31.0%) |
| 75 Years and over | 1,060 (52.0%) | 1,780 (55.8%) |
Disability Class by Sex by Age in Everett
Disability Class: Hearing Difficulty
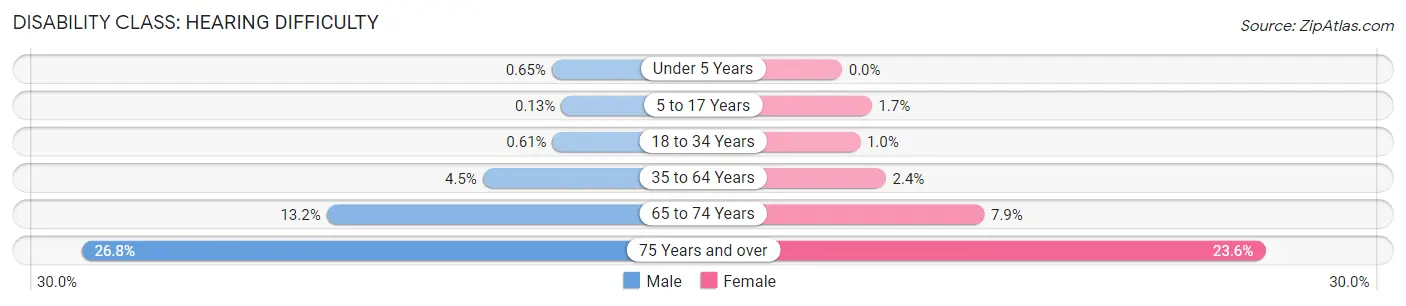
| Age Bracket | Male | Female |
| Under 5 Years | 23 (0.6%) | 0 (0.0%) |
| 5 to 17 Years | 11 (0.1%) | 128 (1.7%) |
| 18 to 34 Years | 90 (0.6%) | 143 (1.0%) |
| 35 to 64 Years | 956 (4.5%) | 483 (2.4%) |
| 65 to 74 Years | 657 (13.2%) | 391 (7.9%) |
| 75 Years and over | 547 (26.8%) | 752 (23.6%) |
Disability Class: Vision Difficulty
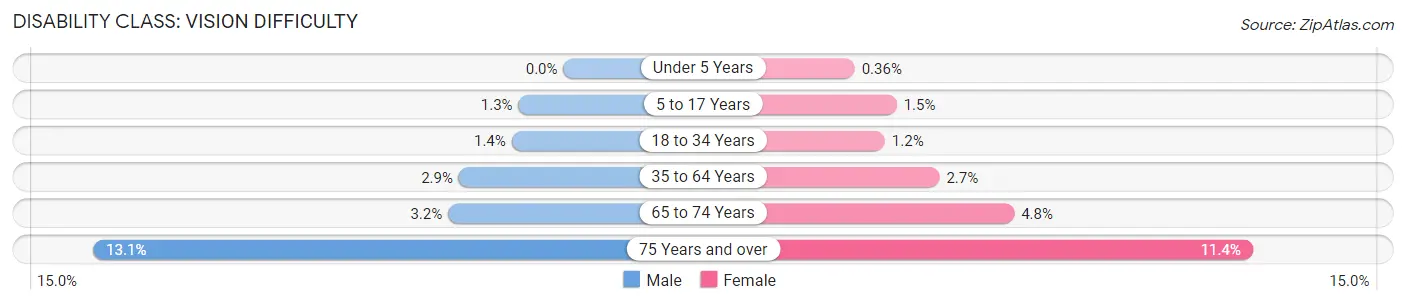
| Age Bracket | Male | Female |
| Under 5 Years | 0 (0.0%) | 10 (0.4%) |
| 5 to 17 Years | 105 (1.3%) | 119 (1.5%) |
| 18 to 34 Years | 211 (1.4%) | 170 (1.2%) |
| 35 to 64 Years | 621 (2.9%) | 540 (2.7%) |
| 65 to 74 Years | 160 (3.2%) | 237 (4.8%) |
| 75 Years and over | 267 (13.1%) | 365 (11.4%) |
Disability Class: Cognitive Difficulty
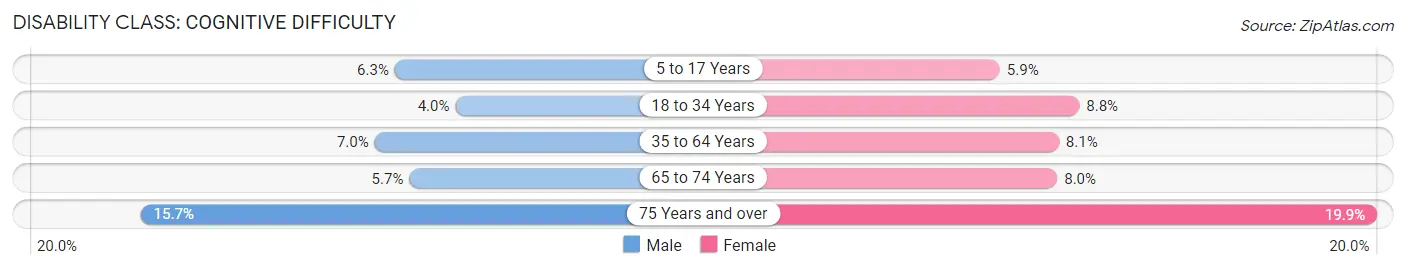
| Age Bracket | Male | Female |
| 5 to 17 Years | 524 (6.3%) | 456 (5.9%) |
| 18 to 34 Years | 588 (4.0%) | 1,245 (8.8%) |
| 35 to 64 Years | 1,493 (7.0%) | 1,598 (8.1%) |
| 65 to 74 Years | 285 (5.7%) | 395 (8.0%) |
| 75 Years and over | 320 (15.7%) | 634 (19.9%) |
Disability Class: Ambulatory Difficulty
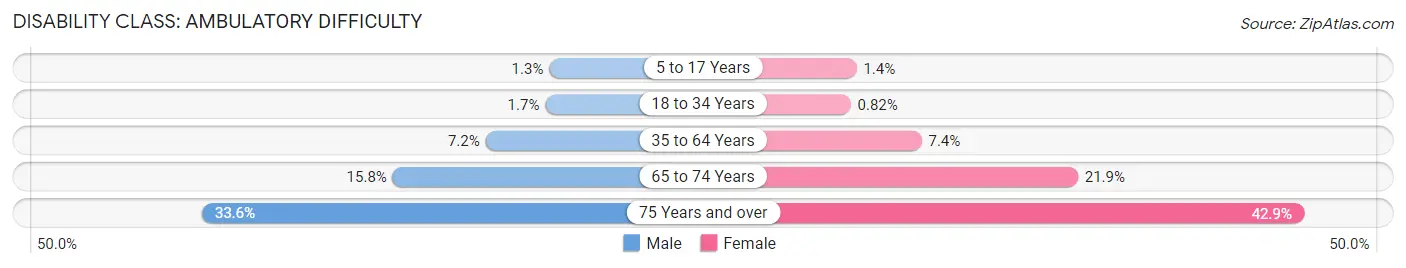
| Age Bracket | Male | Female |
| 5 to 17 Years | 110 (1.3%) | 106 (1.4%) |
| 18 to 34 Years | 246 (1.7%) | 116 (0.8%) |
| 35 to 64 Years | 1,539 (7.2%) | 1,467 (7.4%) |
| 65 to 74 Years | 789 (15.8%) | 1,081 (21.9%) |
| 75 Years and over | 684 (33.6%) | 1,368 (42.9%) |
Disability Class: Self-Care Difficulty
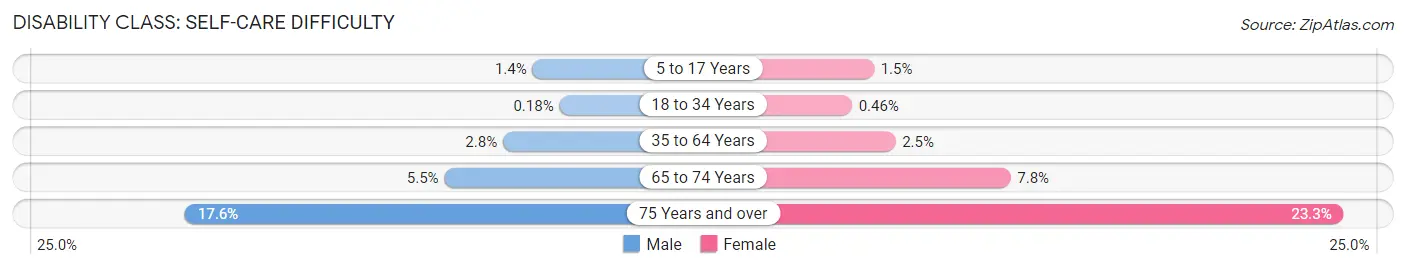
| Age Bracket | Male | Female |
| 5 to 17 Years | 120 (1.4%) | 115 (1.5%) |
| 18 to 34 Years | 26 (0.2%) | 65 (0.5%) |
| 35 to 64 Years | 597 (2.8%) | 492 (2.5%) |
| 65 to 74 Years | 275 (5.5%) | 386 (7.8%) |
| 75 Years and over | 358 (17.6%) | 743 (23.3%) |
Technology Access in Everett
Computing Device Access in Everett
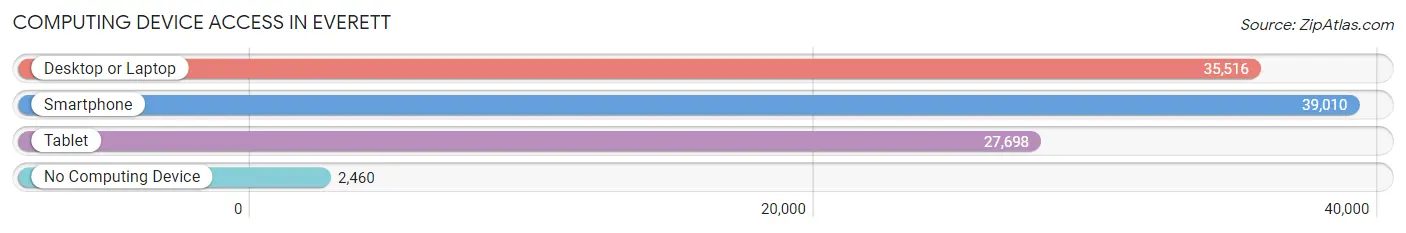
| Device Type | # Households | % Households |
| Desktop or Laptop | 35,516 | 81.0% |
| Smartphone | 39,010 | 89.0% |
| Tablet | 27,698 | 63.2% |
| No Computing Device | 2,460 | 5.6% |
| Total | 43,840 | 100.0% |
Internet Access in Everett
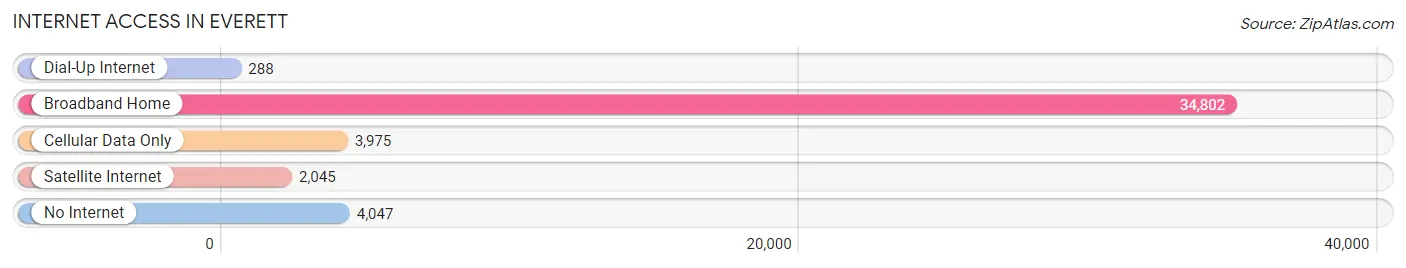
| Internet Type | # Households | % Households |
| Dial-Up Internet | 288 | 0.7% |
| Broadband Home | 34,802 | 79.4% |
| Cellular Data Only | 3,975 | 9.1% |
| Satellite Internet | 2,045 | 4.7% |
| No Internet | 4,047 | 9.2% |
| Total | 43,840 | 100.0% |
Everett Summary
Everett, Washington is a city located in Snohomish County, Washington, United States. It is the county seat and the largest city in the county. The city is located 25 miles north of Seattle and is part of the Seattle metropolitan area. As of the 2010 census, the city had a population of 103,019, making it the seventh largest city in the state.
History
The area that is now Everett was originally inhabited by the Snohomish people, who were part of the Coast Salish culture. The first European settlers arrived in the area in the 1860s, and the city was officially incorporated in 1893. The city was named after Everett Colby, a businessman from Portland, Oregon.
In the early 1900s, Everett was a major lumber and shingle-producing center. The city was also home to several shipbuilding companies, including the Everett Shipbuilding Company, which built the USS Everett in 1917.
In the 1920s, Everett experienced a period of rapid growth, and the city's population more than doubled between 1920 and 1930. During this period, the city was home to several large industries, including the Boeing Company, which opened its first plant in the city in 1936.
Geography
Everett is located in the Puget Sound region of Washington, about 25 miles north of Seattle. The city is situated on the Port Gardner Peninsula, which is bordered by the Snohomish River to the south and the Pilchuck River to the north. The city is surrounded by several smaller communities, including Marysville, Mukilteo, and Lynnwood.
The city has a total area of 40.3 square miles, of which 37.2 square miles is land and 3.1 square miles is water. The city is located at an elevation of 108 feet above sea level.
Economy
Everett's economy is largely based on manufacturing and services. The city is home to several large companies, including Boeing, Fluke Corporation, and the Everett Clinic. The city is also home to several military installations, including Naval Station Everett and the Everett Army Reserve Center.
The city's port is the largest on the west coast of the United States and is home to several major shipping companies. The port is also home to several cruise lines, including Holland America and Princess Cruises.
Demographics
As of the 2010 census, the city had a population of 103,019. The racial makeup of the city was 77.2% White, 8.3% Asian, 6.2% Hispanic or Latino, 4.2% African American, and 2.2% Native American.
The median household income in the city was $54,845, and the median family income was $63,945. The per capita income in the city was $27,845. About 11.3% of the population was below the poverty line.
The city's population is largely educated, with 92.3% of the population over the age of 25 having a high school diploma or higher, and 37.2% having a bachelor's degree or higher. The city's largest employers are Boeing, Naval Station Everett, and the Everett Clinic.
Common Questions
What is Per Capita Income in Everett?
Per Capita income in Everett is $40,215.
What is the Median Family Income in Everett?
Median Family Income in Everett is $90,928.
What is the Median Household income in Everett?
Median Household Income in Everett is $77,806.
What is Income or Wage Gap in Everett?
Income or Wage Gap in Everett is 24.7%.
Women in Everett earn 75.3 cents for every dollar earned by a man.
What is Family Income Deficit in Everett?
Family Income Deficit in Everett is $10,537.
Families that are below poverty line in Everett earn $10,537 less on average than the poverty threshold level.
What is Inequality or Gini Index in Everett?
Inequality or Gini Index in Everett is 0.43.
What is the Total Population of Everett?
Total Population of Everett is 110,847.
What is the Total Male Population of Everett?
Total Male Population of Everett is 57,265.
What is the Total Female Population of Everett?
Total Female Population of Everett is 53,582.
What is the Ratio of Males per 100 Females in Everett?
There are 106.87 Males per 100 Females in Everett.
What is the Ratio of Females per 100 Males in Everett?
There are 93.57 Females per 100 Males in Everett.
What is the Median Population Age in Everett?
Median Population Age in Everett is 36.4 Years.
What is the Average Family Size in Everett
Average Family Size in Everett is 3.1 People.
What is the Average Household Size in Everett
Average Household Size in Everett is 2.4 People.
How Large is the Labor Force in Everett?
There are 61,465 People in the Labor Forcein in Everett.
What is the Percentage of People in the Labor Force in Everett?
67.5% of People are in the Labor Force in Everett.
What is the Unemployment Rate in Everett?
Unemployment Rate in Everett is 5.8%.