Cities with the Lowest Poverty Level Among Children Under the Age of 5 in Ohio
RELATED REPORTS & OPTIONS
Lowest Poverty | Child 0-5
Ohio
Compare Cities
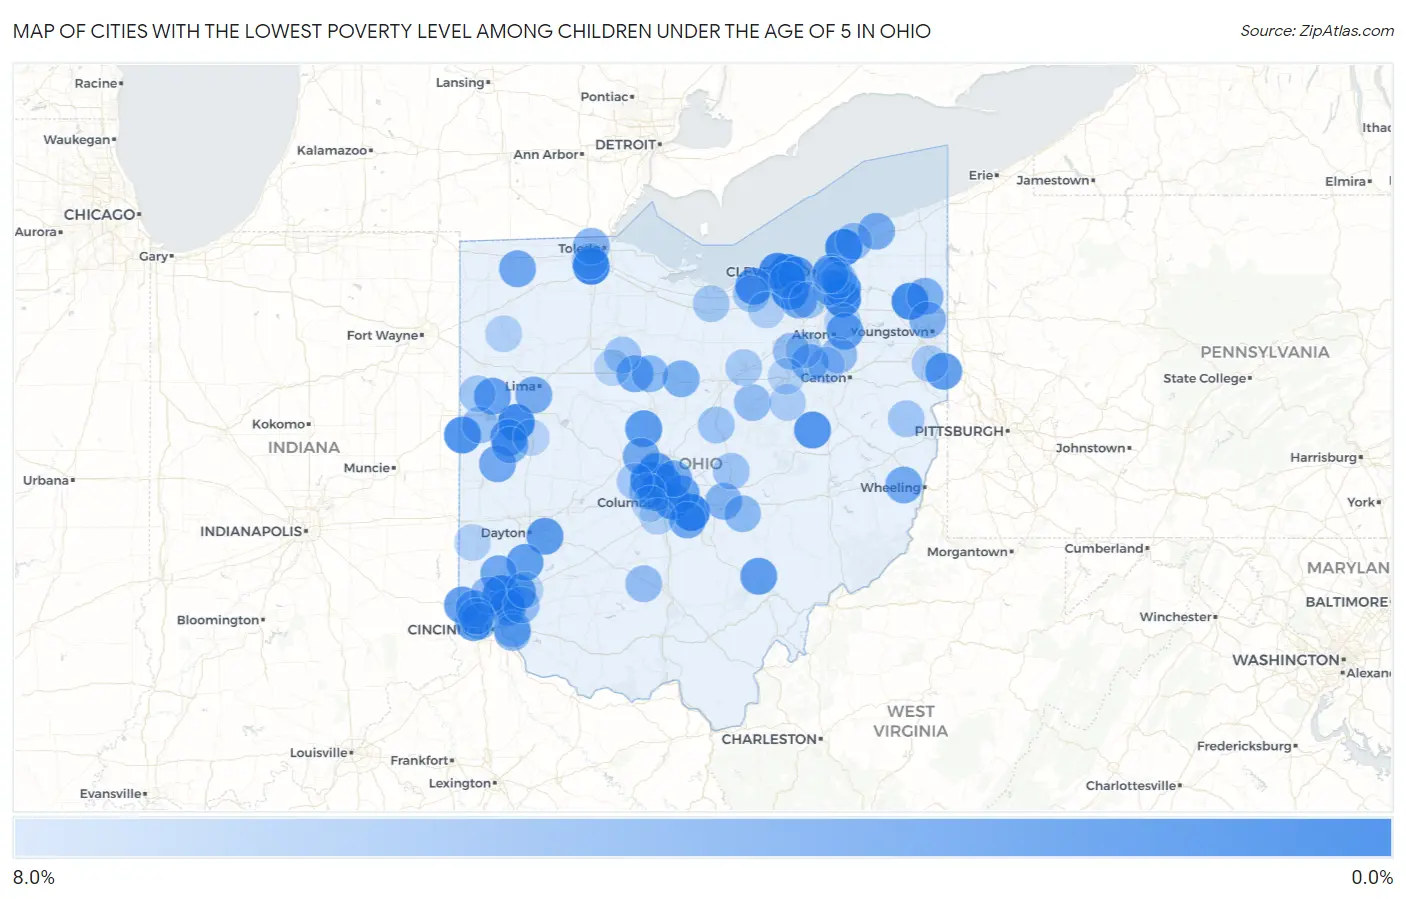
Map of Cities with the Lowest Poverty Level Among Children Under the Age of 5 in Ohio
8.0%
0.0%
Cities with the Lowest Poverty Level Among Children Under the Age of 5 in Ohio
| City | Child Poverty | vs State | vs National | |
| 1. | Pickerington | 0.65% | 20.7%(-20.0)#1 | 18.1%(-17.4)#37 |
| 2. | Bay Village | 0.70% | 20.7%(-20.0)#2 | 18.1%(-17.4)#47 |
| 3. | Eastlake | 0.81% | 20.7%(-19.9)#3 | 18.1%(-17.3)#63 |
| 4. | Perrysburg | 0.88% | 20.7%(-19.8)#4 | 18.1%(-17.2)#77 |
| 5. | Beckett Ridge | 0.88% | 20.7%(-19.8)#5 | 18.1%(-17.2)#79 |
| 6. | Worthington | 0.90% | 20.7%(-19.8)#6 | 18.1%(-17.2)#80 |
| 7. | Twinsburg | 0.99% | 20.7%(-19.7)#7 | 18.1%(-17.1)#103 |
| 8. | New Knoxville | 1.1% | 20.7%(-19.6)#8 | 18.1%(-17.0)#114 |
| 9. | Dublin | 1.2% | 20.7%(-19.5)#9 | 18.1%(-16.9)#131 |
| 10. | Olmsted Falls | 1.2% | 20.7%(-19.5)#10 | 18.1%(-16.9)#136 |
| 11. | Sharonville | 1.2% | 20.7%(-19.4)#11 | 18.1%(-16.8)#142 |
| 12. | Champion Heights | 1.3% | 20.7%(-19.4)#12 | 18.1%(-16.8)#149 |
| 13. | Avon Lake | 1.4% | 20.7%(-19.3)#13 | 18.1%(-16.7)#180 |
| 14. | Bexley | 1.7% | 20.7%(-19.0)#14 | 18.1%(-16.4)#251 |
| 15. | Amherst | 1.7% | 20.7%(-18.9)#15 | 18.1%(-16.3)#259 |
| 16. | Fort Recovery | 1.8% | 20.7%(-18.9)#16 | 18.1%(-16.3)#288 |
| 17. | Solon | 2.0% | 20.7%(-18.7)#17 | 18.1%(-16.0)#346 |
| 18. | Baltic | 2.1% | 20.7%(-18.6)#18 | 18.1%(-16.0)#368 |
| 19. | Powell | 2.2% | 20.7%(-18.4)#19 | 18.1%(-15.8)#416 |
| 20. | Mason | 2.3% | 20.7%(-18.3)#20 | 18.1%(-15.7)#450 |
| 21. | Prospect | 2.4% | 20.7%(-18.3)#21 | 18.1%(-15.7)#466 |
| 22. | Mack | 2.4% | 20.7%(-18.3)#22 | 18.1%(-15.7)#469 |
| 23. | Rocky River | 2.4% | 20.7%(-18.2)#23 | 18.1%(-15.6)#482 |
| 24. | Beavercreek | 2.5% | 20.7%(-18.1)#24 | 18.1%(-15.5)#513 |
| 25. | East Palestine | 2.6% | 20.7%(-18.1)#25 | 18.1%(-15.5)#529 |
| 26. | Buchtel | 2.6% | 20.7%(-18.1)#26 | 18.1%(-15.5)#535 |
| 27. | Harrison | 2.6% | 20.7%(-18.0)#27 | 18.1%(-15.4)#551 |
| 28. | Springboro | 2.7% | 20.7%(-18.0)#28 | 18.1%(-15.4)#561 |
| 29. | Minster | 2.7% | 20.7%(-17.9)#29 | 18.1%(-15.3)#599 |
| 30. | Tallmadge | 2.8% | 20.7%(-17.9)#30 | 18.1%(-15.3)#614 |
| 31. | Mendon | 2.8% | 20.7%(-17.9)#31 | 18.1%(-15.2)#631 |
| 32. | University Heights | 2.8% | 20.7%(-17.8)#32 | 18.1%(-15.2)#633 |
| 33. | Upper Arlington | 2.9% | 20.7%(-17.8)#33 | 18.1%(-15.2)#649 |
| 34. | Gahanna | 3.0% | 20.7%(-17.7)#34 | 18.1%(-15.1)#701 |
| 35. | Taylor Creek | 3.2% | 20.7%(-17.5)#35 | 18.1%(-14.9)#784 |
| 36. | Archbold | 3.4% | 20.7%(-17.3)#36 | 18.1%(-14.7)#861 |
| 37. | Versailles | 3.4% | 20.7%(-17.2)#37 | 18.1%(-14.6)#881 |
| 38. | Trenton | 3.4% | 20.7%(-17.2)#38 | 18.1%(-14.6)#882 |
| 39. | Strongsville | 3.5% | 20.7%(-17.2)#39 | 18.1%(-14.6)#900 |
| 40. | Canal Winchester | 3.5% | 20.7%(-17.1)#40 | 18.1%(-14.5)#920 |
| 41. | Blue Ash | 3.5% | 20.7%(-17.1)#41 | 18.1%(-14.5)#923 |
| 42. | Ostrander | 3.6% | 20.7%(-17.1)#42 | 18.1%(-14.5)#943 |
| 43. | Upper Sandusky | 3.6% | 20.7%(-17.0)#43 | 18.1%(-14.4)#970 |
| 44. | St Clairsville | 3.6% | 20.7%(-17.0)#44 | 18.1%(-14.4)#971 |
| 45. | Perry | 3.7% | 20.7%(-17.0)#45 | 18.1%(-14.4)#994 |
| 46. | Fort Shawnee | 3.7% | 20.7%(-17.0)#46 | 18.1%(-14.3)#1,013 |
| 47. | Westerville | 4.0% | 20.7%(-16.7)#47 | 18.1%(-14.1)#1,123 |
| 48. | North Robinson | 4.0% | 20.7%(-16.7)#48 | 18.1%(-14.1)#1,133 |
| 49. | Cortland | 4.1% | 20.7%(-16.5)#49 | 18.1%(-13.9)#1,169 |
| 50. | Marshallville | 4.2% | 20.7%(-16.5)#50 | 18.1%(-13.9)#1,203 |
| 51. | Fort Loramie | 4.2% | 20.7%(-16.4)#51 | 18.1%(-13.8)#1,226 |
| 52. | Girard | 4.2% | 20.7%(-16.4)#52 | 18.1%(-13.8)#1,233 |
| 53. | Hebron | 4.4% | 20.7%(-16.3)#53 | 18.1%(-13.7)#1,282 |
| 54. | Bedford | 4.4% | 20.7%(-16.2)#54 | 18.1%(-13.6)#1,302 |
| 55. | Dry Run | 4.5% | 20.7%(-16.2)#55 | 18.1%(-13.6)#1,323 |
| 56. | Ottawa Hills | 4.6% | 20.7%(-16.1)#56 | 18.1%(-13.5)#1,379 |
| 57. | Westlake | 4.7% | 20.7%(-16.0)#57 | 18.1%(-13.4)#1,423 |
| 58. | Forestville | 4.8% | 20.7%(-15.9)#58 | 18.1%(-13.3)#1,439 |
| 59. | Nevada | 4.8% | 20.7%(-15.9)#59 | 18.1%(-13.3)#1,451 |
| 60. | Glenford | 4.8% | 20.7%(-15.9)#60 | 18.1%(-13.3)#1,466 |
| 61. | Fairfield | 5.0% | 20.7%(-15.7)#61 | 18.1%(-13.1)#1,557 |
| 62. | Loudonville | 5.0% | 20.7%(-15.6)#62 | 18.1%(-13.0)#1,586 |
| 63. | Bridgetown | 5.1% | 20.7%(-15.6)#63 | 18.1%(-13.0)#1,598 |
| 64. | Green | 5.1% | 20.7%(-15.6)#64 | 18.1%(-13.0)#1,599 |
| 65. | Creston | 5.1% | 20.7%(-15.6)#65 | 18.1%(-13.0)#1,605 |
| 66. | Loveland | 5.2% | 20.7%(-15.5)#66 | 18.1%(-12.9)#1,646 |
| 67. | Mentor | 5.2% | 20.7%(-15.5)#67 | 18.1%(-12.9)#1,654 |
| 68. | Frankfort | 5.2% | 20.7%(-15.5)#68 | 18.1%(-12.9)#1,658 |
| 69. | Coldwater | 5.4% | 20.7%(-15.3)#69 | 18.1%(-12.7)#1,740 |
| 70. | St Louisville | 5.6% | 20.7%(-15.1)#70 | 18.1%(-12.5)#1,817 |
| 71. | Fredericktown | 5.6% | 20.7%(-15.1)#71 | 18.1%(-12.5)#1,831 |
| 72. | South Amherst | 5.7% | 20.7%(-15.0)#72 | 18.1%(-12.4)#1,860 |
| 73. | Carey | 5.7% | 20.7%(-15.0)#73 | 18.1%(-12.3)#1,886 |
| 74. | Bergholz | 5.7% | 20.7%(-15.0)#74 | 18.1%(-12.3)#1,892 |
| 75. | Dent | 5.7% | 20.7%(-14.9)#75 | 18.1%(-12.3)#1,897 |
| 76. | Hilliard | 5.8% | 20.7%(-14.9)#76 | 18.1%(-12.3)#1,910 |
| 77. | Milan | 5.8% | 20.7%(-14.8)#77 | 18.1%(-12.2)#1,919 |
| 78. | Rockford | 5.9% | 20.7%(-14.8)#78 | 18.1%(-12.2)#1,938 |
| 79. | North Royalton | 5.9% | 20.7%(-14.8)#79 | 18.1%(-12.2)#1,951 |
| 80. | Plain City | 5.9% | 20.7%(-14.7)#80 | 18.1%(-12.1)#1,965 |
| 81. | Beachwood | 6.0% | 20.7%(-14.7)#81 | 18.1%(-12.1)#1,969 |
| 82. | Orange | 6.0% | 20.7%(-14.7)#82 | 18.1%(-12.1)#1,972 |
| 83. | Columbiana | 6.0% | 20.7%(-14.7)#83 | 18.1%(-12.1)#1,979 |
| 84. | Ashland | 6.1% | 20.7%(-14.6)#84 | 18.1%(-11.9)#2,028 |
| 85. | Canal Fulton | 6.2% | 20.7%(-14.5)#85 | 18.1%(-11.9)#2,064 |
| 86. | Holmesville | 6.2% | 20.7%(-14.4)#86 | 18.1%(-11.8)#2,109 |
| 87. | Shaker Heights | 6.3% | 20.7%(-14.4)#87 | 18.1%(-11.8)#2,114 |
| 88. | Maumee | 6.3% | 20.7%(-14.4)#88 | 18.1%(-11.8)#2,121 |
| 89. | Grove City | 6.3% | 20.7%(-14.3)#89 | 18.1%(-11.7)#2,134 |
| 90. | Lagrange | 6.4% | 20.7%(-14.3)#90 | 18.1%(-11.7)#2,146 |
| 91. | Rittman | 6.4% | 20.7%(-14.3)#91 | 18.1%(-11.7)#2,155 |
| 92. | Melrose | 6.5% | 20.7%(-14.2)#92 | 18.1%(-11.6)#2,175 |
| 93. | Lake Lakengren | 6.5% | 20.7%(-14.1)#93 | 18.1%(-11.5)#2,197 |
| 94. | Wharton | 6.7% | 20.7%(-14.0)#94 | 18.1%(-11.4)#2,267 |
| 95. | Wooster | 6.7% | 20.7%(-14.0)#95 | 18.1%(-11.4)#2,288 |
| 96. | Roseland | 6.7% | 20.7%(-13.9)#96 | 18.1%(-11.3)#2,295 |
| 97. | Lincoln Village | 6.7% | 20.7%(-13.9)#97 | 18.1%(-11.3)#2,298 |
| 98. | South Lebanon | 6.8% | 20.7%(-13.9)#98 | 18.1%(-11.3)#2,304 |
| 99. | Anna | 6.8% | 20.7%(-13.9)#99 | 18.1%(-11.3)#2,307 |
| 100. | Stow | 6.8% | 20.7%(-13.9)#100 | 18.1%(-11.3)#2,321 |
Common Questions
What are the Top 10 Cities with the Lowest Poverty Level Among Children Under the Age of 5 in Ohio?
Top 10 Cities with the Lowest Poverty Level Among Children Under the Age of 5 in Ohio are:
#1
0.65%
#2
0.70%
#3
0.81%
#4
0.88%
#5
0.88%
#6
0.90%
#7
0.99%
#8
1.1%
#9
1.2%
#10
1.2%
What city has the Lowest Poverty Level Among Children Under the Age of 5 in Ohio?
Pickerington has the Lowest Poverty Level Among Children Under the Age of 5 in Ohio with 0.65%.
What is the Poverty Level Among Children Under the Age of 5 in the State of Ohio?
Poverty Level Among Children Under the Age of 5 in Ohio is 20.7%.
What is the Poverty Level Among Children Under the Age of 5 in the United States?
Poverty Level Among Children Under the Age of 5 in the United States is 18.1%.