Cities with the Lowest Poverty Level Among Children Under the Age of 5 in Delaware

RELATED REPORTS & OPTIONS

Lowest Poverty | Child 0-5
Population
Families and Households
Female Fertility
Female Fertility (Unmarried)
Race (Community Size)
Race (Percentage)
Ancestry (Community Size)
AfghanAfricanAlaska NativeAlaskan AthabascanAlbanianAleutAlsatianAmericanApacheArabArapahoArgentineanArmenianAssyrian / Chaldean / SyriacAustralianAustrianBahamianBangladeshiBarbadianBasqueBelgianBelizeanBermudanBhutaneseBlackfeetBolivianBrazilianBritishBritish West IndianBulgarianBurmeseCajunCambodianCanadianCape VerdeanCarpatho RusynCelticCentral AmericanCentral American IndianCherokeeCheyenneChickasawChileanChineseChippewaChoctawColombianColvilleComancheCosta RicanCreeCreekCroatianCrowCubanCypriotCzechCzechoslovakianDanishDelawareDominicanDutchDutch West IndianEastern EuropeanEcuadorianEgyptianEnglishEstonianEthiopianEuropeanFijianFilipinoFinnishFrenchFrench American IndianFrench CanadianGermanGerman RussianGhanaianGreekGuamanian / ChamorroGuatemalanGuyaneseHaitianHmongHonduranHopiHoumaHungarianIcelanderIndian (Asian)IndonesianInupiatIranianIraqiIrishIroquoisIsraeliItalianJamaicanJapaneseJordanianKenyanKiowaKoreanLaotianLatvianLebaneseLiberianLithuanianLumbeeLuxembourgerMacedonianMalaysianMalteseMarshalleseMenomineeMexicanMexican American IndianMongolianMoroccanNative HawaiianNavajoNepaleseNew ZealanderNicaraguanNigerianNorthern EuropeanNorwegianOkinawanOsageOttawaPaiutePakistaniPalestinianPanamanianParaguayanPennsylvania GermanPeruvianPimaPolishPortuguesePotawatomiPuebloPuerto RicanPuget Sound SalishRomanianRussianSalvadoranSamoanScandinavianScotch-IrishScottishSeminoleSenegaleseSerbianShoshoneSierra LeoneanSiouxSlavicSlovakSloveneSomaliSouth AfricanSouth AmericanSouth American IndianSoviet UnionSpaniardSpanishSpanish AmericanSpanish American IndianSri LankanSubsaharan AfricanSudaneseSwedishSwissSyrianTaiwaneseThaiTlingit-HaidaTohono O'OdhamTonganTrinidadian and TobagonianTsimshianTurkishU.S. Virgin IslanderUgandanUkrainianUruguayanUteVenezuelanVietnameseWelshWest IndianYakamaYaquiYugoslavianYumanYup'ikZimbabwean
Ancestry (Percentage)
AfghanAfricanAlaska NativeAlaskan AthabascanAlbanianAleutAlsatianAmericanApacheArabArapahoArgentineanArmenianAssyrian / Chaldean / SyriacAustralianAustrianBahamianBangladeshiBarbadianBasqueBelgianBelizeanBermudanBhutaneseBlackfeetBolivianBrazilianBritishBritish West IndianBulgarianBurmeseCajunCambodianCanadianCape VerdeanCarpatho RusynCelticCentral AmericanCentral American IndianCherokeeCheyenneChickasawChileanChineseChippewaChoctawColombianColvilleComancheCosta RicanCreeCreekCroatianCrowCubanCypriotCzechCzechoslovakianDanishDelawareDominicanDutchDutch West IndianEastern EuropeanEcuadorianEgyptianEnglishEstonianEthiopianEuropeanFijianFilipinoFinnishFrenchFrench American IndianFrench CanadianGermanGerman RussianGhanaianGreekGuamanian / ChamorroGuatemalanGuyaneseHaitianHmongHonduranHopiHoumaHungarianIcelanderIndian (Asian)IndonesianInupiatIranianIraqiIrishIroquoisIsraeliItalianJamaicanJapaneseJordanianKenyanKiowaKoreanLaotianLatvianLebaneseLiberianLithuanianLumbeeLuxembourgerMacedonianMalaysianMalteseMarshalleseMenomineeMexicanMexican American IndianMongolianMoroccanNative HawaiianNavajoNepaleseNew ZealanderNicaraguanNigerianNorthern EuropeanNorwegianOkinawanOsageOttawaPaiutePakistaniPalestinianPanamanianParaguayanPennsylvania GermanPeruvianPimaPolishPortuguesePotawatomiPuebloPuerto RicanPuget Sound SalishRomanianRussianSalvadoranSamoanScandinavianScotch-IrishScottishSeminoleSenegaleseSerbianShoshoneSierra LeoneanSiouxSlavicSlovakSloveneSomaliSouth AfricanSouth AmericanSouth American IndianSoviet UnionSpaniardSpanishSpanish AmericanSpanish American IndianSri LankanSubsaharan AfricanSudaneseSwedishSwissSyrianTaiwaneseThaiTlingit-HaidaTohono O'OdhamTonganTrinidadian and TobagonianTsimshianTurkishU.S. Virgin IslanderUgandanUkrainianUruguayanUteVenezuelanVietnameseWelshWest IndianYakamaYaquiYugoslavianYumanYup'ikZimbabwean
Immigrant Origin (Total)
AfghanistanAfricaAlbaniaArgentinaArmeniaAsiaAustraliaAustriaAzoresBahamasBangladeshBarbadosBelarusBelgiumBelizeBoliviaBosnia and HerzegovinaBrazilBulgariaBurma / MyanmarCabo VerdeCambodiaCameroonCanadaCaribbeanCentral AmericaChileChinaColombiaCongoCosta RicaCroatiaCubaCzechoslovakiaDenmarkDominicaDominican RepublicEastern AfricaEastern AsiaEastern EuropeEcuadorEgyptEl SalvadorEnglandEritreaEthiopiaEuropeFijiFranceGermanyGhanaGreeceGrenadaGuatemalaGuyanaHaitiHondurasHong KongHungaryIndiaIndonesiaIranIraqIrelandIsraelItalyJamaicaJapanJordanKazakhstanKenyaKoreaKuwaitLaosLatin AmericaLatviaLebanonLiberiaLithuaniaMalaysiaMexicoMicronesiaMiddle AfricaMoldovaMoroccoNepalNetherlandsNicaraguaNigeriaNorth MacedoniaNorthern AfricaNorthern EuropeNorwayOceaniaPakistanPanamaPeruPhilippinesPolandPortugalRomaniaRussiaSaudi ArabiaScotlandSenegalSerbiaSierra LeoneSingaporeSomaliaSouth AfricaSouth AmericaSouth Central AsiaSouth Eastern AsiaSouthern EuropeSpainSri LankaSt. Vincent and the GrenadinesSudanSwedenSwitzerlandSyriaTaiwanThailandTrinidad and TobagoTurkeyUgandaUkraineUruguayUzbekistanVenezuelaVietnamWest IndiesWestern AfricaWestern AsiaWestern EuropeYemenZaireZimbabwe
Immigrant Origin (Percentage)
AfghanistanAfricaAlbaniaArgentinaArmeniaAsiaAustraliaAustriaAzoresBahamasBangladeshBarbadosBelarusBelgiumBelizeBoliviaBosnia and HerzegovinaBrazilBulgariaBurma / MyanmarCabo VerdeCambodiaCameroonCanadaCaribbeanCentral AmericaChileChinaColombiaCongoCosta RicaCroatiaCubaCzechoslovakiaDenmarkDominicaDominican RepublicEastern AfricaEastern AsiaEastern EuropeEcuadorEgyptEl SalvadorEnglandEritreaEthiopiaEuropeFijiFranceGermanyGhanaGreeceGrenadaGuatemalaGuyanaHaitiHondurasHong KongHungaryIndiaIndonesiaIranIraqIrelandIsraelItalyJamaicaJapanJordanKazakhstanKenyaKoreaKuwaitLaosLatin AmericaLatviaLebanonLiberiaLithuaniaMalaysiaMexicoMicronesiaMiddle AfricaMoldovaMoroccoNepalNetherlandsNicaraguaNigeriaNorth MacedoniaNorthern AfricaNorthern EuropeNorwayOceaniaPakistanPanamaPeruPhilippinesPolandPortugalRomaniaRussiaSaudi ArabiaScotlandSenegalSerbiaSierra LeoneSingaporeSomaliaSouth AfricaSouth AmericaSouth Central AsiaSouth Eastern AsiaSouthern EuropeSpainSri LankaSt. Vincent and the GrenadinesSudanSwedenSwitzerlandSyriaTaiwanThailandTrinidad and TobagoTurkeyUgandaUkraineUruguayUzbekistanVenezuelaVietnamWest IndiesWestern AfricaWestern AsiaWestern EuropeYemenZaireZimbabwe
Income
Income (Families)
Income (Households)
Poverty
Poverty (Families)
Unemployment
Employment Occupations
Employment Industries
Employer Class
Commute Time
Commute Means
School Enrollment
Education by Degree Field
Occupancy
Finances
Physical Characteristics
Delaware
Compare Cities
Comparison Subject

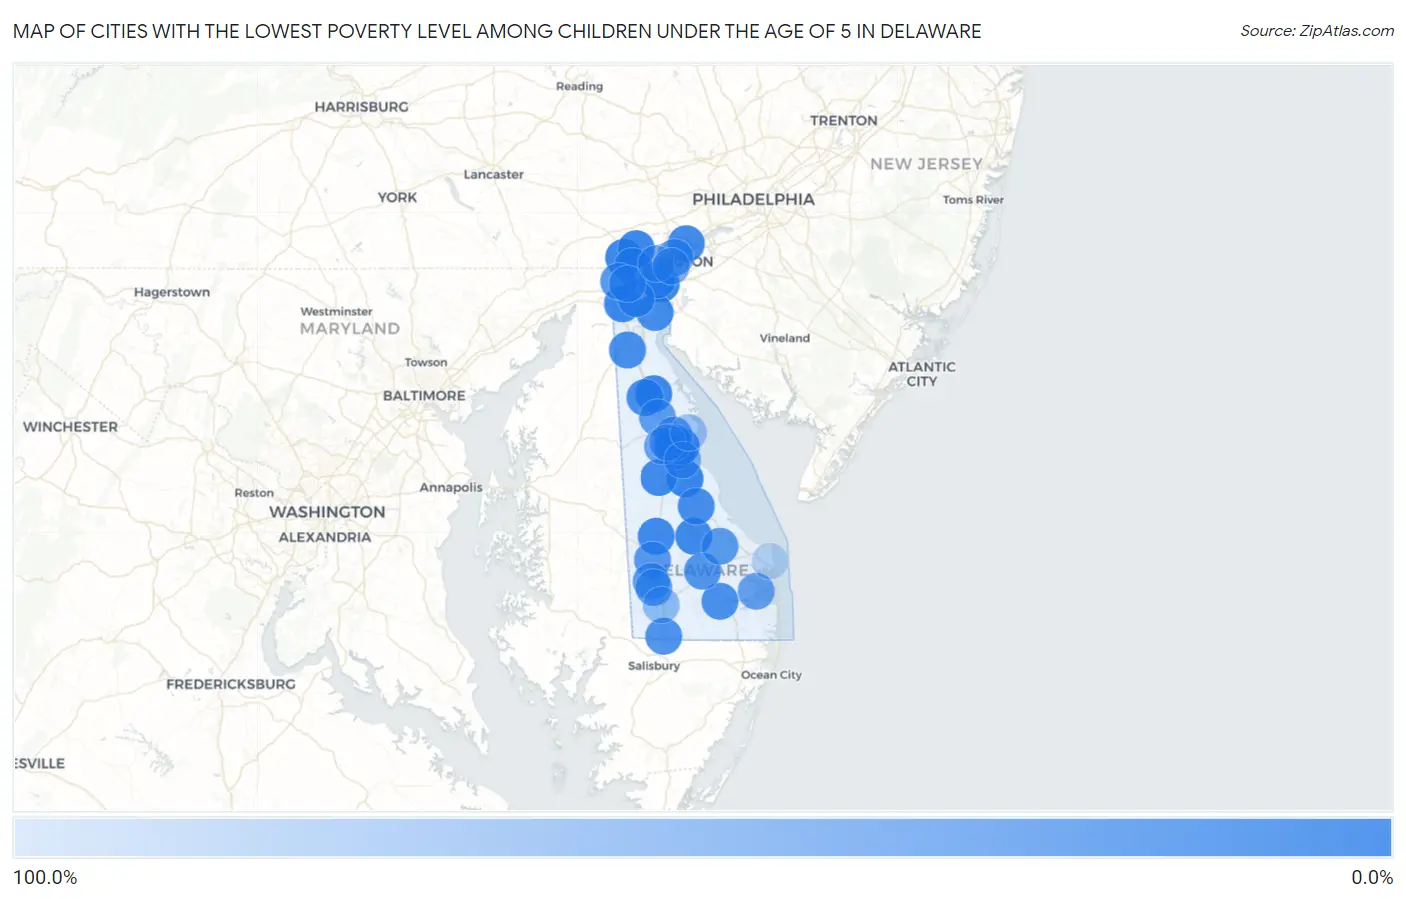
Map of Cities with the Lowest Poverty Level Among Children Under the Age of 5 in Delaware

100.0%
0.0%
Cities with the Lowest Poverty Level Among Children Under the Age of 5 in Delaware Map

Cities with the Lowest Poverty Level Among Children Under the Age of 5 in Delaware

City Child Poverty vs State vs National
1.Frederica2.4%19.1%(-16.7)#118.1%(-15.7)#472
2.Rising Sun Lebanon2.8%19.1%(-16.3)#218.1%(-15.3)#600
3.North Star3.0%19.1%(-16.0)#318.1%(-15.0)#716
4.New Castle3.1%19.1%(-16.0)#418.1%(-15.0)#729
5.Hockessin3.9%19.1%(-15.2)#518.1%(-14.2)#1,072
6.Glasgow5.7%19.1%(-13.4)#618.1%(-12.4)#1,882
7.Smyrna6.0%19.1%(-13.1)#718.1%(-12.1)#1,988
8.Highland Acres6.5%19.1%(-12.6)#818.1%(-11.6)#2,168
9.Ellendale6.6%19.1%(-12.5)#918.1%(-11.5)#2,231
10.Dover Base Housing7.1%19.1%(-12.0)#1018.1%(-11.0)#2,458
11.Felton8.8%19.1%(-10.2)#1118.1%(-9.24)#3,178
12.Claymont9.4%19.1%(-9.68)#1218.1%(-8.68)#3,423
13.Greenwood9.4%19.1%(-9.66)#1318.1%(-8.66)#3,425
14.Clayton12.4%19.1%(-6.67)#1418.1%(-5.67)#4,576
15.Delaware City13.3%19.1%(-5.73)#1518.1%(-4.73)#4,944
16.Milford14.2%19.1%(-4.86)#1618.1%(-3.86)#5,284
17.Pike Creek Valley14.4%19.1%(-4.62)#1718.1%(-3.62)#5,398
18.Middletown14.5%19.1%(-4.59)#1818.1%(-3.59)#5,405
19.Millsboro15.2%19.1%(-3.82)#1918.1%(-2.82)#5,662
20.Wilmington Manor15.3%19.1%(-3.76)#2018.1%(-2.76)#5,678
21.Bear17.2%19.1%(-1.88)#2118.1%(-0.879)#6,332
22.Delmar18.1%19.1%(-0.931)#2218.1%(+0.069)#6,642
23.Newark22.5%19.1%(+3.40)#2318.1%(+4.40)#8,042
24.Georgetown23.8%19.1%(+4.71)#2418.1%(+5.71)#8,418
25.Bridgeville25.4%19.1%(+6.30)#2518.1%(+7.30)#8,877
26.Brookside26.8%19.1%(+7.73)#2618.1%(+8.73)#9,217
27.Edgemoor27.6%19.1%(+8.58)#2718.1%(+9.58)#9,434
28.Milton28.0%19.1%(+8.98)#2818.1%(+9.98)#9,533
29.Seaford28.3%19.1%(+9.22)#2918.1%(+10.2)#9,580
30.Blades29.6%19.1%(+10.6)#3018.1%(+11.6)#9,926
31.Cheswold29.9%19.1%(+10.9)#3118.1%(+11.9)#9,992
32.Dover30.1%19.1%(+11.0)#3218.1%(+12.0)#10,049
33.Kent Acres34.6%19.1%(+15.6)#3318.1%(+16.6)#10,993
34.Long Neck36.1%19.1%(+17.0)#3418.1%(+18.0)#11,267
35.Wyoming38.5%19.1%(+19.5)#3518.1%(+20.5)#11,700
36.Rodney Village46.1%19.1%(+27.0)#3618.1%(+28.0)#12,819
37.Magnolia50.0%19.1%(+30.9)#3718.1%(+31.9)#13,366
38.Elsmere50.6%19.1%(+31.5)#3818.1%(+32.5)#13,471
39.Wilmington52.4%19.1%(+33.3)#3918.1%(+34.3)#13,639
40.Laurel68.0%19.1%(+48.9)#4018.1%(+49.9)#14,932
41.Little Creek81.8%19.1%(+62.8)#4118.1%(+63.8)#15,559
42.Rehoboth Beach100.0%19.1%(+80.9)#4218.1%(+81.9)#16,026

Common Questions

What are the Top 10 Cities with the Lowest Poverty Level Among Children Under the Age of 5 in Delaware?
Top 10 Cities with the Lowest Poverty Level Among Children Under the Age of 5 in Delaware are:
#1
0.0%
#2
0.0%
#3
0.0%
#4
0.0%
#5
0.0%
#6
0.0%
#7
0.0%
#8
0.0%
#9
0.0%
#10
0.0%
What city has the Lowest Poverty Level Among Children Under the Age of 5 in Delaware?
Frederica has the Lowest Poverty Level Among Children Under the Age of 5 in Delaware with 2.4%.
What is the Poverty Level Among Children Under the Age of 5 in the State of Delaware?
Poverty Level Among Children Under the Age of 5 in Delaware is 19.1%.
What is the Poverty Level Among Children Under the Age of 5 in the United States?
Poverty Level Among Children Under the Age of 5 in the United States is 18.1%.