Cities with the Lowest Poverty Level Among Children Under the Age of 5 in Virginia
RELATED REPORTS & OPTIONS
Lowest Poverty | Child 0-5
Virginia
Compare Cities
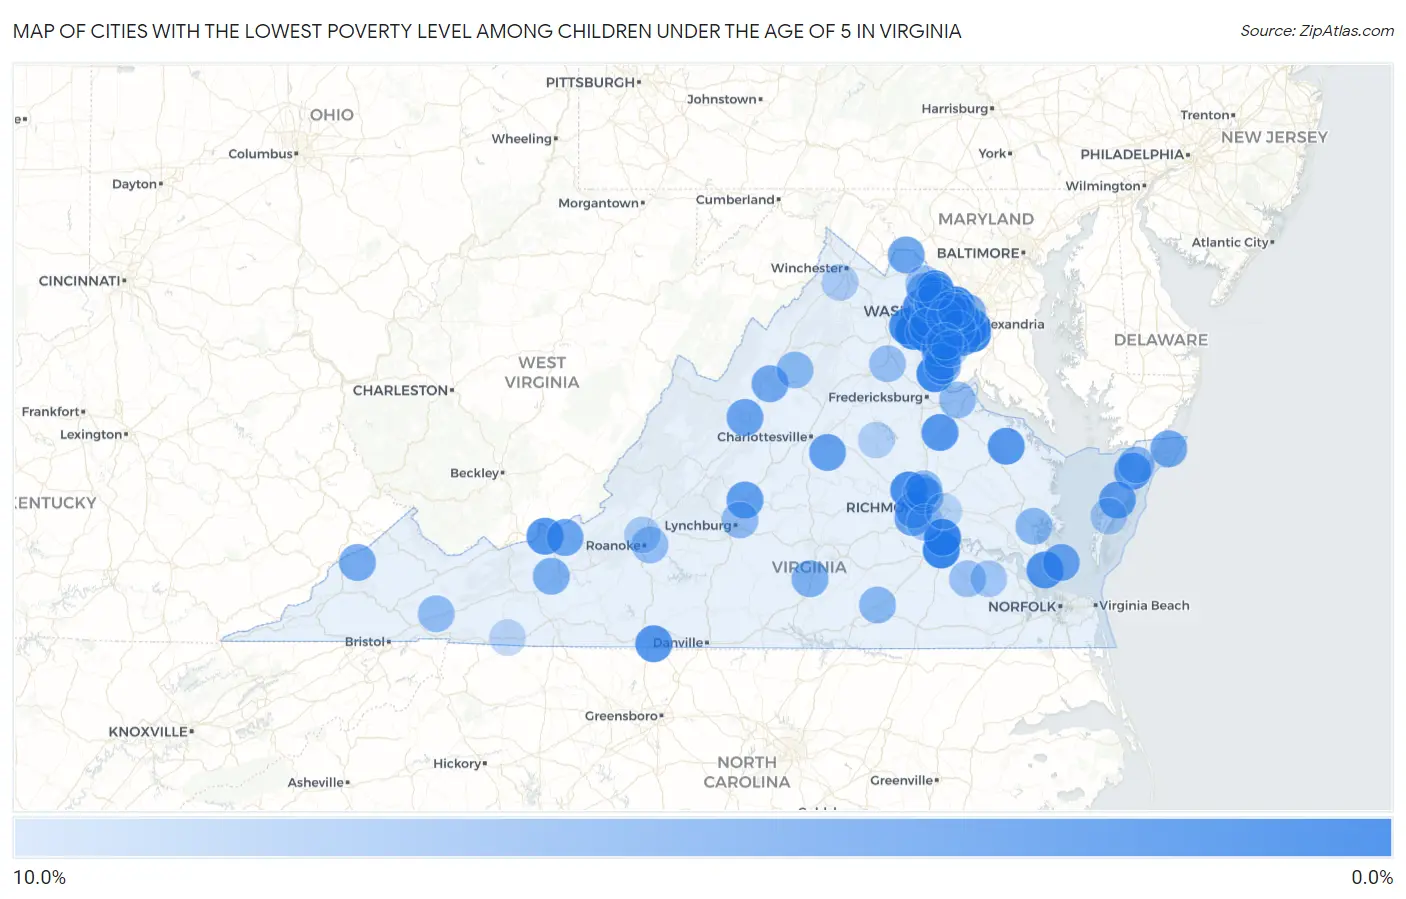
Map of Cities with the Lowest Poverty Level Among Children Under the Age of 5 in Virginia
10.0%
0.0%
Cities with the Lowest Poverty Level Among Children Under the Age of 5 in Virginia
| City | Child Poverty | vs State | vs National | |
| 1. | Sudley | 0.31% | 13.9%(-13.6)#1 | 18.1%(-17.8)#6 |
| 2. | Oakton | 0.37% | 13.9%(-13.5)#2 | 18.1%(-17.7)#11 |
| 3. | Fort Lee | 0.41% | 13.9%(-13.5)#3 | 18.1%(-17.6)#14 |
| 4. | Enon | 0.50% | 13.9%(-13.4)#4 | 18.1%(-17.6)#21 |
| 5. | Fort Hunt | 0.50% | 13.9%(-13.4)#5 | 18.1%(-17.6)#22 |
| 6. | Linton Hall | 0.53% | 13.9%(-13.4)#6 | 18.1%(-17.5)#24 |
| 7. | Newington Forest | 0.59% | 13.9%(-13.3)#7 | 18.1%(-17.5)#29 |
| 8. | Wolf Trap | 0.64% | 13.9%(-13.2)#8 | 18.1%(-17.4)#34 |
| 9. | Burke | 0.67% | 13.9%(-13.2)#9 | 18.1%(-17.4)#41 |
| 10. | Aquia Harbour | 0.85% | 13.9%(-13.0)#10 | 18.1%(-17.2)#70 |
| 11. | Cascades | 1.0% | 13.9%(-12.8)#11 | 18.1%(-17.0)#110 |
| 12. | Newington | 1.2% | 13.9%(-12.7)#12 | 18.1%(-16.9)#132 |
| 13. | Dranesville | 1.3% | 13.9%(-12.6)#13 | 18.1%(-16.7)#160 |
| 14. | Mclean | 1.4% | 13.9%(-12.5)#14 | 18.1%(-16.7)#171 |
| 15. | Gainesville | 1.7% | 13.9%(-12.2)#15 | 18.1%(-16.3)#258 |
| 16. | Short Pump | 1.8% | 13.9%(-12.1)#16 | 18.1%(-16.3)#278 |
| 17. | South Riding | 1.8% | 13.9%(-12.1)#17 | 18.1%(-16.2)#291 |
| 18. | Midlothian | 2.1% | 13.9%(-11.8)#18 | 18.1%(-16.0)#366 |
| 19. | Buckhall | 2.3% | 13.9%(-11.6)#19 | 18.1%(-15.8)#443 |
| 20. | Bethel Manor | 2.3% | 13.9%(-11.6)#20 | 18.1%(-15.7)#449 |
| 21. | Kingstowne | 2.3% | 13.9%(-11.5)#21 | 18.1%(-15.7)#459 |
| 22. | Belle Haven | 2.4% | 13.9%(-11.5)#22 | 18.1%(-15.7)#478 |
| 23. | Narrows | 2.5% | 13.9%(-11.4)#23 | 18.1%(-15.6)#494 |
| 24. | Ridgeway | 2.5% | 13.9%(-11.4)#24 | 18.1%(-15.5)#511 |
| 25. | West Springfield | 2.7% | 13.9%(-11.2)#25 | 18.1%(-15.4)#574 |
| 26. | Bowling Green | 2.7% | 13.9%(-11.2)#26 | 18.1%(-15.4)#578 |
| 27. | Warsaw | 2.7% | 13.9%(-11.2)#27 | 18.1%(-15.3)#587 |
| 28. | Parksley | 3.0% | 13.9%(-10.9)#28 | 18.1%(-15.0)#720 |
| 29. | Painter | 3.3% | 13.9%(-10.6)#29 | 18.1%(-14.7)#847 |
| 30. | West Falls Church | 3.4% | 13.9%(-10.5)#30 | 18.1%(-14.7)#860 |
| 31. | Amherst | 3.5% | 13.9%(-10.4)#31 | 18.1%(-14.6)#899 |
| 32. | Leesylvania | 3.5% | 13.9%(-10.4)#32 | 18.1%(-14.6)#917 |
| 33. | Laurel Hill | 3.7% | 13.9%(-10.2)#33 | 18.1%(-14.4)#980 |
| 34. | North Springfield | 3.7% | 13.9%(-10.1)#34 | 18.1%(-14.3)#1,026 |
| 35. | Sterling | 3.8% | 13.9%(-10.1)#35 | 18.1%(-14.2)#1,048 |
| 36. | Lake Monticello | 3.9% | 13.9%(-9.95)#36 | 18.1%(-14.1)#1,106 |
| 37. | Poquoson | 4.0% | 13.9%(-9.92)#37 | 18.1%(-14.1)#1,120 |
| 38. | Rockwood | 4.2% | 13.9%(-9.68)#38 | 18.1%(-13.9)#1,223 |
| 39. | Reston | 4.2% | 13.9%(-9.64)#39 | 18.1%(-13.8)#1,230 |
| 40. | Staunton | 4.2% | 13.9%(-9.64)#40 | 18.1%(-13.8)#1,231 |
| 41. | Groveton | 4.3% | 13.9%(-9.61)#41 | 18.1%(-13.8)#1,244 |
| 42. | Pembroke | 4.3% | 13.9%(-9.60)#42 | 18.1%(-13.8)#1,249 |
| 43. | Lovettsville | 4.4% | 13.9%(-9.50)#43 | 18.1%(-13.7)#1,286 |
| 44. | Fair Oaks | 4.4% | 13.9%(-9.50)#44 | 18.1%(-13.7)#1,288 |
| 45. | Burke Centre | 4.4% | 13.9%(-9.44)#45 | 18.1%(-13.6)#1,316 |
| 46. | Fort Belvoir | 4.5% | 13.9%(-9.39)#46 | 18.1%(-13.6)#1,331 |
| 47. | Massanetta Springs | 4.7% | 13.9%(-9.19)#47 | 18.1%(-13.4)#1,419 |
| 48. | Bon Air | 4.7% | 13.9%(-9.17)#48 | 18.1%(-13.3)#1,424 |
| 49. | Manassas Park | 4.7% | 13.9%(-9.17)#49 | 18.1%(-13.3)#1,430 |
| 50. | Chincoteague | 4.8% | 13.9%(-9.10)#50 | 18.1%(-13.3)#1,481 |
| 51. | Kings Park West | 4.9% | 13.9%(-9.03)#51 | 18.1%(-13.2)#1,508 |
| 52. | Fair Lakes | 5.0% | 13.9%(-8.91)#52 | 18.1%(-13.1)#1,561 |
| 53. | Clintwood | 5.1% | 13.9%(-8.80)#53 | 18.1%(-13.0)#1,611 |
| 54. | Montclair | 5.1% | 13.9%(-8.78)#54 | 18.1%(-13.0)#1,618 |
| 55. | Manassas | 5.2% | 13.9%(-8.67)#55 | 18.1%(-12.8)#1,667 |
| 56. | Pulaski | 5.6% | 13.9%(-8.33)#56 | 18.1%(-12.5)#1,797 |
| 57. | Arlington | 5.6% | 13.9%(-8.29)#57 | 18.1%(-12.5)#1,832 |
| 58. | Centreville | 5.6% | 13.9%(-8.25)#58 | 18.1%(-12.4)#1,853 |
| 59. | Keysville | 5.7% | 13.9%(-8.17)#59 | 18.1%(-12.3)#1,890 |
| 60. | Potomac Mills | 5.8% | 13.9%(-8.11)#60 | 18.1%(-12.3)#1,908 |
| 61. | Quantico Base | 5.9% | 13.9%(-7.96)#61 | 18.1%(-12.1)#1,961 |
| 62. | Lakeside | 6.0% | 13.9%(-7.88)#62 | 18.1%(-12.1)#1,989 |
| 63. | Dale City | 6.1% | 13.9%(-7.78)#63 | 18.1%(-12.0)#2,025 |
| 64. | Ashburn | 6.1% | 13.9%(-7.77)#64 | 18.1%(-11.9)#2,026 |
| 65. | Floris | 6.4% | 13.9%(-7.49)#65 | 18.1%(-11.7)#2,152 |
| 66. | Bloxom | 6.5% | 13.9%(-7.44)#66 | 18.1%(-11.6)#2,174 |
| 67. | Mcnair | 6.5% | 13.9%(-7.35)#67 | 18.1%(-11.5)#2,207 |
| 68. | Shenandoah | 6.6% | 13.9%(-7.31)#68 | 18.1%(-11.5)#2,223 |
| 69. | Gloucester Courthouse | 6.7% | 13.9%(-7.22)#69 | 18.1%(-11.4)#2,247 |
| 70. | Alberta | 6.7% | 13.9%(-7.22)#70 | 18.1%(-11.4)#2,272 |
| 71. | Laurel | 6.8% | 13.9%(-7.07)#71 | 18.1%(-11.2)#2,338 |
| 72. | Lake Barcroft | 6.8% | 13.9%(-7.06)#72 | 18.1%(-11.2)#2,340 |
| 73. | Triangle | 6.8% | 13.9%(-7.04)#73 | 18.1%(-11.2)#2,347 |
| 74. | Madison Heights | 7.1% | 13.9%(-6.78)#74 | 18.1%(-11.0)#2,462 |
| 75. | King George | 7.1% | 13.9%(-6.76)#75 | 18.1%(-10.9)#2,468 |
| 76. | Glade Spring | 7.2% | 13.9%(-6.71)#76 | 18.1%(-10.9)#2,509 |
| 77. | Merrifield | 7.2% | 13.9%(-6.64)#77 | 18.1%(-10.8)#2,525 |
| 78. | Glen Allen | 7.3% | 13.9%(-6.59)#78 | 18.1%(-10.8)#2,549 |
| 79. | Herndon | 7.3% | 13.9%(-6.55)#79 | 18.1%(-10.7)#2,568 |
| 80. | Tysons | 7.3% | 13.9%(-6.54)#80 | 18.1%(-10.7)#2,570 |
| 81. | Vinton | 7.5% | 13.9%(-6.43)#81 | 18.1%(-10.6)#2,615 |
| 82. | Remington | 7.5% | 13.9%(-6.36)#82 | 18.1%(-10.5)#2,646 |
| 83. | Vienna | 7.8% | 13.9%(-6.09)#83 | 18.1%(-10.3)#2,766 |
| 84. | Yorkshire | 7.9% | 13.9%(-5.97)#84 | 18.1%(-10.1)#2,803 |
| 85. | Waverly | 8.0% | 13.9%(-5.91)#85 | 18.1%(-10.1)#2,821 |
| 86. | Lansdowne | 8.1% | 13.9%(-5.76)#86 | 18.1%(-9.94)#2,880 |
| 87. | Dendron | 8.3% | 13.9%(-5.55)#87 | 18.1%(-9.73)#2,984 |
| 88. | Springfield | 8.5% | 13.9%(-5.37)#88 | 18.1%(-9.55)#3,050 |
| 89. | Nassawadox | 8.6% | 13.9%(-5.32)#89 | 18.1%(-9.49)#3,075 |
| 90. | Fairfax | 8.8% | 13.9%(-5.12)#90 | 18.1%(-9.30)#3,156 |
| 91. | Woodbridge | 8.8% | 13.9%(-5.11)#91 | 18.1%(-9.29)#3,163 |
| 92. | Hollins | 8.8% | 13.9%(-5.08)#92 | 18.1%(-9.25)#3,174 |
| 93. | Meadowbrook | 8.9% | 13.9%(-4.98)#93 | 18.1%(-9.15)#3,213 |
| 94. | Idylwood | 9.0% | 13.9%(-4.91)#94 | 18.1%(-9.08)#3,237 |
| 95. | Stephens City | 9.1% | 13.9%(-4.80)#95 | 18.1%(-8.97)#3,273 |
| 96. | Mineral | 9.5% | 13.9%(-4.43)#96 | 18.1%(-8.60)#3,442 |
| 97. | Sandston | 9.9% | 13.9%(-4.03)#97 | 18.1%(-8.20)#3,591 |
| 98. | Sugarland Run | 9.9% | 13.9%(-4.00)#98 | 18.1%(-8.17)#3,599 |
| 99. | Lake Ridge | 10.0% | 13.9%(-3.93)#99 | 18.1%(-8.11)#3,615 |
| 100. | Independence | 10.0% | 13.9%(-3.89)#100 | 18.1%(-8.06)#3,639 |
Common Questions
What are the Top 10 Cities with the Lowest Poverty Level Among Children Under the Age of 5 in Virginia?
Top 10 Cities with the Lowest Poverty Level Among Children Under the Age of 5 in Virginia are:
#1
0.31%
#2
0.37%
#3
0.41%
#4
0.50%
#5
0.50%
#6
0.53%
#7
0.59%
#8
0.64%
#9
0.67%
#10
0.85%
What city has the Lowest Poverty Level Among Children Under the Age of 5 in Virginia?
Sudley has the Lowest Poverty Level Among Children Under the Age of 5 in Virginia with 0.31%.
What is the Poverty Level Among Children Under the Age of 5 in the State of Virginia?
Poverty Level Among Children Under the Age of 5 in Virginia is 13.9%.
What is the Poverty Level Among Children Under the Age of 5 in the United States?
Poverty Level Among Children Under the Age of 5 in the United States is 18.1%.