Orting, WA Map & Demographics
Orting Map
Orting Overview
$41,701
PER CAPITA INCOME
$108,879
AVG FAMILY INCOME
$114,458
AVG HOUSEHOLD INCOME
46.4%
WAGE / INCOME GAP [ % ]
53.6¢/ $1
WAGE / INCOME GAP [ $ ]
$12,231
FAMILY INCOME DEFICIT
0.31
INEQUALITY / GINI INDEX
8,898
TOTAL POPULATION
4,283
MALE POPULATION
4,615
FEMALE POPULATION
92.81
MALES / 100 FEMALES
107.75
FEMALES / 100 MALES
34.1
MEDIAN AGE
3.2
AVG FAMILY SIZE
3.0
AVG HOUSEHOLD SIZE
4,756
LABOR FORCE [ PEOPLE ]
69.4%
PERCENT IN LABOR FORCE
3.9%
UNEMPLOYMENT RATE
Orting Zip Codes
Orting Area Codes
Income in Orting
Income Overview in Orting
Per Capita Income in Orting is $41,701, while median incomes of families and households are $108,879 and $114,458 respectively.
| Characteristic | Number | Measure |
| Per Capita Income | 8,898 | $41,701 |
| Median Family Income | 2,310 | $108,879 |
| Mean Family Income | 2,310 | $123,946 |
| Median Household Income | 2,869 | $114,458 |
| Mean Household Income | 2,869 | $126,201 |
| Income Deficit | 2,310 | $12,231 |
| Wage / Income Gap (%) | 8,898 | 46.43% |
| Wage / Income Gap ($) | 8,898 | 53.57¢ per $1 |
| Gini / Inequality Index | 8,898 | 0.31 |
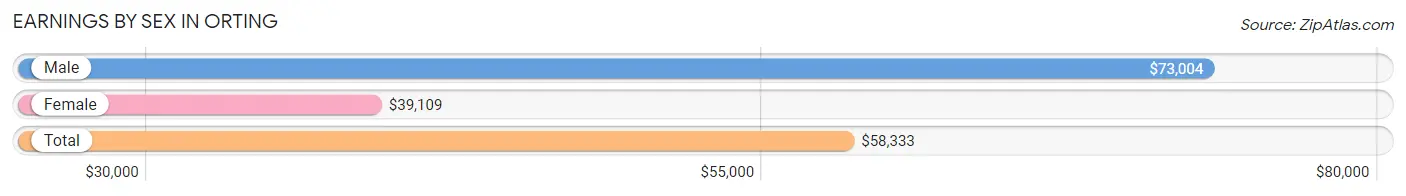
Earnings by Sex in Orting
Average Earnings in Orting are $58,333, $73,004 for men and $39,109 for women, a difference of 46.4%.
| Sex | Number | Average Earnings |
| Male | 2,592 (53.3%) | $73,004 |
| Female | 2,270 (46.7%) | $39,109 |
| Total | 4,862 (100.0%) | $58,333 |
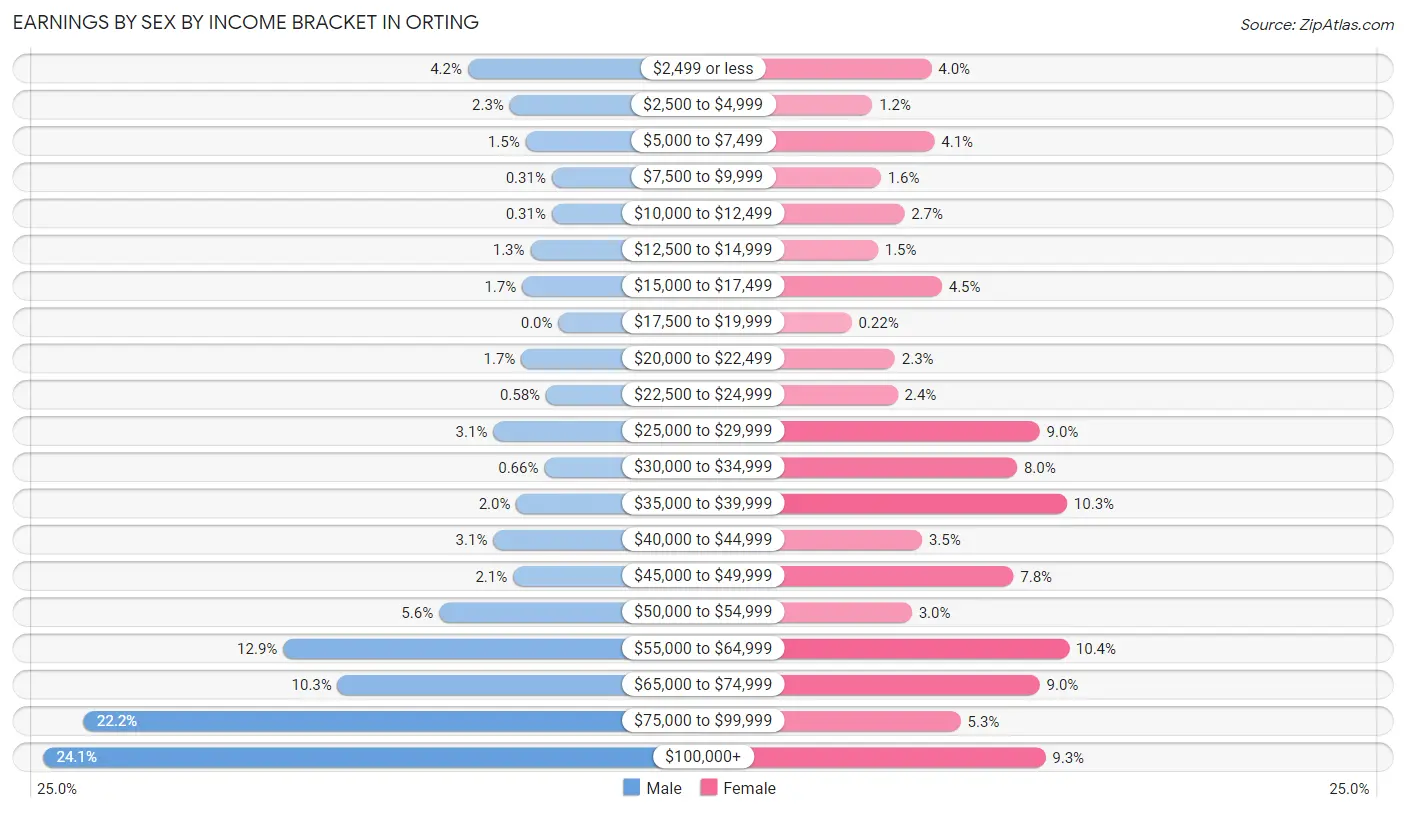
Earnings by Sex by Income Bracket in Orting
The most common earnings brackets in Orting are $100,000+ for men (625 | 24.1%) and $55,000 to $64,999 for women (236 | 10.4%).
| Income | Male | Female |
| $2,499 or less | 110 (4.2%) | 90 (4.0%) |
| $2,500 to $4,999 | 59 (2.3%) | 27 (1.2%) |
| $5,000 to $7,499 | 40 (1.5%) | 93 (4.1%) |
| $7,500 to $9,999 | 8 (0.3%) | 36 (1.6%) |
| $10,000 to $12,499 | 8 (0.3%) | 61 (2.7%) |
| $12,500 to $14,999 | 34 (1.3%) | 33 (1.5%) |
| $15,000 to $17,499 | 44 (1.7%) | 101 (4.4%) |
| $17,500 to $19,999 | 0 (0.0%) | 5 (0.2%) |
| $20,000 to $22,499 | 45 (1.7%) | 51 (2.2%) |
| $22,500 to $24,999 | 15 (0.6%) | 54 (2.4%) |
| $25,000 to $29,999 | 79 (3.0%) | 205 (9.0%) |
| $30,000 to $34,999 | 17 (0.7%) | 181 (8.0%) |
| $35,000 to $39,999 | 51 (2.0%) | 234 (10.3%) |
| $40,000 to $44,999 | 79 (3.0%) | 80 (3.5%) |
| $45,000 to $49,999 | 55 (2.1%) | 177 (7.8%) |
| $50,000 to $54,999 | 145 (5.6%) | 69 (3.0%) |
| $55,000 to $64,999 | 334 (12.9%) | 236 (10.4%) |
| $65,000 to $74,999 | 268 (10.3%) | 205 (9.0%) |
| $75,000 to $99,999 | 576 (22.2%) | 121 (5.3%) |
| $100,000+ | 625 (24.1%) | 211 (9.3%) |
| Total | 2,592 (100.0%) | 2,270 (100.0%) |
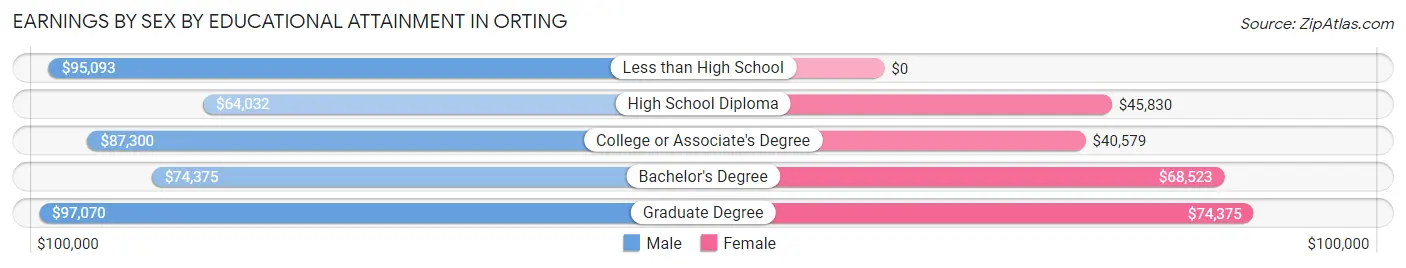
Earnings by Sex by Educational Attainment in Orting
Average earnings in Orting are $75,960 for men and $46,746 for women, a difference of 38.5%. Men with an educational attainment of graduate degree enjoy the highest average annual earnings of $97,070, while those with high school diploma education earn the least with $64,032. Women with an educational attainment of graduate degree earn the most with the average annual earnings of $74,375, while those with college or associate's degree education have the smallest earnings of $40,579.
| Educational Attainment | Male Income | Female Income |
| Less than High School | $95,093 | $0 |
| High School Diploma | $64,032 | $45,830 |
| College or Associate's Degree | $87,300 | $40,579 |
| Bachelor's Degree | $74,375 | $68,523 |
| Graduate Degree | $97,070 | $74,375 |
| Total | $75,960 | $46,746 |
Family Income in Orting
Family Income Brackets in Orting
According to the Orting family income data, there are 686 families falling into the $100,000 to $149,999 income range, which is the most common income bracket and makes up 29.7% of all families. Conversely, the $10,000 to $14,999 income bracket is the least frequent group with only 25 families (1.1%) belonging to this category.
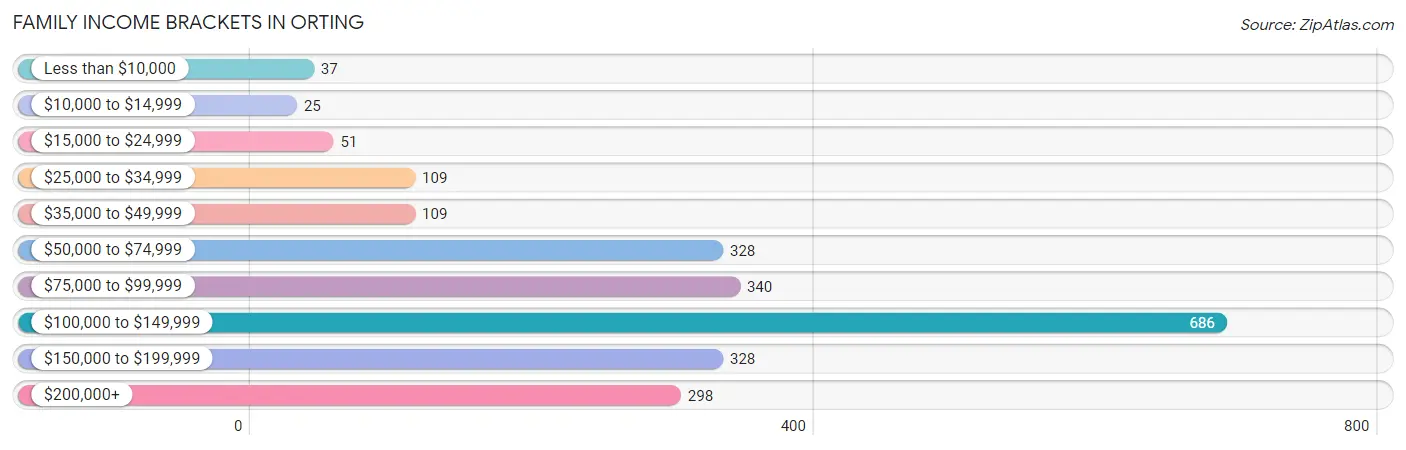
| Income Bracket | # Families | % Families |
| Less than $10,000 | 37 | 1.6% |
| $10,000 to $14,999 | 25 | 1.1% |
| $15,000 to $24,999 | 51 | 2.2% |
| $25,000 to $34,999 | 109 | 4.7% |
| $35,000 to $49,999 | 109 | 4.7% |
| $50,000 to $74,999 | 328 | 14.2% |
| $75,000 to $99,999 | 340 | 14.7% |
| $100,000 to $149,999 | 686 | 29.7% |
| $150,000 to $199,999 | 328 | 14.2% |
| $200,000+ | 298 | 12.9% |
Family Income by Famaliy Size in Orting
6-person families (93 | 4.0%) account for the highest median family income in Orting with $184,519 per family, while 2-person families (734 | 31.8%) have the highest median income of $45,090 per family member.
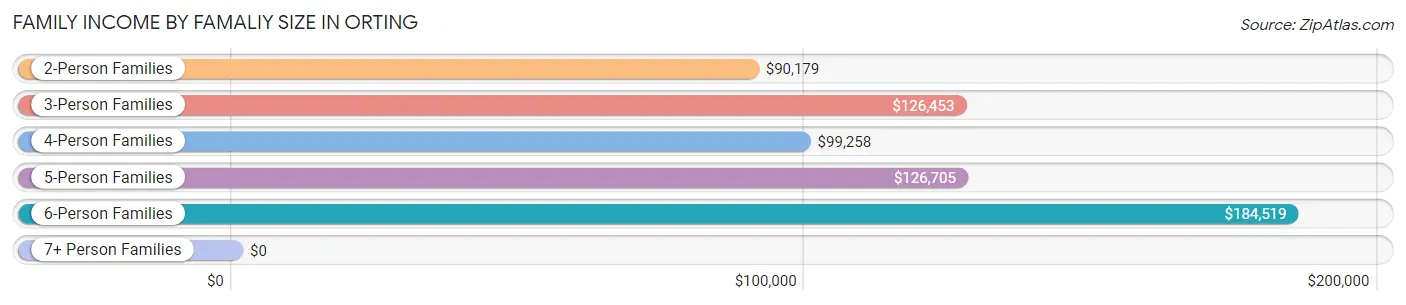
| Income Bracket | # Families | Median Income |
| 2-Person Families | 734 (31.8%) | $90,179 |
| 3-Person Families | 749 (32.4%) | $126,453 |
| 4-Person Families | 485 (21.0%) | $99,258 |
| 5-Person Families | 234 (10.1%) | $126,705 |
| 6-Person Families | 93 (4.0%) | $184,519 |
| 7+ Person Families | 15 (0.6%) | $0 |
| Total | 2,310 (100.0%) | $108,879 |
Family Income by Number of Earners in Orting
The median family income in Orting is $108,879, with families comprising 3+ earners (407) having the highest median family income of $199,279, while families with 1 earner (662) have the lowest median family income of $64,620, accounting for 17.6% and 28.7% of families, respectively.
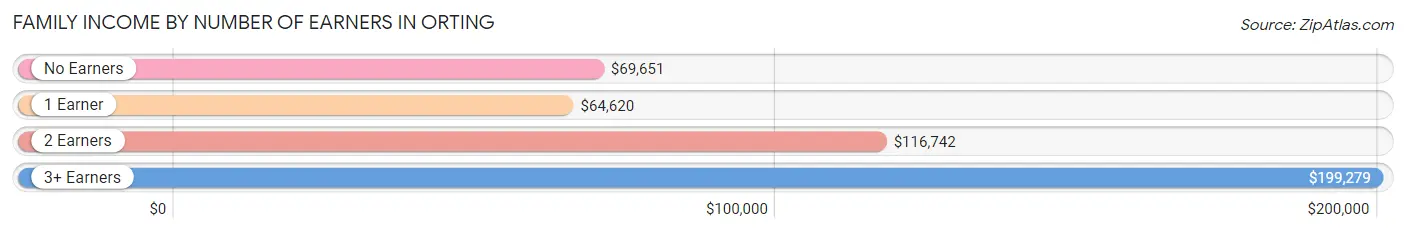
| Number of Earners | # Families | Median Income |
| No Earners | 276 (11.9%) | $69,651 |
| 1 Earner | 662 (28.7%) | $64,620 |
| 2 Earners | 965 (41.8%) | $116,742 |
| 3+ Earners | 407 (17.6%) | $199,279 |
| Total | 2,310 (100.0%) | $108,879 |
Household Income in Orting
Household Income Brackets in Orting
With 947 households falling in the category, the $100,000 to $149,999 income range is the most frequent in Orting, accounting for 33.0% of all households. In contrast, only 37 households (1.3%) fall into the $15,000 to $24,999 income bracket, making it the least populous group.
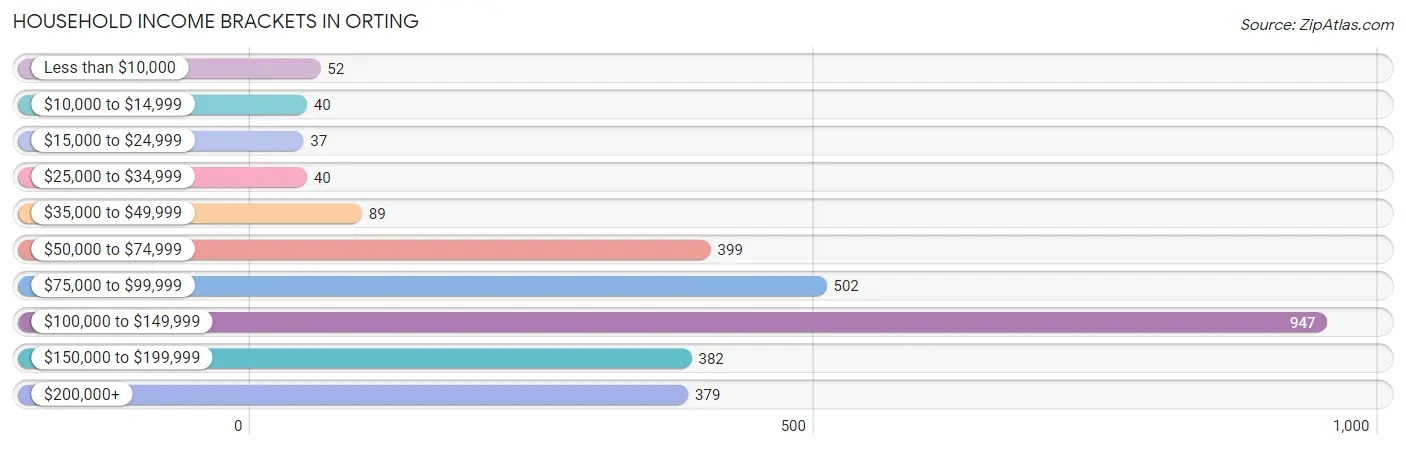
| Income Bracket | # Households | % Households |
| Less than $10,000 | 52 | 1.8% |
| $10,000 to $14,999 | 40 | 1.4% |
| $15,000 to $24,999 | 37 | 1.3% |
| $25,000 to $34,999 | 40 | 1.4% |
| $35,000 to $49,999 | 89 | 3.1% |
| $50,000 to $74,999 | 399 | 13.9% |
| $75,000 to $99,999 | 502 | 17.5% |
| $100,000 to $149,999 | 947 | 33.0% |
| $150,000 to $199,999 | 382 | 13.3% |
| $200,000+ | 379 | 13.2% |
Household Income by Householder Age in Orting
The median household income in Orting is $114,458, with the highest median household income of $122,610 found in the 25 to 44 years age bracket for the primary householder. A total of 1,261 households (44.0%) fall into this category. Meanwhile, the 15 to 24 years age bracket for the primary householder has the lowest median household income of $0, with 74 households (2.6%) in this group.
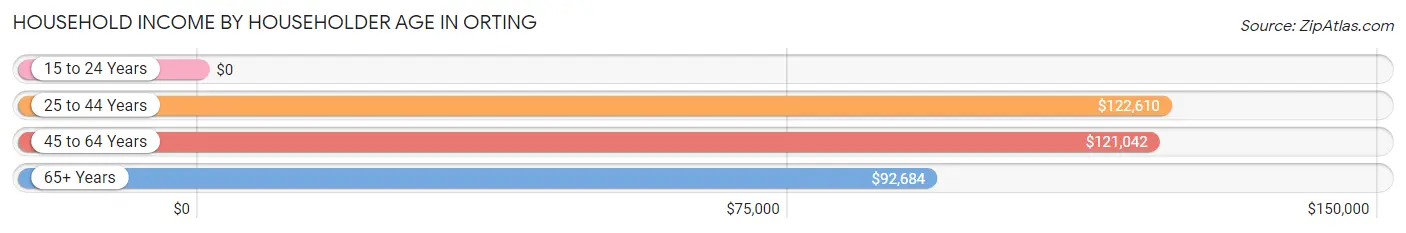
| Income Bracket | # Households | Median Income |
| 15 to 24 Years | 74 (2.6%) | $0 |
| 25 to 44 Years | 1,261 (44.0%) | $122,610 |
| 45 to 64 Years | 1,043 (36.3%) | $121,042 |
| 65+ Years | 491 (17.1%) | $92,684 |
| Total | 2,869 (100.0%) | $114,458 |
Poverty in Orting
Income Below Poverty by Sex and Age in Orting
With 4.1% poverty level for males and 7.3% for females among the residents of Orting, 16 and 17 year old males and 16 and 17 year old females are the most vulnerable to poverty, with 42 males (43.8%) and 22 females (16.9%) in their respective age groups living below the poverty level.
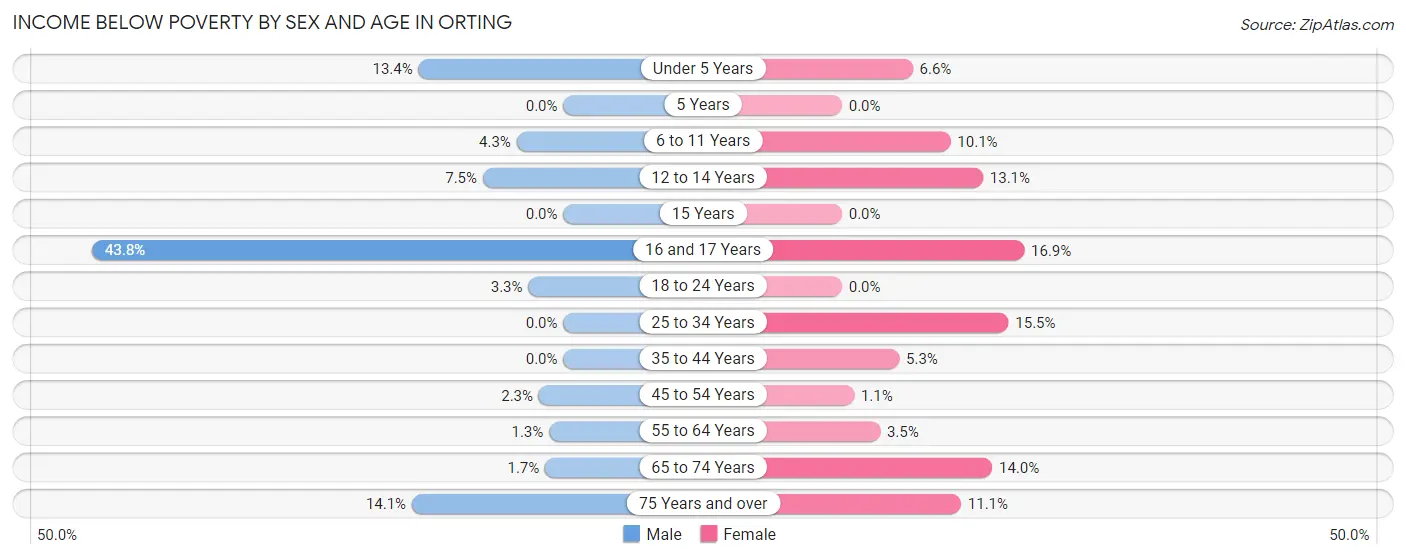
| Age Bracket | Male | Female |
| Under 5 Years | 43 (13.4%) | 26 (6.6%) |
| 5 Years | 0 (0.0%) | 0 (0.0%) |
| 6 to 11 Years | 11 (4.3%) | 38 (10.1%) |
| 12 to 14 Years | 13 (7.5%) | 25 (13.1%) |
| 15 Years | 0 (0.0%) | 0 (0.0%) |
| 16 and 17 Years | 42 (43.8%) | 22 (16.9%) |
| 18 to 24 Years | 15 (3.3%) | 0 (0.0%) |
| 25 to 34 Years | 0 (0.0%) | 111 (15.5%) |
| 35 to 44 Years | 0 (0.0%) | 37 (5.3%) |
| 45 to 54 Years | 14 (2.3%) | 8 (1.1%) |
| 55 to 64 Years | 5 (1.3%) | 11 (3.5%) |
| 65 to 74 Years | 4 (1.7%) | 30 (14.0%) |
| 75 Years and over | 26 (14.1%) | 20 (11.1%) |
| Total | 173 (4.1%) | 328 (7.3%) |
Income Above Poverty by Sex and Age in Orting
According to the poverty statistics in Orting, males aged 5 years and females aged 5 years are the age groups that are most secure financially, with 100.0% of males and 100.0% of females in these age groups living above the poverty line.
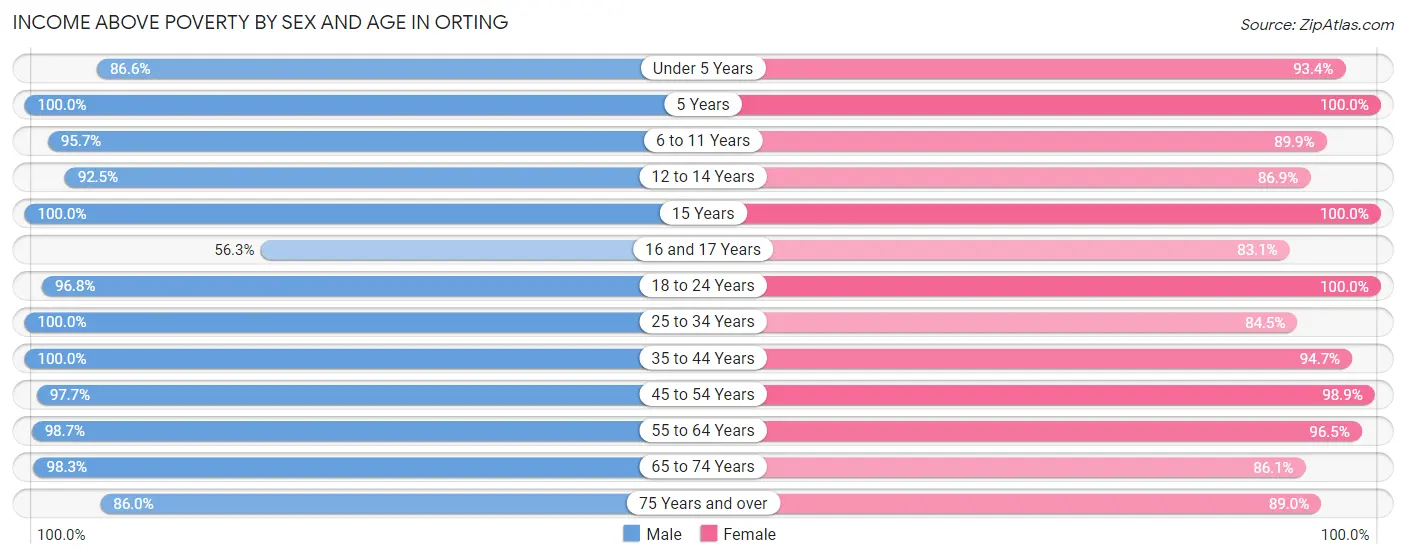
| Age Bracket | Male | Female |
| Under 5 Years | 277 (86.6%) | 370 (93.4%) |
| 5 Years | 45 (100.0%) | 103 (100.0%) |
| 6 to 11 Years | 243 (95.7%) | 339 (89.9%) |
| 12 to 14 Years | 161 (92.5%) | 166 (86.9%) |
| 15 Years | 89 (100.0%) | 79 (100.0%) |
| 16 and 17 Years | 54 (56.2%) | 108 (83.1%) |
| 18 to 24 Years | 446 (96.8%) | 395 (100.0%) |
| 25 to 34 Years | 854 (100.0%) | 607 (84.5%) |
| 35 to 44 Years | 527 (100.0%) | 659 (94.7%) |
| 45 to 54 Years | 602 (97.7%) | 702 (98.9%) |
| 55 to 64 Years | 374 (98.7%) | 300 (96.5%) |
| 65 to 74 Years | 232 (98.3%) | 185 (86.1%) |
| 75 Years and over | 159 (86.0%) | 161 (88.9%) |
| Total | 4,063 (95.9%) | 4,174 (92.7%) |
Income Below Poverty Among Married-Couple Families in Orting
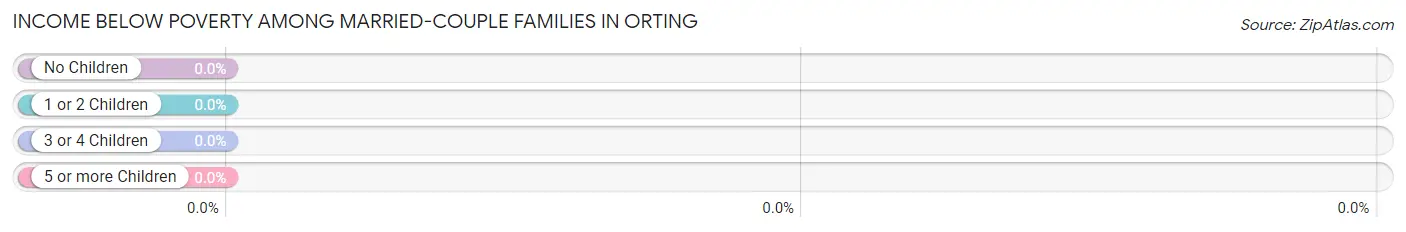
| Children | Above Poverty | Below Poverty |
| No Children | 872 (100.0%) | 0 (0.0%) |
| 1 or 2 Children | 706 (100.0%) | 0 (0.0%) |
| 3 or 4 Children | 134 (100.0%) | 0 (0.0%) |
| 5 or more Children | 0 (0.0%) | 0 (0.0%) |
| Total | 1,712 (100.0%) | 0 (0.0%) |
Income Below Poverty Among Single-Parent Households in Orting
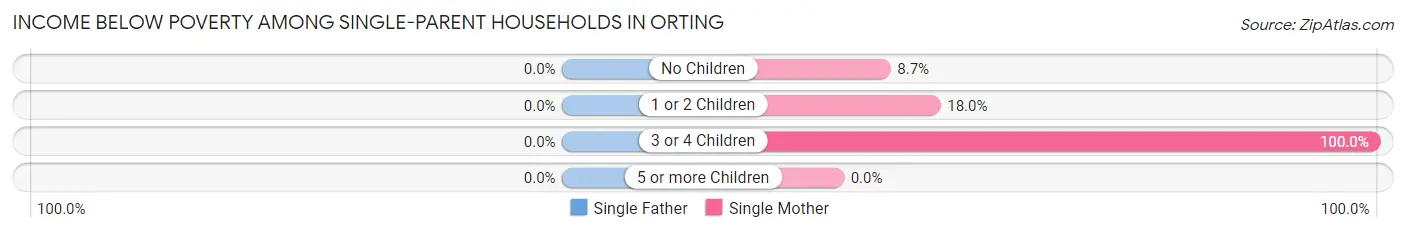
| Children | Single Father | Single Mother |
| No Children | 0 (0.0%) | 8 (8.7%) |
| 1 or 2 Children | 0 (0.0%) | 54 (18.0%) |
| 3 or 4 Children | 0 (0.0%) | 25 (100.0%) |
| 5 or more Children | 0 (0.0%) | 0 (0.0%) |
| Total | 0 (0.0%) | 87 (20.9%) |
Income Below Poverty Among Married-Couple vs Single-Parent Households in Orting
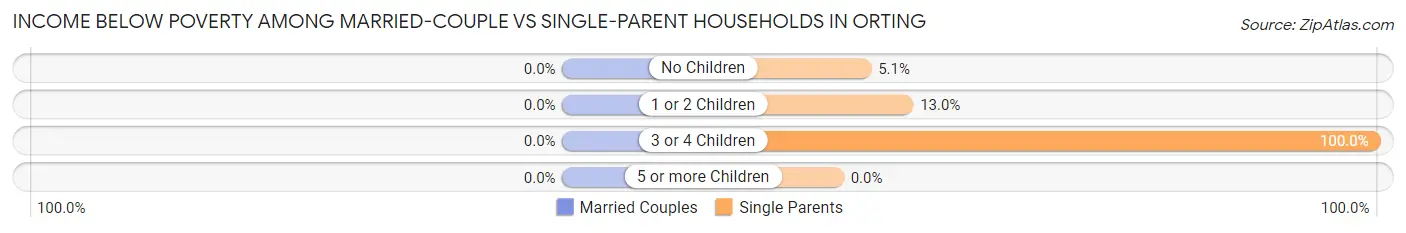
| Children | Married-Couple Families | Single-Parent Households |
| No Children | 0 (0.0%) | 8 (5.1%) |
| 1 or 2 Children | 0 (0.0%) | 54 (13.0%) |
| 3 or 4 Children | 0 (0.0%) | 25 (100.0%) |
| 5 or more Children | 0 (0.0%) | 0 (0.0%) |
| Total | 0 (0.0%) | 87 (14.5%) |
Race in Orting
The most populous races in Orting are White / Caucasian (7,335 | 82.4%), Two or more Races (936 | 10.5%), and Hispanic or Latino (769 | 8.6%).
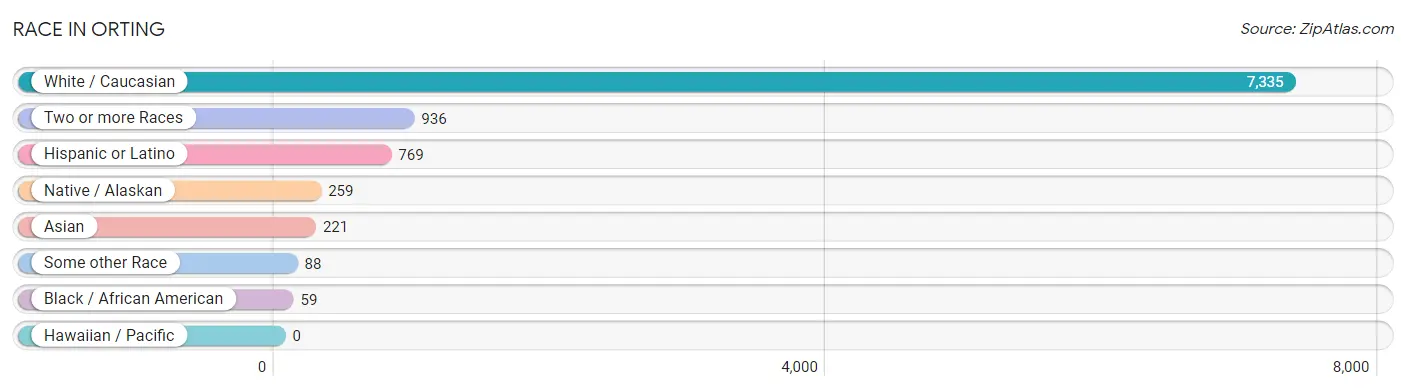
| Race | # Population | % Population |
| Asian | 221 | 2.5% |
| Black / African American | 59 | 0.7% |
| Hawaiian / Pacific | 0 | 0.0% |
| Hispanic or Latino | 769 | 8.6% |
| Native / Alaskan | 259 | 2.9% |
| White / Caucasian | 7,335 | 82.4% |
| Two or more Races | 936 | 10.5% |
| Some other Race | 88 | 1.0% |
| Total | 8,898 | 100.0% |
Ancestry in Orting
The most populous ancestries reported in Orting are German (2,389 | 26.9%), English (1,188 | 13.4%), Irish (1,048 | 11.8%), Mexican (576 | 6.5%), and Norwegian (376 | 4.2%), together accounting for 62.7% of all Orting residents.
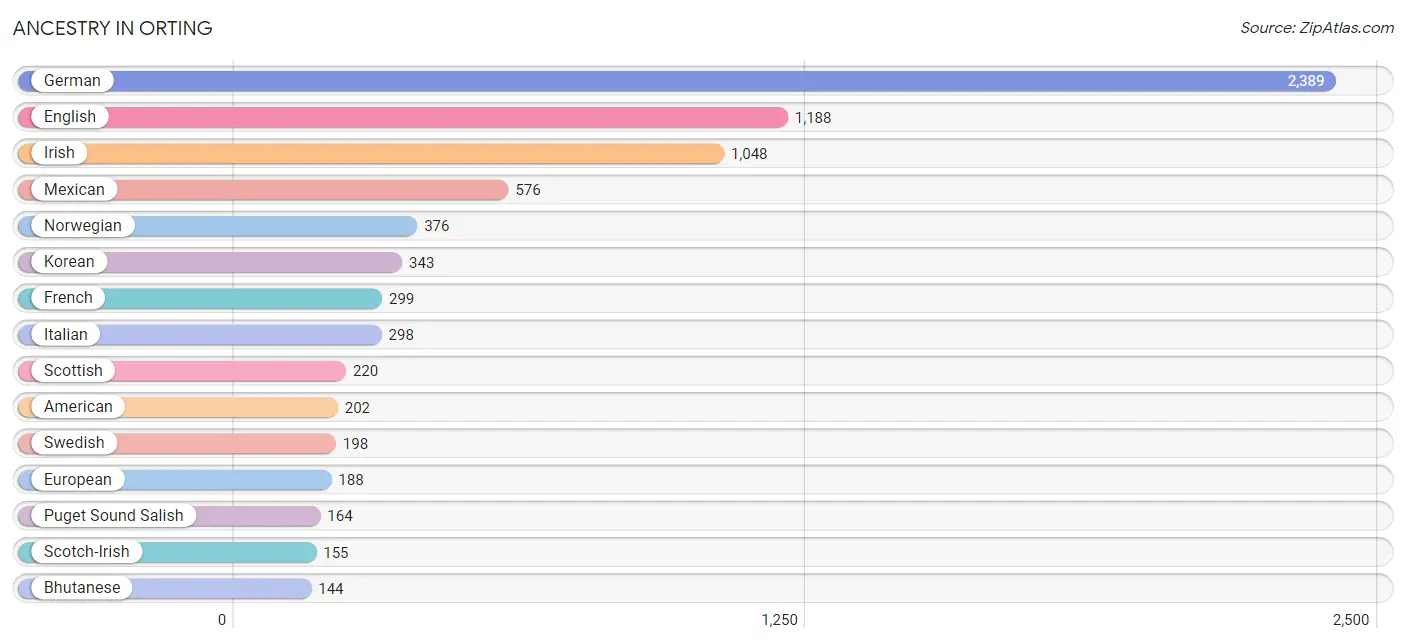
| Ancestry | # Population | % Population |
| American | 202 | 2.3% |
| Arab | 8 | 0.1% |
| Austrian | 44 | 0.5% |
| Bhutanese | 144 | 1.6% |
| British | 125 | 1.4% |
| Burmese | 109 | 1.2% |
| Canadian | 125 | 1.4% |
| Central American | 35 | 0.4% |
| Costa Rican | 8 | 0.1% |
| Cuban | 9 | 0.1% |
| Danish | 29 | 0.3% |
| Dutch | 73 | 0.8% |
| Eastern European | 47 | 0.5% |
| English | 1,188 | 13.4% |
| Ethiopian | 21 | 0.2% |
| European | 188 | 2.1% |
| Finnish | 27 | 0.3% |
| French | 299 | 3.4% |
| French Canadian | 32 | 0.4% |
| German | 2,389 | 26.9% |
| Indian (Asian) | 105 | 1.2% |
| Inupiat | 25 | 0.3% |
| Irish | 1,048 | 11.8% |
| Iroquois | 18 | 0.2% |
| Italian | 298 | 3.4% |
| Korean | 343 | 3.8% |
| Lebanese | 8 | 0.1% |
| Lithuanian | 7 | 0.1% |
| Mexican | 576 | 6.5% |
| Mexican American Indian | 18 | 0.2% |
| Native Hawaiian | 28 | 0.3% |
| Nicaraguan | 18 | 0.2% |
| Northern European | 36 | 0.4% |
| Norwegian | 376 | 4.2% |
| Osage | 105 | 1.2% |
| Pakistani | 60 | 0.7% |
| Peruvian | 85 | 1.0% |
| Polish | 135 | 1.5% |
| Puerto Rican | 41 | 0.5% |
| Puget Sound Salish | 164 | 1.8% |
| Russian | 132 | 1.5% |
| Salvadoran | 9 | 0.1% |
| Scandinavian | 82 | 0.9% |
| Scotch-Irish | 155 | 1.7% |
| Scottish | 220 | 2.5% |
| Sioux | 13 | 0.2% |
| South American | 85 | 1.0% |
| Sri Lankan | 101 | 1.1% |
| Subsaharan African | 21 | 0.2% |
| Swedish | 198 | 2.2% |
| Ukrainian | 16 | 0.2% |
| Welsh | 25 | 0.3% |
| Yakama | 100 | 1.1% | View All 53 Rows |
Immigrants in Orting
The most numerous immigrant groups reported in Orting came from Asia (110 | 1.2%), Latin America (105 | 1.2%), South Eastern Asia (95 | 1.1%), Central America (78 | 0.9%), and Mexico (75 | 0.8%), together accounting for 5.2% of all Orting residents.
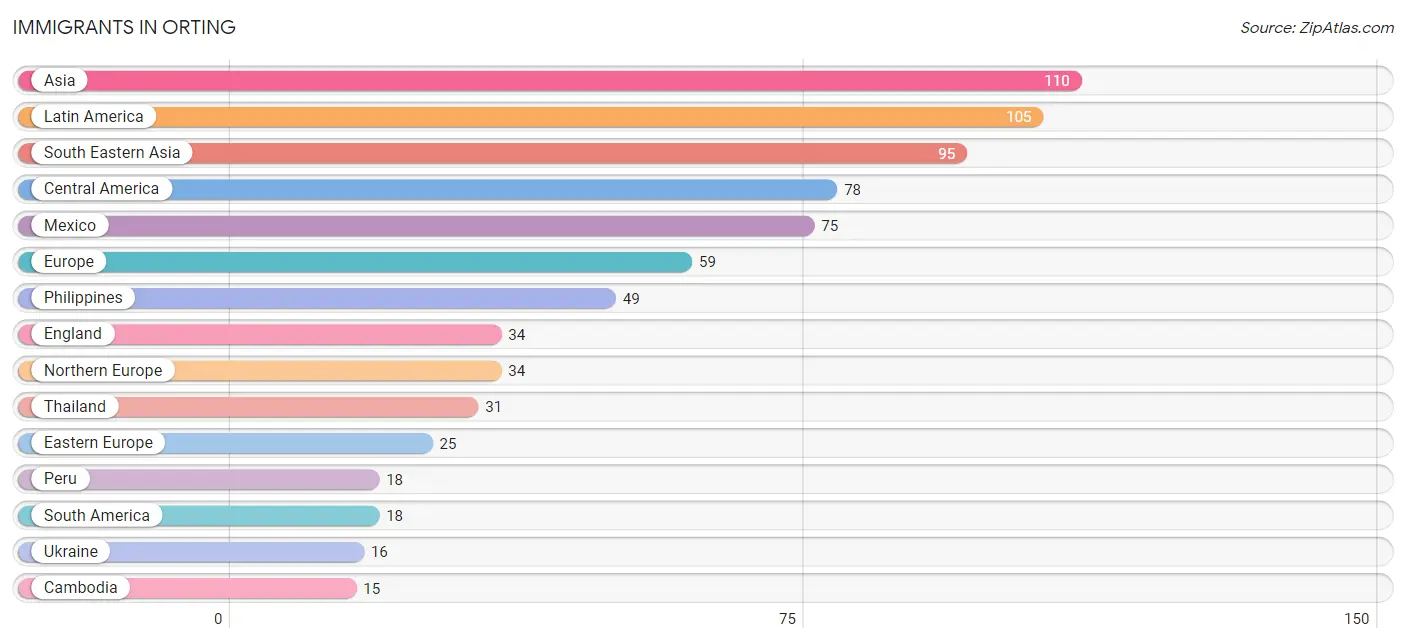
| Immigration Origin | # Population | % Population |
| Asia | 110 | 1.2% |
| Cambodia | 15 | 0.2% |
| Canada | 10 | 0.1% |
| Caribbean | 9 | 0.1% |
| Central America | 78 | 0.9% |
| China | 15 | 0.2% |
| Cuba | 9 | 0.1% |
| Eastern Asia | 15 | 0.2% |
| Eastern Europe | 25 | 0.3% |
| England | 34 | 0.4% |
| Europe | 59 | 0.7% |
| Latin America | 105 | 1.2% |
| Mexico | 75 | 0.8% |
| Northern Europe | 34 | 0.4% |
| Panama | 3 | 0.0% |
| Peru | 18 | 0.2% |
| Philippines | 49 | 0.5% |
| Poland | 9 | 0.1% |
| South America | 18 | 0.2% |
| South Eastern Asia | 95 | 1.1% |
| Taiwan | 7 | 0.1% |
| Thailand | 31 | 0.4% |
| Ukraine | 16 | 0.2% | View All 23 Rows |
Sex and Age in Orting
Sex and Age in Orting
The most populous age groups in Orting are 30 to 34 Years (481 | 11.2%) for men and 50 to 54 Years (431 | 9.3%) for women.
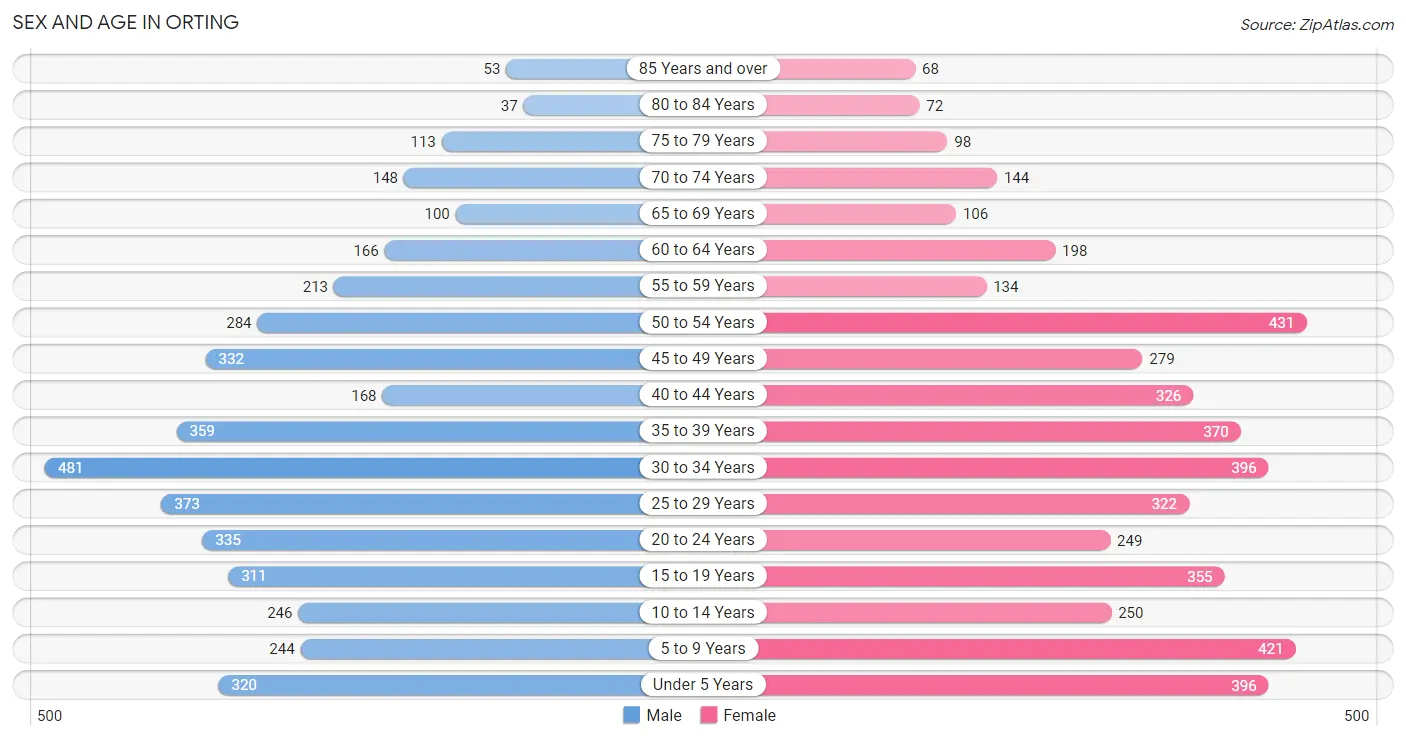
| Age Bracket | Male | Female |
| Under 5 Years | 320 (7.5%) | 396 (8.6%) |
| 5 to 9 Years | 244 (5.7%) | 421 (9.1%) |
| 10 to 14 Years | 246 (5.7%) | 250 (5.4%) |
| 15 to 19 Years | 311 (7.3%) | 355 (7.7%) |
| 20 to 24 Years | 335 (7.8%) | 249 (5.4%) |
| 25 to 29 Years | 373 (8.7%) | 322 (7.0%) |
| 30 to 34 Years | 481 (11.2%) | 396 (8.6%) |
| 35 to 39 Years | 359 (8.4%) | 370 (8.0%) |
| 40 to 44 Years | 168 (3.9%) | 326 (7.1%) |
| 45 to 49 Years | 332 (7.7%) | 279 (6.0%) |
| 50 to 54 Years | 284 (6.6%) | 431 (9.3%) |
| 55 to 59 Years | 213 (5.0%) | 134 (2.9%) |
| 60 to 64 Years | 166 (3.9%) | 198 (4.3%) |
| 65 to 69 Years | 100 (2.3%) | 106 (2.3%) |
| 70 to 74 Years | 148 (3.5%) | 144 (3.1%) |
| 75 to 79 Years | 113 (2.6%) | 98 (2.1%) |
| 80 to 84 Years | 37 (0.9%) | 72 (1.6%) |
| 85 Years and over | 53 (1.2%) | 68 (1.5%) |
| Total | 4,283 (100.0%) | 4,615 (100.0%) |
Families and Households in Orting
Median Family Size in Orting
The median family size in Orting is 3.24 persons per family, with single female/mother families (417 | 18.0%) accounting for the largest median family size of 3.31 persons per family. On the other hand, single male/father families (181 | 7.8%) represent the smallest median family size with 2.82 persons per family.
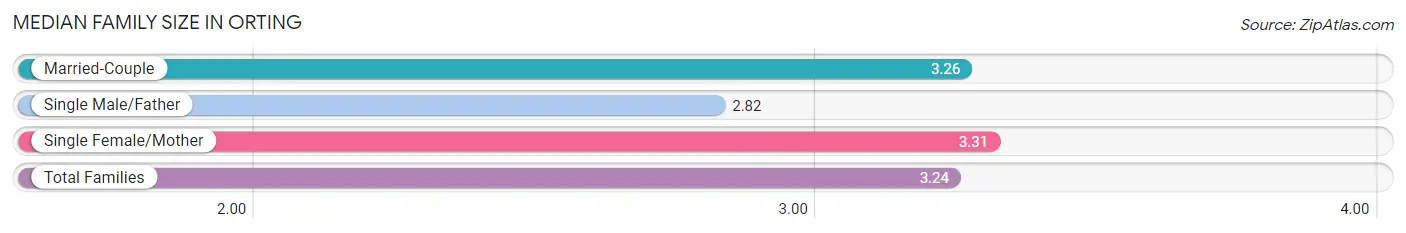
| Family Type | # Families | Family Size |
| Married-Couple | 1,712 (74.1%) | 3.26 |
| Single Male/Father | 181 (7.8%) | 2.82 |
| Single Female/Mother | 417 (18.0%) | 3.31 |
| Total Families | 2,310 (100.0%) | 3.24 |
Median Household Size in Orting
The median household size in Orting is 3.05 persons per household, with single female/mother households (417 | 14.5%) accounting for the largest median household size of 4.09 persons per household. non-family households (559 | 19.5%) represent the smallest median household size with 1.40 persons per household.
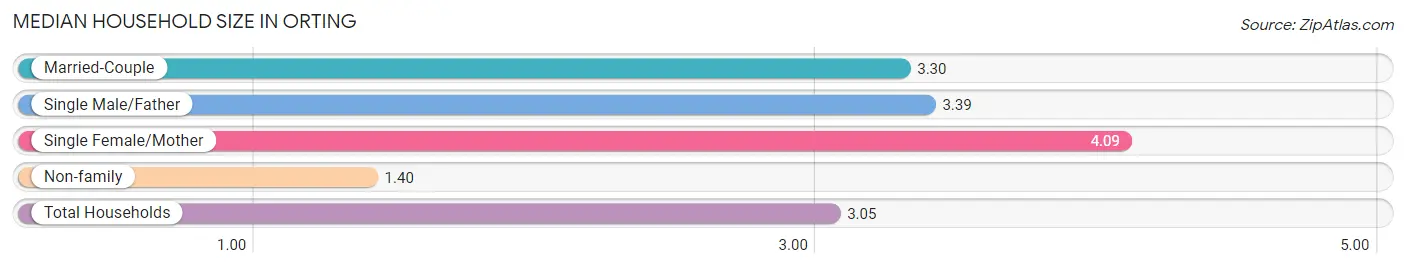
| Household Type | # Households | Household Size |
| Married-Couple | 1,712 (59.7%) | 3.30 |
| Single Male/Father | 181 (6.3%) | 3.39 |
| Single Female/Mother | 417 (14.5%) | 4.09 |
| Non-family | 559 (19.5%) | 1.40 |
| Total Households | 2,869 (100.0%) | 3.05 |
Household Size by Marriage Status in Orting
Out of a total of 2,869 households in Orting, 2,310 (80.5%) are family households, while 559 (19.5%) are nonfamily households. The most numerous type of family households are 3-person households, comprising 717, and the most common type of nonfamily households are 1-person households, comprising 396.
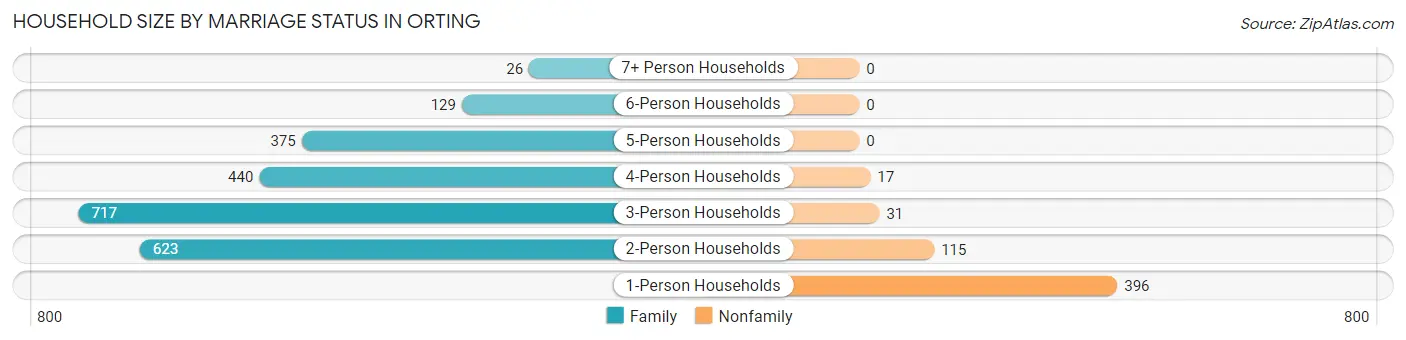
| Household Size | Family Households | Nonfamily Households |
| 1-Person Households | - | 396 (13.8%) |
| 2-Person Households | 623 (21.7%) | 115 (4.0%) |
| 3-Person Households | 717 (25.0%) | 31 (1.1%) |
| 4-Person Households | 440 (15.3%) | 17 (0.6%) |
| 5-Person Households | 375 (13.1%) | 0 (0.0%) |
| 6-Person Households | 129 (4.5%) | 0 (0.0%) |
| 7+ Person Households | 26 (0.9%) | 0 (0.0%) |
| Total | 2,310 (80.5%) | 559 (19.5%) |
Female Fertility in Orting
Fertility by Age in Orting
Average fertility rate in Orting is 39.0 births per 1,000 women. Women in the age bracket of 20 to 34 years have the highest fertility rate with 93.0 births per 1,000 women. Women in the age bracket of 20 to 34 years acount for 96.8% of all women with births.
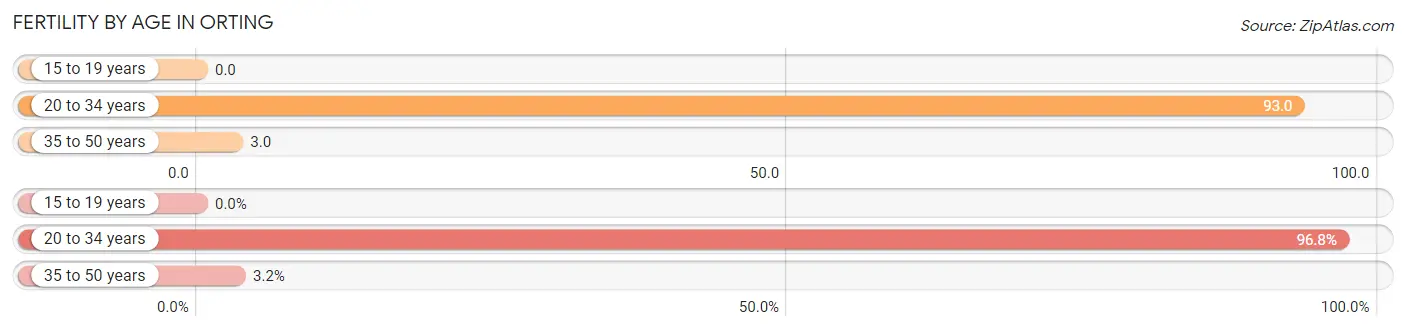
| Age Bracket | Women with Births | Births / 1,000 Women |
| 15 to 19 years | 0 (0.0%) | 0.0 |
| 20 to 34 years | 90 (96.8%) | 93.0 |
| 35 to 50 years | 3 (3.2%) | 3.0 |
| Total | 93 (100.0%) | 39.0 |
Fertility by Age by Marriage Status in Orting
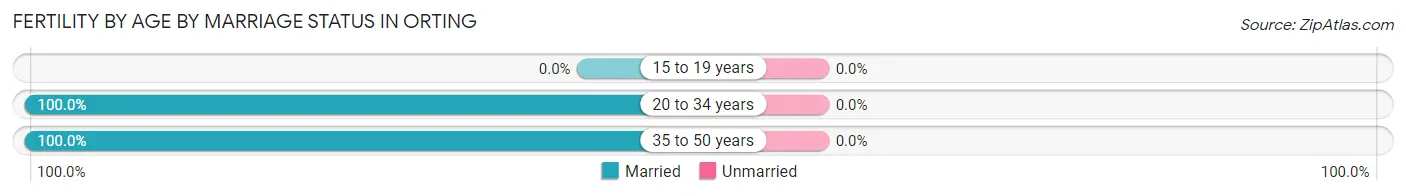
| Age Bracket | Married | Unmarried |
| 15 to 19 years | 0 (0.0%) | 0 (0.0%) |
| 20 to 34 years | 90 (100.0%) | 0 (0.0%) |
| 35 to 50 years | 3 (100.0%) | 0 (0.0%) |
| Total | 93 (100.0%) | 0 (0.0%) |
Fertility by Education in Orting
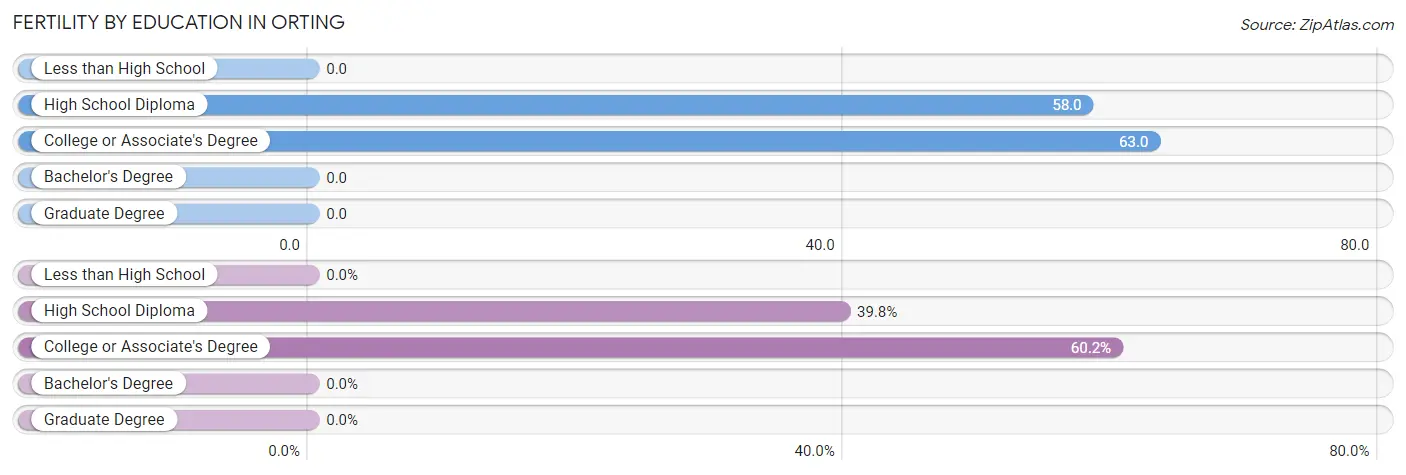
| Educational Attainment | Women with Births | Births / 1,000 Women |
| Less than High School | 0 (0.0%) | 0.0 |
| High School Diploma | 37 (39.8%) | 58.0 |
| College or Associate's Degree | 56 (60.2%) | 63.0 |
| Bachelor's Degree | 0 (0.0%) | 0.0 |
| Graduate Degree | 0 (0.0%) | 0.0 |
| Total | 93 (100.0%) | 39.0 |
Fertility by Education by Marriage Status in Orting
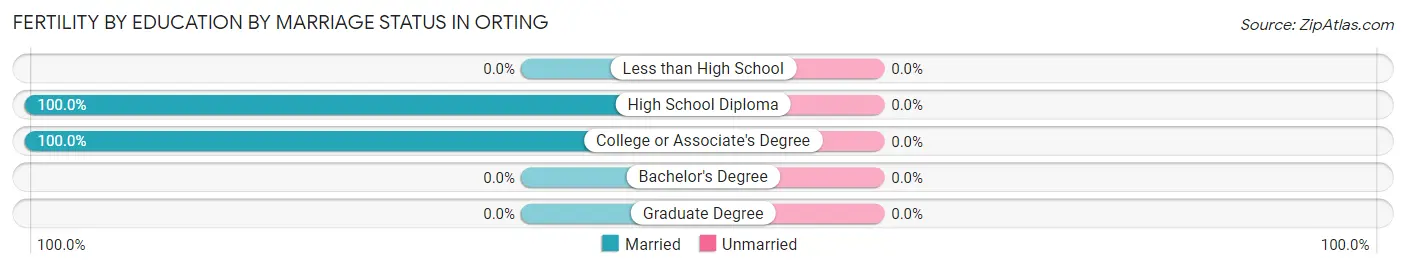
| Educational Attainment | Married | Unmarried |
| Less than High School | 0 (0.0%) | 0 (0.0%) |
| High School Diploma | 37 (100.0%) | 0 (0.0%) |
| College or Associate's Degree | 56 (100.0%) | 0 (0.0%) |
| Bachelor's Degree | 0 (0.0%) | 0 (0.0%) |
| Graduate Degree | 0 (0.0%) | 0 (0.0%) |
| Total | 93 (100.0%) | 0 (0.0%) |
Employment Characteristics in Orting
Employment by Class of Employer in Orting
Among the 4,154 employed individuals in Orting, private company employees (2,622 | 63.1%), local government employees (520 | 12.5%), and not-for-profit organizations (298 | 7.2%) make up the most common classes of employment.
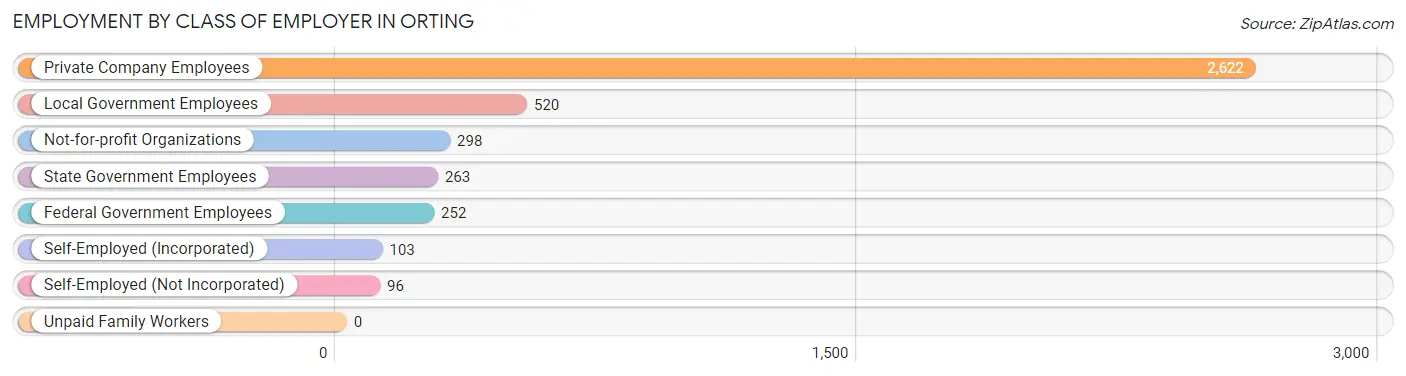
| Employer Class | # Employees | % Employees |
| Private Company Employees | 2,622 | 63.1% |
| Self-Employed (Incorporated) | 103 | 2.5% |
| Self-Employed (Not Incorporated) | 96 | 2.3% |
| Not-for-profit Organizations | 298 | 7.2% |
| Local Government Employees | 520 | 12.5% |
| State Government Employees | 263 | 6.3% |
| Federal Government Employees | 252 | 6.1% |
| Unpaid Family Workers | 0 | 0.0% |
| Total | 4,154 | 100.0% |
Employment Status by Age in Orting
According to the labor force statistics for Orting, out of the total population over 16 years of age (6,853), 69.4% or 4,756 individuals are in the labor force, with 3.9% or 185 of them unemployed. The age group with the highest labor force participation rate is 35 to 44 years, with 89.3% or 1,092 individuals in the labor force. Within the labor force, the 16 to 19 years age range has the highest percentage of unemployed individuals, with 13.3% or 25 of them being unemployed.
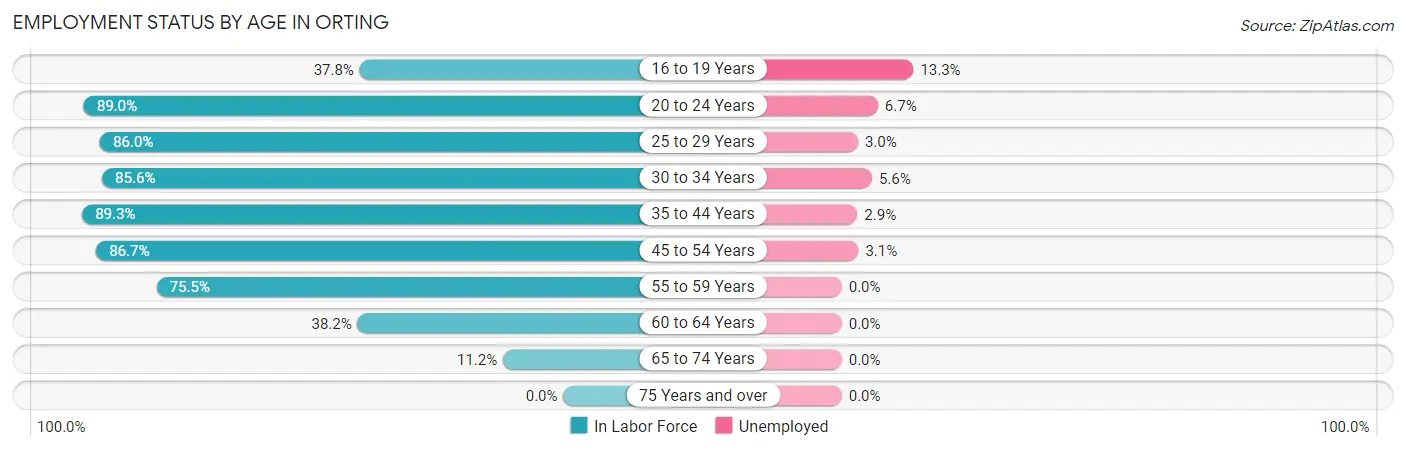
| Age Bracket | In Labor Force | Unemployed |
| 16 to 19 Years | 188 (37.8%) | 25 (13.3%) |
| 20 to 24 Years | 520 (89.0%) | 35 (6.7%) |
| 25 to 29 Years | 598 (86.0%) | 18 (3.0%) |
| 30 to 34 Years | 751 (85.6%) | 42 (5.6%) |
| 35 to 44 Years | 1,092 (89.3%) | 32 (2.9%) |
| 45 to 54 Years | 1,150 (86.7%) | 36 (3.1%) |
| 55 to 59 Years | 262 (75.5%) | 0 (0.0%) |
| 60 to 64 Years | 139 (38.2%) | 0 (0.0%) |
| 65 to 74 Years | 56 (11.2%) | 0 (0.0%) |
| 75 Years and over | 0 (0.0%) | 0 (0.0%) |
| Total | 4,756 (69.4%) | 185 (3.9%) |
Employment Status by Educational Attainment in Orting
According to labor force statistics for Orting, 82.6% of individuals (3,991) out of the total population between 25 and 64 years of age (4,832) are in the labor force, with 3.2% or 128 of them being unemployed. The group with the highest labor force participation rate are those with the educational attainment of bachelor's degree or higher, with 90.3% or 922 individuals in the labor force. Within the labor force, individuals with bachelor's degree or higher education have the highest percentage of unemployment, with 5.4% or 50 of them being unemployed.
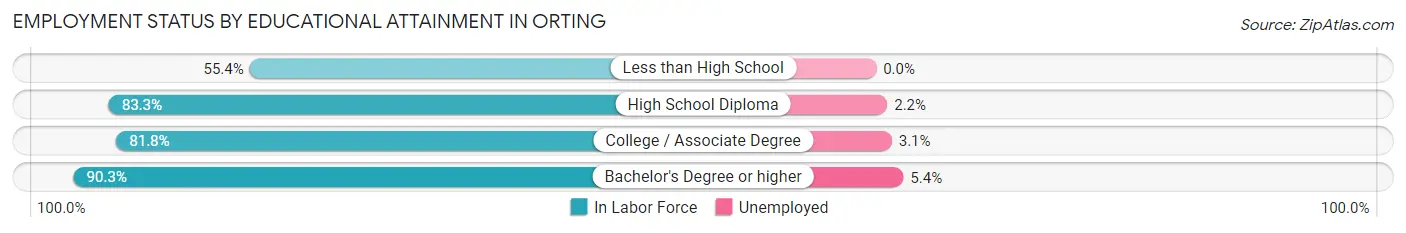
| Educational Attainment | In Labor Force | Unemployed |
| Less than High School | 158 (55.4%) | 0 (0.0%) |
| High School Diploma | 1,489 (83.3%) | 39 (2.2%) |
| College / Associate Degree | 1,423 (81.8%) | 54 (3.1%) |
| Bachelor's Degree or higher | 922 (90.3%) | 55 (5.4%) |
| Total | 3,991 (82.6%) | 155 (3.2%) |
Employment Occupations by Sex in Orting
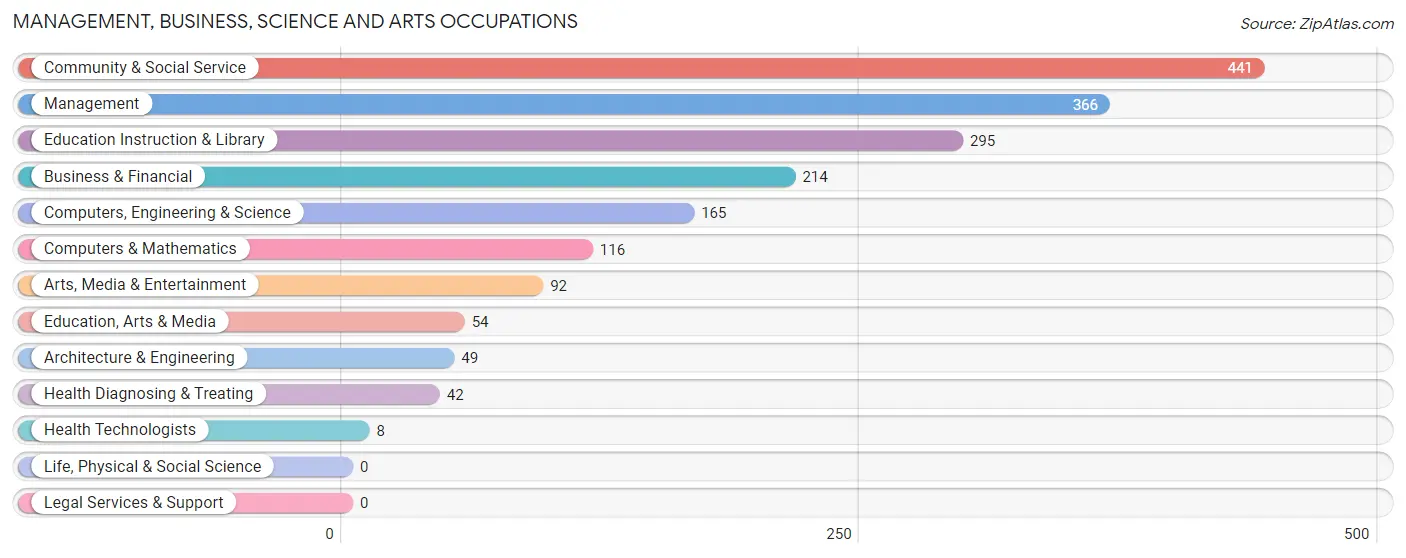
Management, Business, Science and Arts Occupations
The most common Management, Business, Science and Arts occupations in Orting are Community & Social Service (441 | 9.7%), Management (366 | 8.1%), Education Instruction & Library (295 | 6.5%), Business & Financial (214 | 4.7%), and Computers, Engineering & Science (165 | 3.6%).
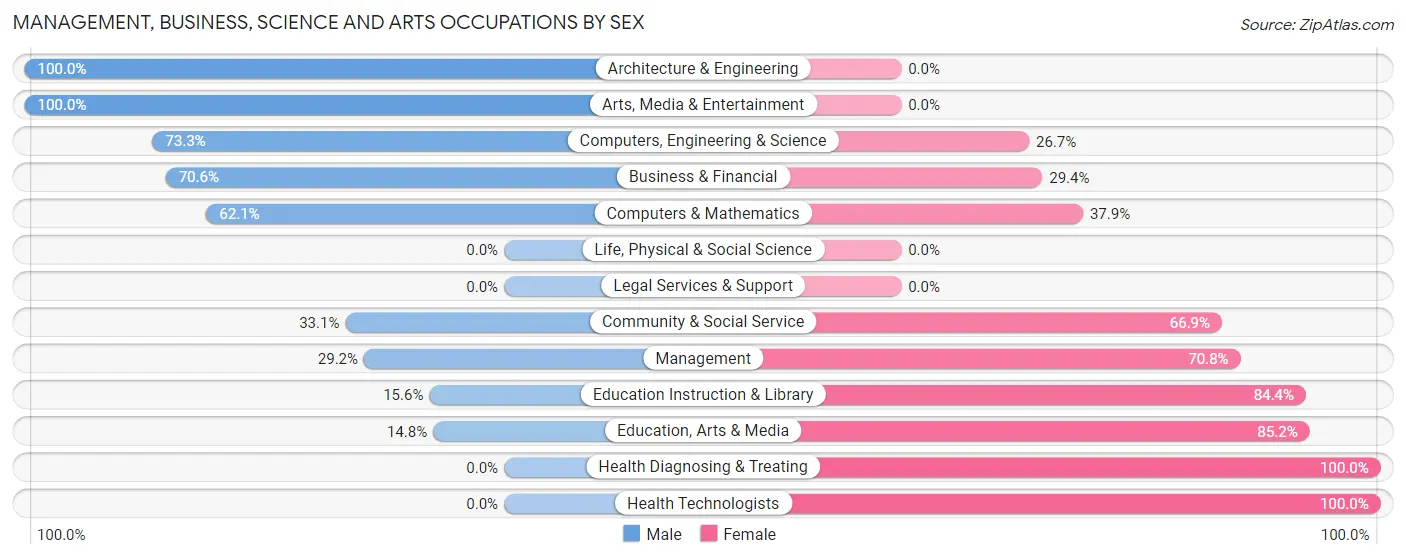
Management, Business, Science and Arts Occupations by Sex
Within the Management, Business, Science and Arts occupations in Orting, the most male-oriented occupations are Architecture & Engineering (100.0%), Arts, Media & Entertainment (100.0%), and Computers, Engineering & Science (73.3%), while the most female-oriented occupations are Health Diagnosing & Treating (100.0%), Health Technologists (100.0%), and Education, Arts & Media (85.2%).
| Occupation | Male | Female |
| Management | 107 (29.2%) | 259 (70.8%) |
| Business & Financial | 151 (70.6%) | 63 (29.4%) |
| Computers, Engineering & Science | 121 (73.3%) | 44 (26.7%) |
| Computers & Mathematics | 72 (62.1%) | 44 (37.9%) |
| Architecture & Engineering | 49 (100.0%) | 0 (0.0%) |
| Life, Physical & Social Science | 0 (0.0%) | 0 (0.0%) |
| Community & Social Service | 146 (33.1%) | 295 (66.9%) |
| Education, Arts & Media | 8 (14.8%) | 46 (85.2%) |
| Legal Services & Support | 0 (0.0%) | 0 (0.0%) |
| Education Instruction & Library | 46 (15.6%) | 249 (84.4%) |
| Arts, Media & Entertainment | 92 (100.0%) | 0 (0.0%) |
| Health Diagnosing & Treating | 0 (0.0%) | 42 (100.0%) |
| Health Technologists | 0 (0.0%) | 8 (100.0%) |
| Total (Category) | 525 (42.7%) | 703 (57.3%) |
| Total (Overall) | 2,327 (51.3%) | 2,210 (48.7%) |
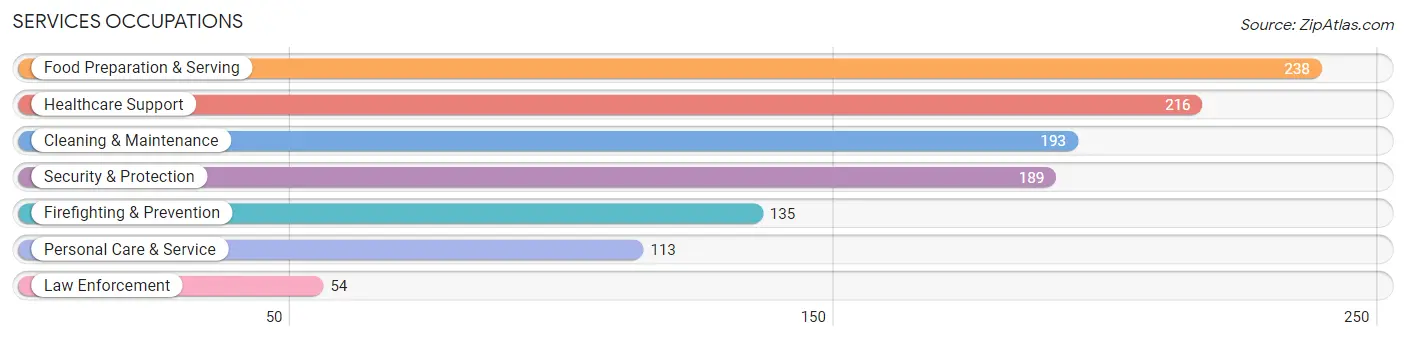
Services Occupations
The most common Services occupations in Orting are Food Preparation & Serving (238 | 5.2%), Healthcare Support (216 | 4.8%), Cleaning & Maintenance (193 | 4.3%), Security & Protection (189 | 4.2%), and Firefighting & Prevention (135 | 3.0%).
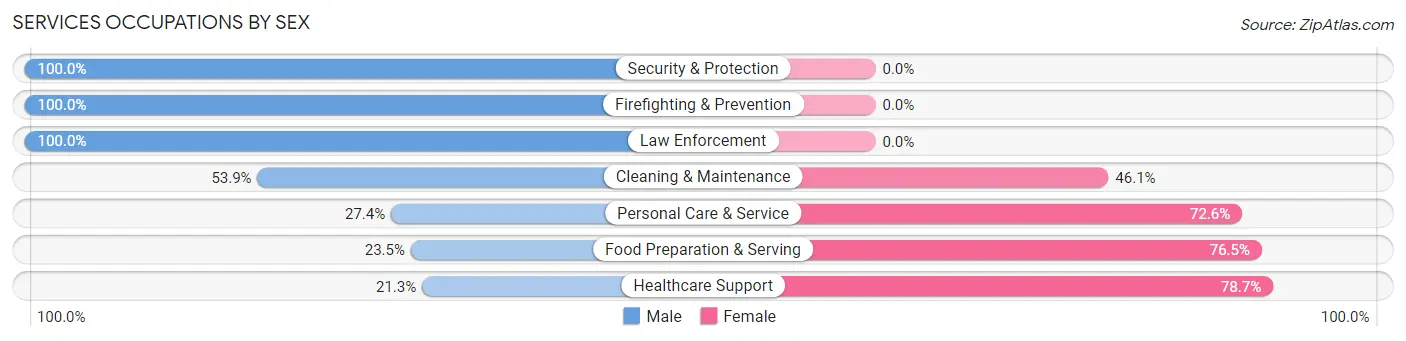
Services Occupations by Sex
Within the Services occupations in Orting, the most male-oriented occupations are Security & Protection (100.0%), Firefighting & Prevention (100.0%), and Law Enforcement (100.0%), while the most female-oriented occupations are Healthcare Support (78.7%), Food Preparation & Serving (76.5%), and Personal Care & Service (72.6%).
| Occupation | Male | Female |
| Healthcare Support | 46 (21.3%) | 170 (78.7%) |
| Security & Protection | 189 (100.0%) | 0 (0.0%) |
| Firefighting & Prevention | 135 (100.0%) | 0 (0.0%) |
| Law Enforcement | 54 (100.0%) | 0 (0.0%) |
| Food Preparation & Serving | 56 (23.5%) | 182 (76.5%) |
| Cleaning & Maintenance | 104 (53.9%) | 89 (46.1%) |
| Personal Care & Service | 31 (27.4%) | 82 (72.6%) |
| Total (Category) | 426 (44.9%) | 523 (55.1%) |
| Total (Overall) | 2,327 (51.3%) | 2,210 (48.7%) |
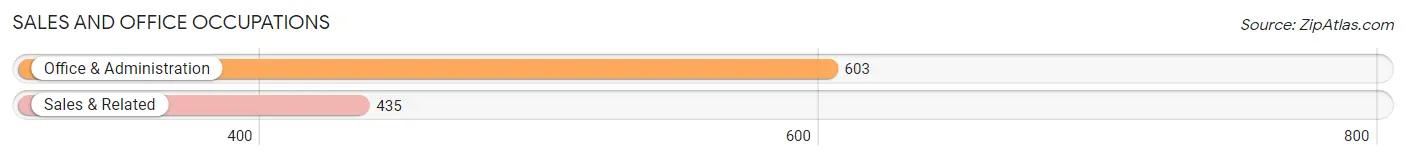
Sales and Office Occupations
The most common Sales and Office occupations in Orting are Office & Administration (603 | 13.3%), and Sales & Related (435 | 9.6%).
Sales and Office Occupations by Sex
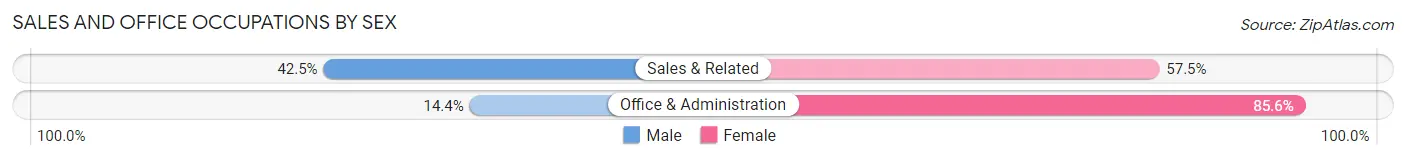
| Occupation | Male | Female |
| Sales & Related | 185 (42.5%) | 250 (57.5%) |
| Office & Administration | 87 (14.4%) | 516 (85.6%) |
| Total (Category) | 272 (26.2%) | 766 (73.8%) |
| Total (Overall) | 2,327 (51.3%) | 2,210 (48.7%) |
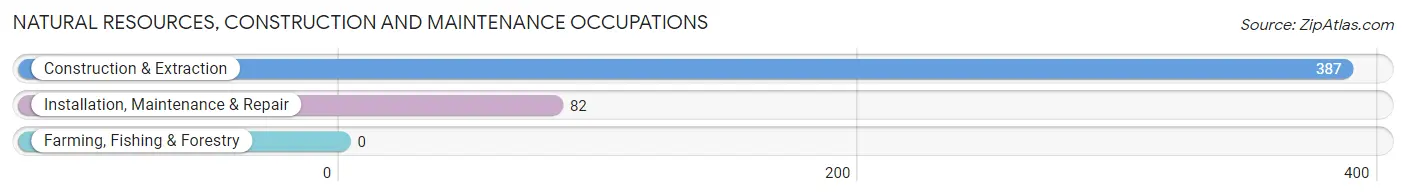
Natural Resources, Construction and Maintenance Occupations
The most common Natural Resources, Construction and Maintenance occupations in Orting are Construction & Extraction (387 | 8.5%), and Installation, Maintenance & Repair (82 | 1.8%).
Natural Resources, Construction and Maintenance Occupations by Sex
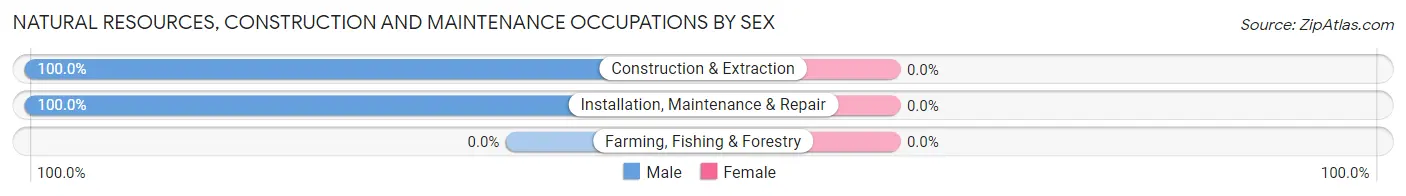
| Occupation | Male | Female |
| Farming, Fishing & Forestry | 0 (0.0%) | 0 (0.0%) |
| Construction & Extraction | 387 (100.0%) | 0 (0.0%) |
| Installation, Maintenance & Repair | 82 (100.0%) | 0 (0.0%) |
| Total (Category) | 469 (100.0%) | 0 (0.0%) |
| Total (Overall) | 2,327 (51.3%) | 2,210 (48.7%) |
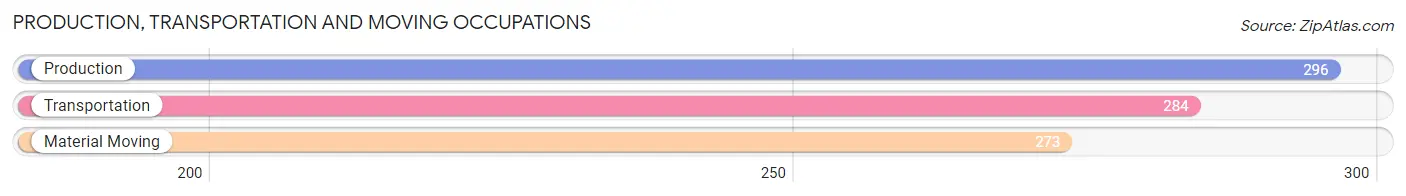
Production, Transportation and Moving Occupations
The most common Production, Transportation and Moving occupations in Orting are Production (296 | 6.5%), Transportation (284 | 6.3%), and Material Moving (273 | 6.0%).
Production, Transportation and Moving Occupations by Sex
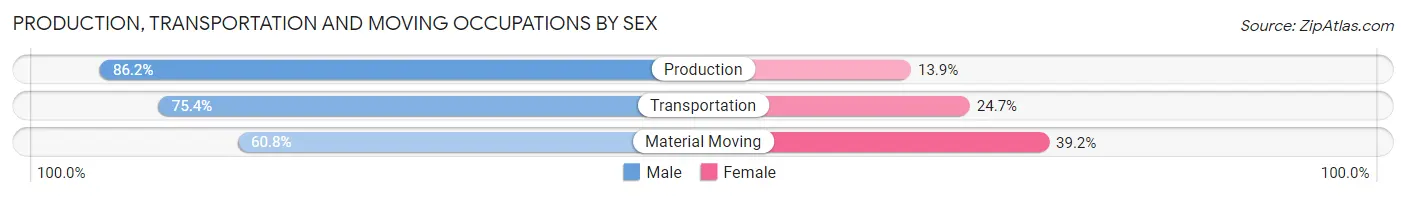
| Occupation | Male | Female |
| Production | 255 (86.2%) | 41 (13.9%) |
| Transportation | 214 (75.3%) | 70 (24.6%) |
| Material Moving | 166 (60.8%) | 107 (39.2%) |
| Total (Category) | 635 (74.4%) | 218 (25.6%) |
| Total (Overall) | 2,327 (51.3%) | 2,210 (48.7%) |
Employment Industries by Sex in Orting
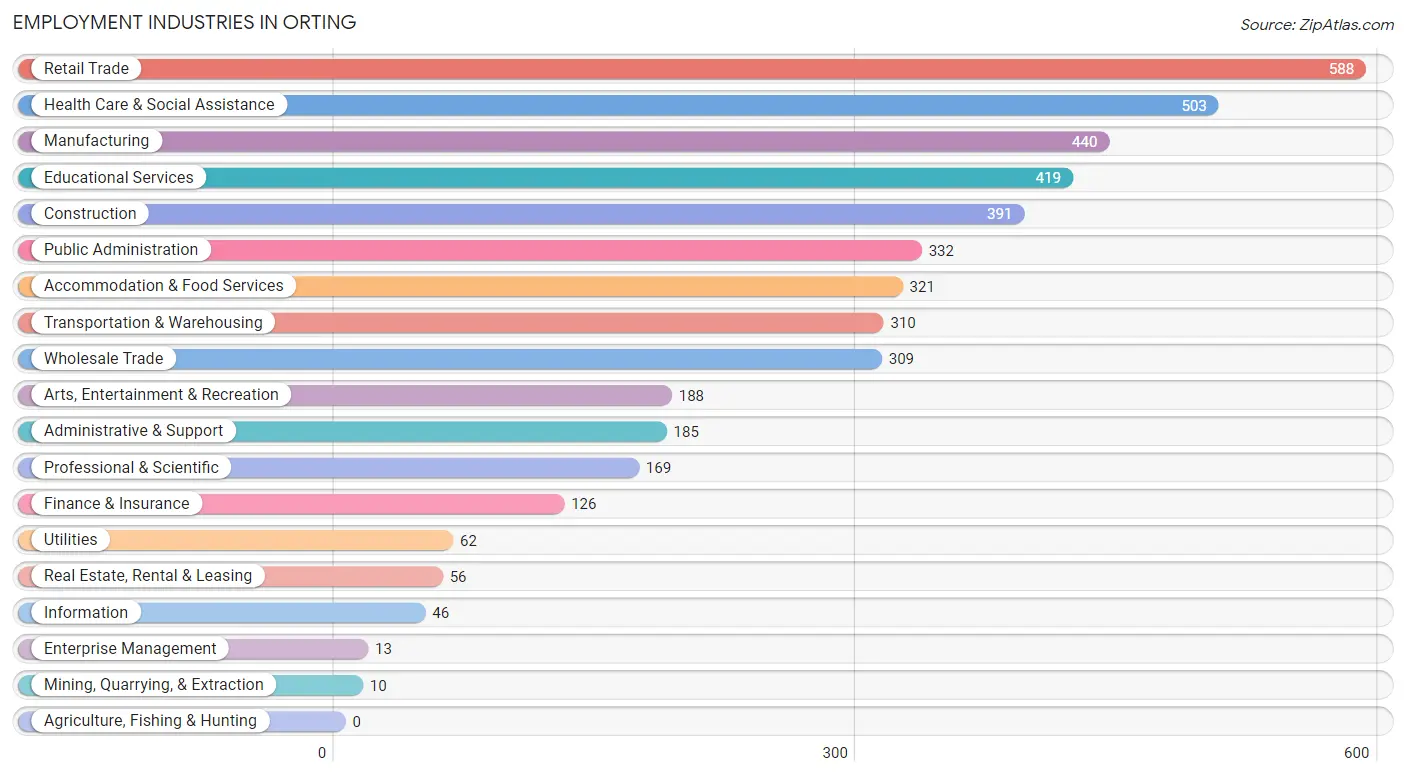
Employment Industries in Orting
The major employment industries in Orting include Retail Trade (588 | 13.0%), Health Care & Social Assistance (503 | 11.1%), Manufacturing (440 | 9.7%), Educational Services (419 | 9.2%), and Construction (391 | 8.6%).
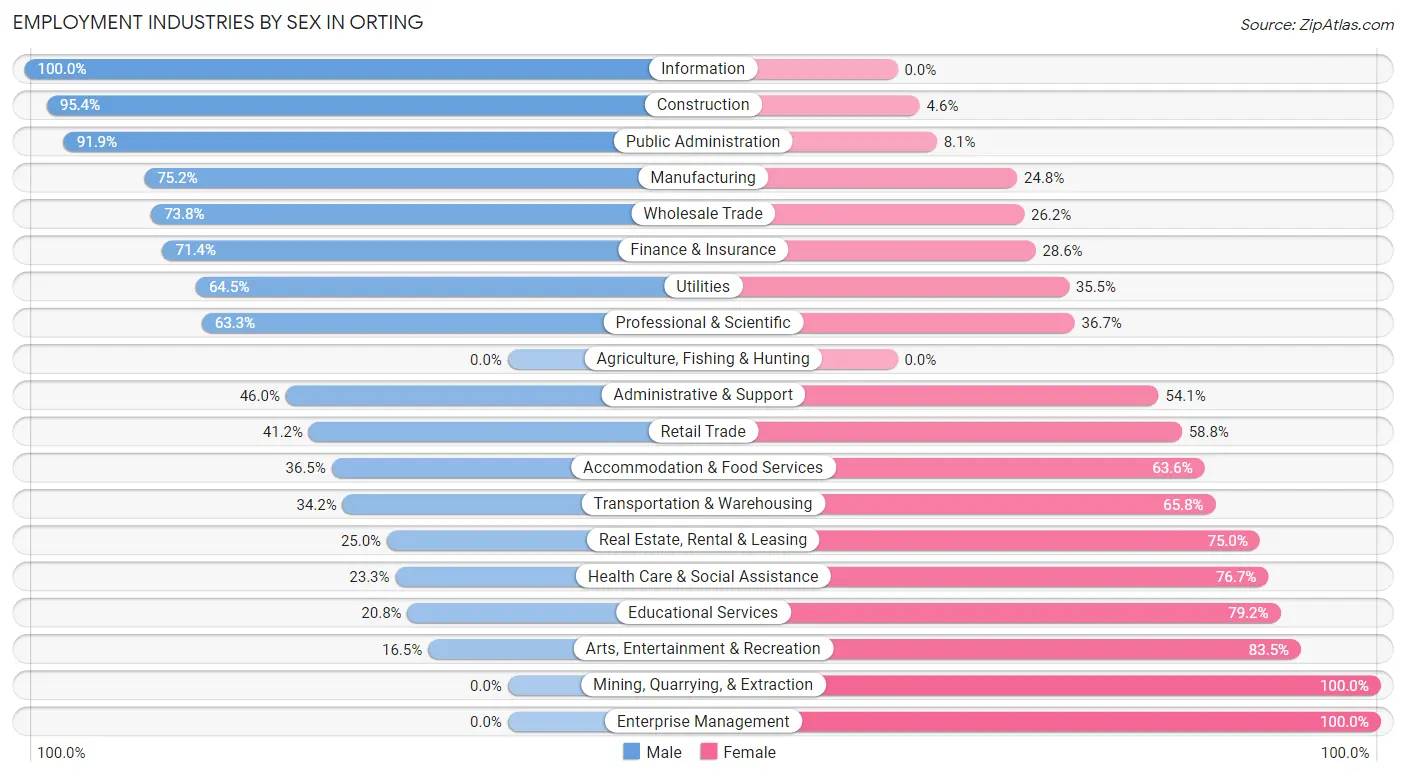
Employment Industries by Sex in Orting
The Orting industries that see more men than women are Information (100.0%), Construction (95.4%), and Public Administration (91.9%), whereas the industries that tend to have a higher number of women are Mining, Quarrying, & Extraction (100.0%), Enterprise Management (100.0%), and Arts, Entertainment & Recreation (83.5%).
| Industry | Male | Female |
| Agriculture, Fishing & Hunting | 0 (0.0%) | 0 (0.0%) |
| Mining, Quarrying, & Extraction | 0 (0.0%) | 10 (100.0%) |
| Construction | 373 (95.4%) | 18 (4.6%) |
| Manufacturing | 331 (75.2%) | 109 (24.8%) |
| Wholesale Trade | 228 (73.8%) | 81 (26.2%) |
| Retail Trade | 242 (41.2%) | 346 (58.8%) |
| Transportation & Warehousing | 106 (34.2%) | 204 (65.8%) |
| Utilities | 40 (64.5%) | 22 (35.5%) |
| Information | 46 (100.0%) | 0 (0.0%) |
| Finance & Insurance | 90 (71.4%) | 36 (28.6%) |
| Real Estate, Rental & Leasing | 14 (25.0%) | 42 (75.0%) |
| Professional & Scientific | 107 (63.3%) | 62 (36.7%) |
| Enterprise Management | 0 (0.0%) | 13 (100.0%) |
| Administrative & Support | 85 (46.0%) | 100 (54.0%) |
| Educational Services | 87 (20.8%) | 332 (79.2%) |
| Health Care & Social Assistance | 117 (23.3%) | 386 (76.7%) |
| Arts, Entertainment & Recreation | 31 (16.5%) | 157 (83.5%) |
| Accommodation & Food Services | 117 (36.4%) | 204 (63.5%) |
| Public Administration | 305 (91.9%) | 27 (8.1%) |
| Total | 2,327 (51.3%) | 2,210 (48.7%) |
Education in Orting
School Enrollment in Orting
The most common levels of schooling among the 2,325 students in Orting are high school (666 | 28.6%), elementary school (491 | 21.1%), and middle school (402 | 17.3%).
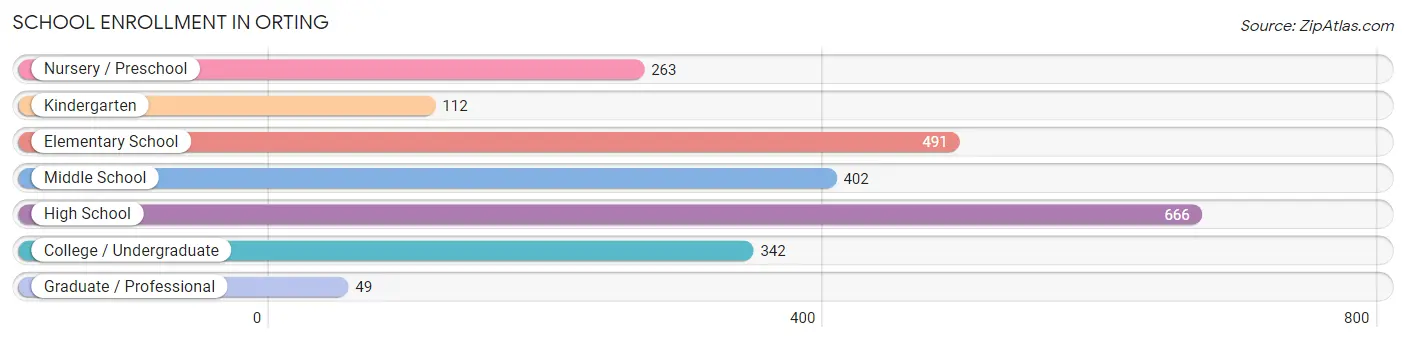
| School Level | # Students | % Students |
| Nursery / Preschool | 263 | 11.3% |
| Kindergarten | 112 | 4.8% |
| Elementary School | 491 | 21.1% |
| Middle School | 402 | 17.3% |
| High School | 666 | 28.6% |
| College / Undergraduate | 342 | 14.7% |
| Graduate / Professional | 49 | 2.1% |
| Total | 2,325 | 100.0% |
School Enrollment by Age by Funding Source in Orting
Out of a total of 2,325 students who are enrolled in schools in Orting, 300 (12.9%) attend a private institution, while the remaining 2,025 (87.1%) are enrolled in public schools. The age group of 3 to 4 year olds has the highest likelihood of being enrolled in private schools, with 146 (58.4% in the age bracket) enrolled. Conversely, the age group of 35 years and over has the lowest likelihood of being enrolled in a private school, with 123 (100.0% in the age bracket) attending a public institution.
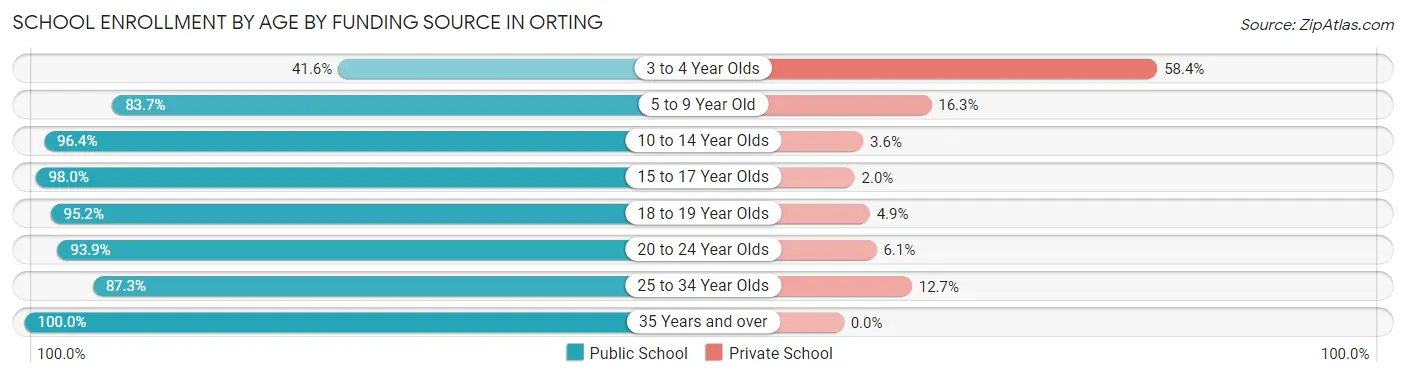
| Age Bracket | Public School | Private School |
| 3 to 4 Year Olds | 104 (41.6%) | 146 (58.4%) |
| 5 to 9 Year Old | 477 (83.7%) | 93 (16.3%) |
| 10 to 14 Year Olds | 478 (96.4%) | 18 (3.6%) |
| 15 to 17 Year Olds | 386 (98.0%) | 8 (2.0%) |
| 18 to 19 Year Olds | 216 (95.2%) | 11 (4.9%) |
| 20 to 24 Year Olds | 123 (93.9%) | 8 (6.1%) |
| 25 to 34 Year Olds | 117 (87.3%) | 17 (12.7%) |
| 35 Years and over | 123 (100.0%) | 0 (0.0%) |
| Total | 2,025 (87.1%) | 300 (12.9%) |
Educational Attainment by Field of Study in Orting
Business (253 | 19.8%), education (215 | 16.8%), communications (145 | 11.4%), science & technology (88 | 6.9%), and bio, nature & agricultural (79 | 6.2%) are the most common fields of study among 1,277 individuals in Orting who have obtained a bachelor's degree or higher.
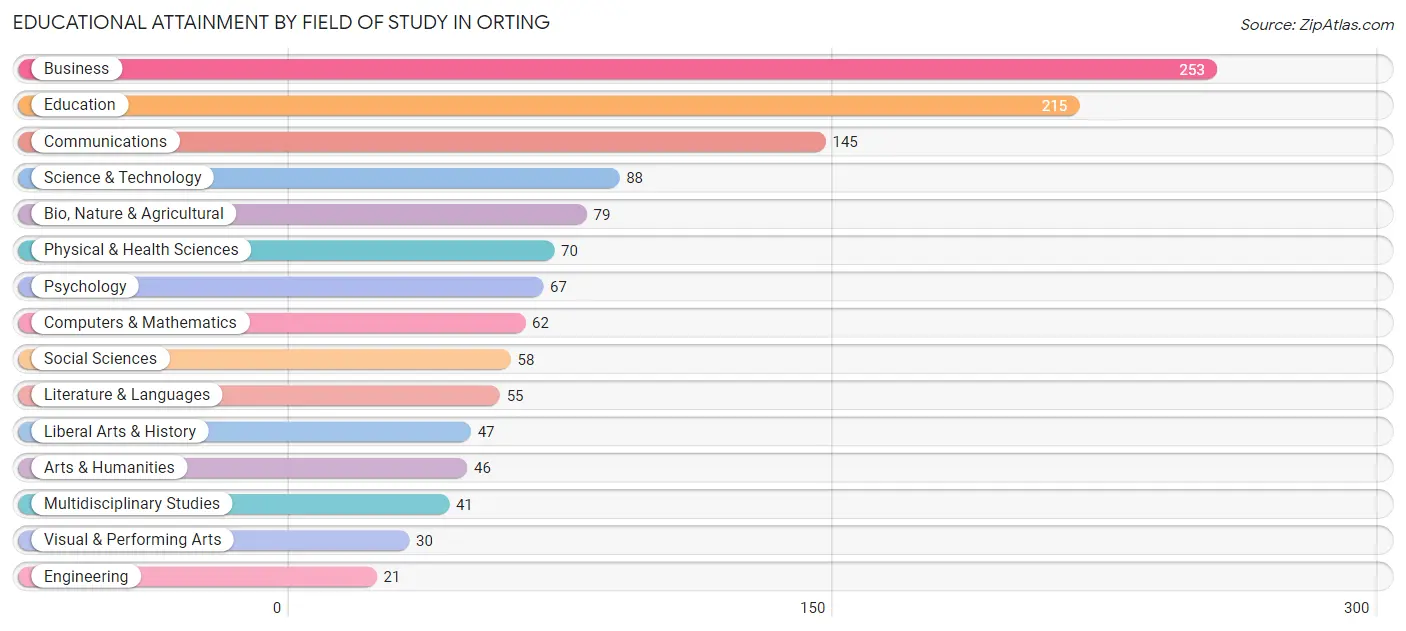
| Field of Study | # Graduates | % Graduates |
| Computers & Mathematics | 62 | 4.9% |
| Bio, Nature & Agricultural | 79 | 6.2% |
| Physical & Health Sciences | 70 | 5.5% |
| Psychology | 67 | 5.2% |
| Social Sciences | 58 | 4.5% |
| Engineering | 21 | 1.6% |
| Multidisciplinary Studies | 41 | 3.2% |
| Science & Technology | 88 | 6.9% |
| Business | 253 | 19.8% |
| Education | 215 | 16.8% |
| Literature & Languages | 55 | 4.3% |
| Liberal Arts & History | 47 | 3.7% |
| Visual & Performing Arts | 30 | 2.4% |
| Communications | 145 | 11.4% |
| Arts & Humanities | 46 | 3.6% |
| Total | 1,277 | 100.0% |
Transportation & Commute in Orting
Vehicle Availability by Sex in Orting
The most prevalent vehicle ownership categories in Orting are males with 3 vehicles (795, accounting for 36.1%) and females with 3 vehicles (621, making up 40.7%).
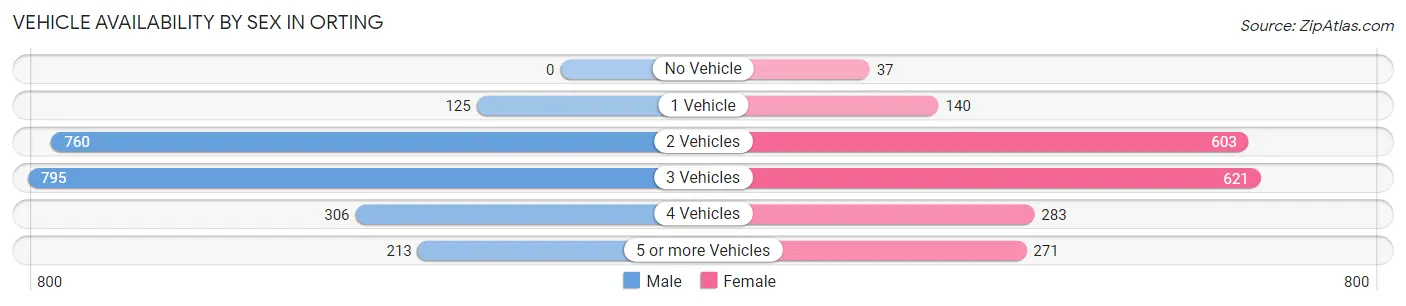
| Vehicles Available | Male | Female |
| No Vehicle | 0 (0.0%) | 37 (1.9%) |
| 1 Vehicle | 125 (5.7%) | 140 (7.2%) |
| 2 Vehicles | 760 (34.6%) | 603 (30.8%) |
| 3 Vehicles | 795 (36.1%) | 621 (31.8%) |
| 4 Vehicles | 306 (13.9%) | 283 (14.5%) |
| 5 or more Vehicles | 213 (9.7%) | 271 (13.9%) |
| Total | 2,199 (100.0%) | 1,955 (100.0%) |
Commute Time in Orting
The most frequently occuring commute durations in Orting are 30 to 34 minutes (700 commuters, 18.2%), 45 to 59 minutes (700 commuters, 18.2%), and 60 to 89 minutes (561 commuters, 14.6%).
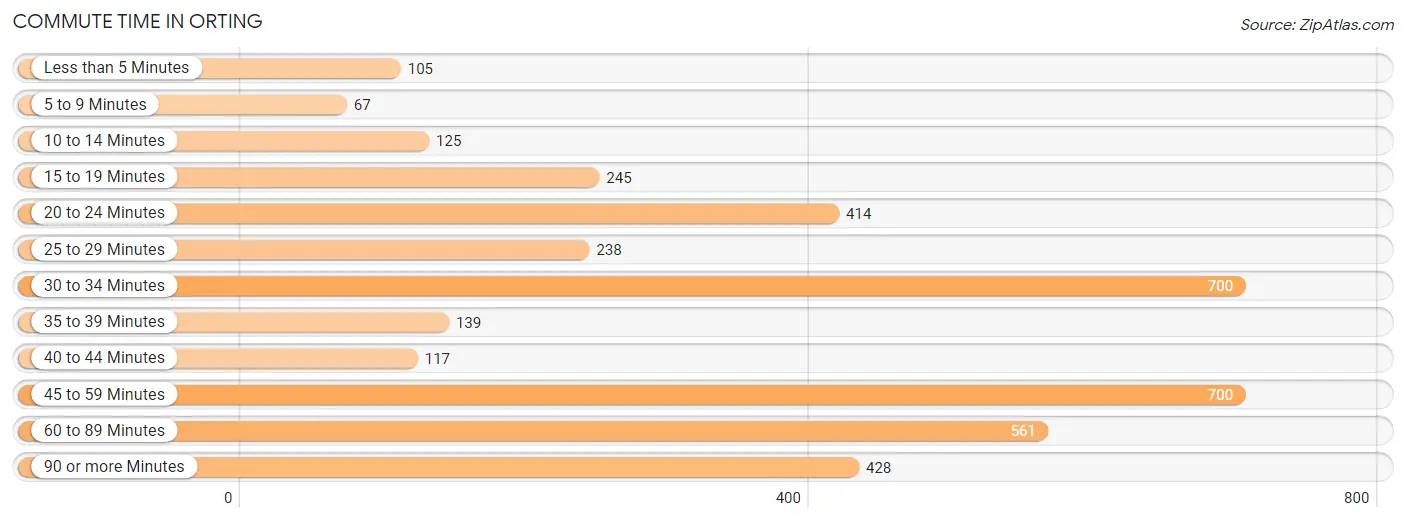
| Commute Time | # Commuters | % Commuters |
| Less than 5 Minutes | 105 | 2.7% |
| 5 to 9 Minutes | 67 | 1.8% |
| 10 to 14 Minutes | 125 | 3.3% |
| 15 to 19 Minutes | 245 | 6.4% |
| 20 to 24 Minutes | 414 | 10.8% |
| 25 to 29 Minutes | 238 | 6.2% |
| 30 to 34 Minutes | 700 | 18.2% |
| 35 to 39 Minutes | 139 | 3.6% |
| 40 to 44 Minutes | 117 | 3.0% |
| 45 to 59 Minutes | 700 | 18.2% |
| 60 to 89 Minutes | 561 | 14.6% |
| 90 or more Minutes | 428 | 11.2% |
Commute Time by Sex in Orting
The most common commute times in Orting are 45 to 59 minutes (541 commuters, 26.3%) for males and 30 to 34 minutes (416 commuters, 23.3%) for females.
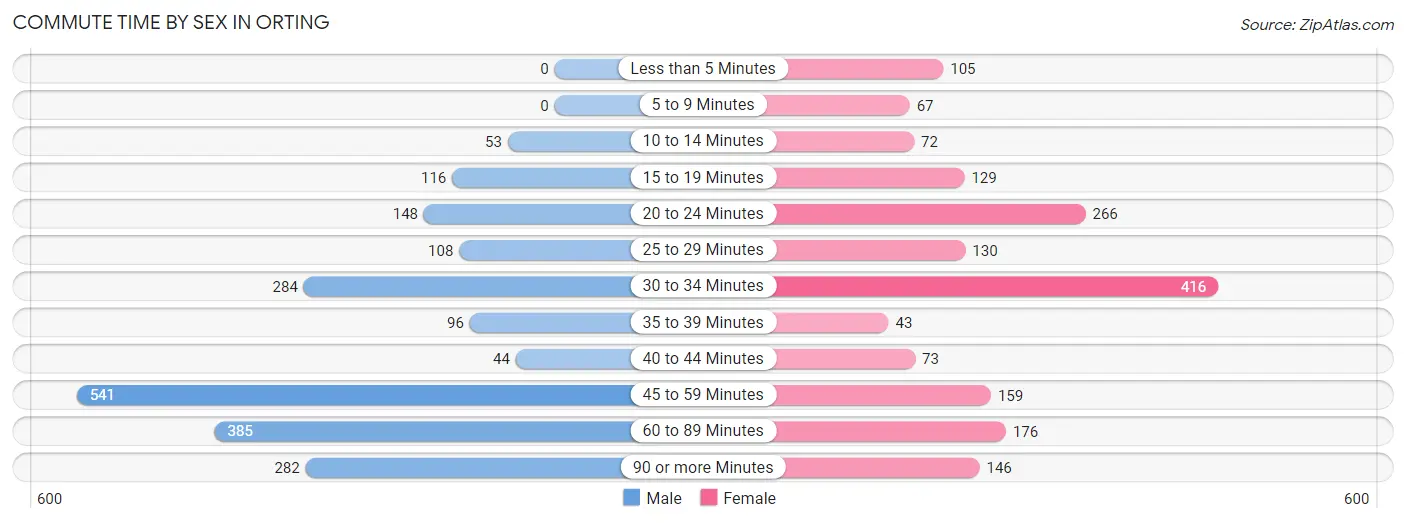
| Commute Time | Male | Female |
| Less than 5 Minutes | 0 (0.0%) | 105 (5.9%) |
| 5 to 9 Minutes | 0 (0.0%) | 67 (3.8%) |
| 10 to 14 Minutes | 53 (2.6%) | 72 (4.0%) |
| 15 to 19 Minutes | 116 (5.6%) | 129 (7.2%) |
| 20 to 24 Minutes | 148 (7.2%) | 266 (14.9%) |
| 25 to 29 Minutes | 108 (5.2%) | 130 (7.3%) |
| 30 to 34 Minutes | 284 (13.8%) | 416 (23.3%) |
| 35 to 39 Minutes | 96 (4.7%) | 43 (2.4%) |
| 40 to 44 Minutes | 44 (2.1%) | 73 (4.1%) |
| 45 to 59 Minutes | 541 (26.3%) | 159 (8.9%) |
| 60 to 89 Minutes | 385 (18.7%) | 176 (9.9%) |
| 90 or more Minutes | 282 (13.7%) | 146 (8.2%) |
Time of Departure to Work by Sex in Orting
The most frequent times of departure to work in Orting are 12:00 AM to 4:59 AM (413, 20.1%) for males and 7:30 AM to 7:59 AM (268, 15.0%) for females.
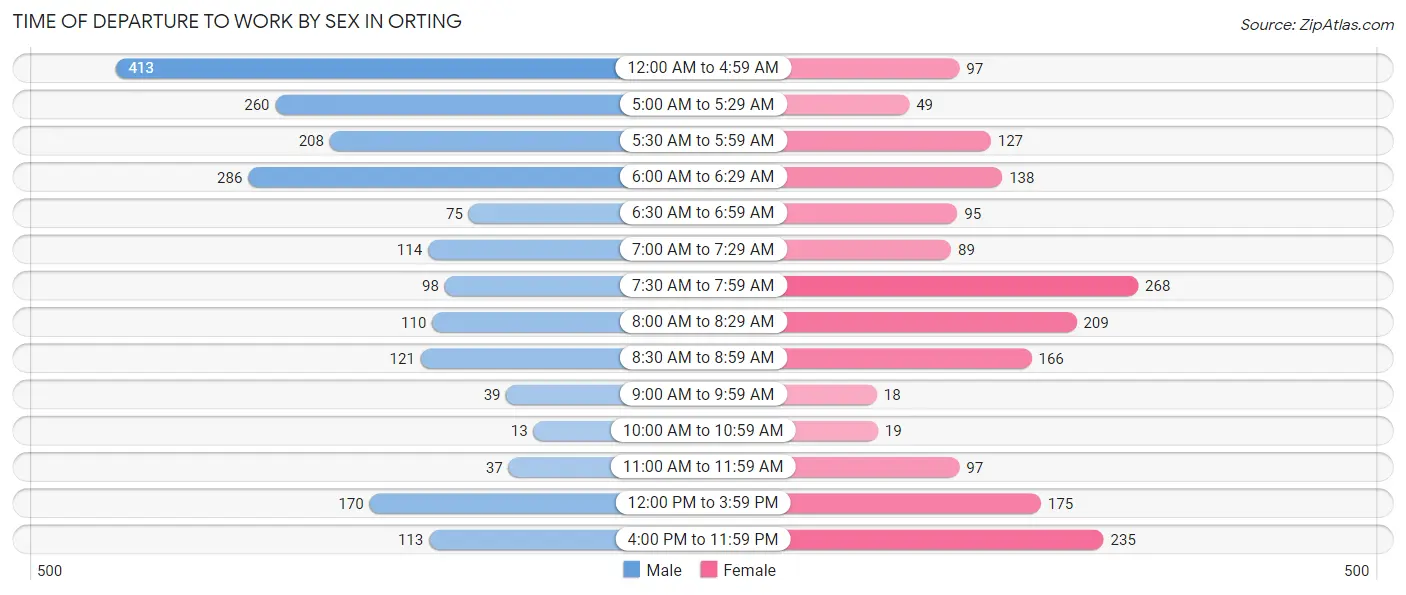
| Time of Departure | Male | Female |
| 12:00 AM to 4:59 AM | 413 (20.1%) | 97 (5.4%) |
| 5:00 AM to 5:29 AM | 260 (12.6%) | 49 (2.8%) |
| 5:30 AM to 5:59 AM | 208 (10.1%) | 127 (7.1%) |
| 6:00 AM to 6:29 AM | 286 (13.9%) | 138 (7.7%) |
| 6:30 AM to 6:59 AM | 75 (3.6%) | 95 (5.3%) |
| 7:00 AM to 7:29 AM | 114 (5.5%) | 89 (5.0%) |
| 7:30 AM to 7:59 AM | 98 (4.8%) | 268 (15.0%) |
| 8:00 AM to 8:29 AM | 110 (5.3%) | 209 (11.7%) |
| 8:30 AM to 8:59 AM | 121 (5.9%) | 166 (9.3%) |
| 9:00 AM to 9:59 AM | 39 (1.9%) | 18 (1.0%) |
| 10:00 AM to 10:59 AM | 13 (0.6%) | 19 (1.1%) |
| 11:00 AM to 11:59 AM | 37 (1.8%) | 97 (5.4%) |
| 12:00 PM to 3:59 PM | 170 (8.3%) | 175 (9.8%) |
| 4:00 PM to 11:59 PM | 113 (5.5%) | 235 (13.2%) |
| Total | 2,057 (100.0%) | 1,782 (100.0%) |
Housing Occupancy in Orting
Occupancy by Ownership in Orting
Of the total 2,869 dwellings in Orting, owner-occupied units account for 2,273 (79.2%), while renter-occupied units make up 596 (20.8%).
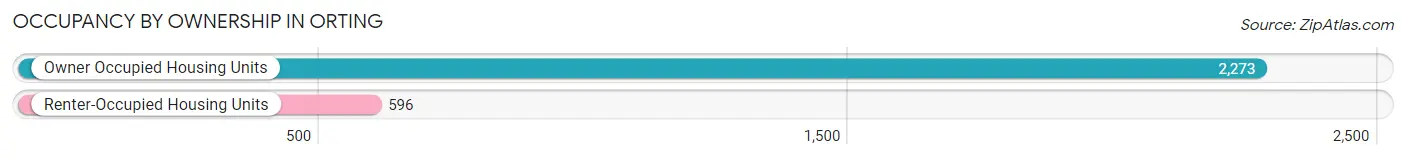
| Occupancy | # Housing Units | % Housing Units |
| Owner Occupied Housing Units | 2,273 | 79.2% |
| Renter-Occupied Housing Units | 596 | 20.8% |
| Total Occupied Housing Units | 2,869 | 100.0% |
Occupancy by Household Size in Orting
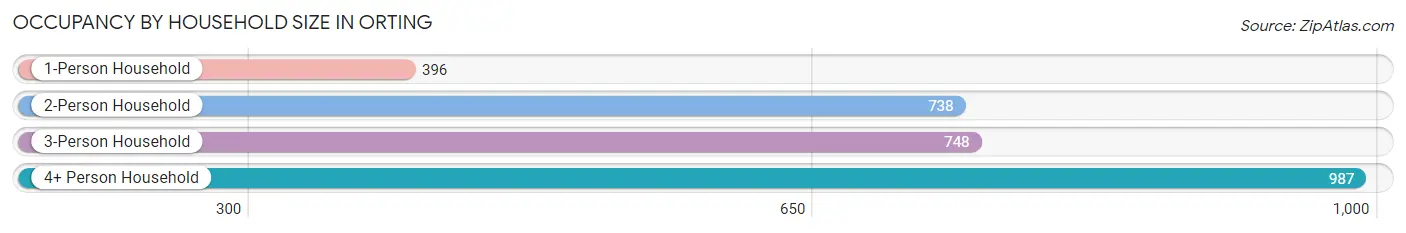
| Household Size | # Housing Units | % Housing Units |
| 1-Person Household | 396 | 13.8% |
| 2-Person Household | 738 | 25.7% |
| 3-Person Household | 748 | 26.1% |
| 4+ Person Household | 987 | 34.4% |
| Total Housing Units | 2,869 | 100.0% |
Occupancy by Ownership by Household Size in Orting
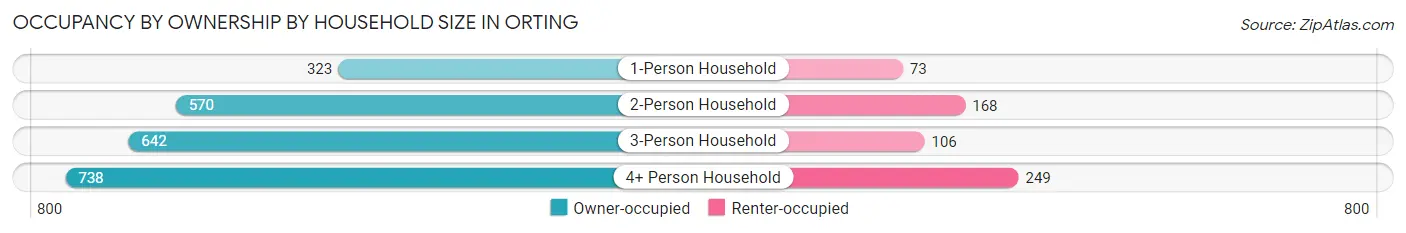
| Household Size | Owner-occupied | Renter-occupied |
| 1-Person Household | 323 (81.6%) | 73 (18.4%) |
| 2-Person Household | 570 (77.2%) | 168 (22.8%) |
| 3-Person Household | 642 (85.8%) | 106 (14.2%) |
| 4+ Person Household | 738 (74.8%) | 249 (25.2%) |
| Total Housing Units | 2,273 (79.2%) | 596 (20.8%) |
Occupancy by Educational Attainment in Orting
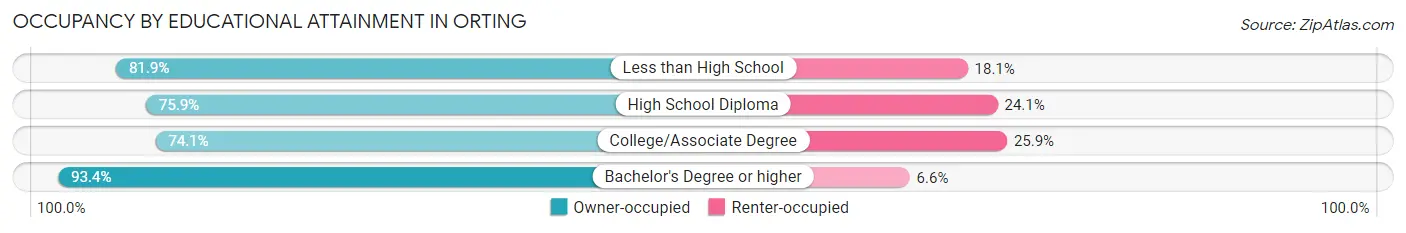
| Household Size | Owner-occupied | Renter-occupied |
| Less than High School | 140 (81.9%) | 31 (18.1%) |
| High School Diploma | 751 (75.9%) | 238 (24.1%) |
| College/Associate Degree | 820 (74.1%) | 287 (25.9%) |
| Bachelor's Degree or higher | 562 (93.4%) | 40 (6.6%) |
Occupancy by Age of Householder in Orting
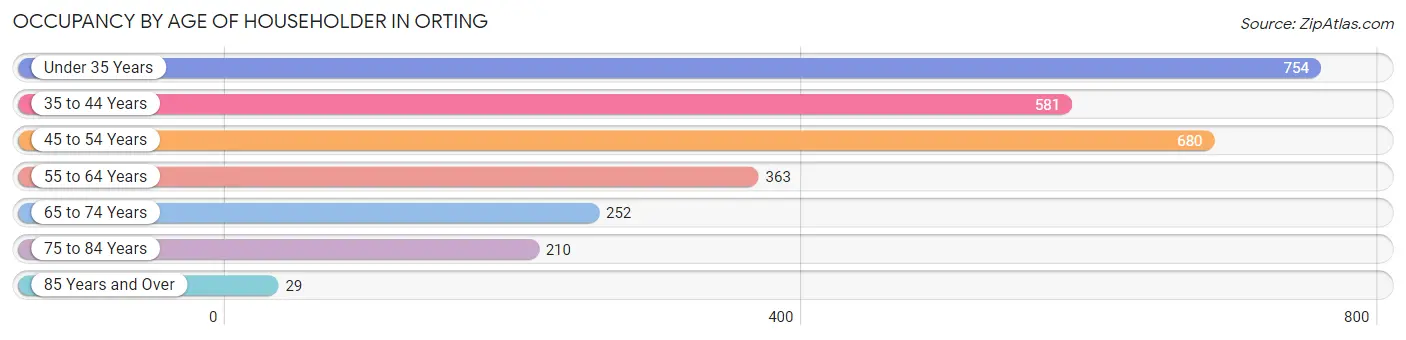
| Age Bracket | # Households | % Households |
| Under 35 Years | 754 | 26.3% |
| 35 to 44 Years | 581 | 20.3% |
| 45 to 54 Years | 680 | 23.7% |
| 55 to 64 Years | 363 | 12.7% |
| 65 to 74 Years | 252 | 8.8% |
| 75 to 84 Years | 210 | 7.3% |
| 85 Years and Over | 29 | 1.0% |
| Total | 2,869 | 100.0% |
Housing Finances in Orting
Median Income by Occupancy in Orting
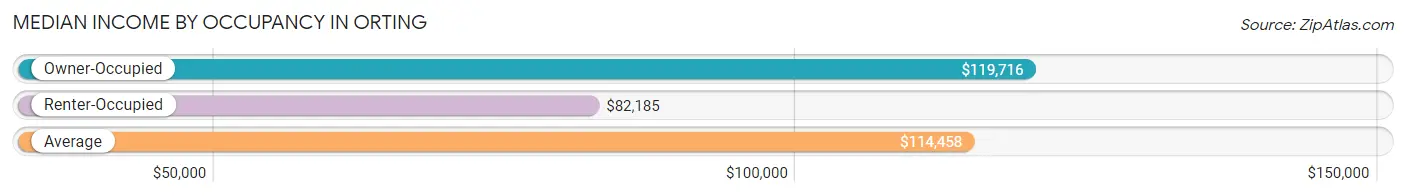
| Occupancy Type | # Households | Median Income |
| Owner-Occupied | 2,273 (79.2%) | $119,716 |
| Renter-Occupied | 596 (20.8%) | $82,185 |
| Average | 2,869 (100.0%) | $114,458 |
Occupancy by Householder Income Bracket in Orting
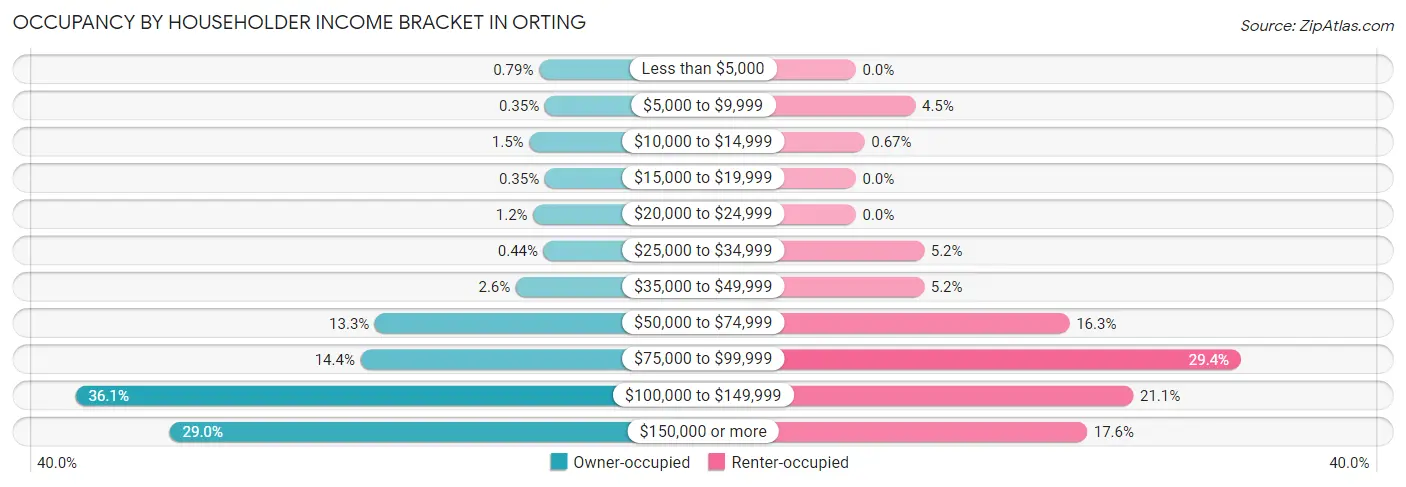
| Income Bracket | Owner-occupied | Renter-occupied |
| Less than $5,000 | 18 (0.8%) | 0 (0.0%) |
| $5,000 to $9,999 | 8 (0.4%) | 27 (4.5%) |
| $10,000 to $14,999 | 35 (1.5%) | 4 (0.7%) |
| $15,000 to $19,999 | 8 (0.4%) | 0 (0.0%) |
| $20,000 to $24,999 | 28 (1.2%) | 0 (0.0%) |
| $25,000 to $34,999 | 10 (0.4%) | 31 (5.2%) |
| $35,000 to $49,999 | 58 (2.5%) | 31 (5.2%) |
| $50,000 to $74,999 | 302 (13.3%) | 97 (16.3%) |
| $75,000 to $99,999 | 327 (14.4%) | 175 (29.4%) |
| $100,000 to $149,999 | 821 (36.1%) | 126 (21.1%) |
| $150,000 or more | 658 (28.9%) | 105 (17.6%) |
| Total | 2,273 (100.0%) | 596 (100.0%) |
Monthly Housing Cost Tiers in Orting
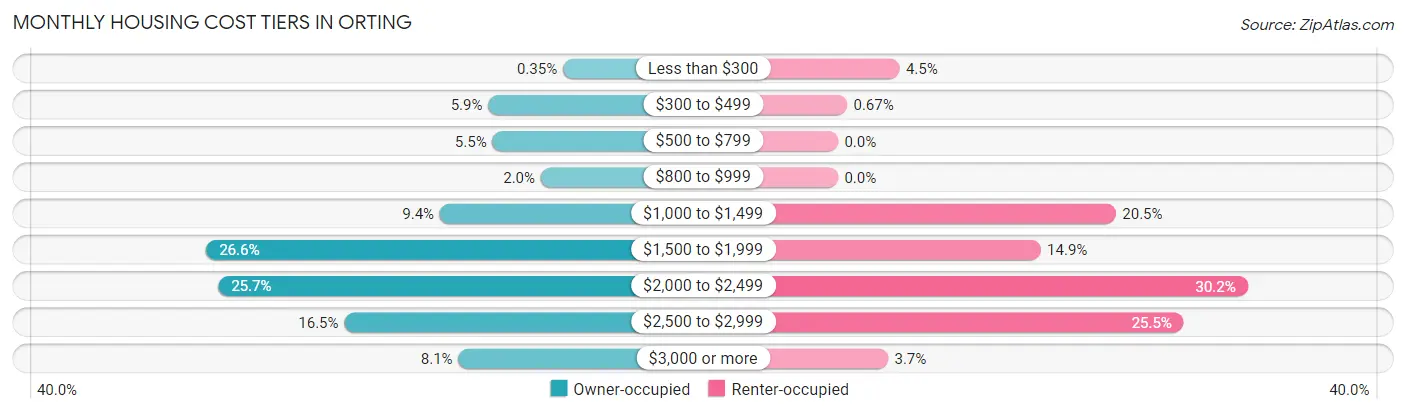
| Monthly Cost | Owner-occupied | Renter-occupied |
| Less than $300 | 8 (0.4%) | 27 (4.5%) |
| $300 to $499 | 133 (5.9%) | 4 (0.7%) |
| $500 to $799 | 126 (5.5%) | 0 (0.0%) |
| $800 to $999 | 45 (2.0%) | 0 (0.0%) |
| $1,000 to $1,499 | 214 (9.4%) | 122 (20.5%) |
| $1,500 to $1,999 | 605 (26.6%) | 89 (14.9%) |
| $2,000 to $2,499 | 585 (25.7%) | 180 (30.2%) |
| $2,500 to $2,999 | 374 (16.5%) | 152 (25.5%) |
| $3,000 or more | 183 (8.1%) | 22 (3.7%) |
| Total | 2,273 (100.0%) | 596 (100.0%) |
Physical Housing Characteristics in Orting
Housing Structures in Orting
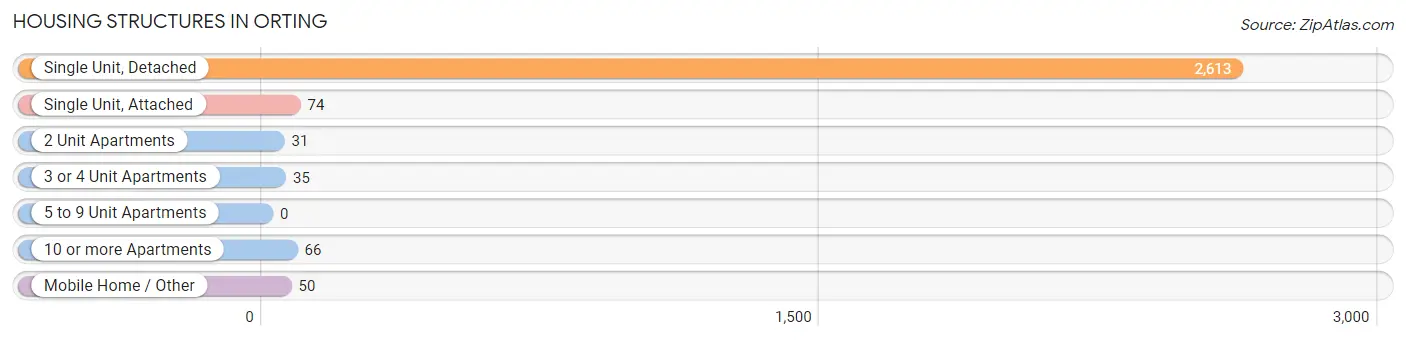
| Structure Type | # Housing Units | % Housing Units |
| Single Unit, Detached | 2,613 | 91.1% |
| Single Unit, Attached | 74 | 2.6% |
| 2 Unit Apartments | 31 | 1.1% |
| 3 or 4 Unit Apartments | 35 | 1.2% |
| 5 to 9 Unit Apartments | 0 | 0.0% |
| 10 or more Apartments | 66 | 2.3% |
| Mobile Home / Other | 50 | 1.7% |
| Total | 2,869 | 100.0% |
Housing Structures by Occupancy in Orting
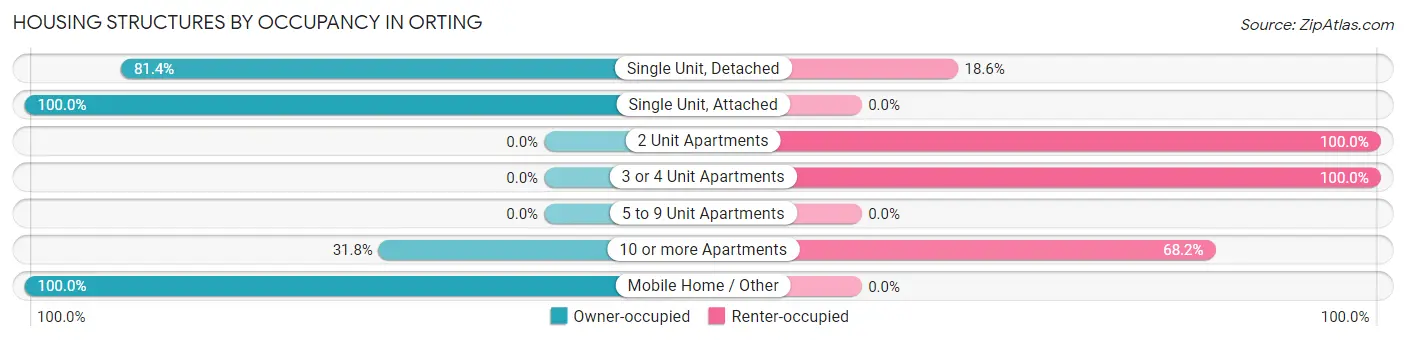
| Structure Type | Owner-occupied | Renter-occupied |
| Single Unit, Detached | 2,128 (81.4%) | 485 (18.6%) |
| Single Unit, Attached | 74 (100.0%) | 0 (0.0%) |
| 2 Unit Apartments | 0 (0.0%) | 31 (100.0%) |
| 3 or 4 Unit Apartments | 0 (0.0%) | 35 (100.0%) |
| 5 to 9 Unit Apartments | 0 (0.0%) | 0 (0.0%) |
| 10 or more Apartments | 21 (31.8%) | 45 (68.2%) |
| Mobile Home / Other | 50 (100.0%) | 0 (0.0%) |
| Total | 2,273 (79.2%) | 596 (20.8%) |
Housing Structures by Number of Rooms in Orting
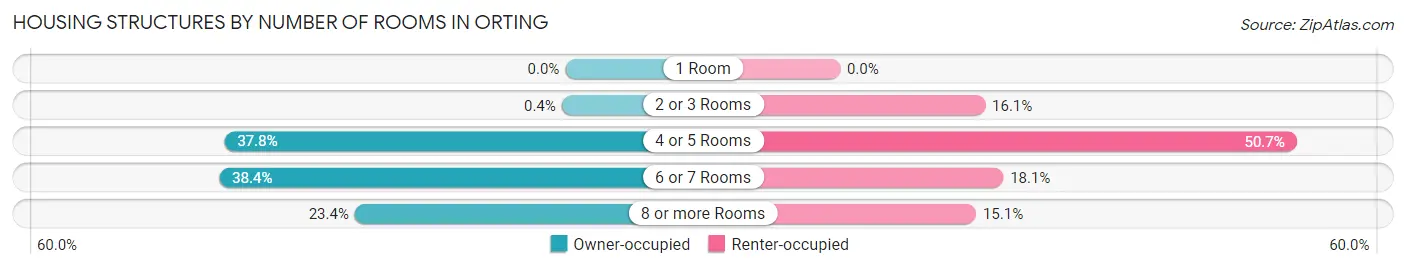
| Number of Rooms | Owner-occupied | Renter-occupied |
| 1 Room | 0 (0.0%) | 0 (0.0%) |
| 2 or 3 Rooms | 9 (0.4%) | 96 (16.1%) |
| 4 or 5 Rooms | 860 (37.8%) | 302 (50.7%) |
| 6 or 7 Rooms | 873 (38.4%) | 108 (18.1%) |
| 8 or more Rooms | 531 (23.4%) | 90 (15.1%) |
| Total | 2,273 (100.0%) | 596 (100.0%) |
Housing Structure by Heating Type in Orting
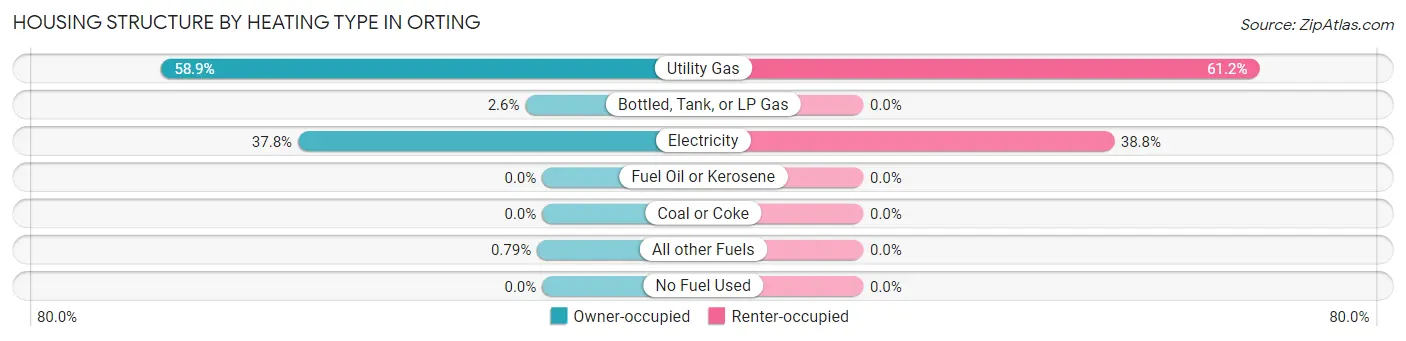
| Heating Type | Owner-occupied | Renter-occupied |
| Utility Gas | 1,338 (58.9%) | 365 (61.2%) |
| Bottled, Tank, or LP Gas | 59 (2.6%) | 0 (0.0%) |
| Electricity | 858 (37.8%) | 231 (38.8%) |
| Fuel Oil or Kerosene | 0 (0.0%) | 0 (0.0%) |
| Coal or Coke | 0 (0.0%) | 0 (0.0%) |
| All other Fuels | 18 (0.8%) | 0 (0.0%) |
| No Fuel Used | 0 (0.0%) | 0 (0.0%) |
| Total | 2,273 (100.0%) | 596 (100.0%) |
Household Vehicle Usage in Orting
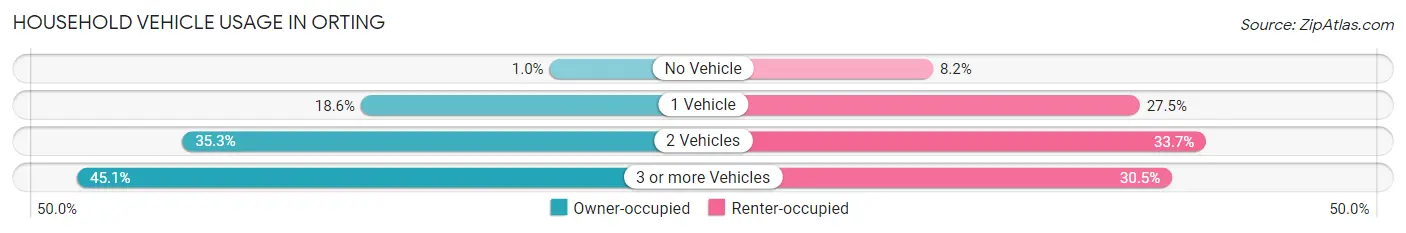
| Vehicles per Household | Owner-occupied | Renter-occupied |
| No Vehicle | 23 (1.0%) | 49 (8.2%) |
| 1 Vehicle | 423 (18.6%) | 164 (27.5%) |
| 2 Vehicles | 802 (35.3%) | 201 (33.7%) |
| 3 or more Vehicles | 1,025 (45.1%) | 182 (30.5%) |
| Total | 2,273 (100.0%) | 596 (100.0%) |
Real Estate & Mortgages in Orting
Real Estate and Mortgage Overview in Orting
| Characteristic | Without Mortgage | With Mortgage |
| Housing Units | 348 | 1,925 |
| Median Property Value | $399,000 | $416,400 |
| Median Household Income | $106,786 | $595 |
| Monthly Housing Costs | $592 | $183 |
| Real Estate Taxes | $2,763 | $99 |
Property Value by Mortgage Status in Orting
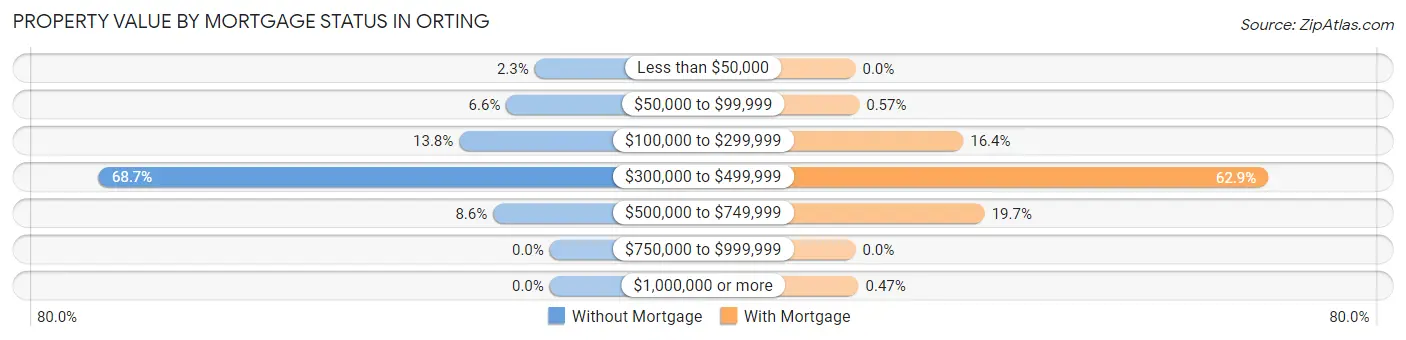
| Property Value | Without Mortgage | With Mortgage |
| Less than $50,000 | 8 (2.3%) | 0 (0.0%) |
| $50,000 to $99,999 | 23 (6.6%) | 11 (0.6%) |
| $100,000 to $299,999 | 48 (13.8%) | 316 (16.4%) |
| $300,000 to $499,999 | 239 (68.7%) | 1,210 (62.9%) |
| $500,000 to $749,999 | 30 (8.6%) | 379 (19.7%) |
| $750,000 to $999,999 | 0 (0.0%) | 0 (0.0%) |
| $1,000,000 or more | 0 (0.0%) | 9 (0.5%) |
| Total | 348 (100.0%) | 1,925 (100.0%) |
Household Income by Mortgage Status in Orting
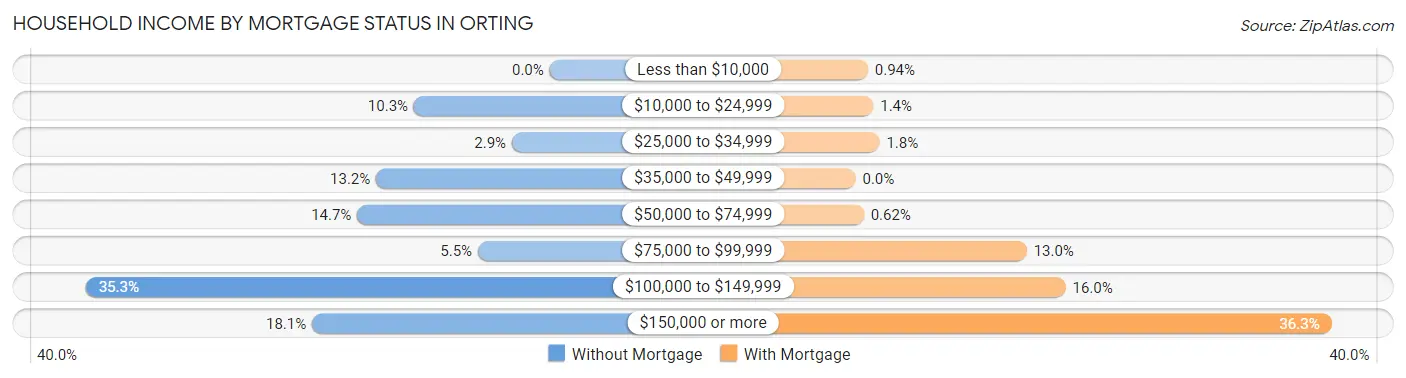
| Household Income | Without Mortgage | With Mortgage |
| Less than $10,000 | 0 (0.0%) | 18 (0.9%) |
| $10,000 to $24,999 | 36 (10.3%) | 26 (1.3%) |
| $25,000 to $34,999 | 10 (2.9%) | 35 (1.8%) |
| $35,000 to $49,999 | 46 (13.2%) | 0 (0.0%) |
| $50,000 to $74,999 | 51 (14.7%) | 12 (0.6%) |
| $75,000 to $99,999 | 19 (5.5%) | 251 (13.0%) |
| $100,000 to $149,999 | 123 (35.3%) | 308 (16.0%) |
| $150,000 or more | 63 (18.1%) | 698 (36.3%) |
| Total | 348 (100.0%) | 1,925 (100.0%) |
Property Value to Household Income Ratio in Orting
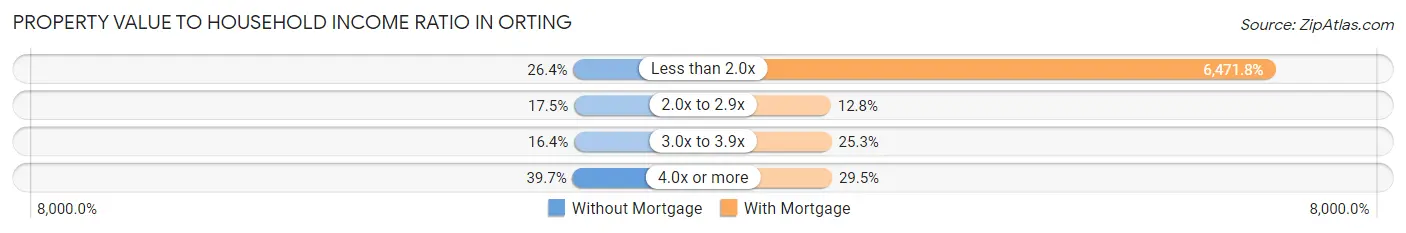
| Value-to-Income Ratio | Without Mortgage | With Mortgage |
| Less than 2.0x | 92 (26.4%) | 124,583 (6,471.8%) |
| 2.0x to 2.9x | 61 (17.5%) | 247 (12.8%) |
| 3.0x to 3.9x | 57 (16.4%) | 487 (25.3%) |
| 4.0x or more | 138 (39.7%) | 567 (29.4%) |
| Total | 348 (100.0%) | 1,925 (100.0%) |
Real Estate Taxes by Mortgage Status in Orting
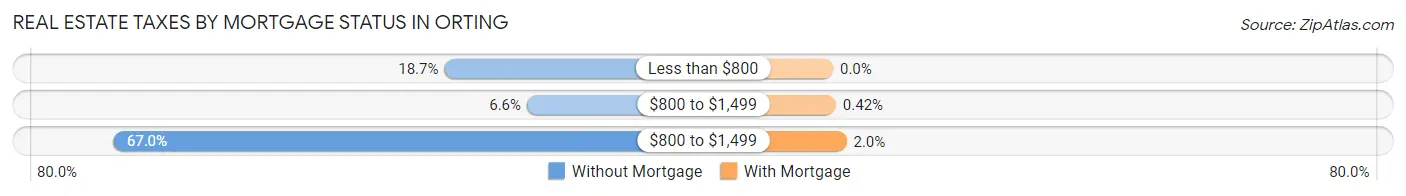
| Property Taxes | Without Mortgage | With Mortgage |
| Less than $800 | 65 (18.7%) | 0 (0.0%) |
| $800 to $1,499 | 23 (6.6%) | 8 (0.4%) |
| $800 to $1,499 | 233 (66.9%) | 38 (2.0%) |
| Total | 348 (100.0%) | 1,925 (100.0%) |
Health & Disability in Orting
Health Insurance Coverage by Age in Orting
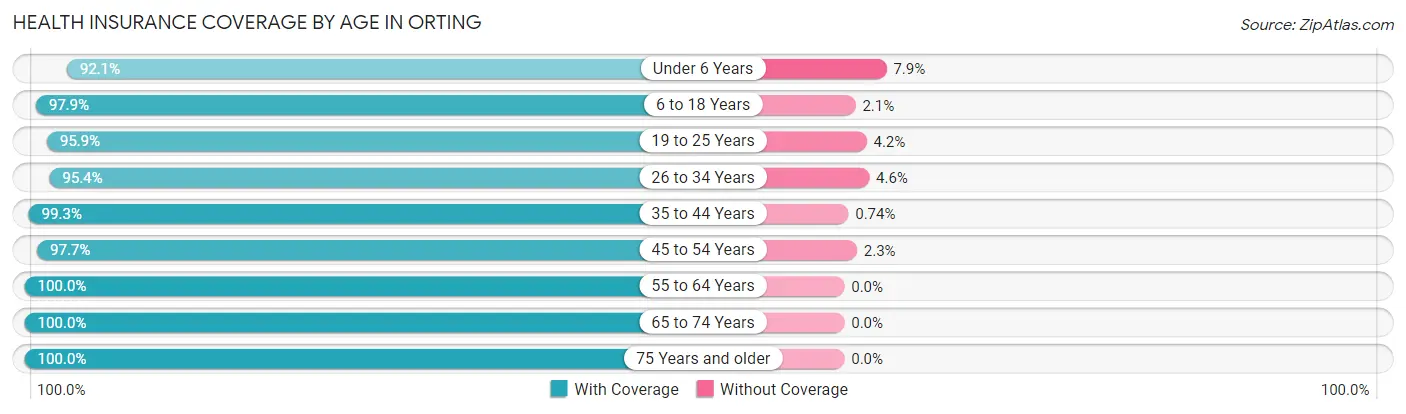
| Age Bracket | With Coverage | Without Coverage |
| Under 6 Years | 796 (92.1%) | 68 (7.9%) |
| 6 to 18 Years | 1,549 (97.9%) | 33 (2.1%) |
| 19 to 25 Years | 809 (95.9%) | 35 (4.2%) |
| 26 to 34 Years | 1,322 (95.4%) | 64 (4.6%) |
| 35 to 44 Years | 1,205 (99.3%) | 9 (0.7%) |
| 45 to 54 Years | 1,295 (97.7%) | 31 (2.3%) |
| 55 to 64 Years | 690 (100.0%) | 0 (0.0%) |
| 65 to 74 Years | 451 (100.0%) | 0 (0.0%) |
| 75 Years and older | 366 (100.0%) | 0 (0.0%) |
| Total | 8,483 (97.3%) | 240 (2.8%) |
Health Insurance Coverage by Citizenship Status in Orting
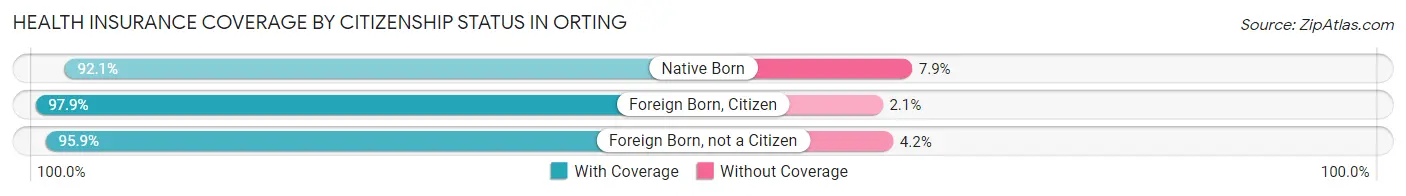
| Citizenship Status | With Coverage | Without Coverage |
| Native Born | 796 (92.1%) | 68 (7.9%) |
| Foreign Born, Citizen | 1,549 (97.9%) | 33 (2.1%) |
| Foreign Born, not a Citizen | 809 (95.9%) | 35 (4.2%) |
Health Insurance Coverage by Household Income in Orting
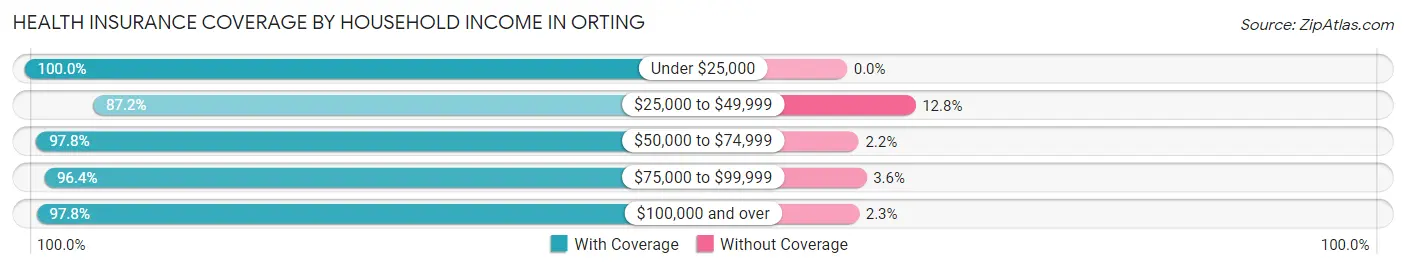
| Household Income | With Coverage | Without Coverage |
| Under $25,000 | 174 (100.0%) | 0 (0.0%) |
| $25,000 to $49,999 | 238 (87.2%) | 35 (12.8%) |
| $50,000 to $74,999 | 848 (97.8%) | 19 (2.2%) |
| $75,000 to $99,999 | 1,322 (96.4%) | 50 (3.6%) |
| $100,000 and over | 5,896 (97.8%) | 136 (2.2%) |
Public vs Private Health Insurance Coverage by Age in Orting
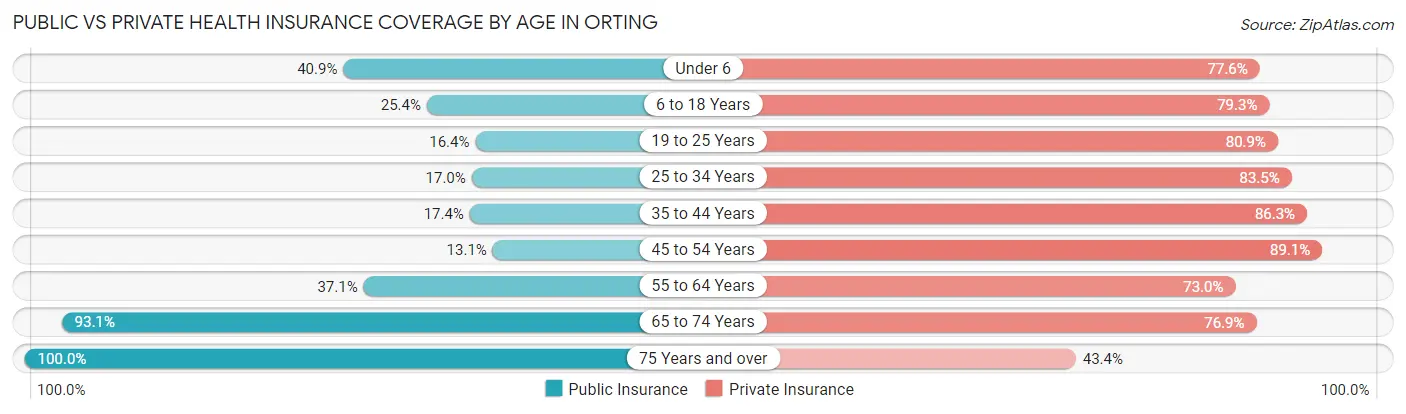
| Age Bracket | Public Insurance | Private Insurance |
| Under 6 | 353 (40.9%) | 670 (77.5%) |
| 6 to 18 Years | 401 (25.4%) | 1,255 (79.3%) |
| 19 to 25 Years | 138 (16.4%) | 683 (80.9%) |
| 25 to 34 Years | 236 (17.0%) | 1,157 (83.5%) |
| 35 to 44 Years | 211 (17.4%) | 1,048 (86.3%) |
| 45 to 54 Years | 174 (13.1%) | 1,182 (89.1%) |
| 55 to 64 Years | 256 (37.1%) | 504 (73.0%) |
| 65 to 74 Years | 420 (93.1%) | 347 (76.9%) |
| 75 Years and over | 366 (100.0%) | 159 (43.4%) |
| Total | 2,555 (29.3%) | 7,005 (80.3%) |
Disability Status by Sex by Age in Orting
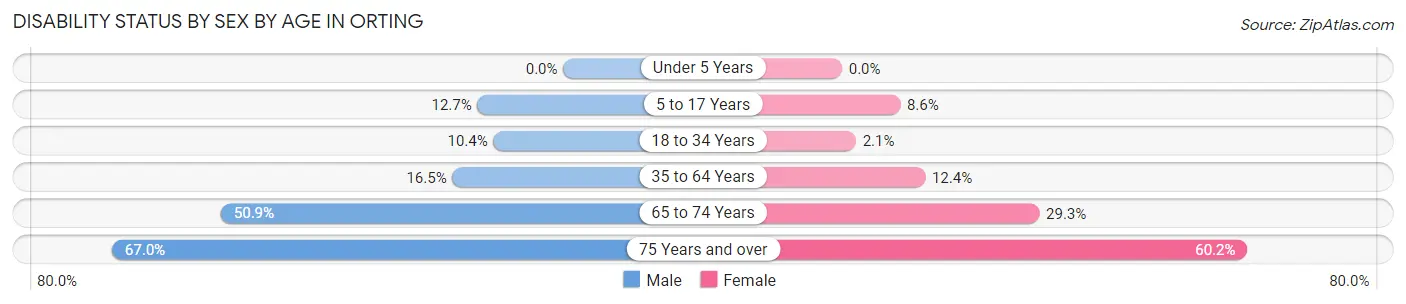
| Age Bracket | Male | Female |
| Under 5 Years | 0 (0.0%) | 0 (0.0%) |
| 5 to 17 Years | 86 (12.7%) | 76 (8.6%) |
| 18 to 34 Years | 134 (10.4%) | 23 (2.1%) |
| 35 to 64 Years | 249 (16.5%) | 212 (12.3%) |
| 65 to 74 Years | 120 (50.8%) | 63 (29.3%) |
| 75 Years and over | 124 (67.0%) | 109 (60.2%) |
Disability Class by Sex by Age in Orting
Disability Class: Hearing Difficulty
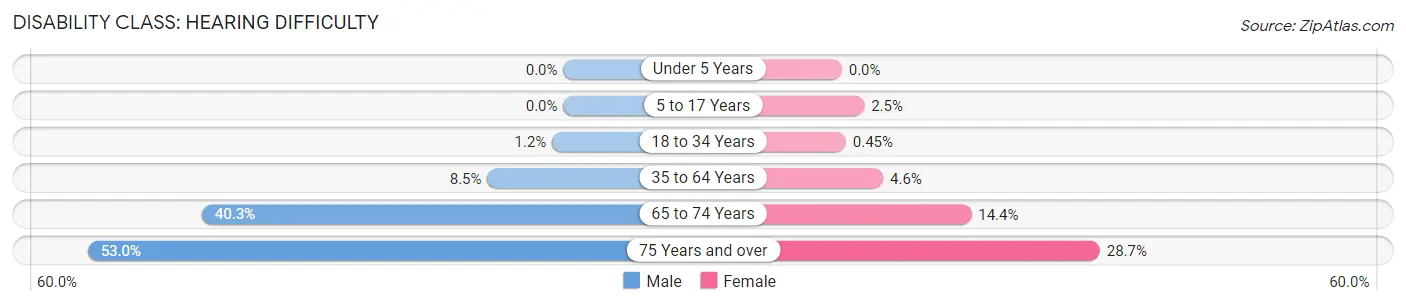
| Age Bracket | Male | Female |
| Under 5 Years | 0 (0.0%) | 0 (0.0%) |
| 5 to 17 Years | 0 (0.0%) | 22 (2.5%) |
| 18 to 34 Years | 16 (1.2%) | 5 (0.4%) |
| 35 to 64 Years | 128 (8.5%) | 79 (4.6%) |
| 65 to 74 Years | 95 (40.3%) | 31 (14.4%) |
| 75 Years and over | 98 (53.0%) | 52 (28.7%) |
Disability Class: Vision Difficulty
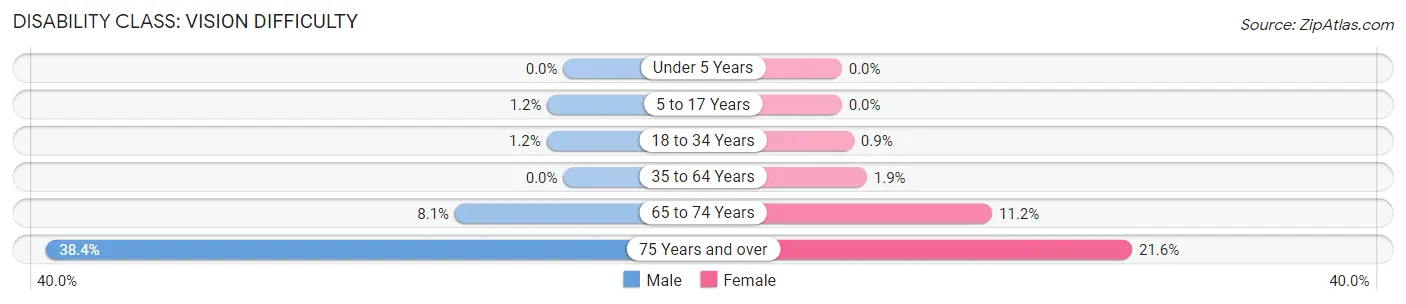
| Age Bracket | Male | Female |
| Under 5 Years | 0 (0.0%) | 0 (0.0%) |
| 5 to 17 Years | 8 (1.2%) | 0 (0.0%) |
| 18 to 34 Years | 16 (1.2%) | 10 (0.9%) |
| 35 to 64 Years | 0 (0.0%) | 32 (1.9%) |
| 65 to 74 Years | 19 (8.1%) | 24 (11.2%) |
| 75 Years and over | 71 (38.4%) | 39 (21.5%) |
Disability Class: Cognitive Difficulty
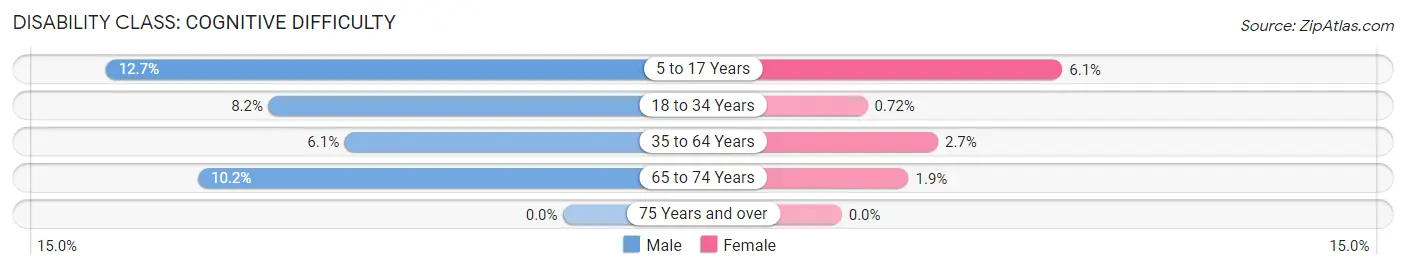
| Age Bracket | Male | Female |
| 5 to 17 Years | 86 (12.7%) | 54 (6.1%) |
| 18 to 34 Years | 106 (8.2%) | 8 (0.7%) |
| 35 to 64 Years | 92 (6.1%) | 46 (2.7%) |
| 65 to 74 Years | 24 (10.2%) | 4 (1.9%) |
| 75 Years and over | 0 (0.0%) | 0 (0.0%) |
Disability Class: Ambulatory Difficulty
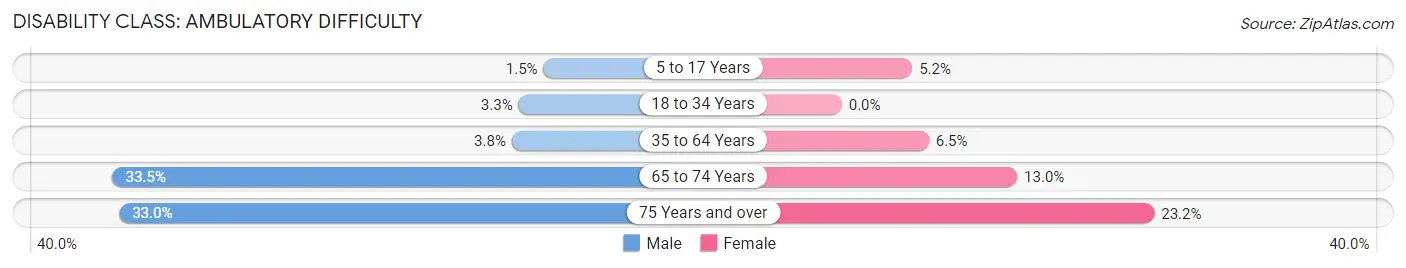
| Age Bracket | Male | Female |
| 5 to 17 Years | 10 (1.5%) | 46 (5.2%) |
| 18 to 34 Years | 43 (3.3%) | 0 (0.0%) |
| 35 to 64 Years | 58 (3.8%) | 111 (6.5%) |
| 65 to 74 Years | 79 (33.5%) | 28 (13.0%) |
| 75 Years and over | 61 (33.0%) | 42 (23.2%) |
Disability Class: Self-Care Difficulty
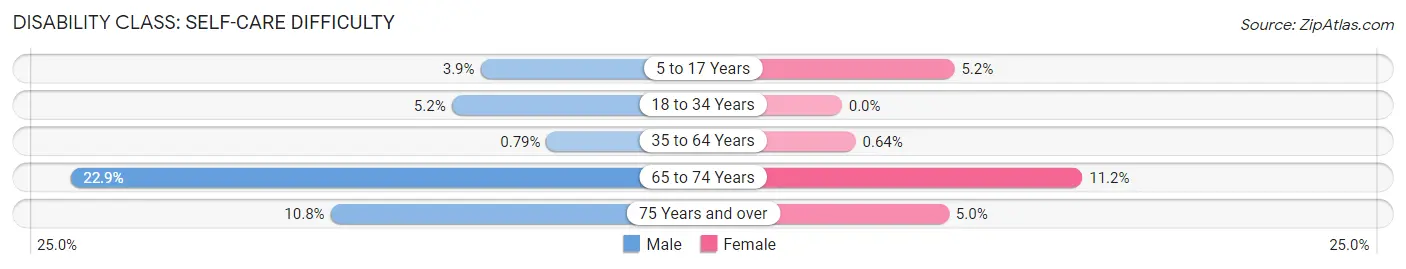
| Age Bracket | Male | Female |
| 5 to 17 Years | 26 (3.8%) | 46 (5.2%) |
| 18 to 34 Years | 67 (5.2%) | 0 (0.0%) |
| 35 to 64 Years | 12 (0.8%) | 11 (0.6%) |
| 65 to 74 Years | 54 (22.9%) | 24 (11.2%) |
| 75 Years and over | 20 (10.8%) | 9 (5.0%) |
Technology Access in Orting
Computing Device Access in Orting
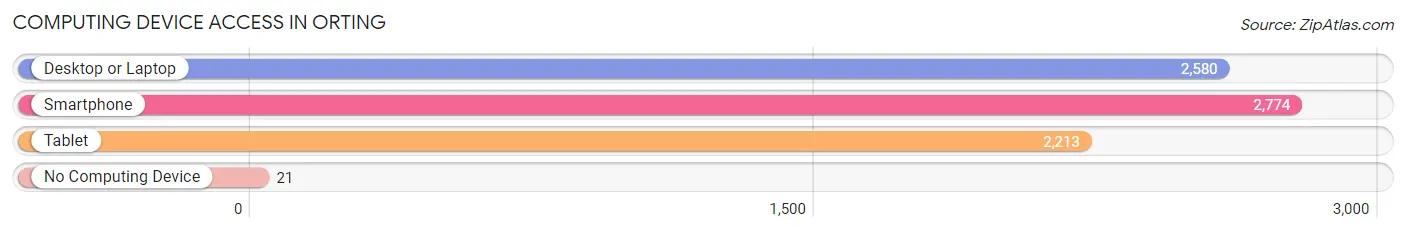
| Device Type | # Households | % Households |
| Desktop or Laptop | 2,580 | 89.9% |
| Smartphone | 2,774 | 96.7% |
| Tablet | 2,213 | 77.1% |
| No Computing Device | 21 | 0.7% |
| Total | 2,869 | 100.0% |
Internet Access in Orting
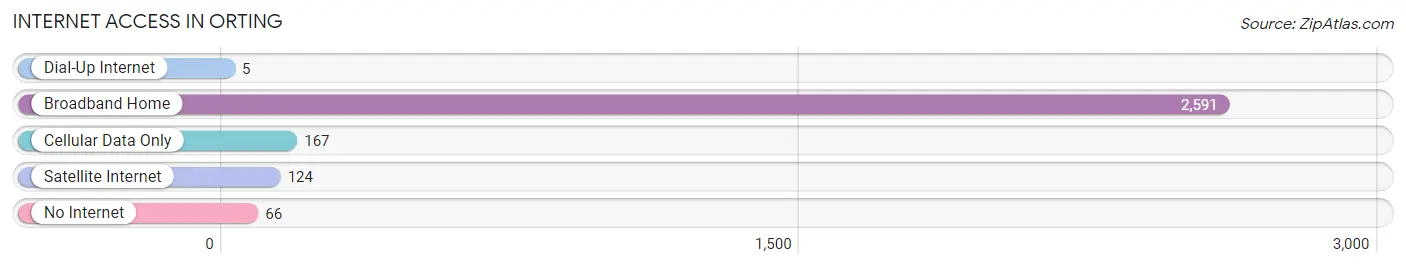
| Internet Type | # Households | % Households |
| Dial-Up Internet | 5 | 0.2% |
| Broadband Home | 2,591 | 90.3% |
| Cellular Data Only | 167 | 5.8% |
| Satellite Internet | 124 | 4.3% |
| No Internet | 66 | 2.3% |
| Total | 2,869 | 100.0% |
Orting Summary
Orting, Washington is a small city located in Pierce County, Washington, United States. It is situated along the Carbon River, approximately 25 miles southeast of Tacoma and 35 miles south of Seattle. The city has a population of approximately 8,000 people and covers an area of 4.2 square miles.
History
The area that is now Orting was first inhabited by the Puyallup Tribe of Native Americans. The first non-native settlers arrived in the area in the late 1850s, and the town was officially incorporated in 1889. The town was named after the Puyallup word for “prairie”, and was originally a farming community.
In the early 1900s, the town began to grow as the Northern Pacific Railway built a line through the area. This allowed for the transportation of goods and people, and the town began to develop. The town was also home to a number of coal mines, which provided employment for many of the residents.
In the 1950s, the town began to experience a decline in population as the coal mines closed and the railroad line was abandoned. However, in the late 1970s, the town began to experience a resurgence as the nearby cities of Tacoma and Seattle began to experience population growth. This led to an influx of new residents to the area, and the town began to experience a period of growth.
Geography
Orting is located in the foothills of the Cascade Mountains, and is situated along the Carbon River. The city is surrounded by a number of small lakes, including Lake Kapowsin, Lake Tapps, and Lake Tanwax. The city is also home to a number of parks, including Orting City Park, which features a playground, picnic areas, and a walking trail.
The climate in Orting is mild, with temperatures ranging from the mid-30s in the winter to the mid-80s in the summer. The city receives an average of 37 inches of precipitation per year, with most of it falling in the winter months.
Economy
The economy of Orting is largely based on the service industry, with a number of restaurants, retail stores, and other businesses located in the city. The city is also home to a number of manufacturing companies, including a paper mill and a wood products plant.
The city is also home to a number of government agencies, including the Orting School District, the Orting Police Department, and the Orting Fire Department.
Demographics
As of the 2010 census, the population of Orting was 8,110. The racial makeup of the city was 79.3% White, 8.2% Hispanic or Latino, 6.2% Asian, 4.2% African American, and 2.3% Native American. The median household income was $50,945, and the median age was 36.
Conclusion
Orting, Washington is a small city located in Pierce County, Washington, United States. It is situated along the Carbon River, approximately 25 miles southeast of Tacoma and 35 miles south of Seattle. The city has a population of approximately 8,000 people and covers an area of 4.2 square miles. The economy of Orting is largely based on the service industry, with a number of restaurants, retail stores, and other businesses located in the city. The city is also home to a number of government agencies, including the Orting School District, the Orting Police Department, and the Orting Fire Department. As of the 2010 census, the population of Orting was 8,110. The racial makeup of the city was 79.3% White, 8.2% Hispanic or Latino, 6.2% Asian, 4.2% African American, and 2.3% Native American. The median household income was $50,945, and the median age was 36.
Common Questions
What is Per Capita Income in Orting?
Per Capita income in Orting is $41,701.
What is the Median Family Income in Orting?
Median Family Income in Orting is $108,879.
What is the Median Household income in Orting?
Median Household Income in Orting is $114,458.
What is Income or Wage Gap in Orting?
Income or Wage Gap in Orting is 46.4%.
Women in Orting earn 53.6 cents for every dollar earned by a man.
What is Family Income Deficit in Orting?
Family Income Deficit in Orting is $12,231.
Families that are below poverty line in Orting earn $12,231 less on average than the poverty threshold level.
What is Inequality or Gini Index in Orting?
Inequality or Gini Index in Orting is 0.31.
What is the Total Population of Orting?
Total Population of Orting is 8,898.
What is the Total Male Population of Orting?
Total Male Population of Orting is 4,283.
What is the Total Female Population of Orting?
Total Female Population of Orting is 4,615.
What is the Ratio of Males per 100 Females in Orting?
There are 92.81 Males per 100 Females in Orting.
What is the Ratio of Females per 100 Males in Orting?
There are 107.75 Females per 100 Males in Orting.
What is the Median Population Age in Orting?
Median Population Age in Orting is 34.1 Years.
What is the Average Family Size in Orting
Average Family Size in Orting is 3.2 People.
What is the Average Household Size in Orting
Average Household Size in Orting is 3.0 People.
How Large is the Labor Force in Orting?
There are 4,756 People in the Labor Forcein in Orting.
What is the Percentage of People in the Labor Force in Orting?
69.4% of People are in the Labor Force in Orting.
What is the Unemployment Rate in Orting?
Unemployment Rate in Orting is 3.9%.