Eatonville, WA Map & Demographics
Eatonville Map
Eatonville Overview
$36,835
PER CAPITA INCOME
$100,250
AVG FAMILY INCOME
$104,583
AVG HOUSEHOLD INCOME
40.5%
WAGE / INCOME GAP [ % ]
59.5¢/ $1
WAGE / INCOME GAP [ $ ]
$9,168
FAMILY INCOME DEFICIT
0.37
INEQUALITY / GINI INDEX
2,845
TOTAL POPULATION
1,310
MALE POPULATION
1,535
FEMALE POPULATION
85.34
MALES / 100 FEMALES
117.18
FEMALES / 100 MALES
28.5
MEDIAN AGE
3.4
AVG FAMILY SIZE
3.1
AVG HOUSEHOLD SIZE
1,475
LABOR FORCE [ PEOPLE ]
73.3%
PERCENT IN LABOR FORCE
5.0%
UNEMPLOYMENT RATE
Eatonville Zip Codes
Income in Eatonville
Income Overview in Eatonville
Per Capita Income in Eatonville is $36,835, while median incomes of families and households are $100,250 and $104,583 respectively.
| Characteristic | Number | Measure |
| Per Capita Income | 2,845 | $36,835 |
| Median Family Income | 719 | $100,250 |
| Mean Family Income | 719 | $102,990 |
| Median Household Income | 914 | $104,583 |
| Mean Household Income | 914 | $112,736 |
| Income Deficit | 719 | $9,168 |
| Wage / Income Gap (%) | 2,845 | 40.46% |
| Wage / Income Gap ($) | 2,845 | 59.54¢ per $1 |
| Gini / Inequality Index | 2,845 | 0.37 |
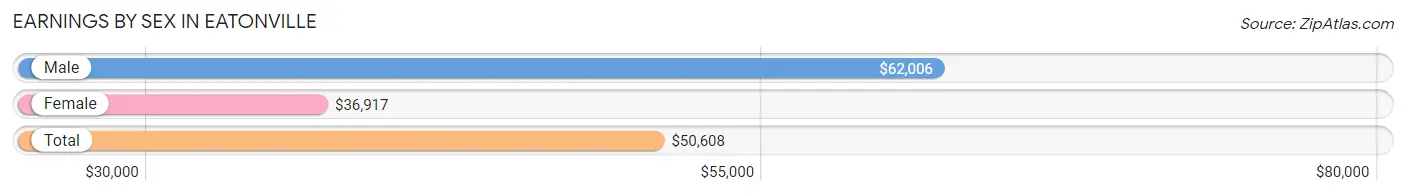
Earnings by Sex in Eatonville
Average Earnings in Eatonville are $50,608, $62,006 for men and $36,917 for women, a difference of 40.5%.
| Sex | Number | Average Earnings |
| Male | 719 (47.6%) | $62,006 |
| Female | 791 (52.4%) | $36,917 |
| Total | 1,510 (100.0%) | $50,608 |
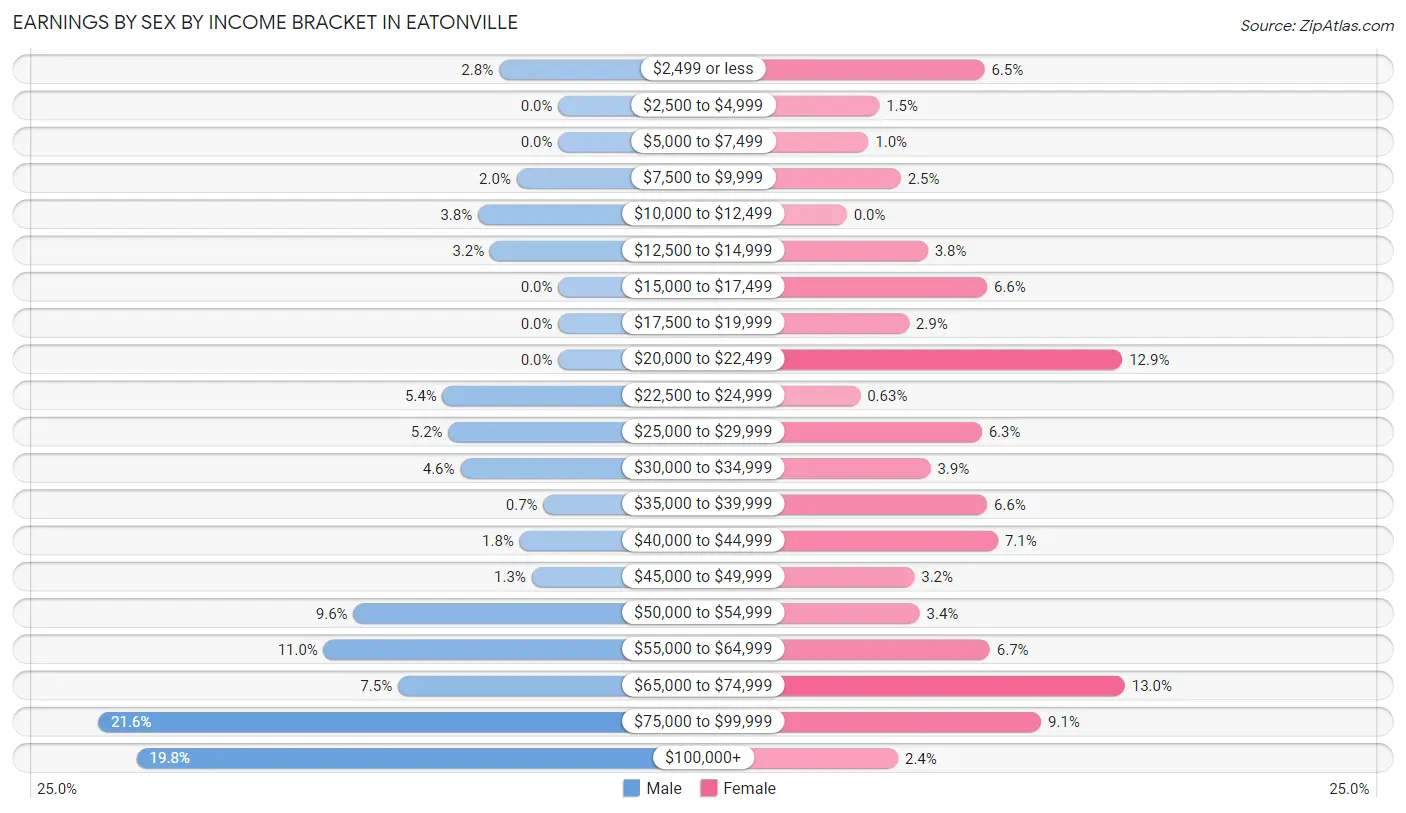
Earnings by Sex by Income Bracket in Eatonville
The most common earnings brackets in Eatonville are $75,000 to $99,999 for men (155 | 21.6%) and $65,000 to $74,999 for women (103 | 13.0%).
| Income | Male | Female |
| $2,499 or less | 20 (2.8%) | 51 (6.5%) |
| $2,500 to $4,999 | 0 (0.0%) | 12 (1.5%) |
| $5,000 to $7,499 | 0 (0.0%) | 8 (1.0%) |
| $7,500 to $9,999 | 14 (1.9%) | 20 (2.5%) |
| $10,000 to $12,499 | 27 (3.8%) | 0 (0.0%) |
| $12,500 to $14,999 | 23 (3.2%) | 30 (3.8%) |
| $15,000 to $17,499 | 0 (0.0%) | 52 (6.6%) |
| $17,500 to $19,999 | 0 (0.0%) | 23 (2.9%) |
| $20,000 to $22,499 | 0 (0.0%) | 102 (12.9%) |
| $22,500 to $24,999 | 39 (5.4%) | 5 (0.6%) |
| $25,000 to $29,999 | 37 (5.1%) | 50 (6.3%) |
| $30,000 to $34,999 | 33 (4.6%) | 31 (3.9%) |
| $35,000 to $39,999 | 5 (0.7%) | 52 (6.6%) |
| $40,000 to $44,999 | 13 (1.8%) | 56 (7.1%) |
| $45,000 to $49,999 | 9 (1.3%) | 25 (3.2%) |
| $50,000 to $54,999 | 69 (9.6%) | 27 (3.4%) |
| $55,000 to $64,999 | 79 (11.0%) | 53 (6.7%) |
| $65,000 to $74,999 | 54 (7.5%) | 103 (13.0%) |
| $75,000 to $99,999 | 155 (21.6%) | 72 (9.1%) |
| $100,000+ | 142 (19.8%) | 19 (2.4%) |
| Total | 719 (100.0%) | 791 (100.0%) |
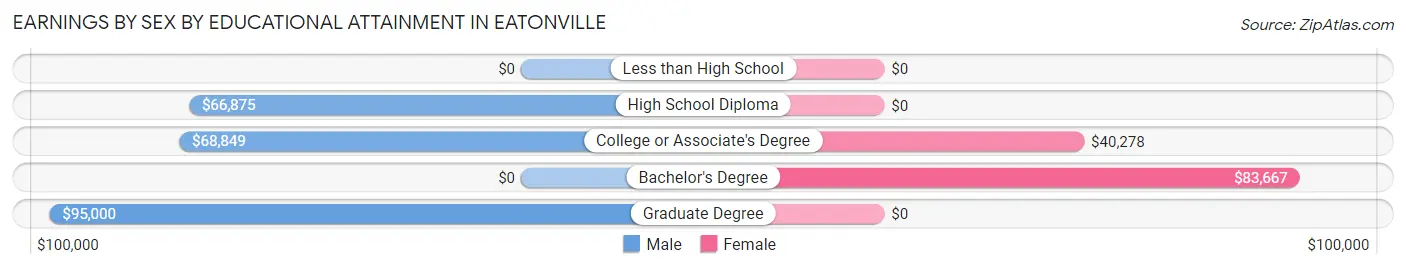
Earnings by Sex by Educational Attainment in Eatonville
Average earnings in Eatonville are $68,322 for men and $43,015 for women, a difference of 37.0%. Men with an educational attainment of graduate degree enjoy the highest average annual earnings of $95,000, while those with high school diploma education earn the least with $66,875. Women with an educational attainment of bachelor's degree earn the most with the average annual earnings of $83,667, while those with college or associate's degree education have the smallest earnings of $40,278.
| Educational Attainment | Male Income | Female Income |
| Less than High School | - | - |
| High School Diploma | $66,875 | $0 |
| College or Associate's Degree | $68,849 | $40,278 |
| Bachelor's Degree | - | - |
| Graduate Degree | $95,000 | $0 |
| Total | $68,322 | $43,015 |
Family Income in Eatonville
Family Income Brackets in Eatonville
According to the Eatonville family income data, there are 196 families falling into the $100,000 to $149,999 income range, which is the most common income bracket and makes up 27.3% of all families.
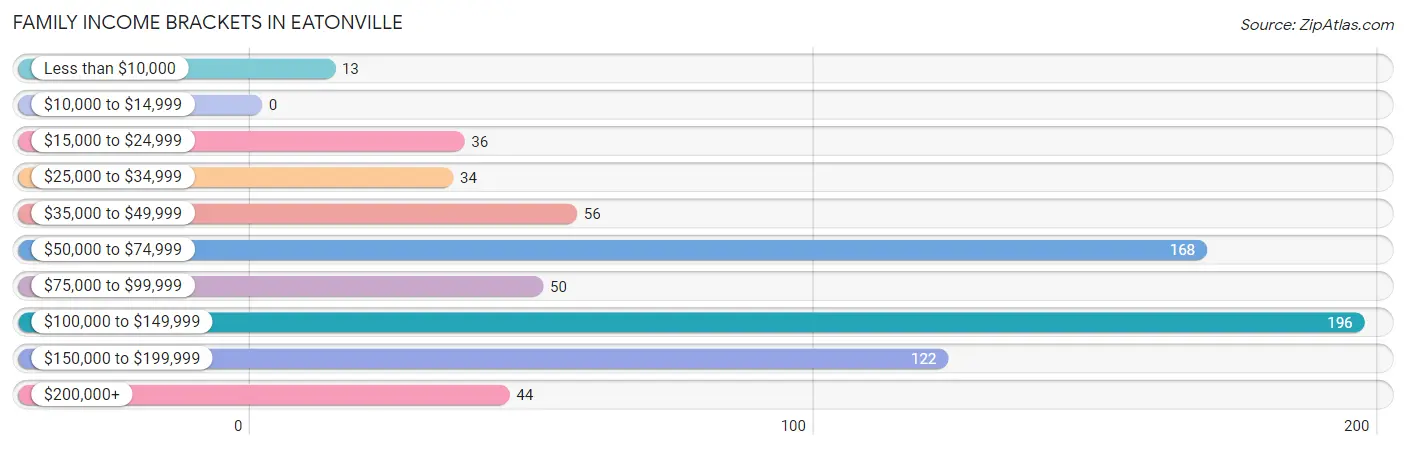
| Income Bracket | # Families | % Families |
| Less than $10,000 | 13 | 1.8% |
| $10,000 to $14,999 | 0 | 0.0% |
| $15,000 to $24,999 | 36 | 5.0% |
| $25,000 to $34,999 | 34 | 4.7% |
| $35,000 to $49,999 | 56 | 7.8% |
| $50,000 to $74,999 | 168 | 23.4% |
| $75,000 to $99,999 | 50 | 7.0% |
| $100,000 to $149,999 | 196 | 27.3% |
| $150,000 to $199,999 | 122 | 17.0% |
| $200,000+ | 44 | 6.1% |
Family Income by Famaliy Size in Eatonville
5-person families (108 | 15.0%) account for the highest median family income in Eatonville with $185,423 per family, while 2-person families (254 | 35.3%) have the highest median income of $38,214 per family member.
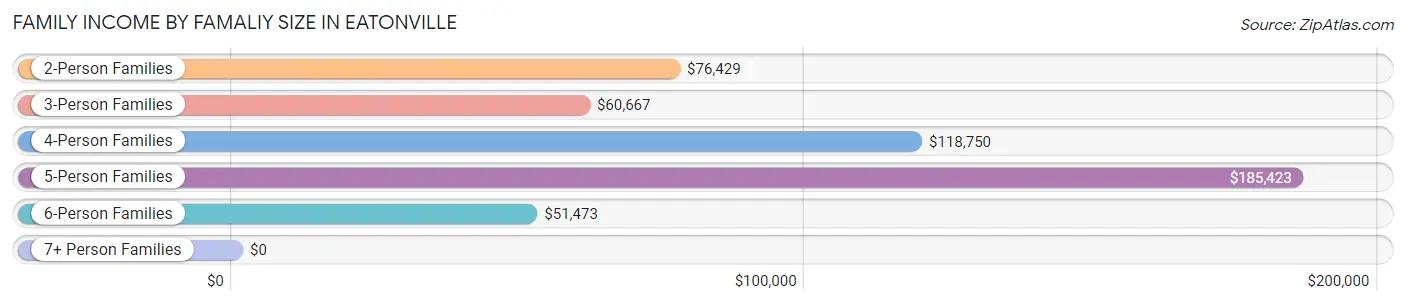
| Income Bracket | # Families | Median Income |
| 2-Person Families | 254 (35.3%) | $76,429 |
| 3-Person Families | 220 (30.6%) | $60,667 |
| 4-Person Families | 79 (11.0%) | $118,750 |
| 5-Person Families | 108 (15.0%) | $185,423 |
| 6-Person Families | 47 (6.5%) | $51,473 |
| 7+ Person Families | 11 (1.5%) | $0 |
| Total | 719 (100.0%) | $100,250 |
Family Income by Number of Earners in Eatonville
The median family income in Eatonville is $100,250, with families comprising 3+ earners (121) having the highest median family income of $186,019, while families with 1 earner (281) have the lowest median family income of $52,188, accounting for 16.8% and 39.1% of families, respectively.
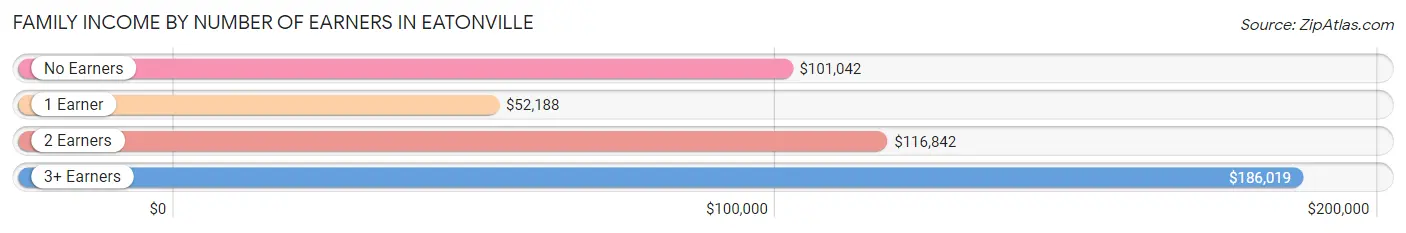
| Number of Earners | # Families | Median Income |
| No Earners | 81 (11.3%) | $101,042 |
| 1 Earner | 281 (39.1%) | $52,188 |
| 2 Earners | 236 (32.8%) | $116,842 |
| 3+ Earners | 121 (16.8%) | $186,019 |
| Total | 719 (100.0%) | $100,250 |
Household Income in Eatonville
Household Income Brackets in Eatonville
With 263 households falling in the category, the $100,000 to $149,999 income range is the most frequent in Eatonville, accounting for 28.8% of all households. In contrast, only 5 households (0.5%) fall into the less than $10,000 income bracket, making it the least populous group.
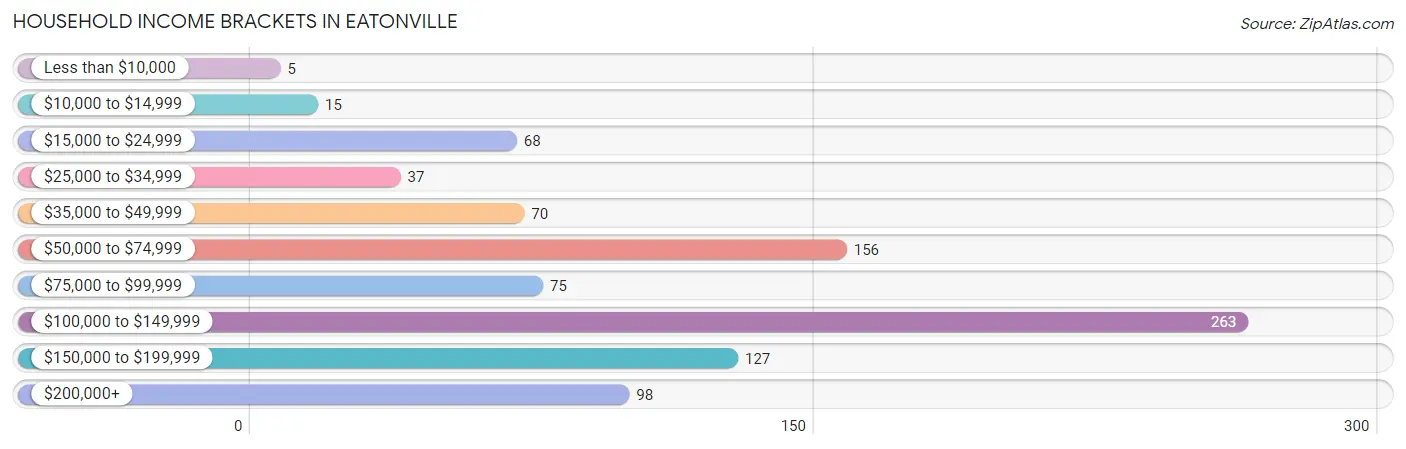
| Income Bracket | # Households | % Households |
| Less than $10,000 | 5 | 0.5% |
| $10,000 to $14,999 | 15 | 1.6% |
| $15,000 to $24,999 | 68 | 7.4% |
| $25,000 to $34,999 | 37 | 4.0% |
| $35,000 to $49,999 | 70 | 7.7% |
| $50,000 to $74,999 | 156 | 17.1% |
| $75,000 to $99,999 | 75 | 8.2% |
| $100,000 to $149,999 | 263 | 28.8% |
| $150,000 to $199,999 | 127 | 13.9% |
| $200,000+ | 98 | 10.7% |
Household Income by Householder Age in Eatonville
The median household income in Eatonville is $104,583, with the highest median household income of $117,375 found in the 25 to 44 years age bracket for the primary householder. A total of 391 households (42.8%) fall into this category. Meanwhile, the 15 to 24 years age bracket for the primary householder has the lowest median household income of $0, with 44 households (4.8%) in this group.
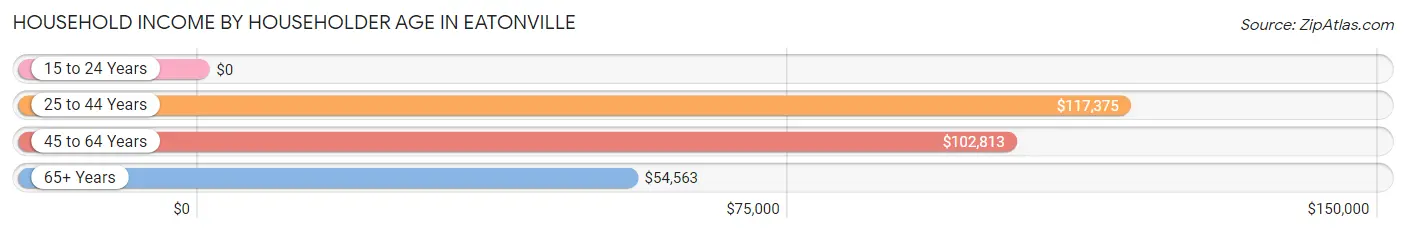
| Income Bracket | # Households | Median Income |
| 15 to 24 Years | 44 (4.8%) | $0 |
| 25 to 44 Years | 391 (42.8%) | $117,375 |
| 45 to 64 Years | 322 (35.2%) | $102,813 |
| 65+ Years | 157 (17.2%) | $54,563 |
| Total | 914 (100.0%) | $104,583 |
Poverty in Eatonville
Income Below Poverty by Sex and Age in Eatonville
With 5.2% poverty level for males and 8.7% for females among the residents of Eatonville, 6 to 11 year old males and 65 to 74 year old females are the most vulnerable to poverty, with 34 males (19.5%) and 27 females (22.5%) in their respective age groups living below the poverty level.
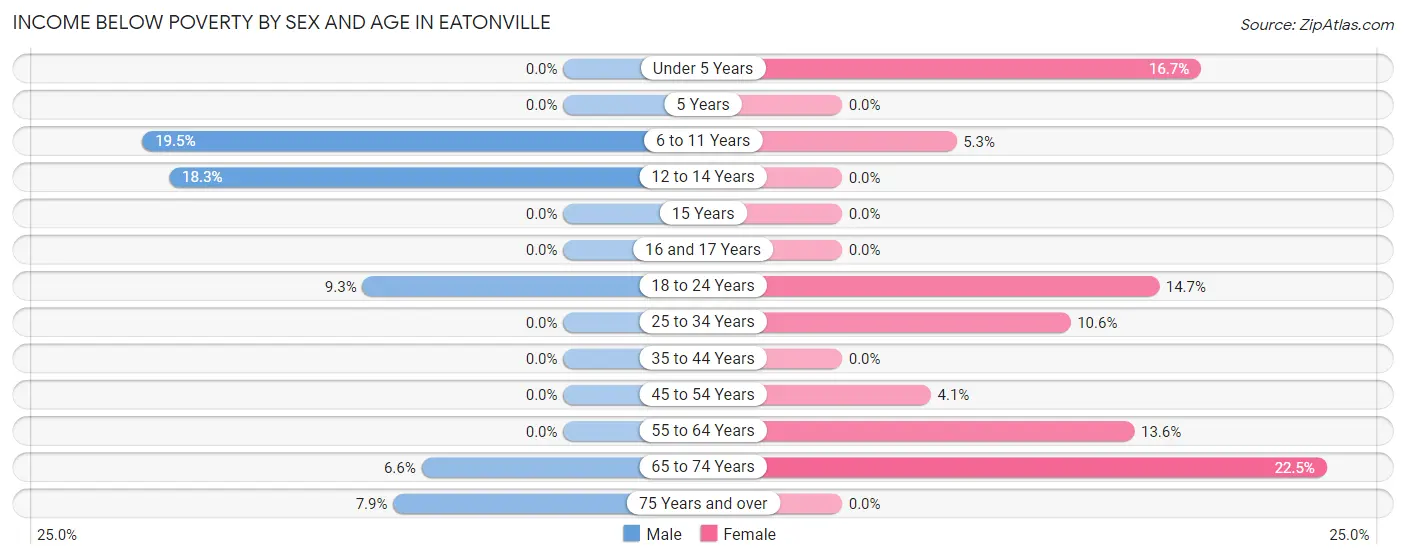
| Age Bracket | Male | Female |
| Under 5 Years | 0 (0.0%) | 11 (16.7%) |
| 5 Years | 0 (0.0%) | 0 (0.0%) |
| 6 to 11 Years | 34 (19.5%) | 12 (5.3%) |
| 12 to 14 Years | 15 (18.3%) | 0 (0.0%) |
| 15 Years | 0 (0.0%) | 0 (0.0%) |
| 16 and 17 Years | 0 (0.0%) | 0 (0.0%) |
| 18 to 24 Years | 11 (9.3%) | 30 (14.7%) |
| 25 to 34 Years | 0 (0.0%) | 30 (10.6%) |
| 35 to 44 Years | 0 (0.0%) | 0 (0.0%) |
| 45 to 54 Years | 0 (0.0%) | 8 (4.1%) |
| 55 to 64 Years | 0 (0.0%) | 16 (13.6%) |
| 65 to 74 Years | 5 (6.6%) | 27 (22.5%) |
| 75 Years and over | 3 (7.9%) | 0 (0.0%) |
| Total | 68 (5.2%) | 134 (8.7%) |
Income Above Poverty by Sex and Age in Eatonville
According to the poverty statistics in Eatonville, males aged under 5 years and females aged 5 years are the age groups that are most secure financially, with 100.0% of males and 100.0% of females in these age groups living above the poverty line.
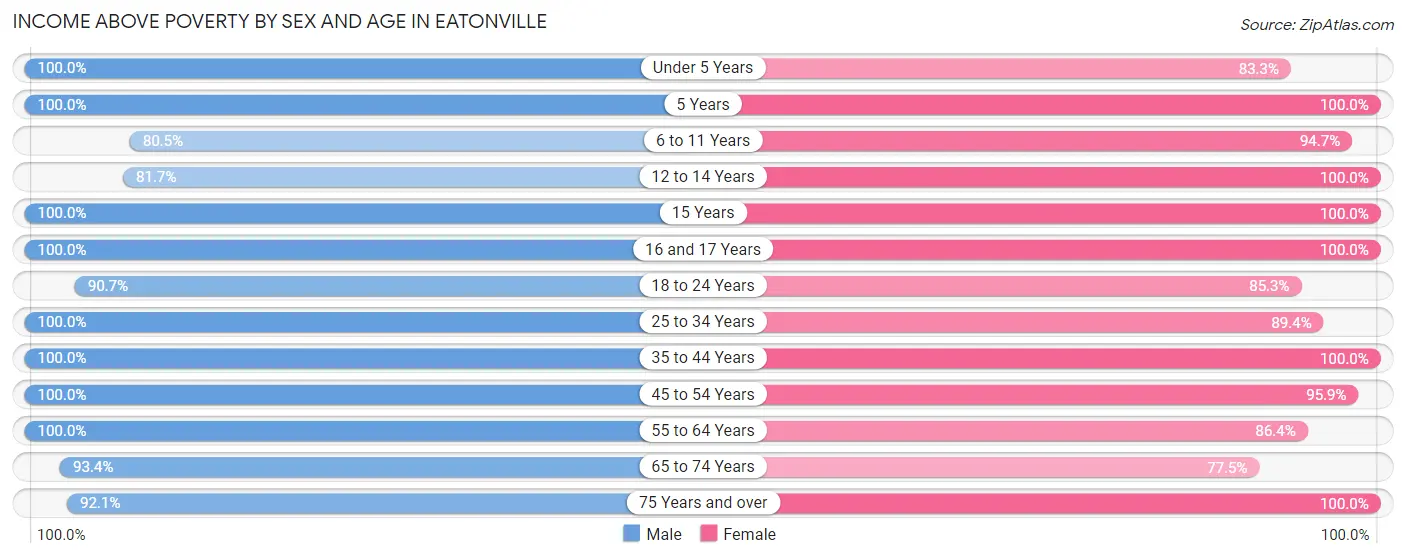
| Age Bracket | Male | Female |
| Under 5 Years | 151 (100.0%) | 55 (83.3%) |
| 5 Years | 7 (100.0%) | 58 (100.0%) |
| 6 to 11 Years | 140 (80.5%) | 214 (94.7%) |
| 12 to 14 Years | 67 (81.7%) | 44 (100.0%) |
| 15 Years | 7 (100.0%) | 18 (100.0%) |
| 16 and 17 Years | 41 (100.0%) | 29 (100.0%) |
| 18 to 24 Years | 107 (90.7%) | 174 (85.3%) |
| 25 to 34 Years | 165 (100.0%) | 253 (89.4%) |
| 35 to 44 Years | 210 (100.0%) | 126 (100.0%) |
| 45 to 54 Years | 129 (100.0%) | 186 (95.9%) |
| 55 to 64 Years | 112 (100.0%) | 102 (86.4%) |
| 65 to 74 Years | 71 (93.4%) | 93 (77.5%) |
| 75 Years and over | 35 (92.1%) | 49 (100.0%) |
| Total | 1,242 (94.8%) | 1,401 (91.3%) |
Income Below Poverty Among Married-Couple Families in Eatonville
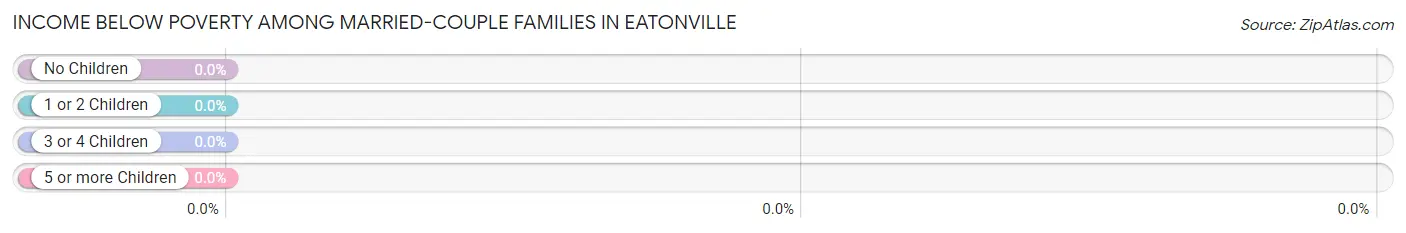
| Children | Above Poverty | Below Poverty |
| No Children | 211 (100.0%) | 0 (0.0%) |
| 1 or 2 Children | 202 (100.0%) | 0 (0.0%) |
| 3 or 4 Children | 77 (100.0%) | 0 (0.0%) |
| 5 or more Children | 0 (0.0%) | 0 (0.0%) |
| Total | 490 (100.0%) | 0 (0.0%) |
Income Below Poverty Among Single-Parent Households in Eatonville
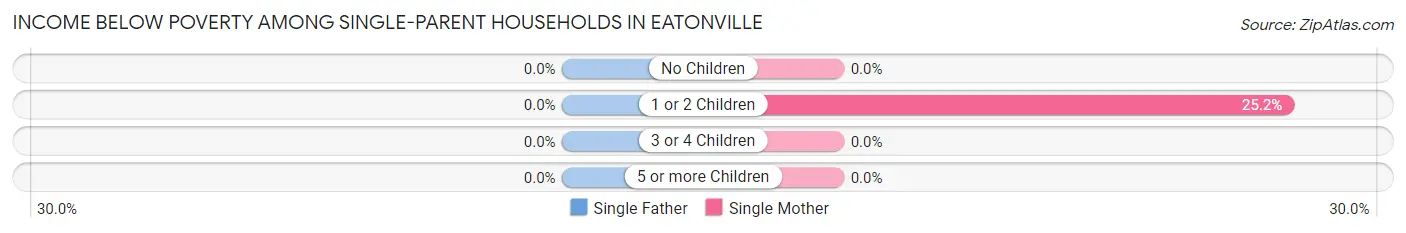
| Children | Single Father | Single Mother |
| No Children | 0 (0.0%) | 0 (0.0%) |
| 1 or 2 Children | 0 (0.0%) | 38 (25.2%) |
| 3 or 4 Children | 0 (0.0%) | 0 (0.0%) |
| 5 or more Children | 0 (0.0%) | 0 (0.0%) |
| Total | 0 (0.0%) | 38 (21.6%) |
Income Below Poverty Among Married-Couple vs Single-Parent Households in Eatonville
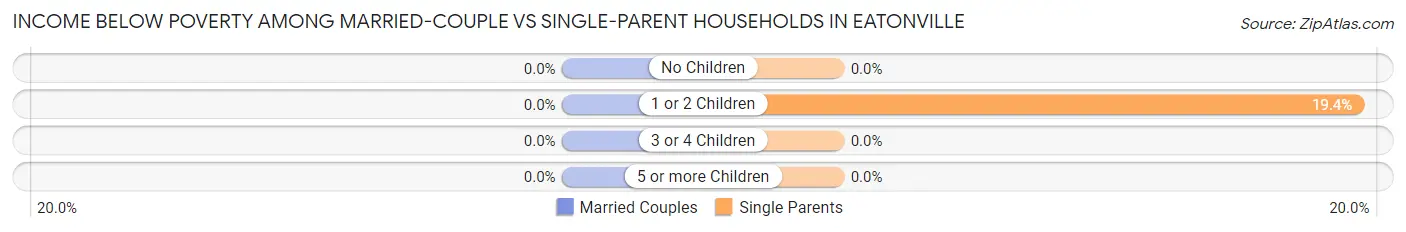
| Children | Married-Couple Families | Single-Parent Households |
| No Children | 0 (0.0%) | 0 (0.0%) |
| 1 or 2 Children | 0 (0.0%) | 38 (19.4%) |
| 3 or 4 Children | 0 (0.0%) | 0 (0.0%) |
| 5 or more Children | 0 (0.0%) | 0 (0.0%) |
| Total | 0 (0.0%) | 38 (16.6%) |
Race in Eatonville
The most populous races in Eatonville are White / Caucasian (2,268 | 79.7%), Two or more Races (442 | 15.5%), and Hispanic or Latino (374 | 13.2%).
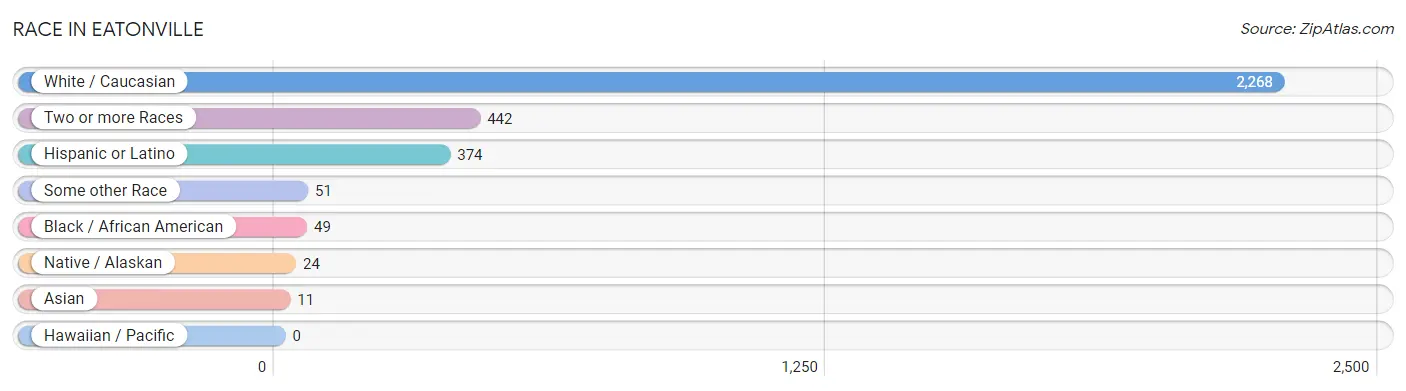
| Race | # Population | % Population |
| Asian | 11 | 0.4% |
| Black / African American | 49 | 1.7% |
| Hawaiian / Pacific | 0 | 0.0% |
| Hispanic or Latino | 374 | 13.2% |
| Native / Alaskan | 24 | 0.8% |
| White / Caucasian | 2,268 | 79.7% |
| Two or more Races | 442 | 15.5% |
| Some other Race | 51 | 1.8% |
| Total | 2,845 | 100.0% |
Ancestry in Eatonville
The most populous ancestries reported in Eatonville are German (618 | 21.7%), Irish (511 | 18.0%), European (281 | 9.9%), Mexican (249 | 8.7%), and English (220 | 7.7%), together accounting for 66.0% of all Eatonville residents.
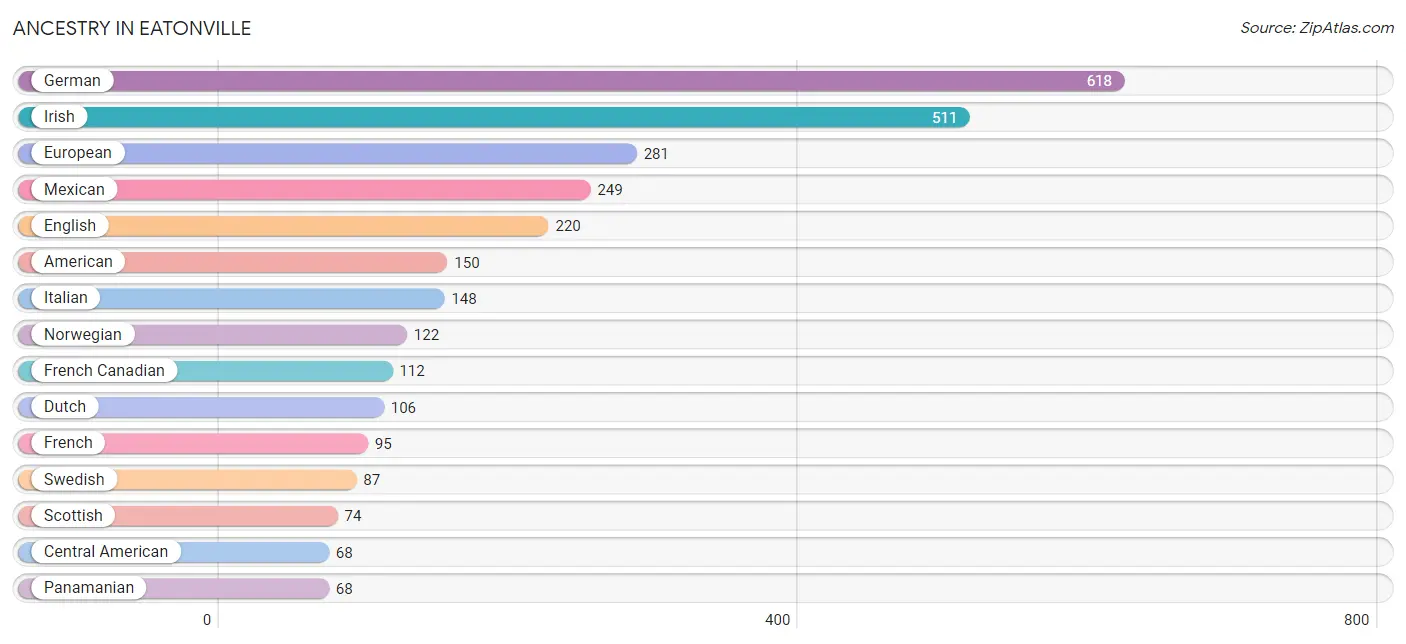
| Ancestry | # Population | % Population |
| American | 150 | 5.3% |
| Armenian | 8 | 0.3% |
| Bhutanese | 4 | 0.1% |
| Blackfeet | 40 | 1.4% |
| Burmese | 6 | 0.2% |
| Canadian | 2 | 0.1% |
| Central American | 68 | 2.4% |
| Cherokee | 7 | 0.3% |
| Chippewa | 49 | 1.7% |
| Cree | 15 | 0.5% |
| Czech | 5 | 0.2% |
| Danish | 8 | 0.3% |
| Dutch | 106 | 3.7% |
| Eastern European | 16 | 0.6% |
| English | 220 | 7.7% |
| European | 281 | 9.9% |
| Finnish | 7 | 0.3% |
| French | 95 | 3.3% |
| French American Indian | 7 | 0.3% |
| French Canadian | 112 | 3.9% |
| German | 618 | 21.7% |
| Guamanian / Chamorro | 62 | 2.2% |
| Hungarian | 5 | 0.2% |
| Irish | 511 | 18.0% |
| Italian | 148 | 5.2% |
| Korean | 33 | 1.2% |
| Mexican | 249 | 8.7% |
| Native Hawaiian | 4 | 0.1% |
| Northern European | 7 | 0.3% |
| Norwegian | 122 | 4.3% |
| Panamanian | 68 | 2.4% |
| Polish | 19 | 0.7% |
| Puerto Rican | 20 | 0.7% |
| Scandinavian | 8 | 0.3% |
| Scotch-Irish | 18 | 0.6% |
| Scottish | 74 | 2.6% |
| Sioux | 4 | 0.1% |
| Spaniard | 31 | 1.1% |
| Swedish | 87 | 3.1% | View All 39 Rows |
Immigrants in Eatonville
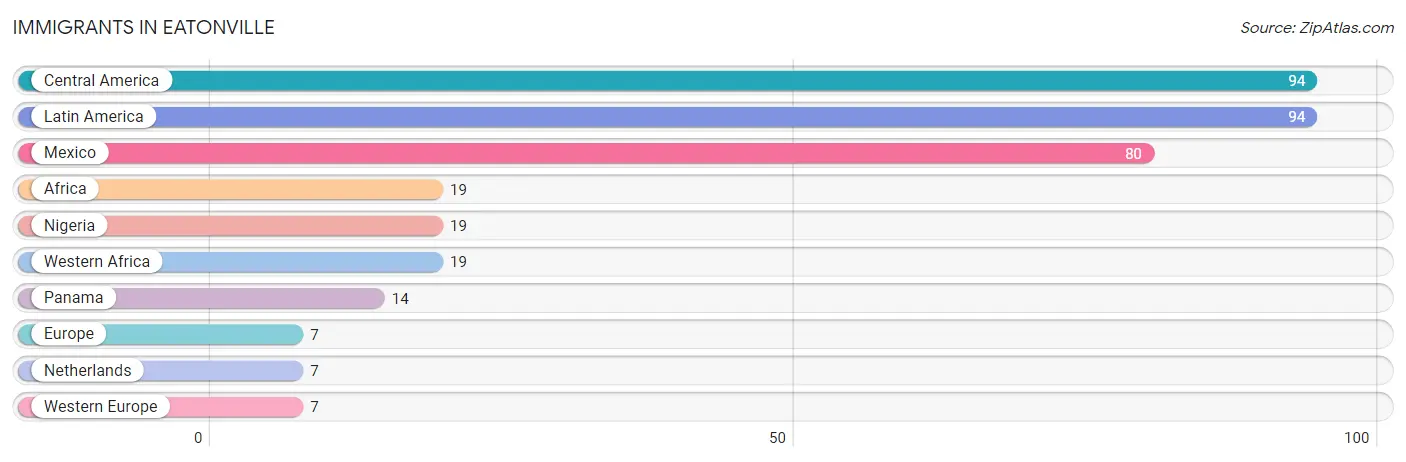
The most numerous immigrant groups reported in Eatonville came from Central America (94 | 3.3%), Latin America (94 | 3.3%), Mexico (80 | 2.8%), Africa (19 | 0.7%), and Nigeria (19 | 0.7%), together accounting for 10.7% of all Eatonville residents.
| Immigration Origin | # Population | % Population |
| Africa | 19 | 0.7% |
| Central America | 94 | 3.3% |
| Europe | 7 | 0.3% |
| Latin America | 94 | 3.3% |
| Mexico | 80 | 2.8% |
| Netherlands | 7 | 0.3% |
| Nigeria | 19 | 0.7% |
| Panama | 14 | 0.5% |
| Western Africa | 19 | 0.7% |
| Western Europe | 7 | 0.3% | View All 10 Rows |
Sex and Age in Eatonville
Sex and Age in Eatonville
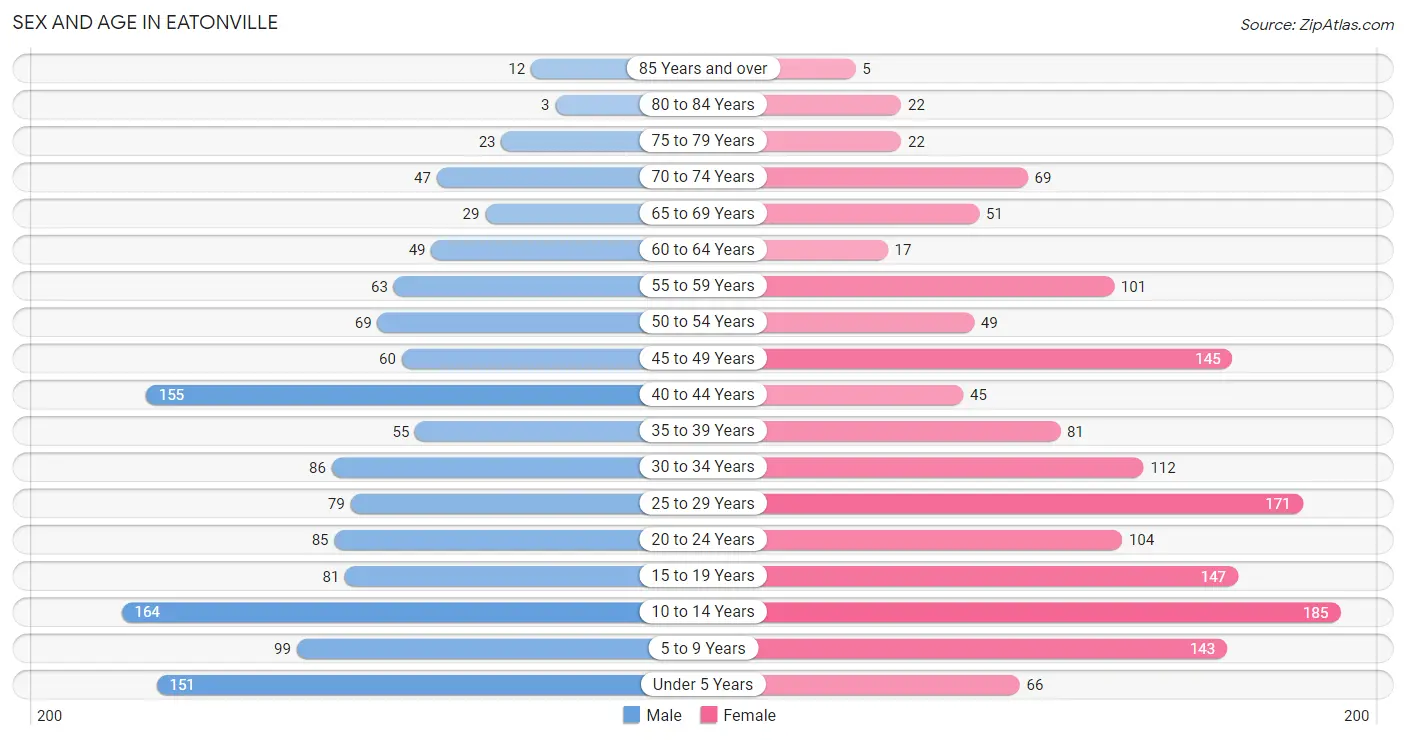
The most populous age groups in Eatonville are 10 to 14 Years (164 | 12.5%) for men and 10 to 14 Years (185 | 12.0%) for women.
| Age Bracket | Male | Female |
| Under 5 Years | 151 (11.5%) | 66 (4.3%) |
| 5 to 9 Years | 99 (7.6%) | 143 (9.3%) |
| 10 to 14 Years | 164 (12.5%) | 185 (12.0%) |
| 15 to 19 Years | 81 (6.2%) | 147 (9.6%) |
| 20 to 24 Years | 85 (6.5%) | 104 (6.8%) |
| 25 to 29 Years | 79 (6.0%) | 171 (11.1%) |
| 30 to 34 Years | 86 (6.6%) | 112 (7.3%) |
| 35 to 39 Years | 55 (4.2%) | 81 (5.3%) |
| 40 to 44 Years | 155 (11.8%) | 45 (2.9%) |
| 45 to 49 Years | 60 (4.6%) | 145 (9.5%) |
| 50 to 54 Years | 69 (5.3%) | 49 (3.2%) |
| 55 to 59 Years | 63 (4.8%) | 101 (6.6%) |
| 60 to 64 Years | 49 (3.7%) | 17 (1.1%) |
| 65 to 69 Years | 29 (2.2%) | 51 (3.3%) |
| 70 to 74 Years | 47 (3.6%) | 69 (4.5%) |
| 75 to 79 Years | 23 (1.8%) | 22 (1.4%) |
| 80 to 84 Years | 3 (0.2%) | 22 (1.4%) |
| 85 Years and over | 12 (0.9%) | 5 (0.3%) |
| Total | 1,310 (100.0%) | 1,535 (100.0%) |
Families and Households in Eatonville
Median Family Size in Eatonville
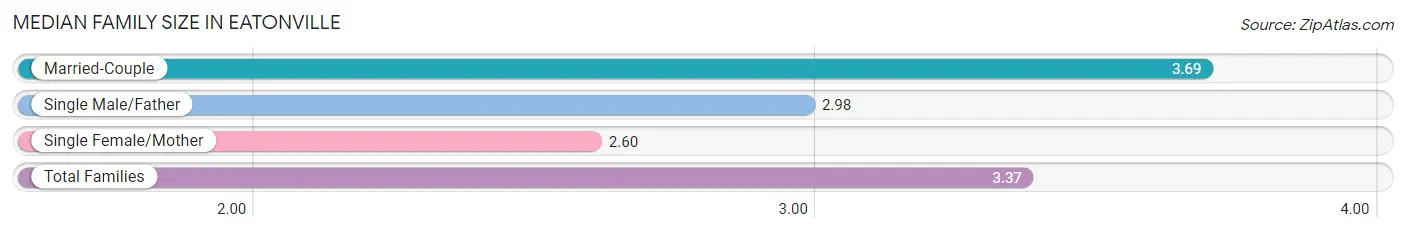
The median family size in Eatonville is 3.37 persons per family, with married-couple families (490 | 68.1%) accounting for the largest median family size of 3.69 persons per family. On the other hand, single female/mother families (176 | 24.5%) represent the smallest median family size with 2.60 persons per family.
| Family Type | # Families | Family Size |
| Married-Couple | 490 (68.1%) | 3.69 |
| Single Male/Father | 53 (7.4%) | 2.98 |
| Single Female/Mother | 176 (24.5%) | 2.60 |
| Total Families | 719 (100.0%) | 3.37 |
Median Household Size in Eatonville
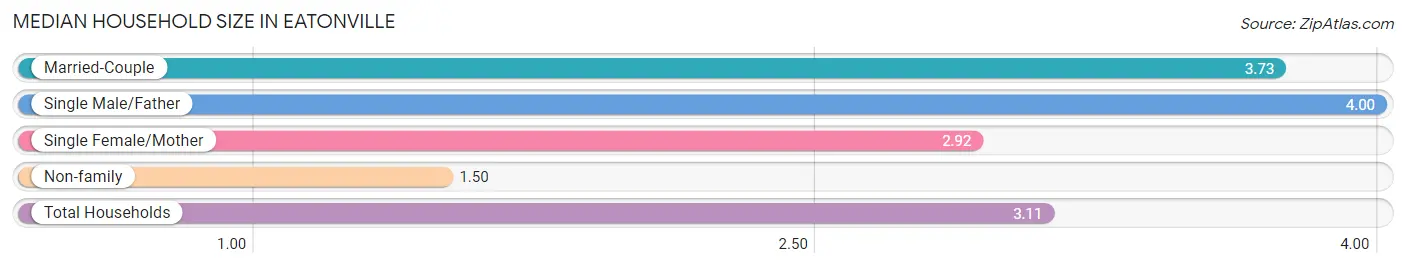
The median household size in Eatonville is 3.11 persons per household, with single male/father households (53 | 5.8%) accounting for the largest median household size of 4 persons per household. non-family households (195 | 21.3%) represent the smallest median household size with 1.50 persons per household.
| Household Type | # Households | Household Size |
| Married-Couple | 490 (53.6%) | 3.73 |
| Single Male/Father | 53 (5.8%) | 4.00 |
| Single Female/Mother | 176 (19.3%) | 2.92 |
| Non-family | 195 (21.3%) | 1.50 |
| Total Households | 914 (100.0%) | 3.11 |
Household Size by Marriage Status in Eatonville
Out of a total of 914 households in Eatonville, 719 (78.7%) are family households, while 195 (21.3%) are nonfamily households. The most numerous type of family households are 3-person households, comprising 218, and the most common type of nonfamily households are 1-person households, comprising 130.
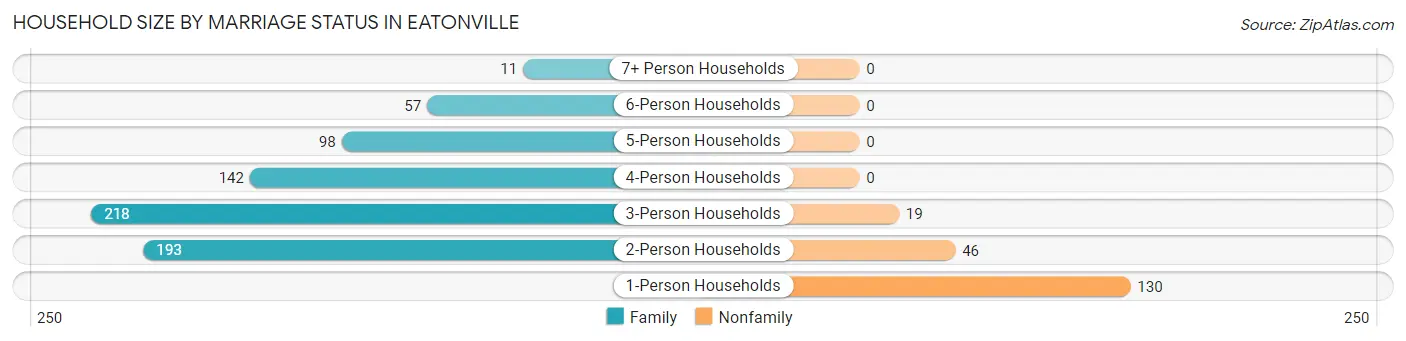
| Household Size | Family Households | Nonfamily Households |
| 1-Person Households | - | 130 (14.2%) |
| 2-Person Households | 193 (21.1%) | 46 (5.0%) |
| 3-Person Households | 218 (23.8%) | 19 (2.1%) |
| 4-Person Households | 142 (15.5%) | 0 (0.0%) |
| 5-Person Households | 98 (10.7%) | 0 (0.0%) |
| 6-Person Households | 57 (6.2%) | 0 (0.0%) |
| 7+ Person Households | 11 (1.2%) | 0 (0.0%) |
| Total | 719 (78.7%) | 195 (21.3%) |
Female Fertility in Eatonville
Fertility by Age in Eatonville
Average fertility rate in Eatonville is 65.0 births per 1,000 women. Women in the age bracket of 20 to 34 years have the highest fertility rate with 137.0 births per 1,000 women. Women in the age bracket of 20 to 34 years acount for 100.0% of all women with births.
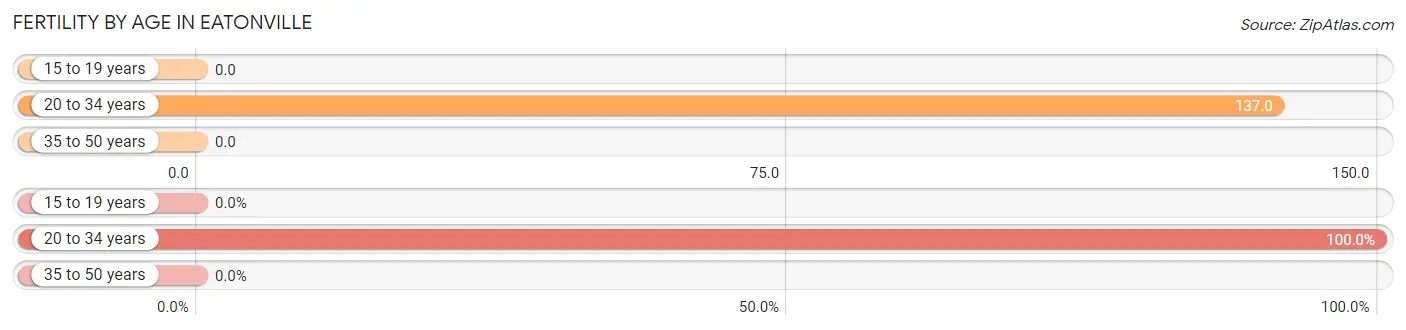
| Age Bracket | Women with Births | Births / 1,000 Women |
| 15 to 19 years | 0 (0.0%) | 0.0 |
| 20 to 34 years | 53 (100.0%) | 137.0 |
| 35 to 50 years | 0 (0.0%) | 0.0 |
| Total | 53 (100.0%) | 65.0 |
Fertility by Age by Marriage Status in Eatonville
39.6% of women with births (53) in Eatonville are married. The highest percentage of unmarried women with births falls into 20 to 34 years age bracket with 60.4% of them unmarried at the time of birth, while the lowest percentage of unmarried women with births belong to 20 to 34 years age bracket with 60.4% of them unmarried.
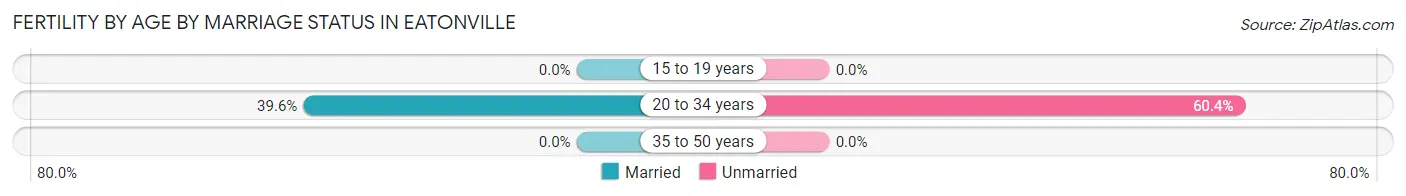
| Age Bracket | Married | Unmarried |
| 15 to 19 years | 0 (0.0%) | 0 (0.0%) |
| 20 to 34 years | 21 (39.6%) | 32 (60.4%) |
| 35 to 50 years | 0 (0.0%) | 0 (0.0%) |
| Total | 21 (39.6%) | 32 (60.4%) |
Fertility by Education in Eatonville
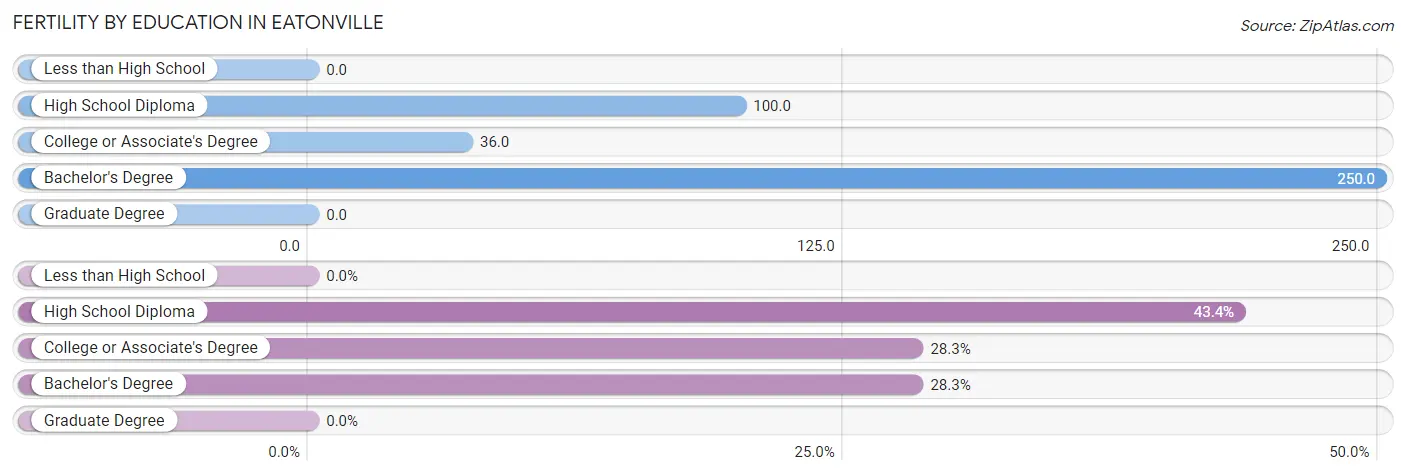
| Educational Attainment | Women with Births | Births / 1,000 Women |
| Less than High School | 0 (0.0%) | 0.0 |
| High School Diploma | 23 (43.4%) | 100.0 |
| College or Associate's Degree | 15 (28.3%) | 36.0 |
| Bachelor's Degree | 15 (28.3%) | 250.0 |
| Graduate Degree | 0 (0.0%) | 0.0 |
| Total | 53 (100.0%) | 65.0 |
Fertility by Education by Marriage Status in Eatonville
60.4% of women with births in Eatonville are unmarried. Women with the educational attainment of college or associate's degree are most likely to be married with 100.0% of them married at childbirth, while women with the educational attainment of bachelor's degree are least likely to be married with 100.0% of them unmarried at childbirth.
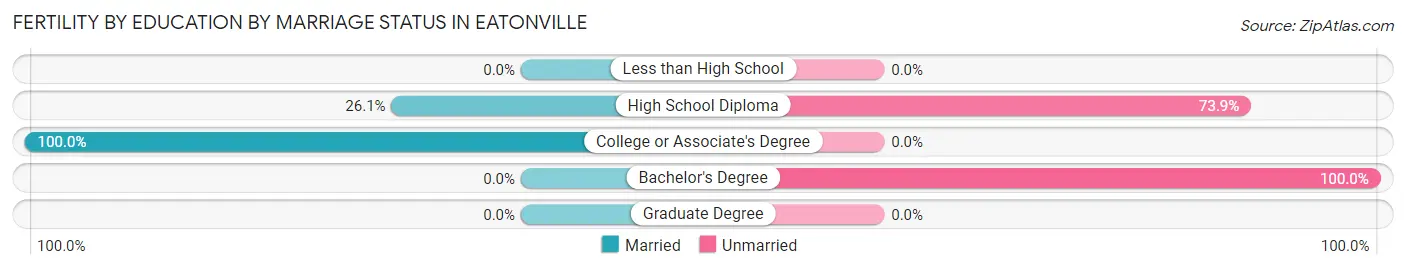
| Educational Attainment | Married | Unmarried |
| Less than High School | 0 (0.0%) | 0 (0.0%) |
| High School Diploma | 6 (26.1%) | 17 (73.9%) |
| College or Associate's Degree | 15 (100.0%) | 0 (0.0%) |
| Bachelor's Degree | 0 (0.0%) | 15 (100.0%) |
| Graduate Degree | 0 (0.0%) | 0 (0.0%) |
| Total | 21 (39.6%) | 32 (60.4%) |
Employment Characteristics in Eatonville
Employment by Class of Employer in Eatonville
Among the 1,327 employed individuals in Eatonville, private company employees (966 | 72.8%), not-for-profit organizations (98 | 7.4%), and federal government employees (98 | 7.4%) make up the most common classes of employment.
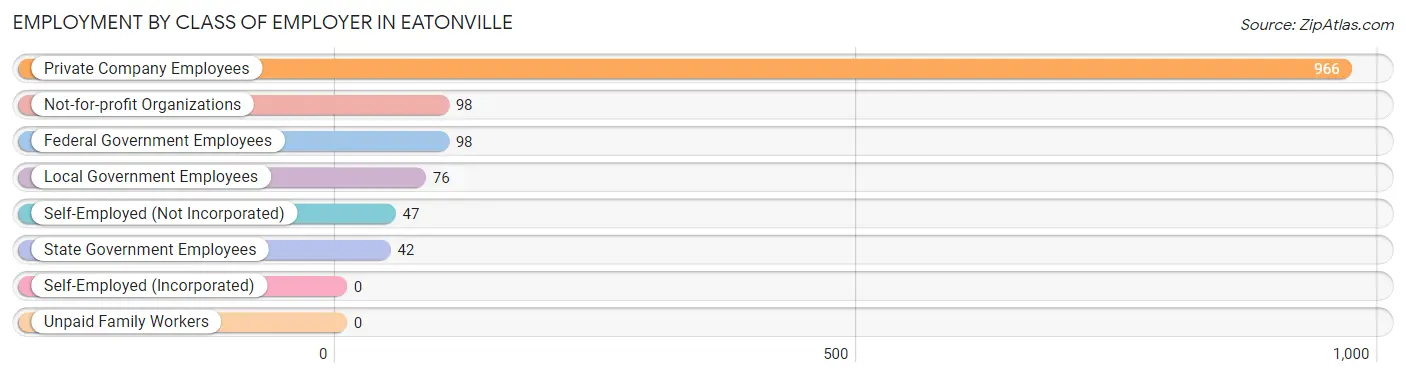
| Employer Class | # Employees | % Employees |
| Private Company Employees | 966 | 72.8% |
| Self-Employed (Incorporated) | 0 | 0.0% |
| Self-Employed (Not Incorporated) | 47 | 3.5% |
| Not-for-profit Organizations | 98 | 7.4% |
| Local Government Employees | 76 | 5.7% |
| State Government Employees | 42 | 3.2% |
| Federal Government Employees | 98 | 7.4% |
| Unpaid Family Workers | 0 | 0.0% |
| Total | 1,327 | 100.0% |
Employment Status by Age in Eatonville
According to the labor force statistics for Eatonville, out of the total population over 16 years of age (2,012), 73.3% or 1,475 individuals are in the labor force, with 5.0% or 74 of them unemployed. The age group with the highest labor force participation rate is 45 to 54 years, with 93.2% or 301 individuals in the labor force. Within the labor force, the 20 to 24 years age range has the highest percentage of unemployed individuals, with 8.9% or 14 of them being unemployed.
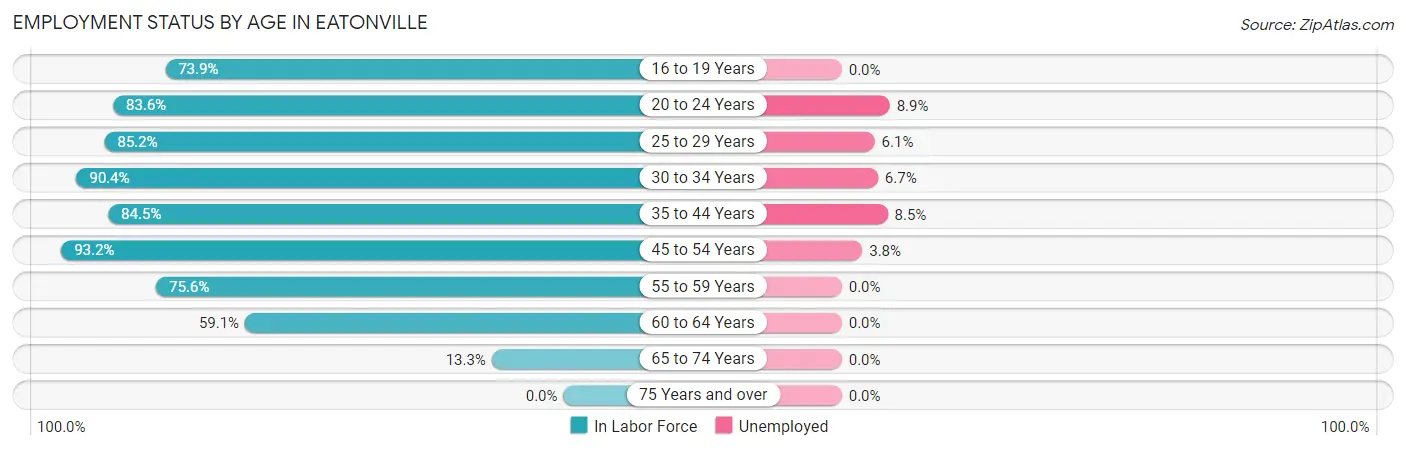
| Age Bracket | In Labor Force | Unemployed |
| 16 to 19 Years | 150 (73.9%) | 0 (0.0%) |
| 20 to 24 Years | 158 (83.6%) | 14 (8.9%) |
| 25 to 29 Years | 213 (85.2%) | 13 (6.1%) |
| 30 to 34 Years | 179 (90.4%) | 12 (6.7%) |
| 35 to 44 Years | 284 (84.5%) | 24 (8.5%) |
| 45 to 54 Years | 301 (93.2%) | 11 (3.8%) |
| 55 to 59 Years | 124 (75.6%) | 0 (0.0%) |
| 60 to 64 Years | 39 (59.1%) | 0 (0.0%) |
| 65 to 74 Years | 26 (13.3%) | 0 (0.0%) |
| 75 Years and over | 0 (0.0%) | 0 (0.0%) |
| Total | 1,475 (73.3%) | 74 (5.0%) |
Employment Status by Educational Attainment in Eatonville
According to labor force statistics for Eatonville, 85.3% of individuals (1,140) out of the total population between 25 and 64 years of age (1,337) are in the labor force, with 5.3% or 60 of them being unemployed. The group with the highest labor force participation rate are those with the educational attainment of bachelor's degree or higher, with 95.2% or 198 individuals in the labor force. Within the labor force, individuals with high school diploma education have the highest percentage of unemployment, with 7.4% or 33 of them being unemployed.
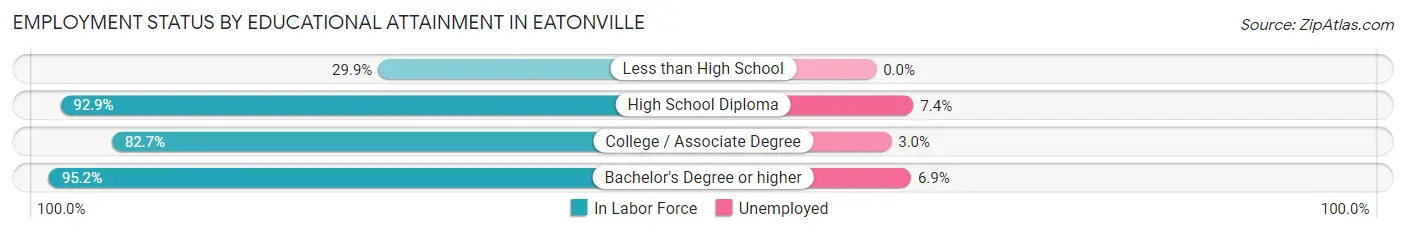
| Educational Attainment | In Labor Force | Unemployed |
| Less than High School | 23 (29.9%) | 0 (0.0%) |
| High School Diploma | 445 (92.9%) | 35 (7.4%) |
| College / Associate Degree | 474 (82.7%) | 17 (3.0%) |
| Bachelor's Degree or higher | 198 (95.2%) | 14 (6.9%) |
| Total | 1,140 (85.3%) | 71 (5.3%) |
Employment Occupations by Sex in Eatonville
Management, Business, Science and Arts Occupations
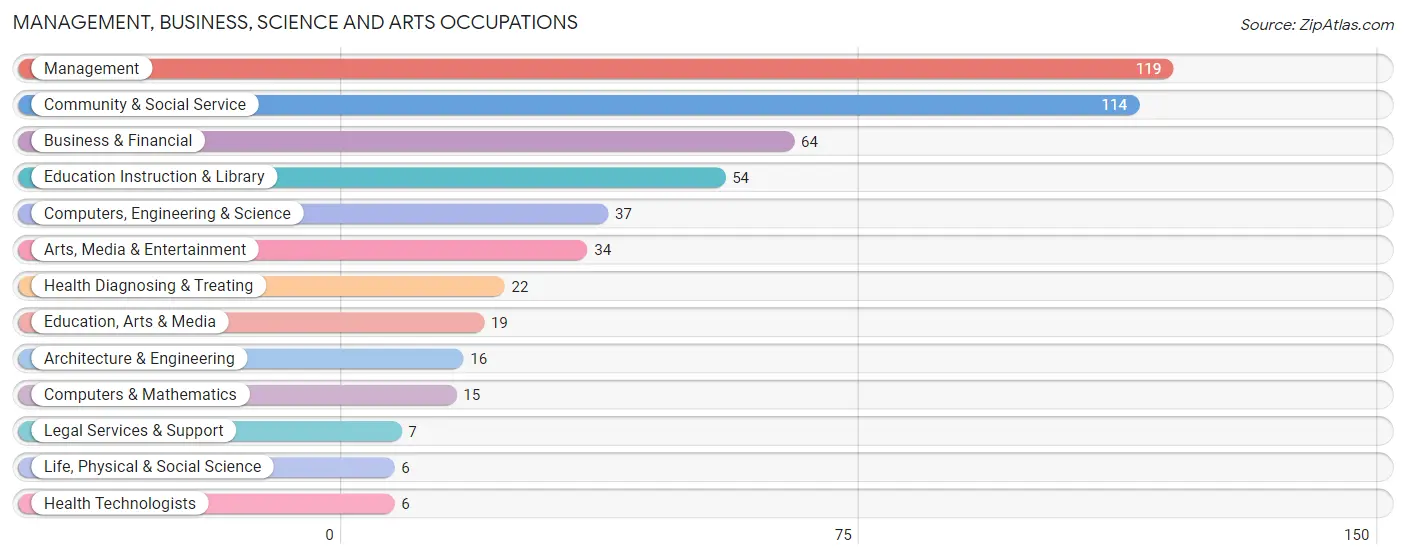
The most common Management, Business, Science and Arts occupations in Eatonville are Management (119 | 8.6%), Community & Social Service (114 | 8.3%), Business & Financial (64 | 4.6%), Education Instruction & Library (54 | 3.9%), and Computers, Engineering & Science (37 | 2.7%).
Management, Business, Science and Arts Occupations by Sex
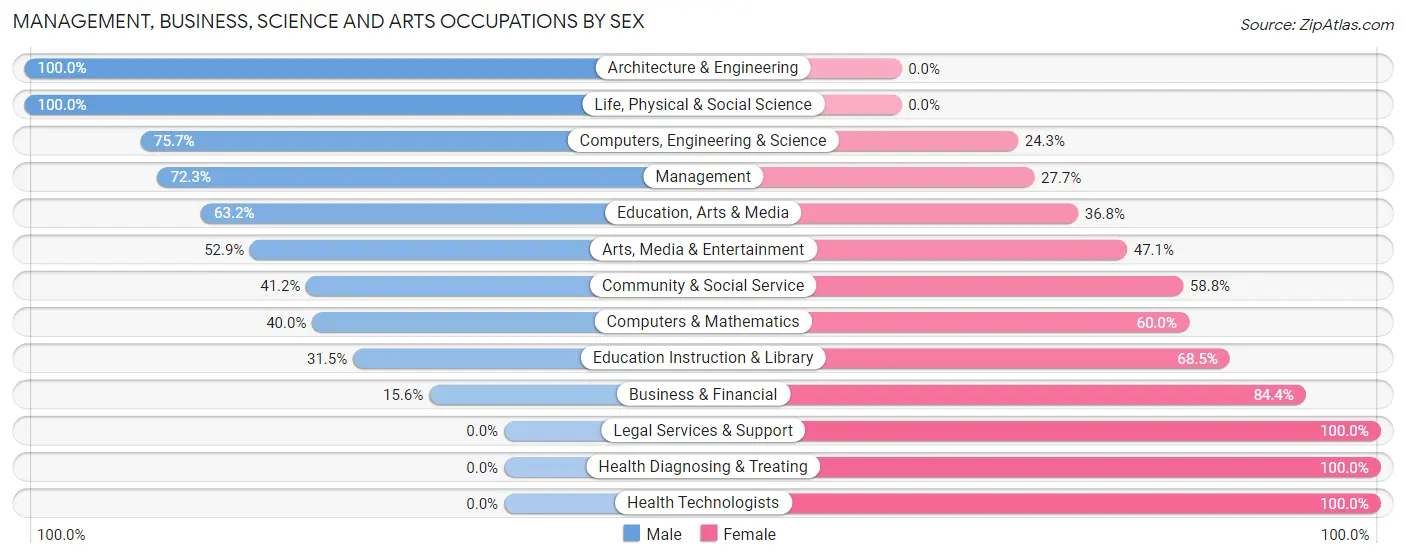
Within the Management, Business, Science and Arts occupations in Eatonville, the most male-oriented occupations are Architecture & Engineering (100.0%), Life, Physical & Social Science (100.0%), and Computers, Engineering & Science (75.7%), while the most female-oriented occupations are Legal Services & Support (100.0%), Health Diagnosing & Treating (100.0%), and Health Technologists (100.0%).
| Occupation | Male | Female |
| Management | 86 (72.3%) | 33 (27.7%) |
| Business & Financial | 10 (15.6%) | 54 (84.4%) |
| Computers, Engineering & Science | 28 (75.7%) | 9 (24.3%) |
| Computers & Mathematics | 6 (40.0%) | 9 (60.0%) |
| Architecture & Engineering | 16 (100.0%) | 0 (0.0%) |
| Life, Physical & Social Science | 6 (100.0%) | 0 (0.0%) |
| Community & Social Service | 47 (41.2%) | 67 (58.8%) |
| Education, Arts & Media | 12 (63.2%) | 7 (36.8%) |
| Legal Services & Support | 0 (0.0%) | 7 (100.0%) |
| Education Instruction & Library | 17 (31.5%) | 37 (68.5%) |
| Arts, Media & Entertainment | 18 (52.9%) | 16 (47.1%) |
| Health Diagnosing & Treating | 0 (0.0%) | 22 (100.0%) |
| Health Technologists | 0 (0.0%) | 6 (100.0%) |
| Total (Category) | 171 (48.0%) | 185 (52.0%) |
| Total (Overall) | 666 (48.3%) | 712 (51.7%) |
Services Occupations
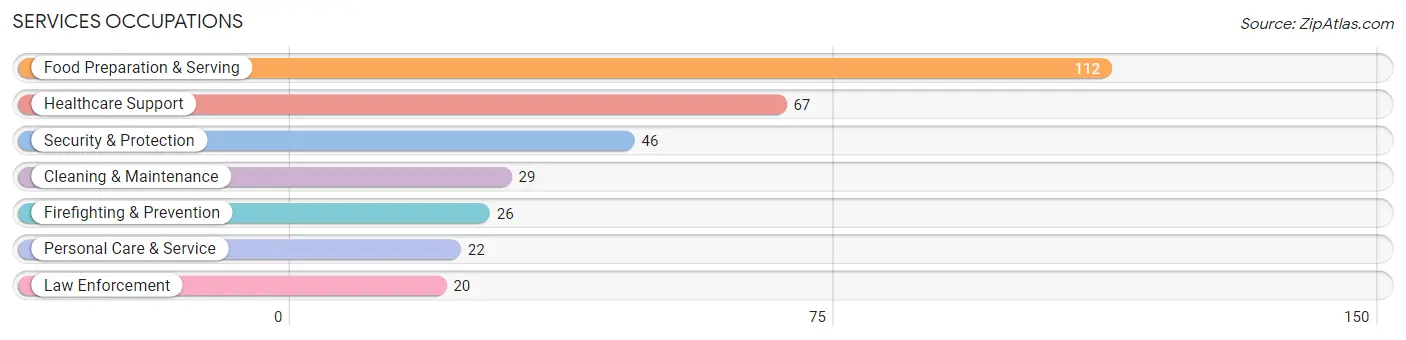
The most common Services occupations in Eatonville are Food Preparation & Serving (112 | 8.1%), Healthcare Support (67 | 4.9%), Security & Protection (46 | 3.3%), Cleaning & Maintenance (29 | 2.1%), and Firefighting & Prevention (26 | 1.9%).
Services Occupations by Sex
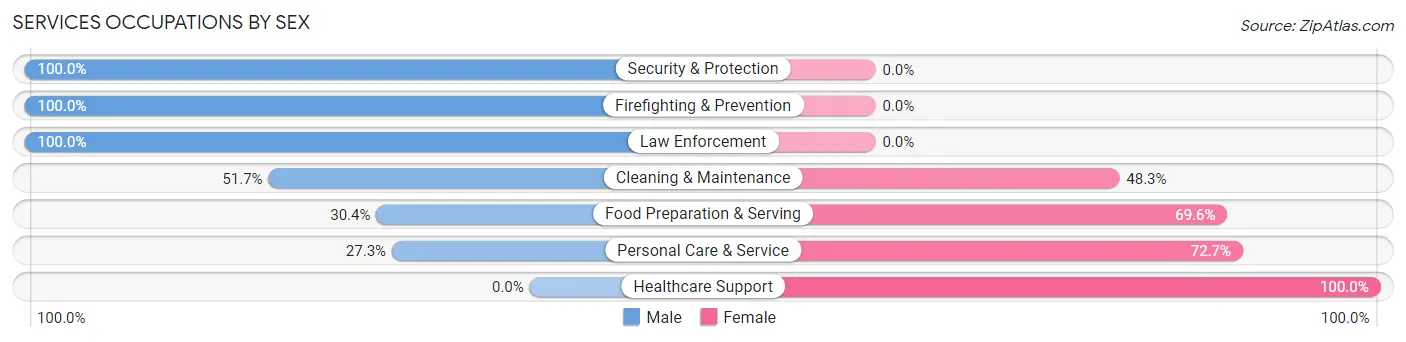
Within the Services occupations in Eatonville, the most male-oriented occupations are Security & Protection (100.0%), Firefighting & Prevention (100.0%), and Law Enforcement (100.0%), while the most female-oriented occupations are Healthcare Support (100.0%), Personal Care & Service (72.7%), and Food Preparation & Serving (69.6%).
| Occupation | Male | Female |
| Healthcare Support | 0 (0.0%) | 67 (100.0%) |
| Security & Protection | 46 (100.0%) | 0 (0.0%) |
| Firefighting & Prevention | 26 (100.0%) | 0 (0.0%) |
| Law Enforcement | 20 (100.0%) | 0 (0.0%) |
| Food Preparation & Serving | 34 (30.4%) | 78 (69.6%) |
| Cleaning & Maintenance | 15 (51.7%) | 14 (48.3%) |
| Personal Care & Service | 6 (27.3%) | 16 (72.7%) |
| Total (Category) | 101 (36.6%) | 175 (63.4%) |
| Total (Overall) | 666 (48.3%) | 712 (51.7%) |
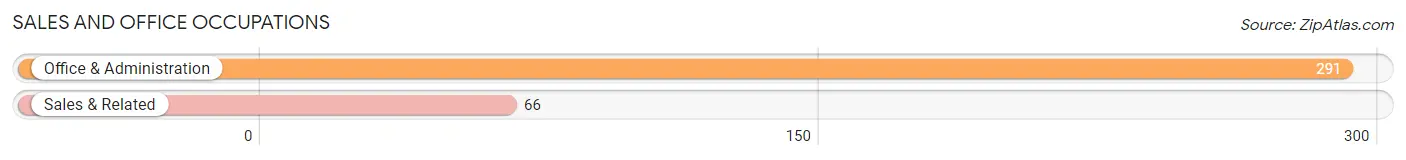
Sales and Office Occupations
The most common Sales and Office occupations in Eatonville are Office & Administration (291 | 21.1%), and Sales & Related (66 | 4.8%).
Sales and Office Occupations by Sex
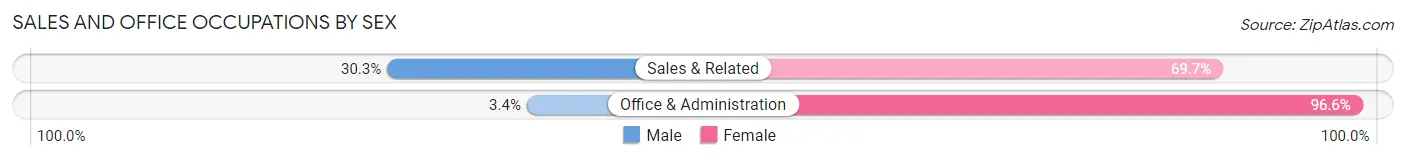
| Occupation | Male | Female |
| Sales & Related | 20 (30.3%) | 46 (69.7%) |
| Office & Administration | 10 (3.4%) | 281 (96.6%) |
| Total (Category) | 30 (8.4%) | 327 (91.6%) |
| Total (Overall) | 666 (48.3%) | 712 (51.7%) |
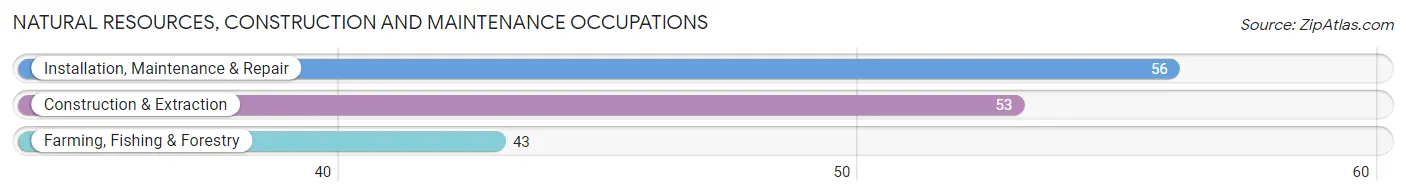
Natural Resources, Construction and Maintenance Occupations
The most common Natural Resources, Construction and Maintenance occupations in Eatonville are Installation, Maintenance & Repair (56 | 4.1%), Construction & Extraction (53 | 3.8%), and Farming, Fishing & Forestry (43 | 3.1%).
Natural Resources, Construction and Maintenance Occupations by Sex
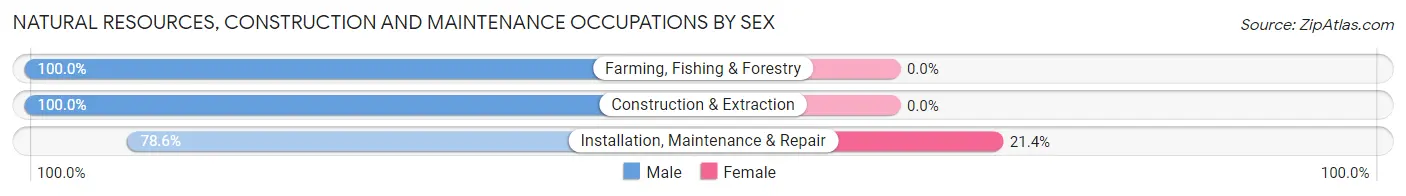
| Occupation | Male | Female |
| Farming, Fishing & Forestry | 43 (100.0%) | 0 (0.0%) |
| Construction & Extraction | 53 (100.0%) | 0 (0.0%) |
| Installation, Maintenance & Repair | 44 (78.6%) | 12 (21.4%) |
| Total (Category) | 140 (92.1%) | 12 (7.9%) |
| Total (Overall) | 666 (48.3%) | 712 (51.7%) |
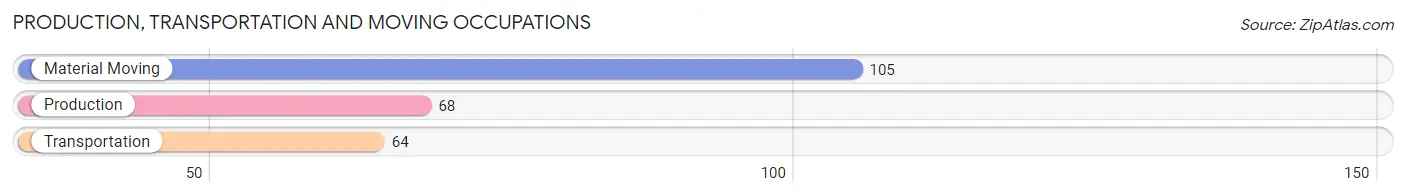
Production, Transportation and Moving Occupations
The most common Production, Transportation and Moving occupations in Eatonville are Material Moving (105 | 7.6%), Production (68 | 4.9%), and Transportation (64 | 4.6%).
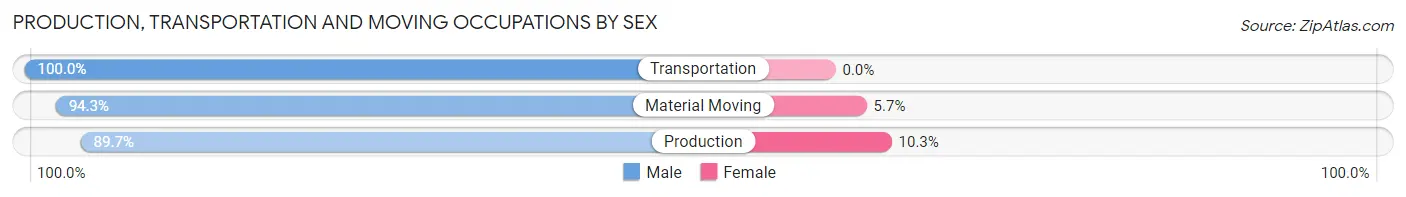
Production, Transportation and Moving Occupations by Sex
| Occupation | Male | Female |
| Production | 61 (89.7%) | 7 (10.3%) |
| Transportation | 64 (100.0%) | 0 (0.0%) |
| Material Moving | 99 (94.3%) | 6 (5.7%) |
| Total (Category) | 224 (94.5%) | 13 (5.5%) |
| Total (Overall) | 666 (48.3%) | 712 (51.7%) |
Employment Industries by Sex in Eatonville
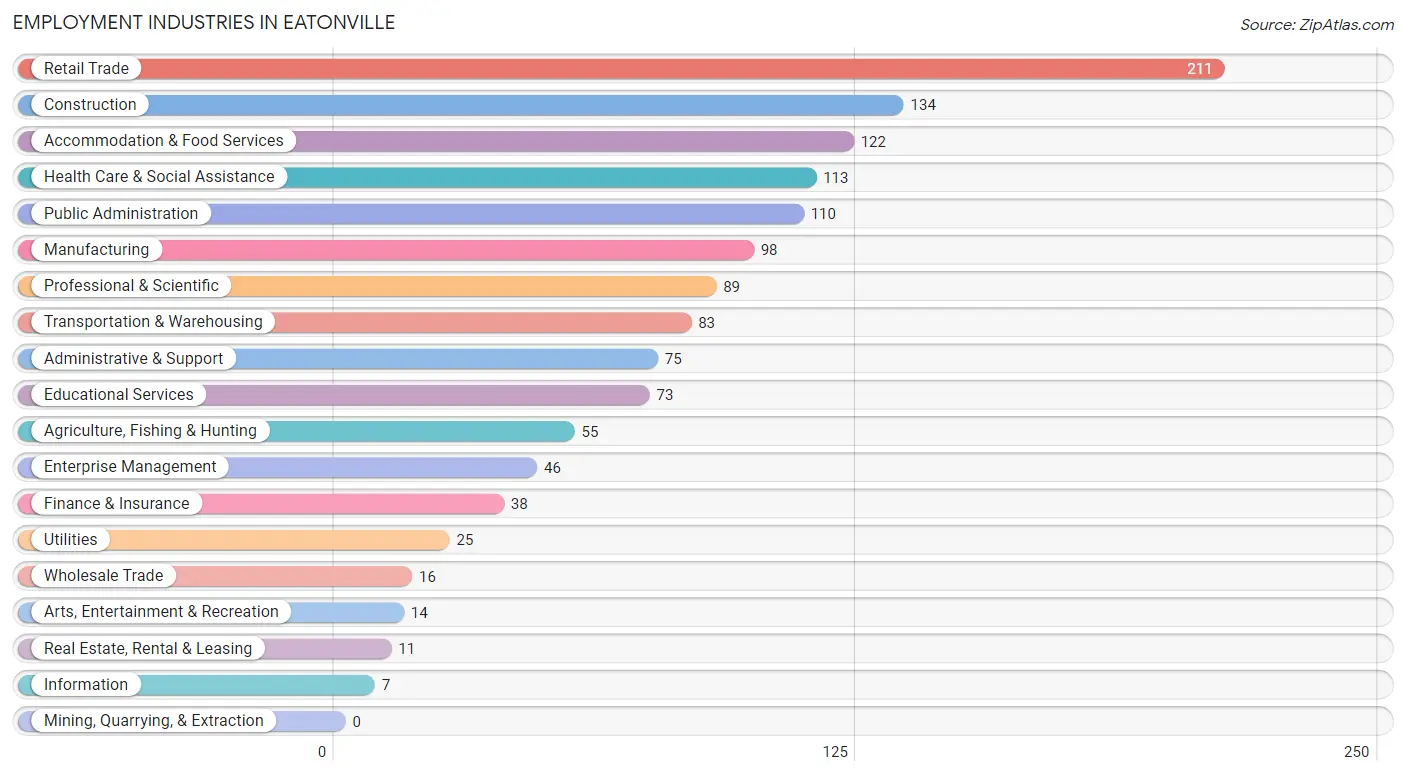
Employment Industries in Eatonville
The major employment industries in Eatonville include Retail Trade (211 | 15.3%), Construction (134 | 9.7%), Accommodation & Food Services (122 | 8.8%), Health Care & Social Assistance (113 | 8.2%), and Public Administration (110 | 8.0%).
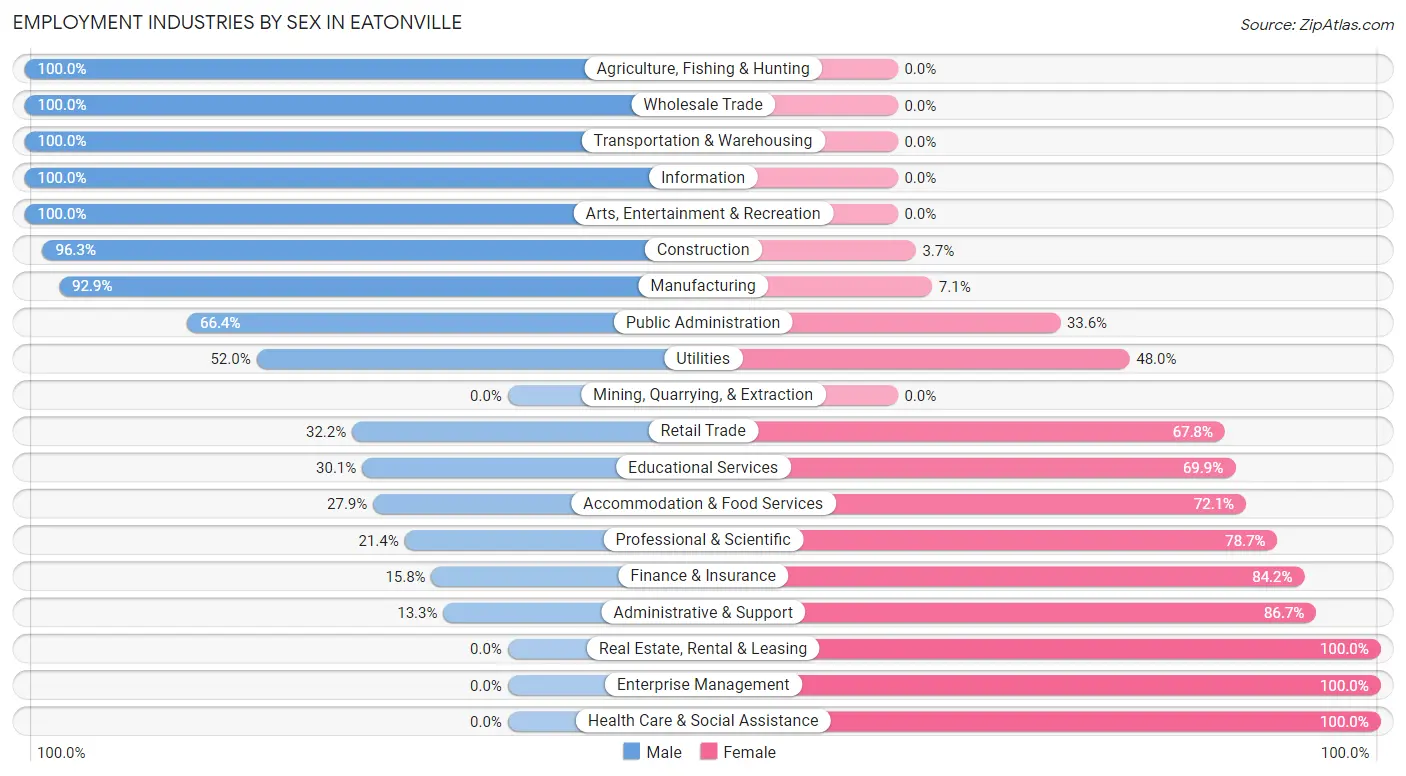
Employment Industries by Sex in Eatonville
The Eatonville industries that see more men than women are Agriculture, Fishing & Hunting (100.0%), Wholesale Trade (100.0%), and Transportation & Warehousing (100.0%), whereas the industries that tend to have a higher number of women are Real Estate, Rental & Leasing (100.0%), Enterprise Management (100.0%), and Health Care & Social Assistance (100.0%).
| Industry | Male | Female |
| Agriculture, Fishing & Hunting | 55 (100.0%) | 0 (0.0%) |
| Mining, Quarrying, & Extraction | 0 (0.0%) | 0 (0.0%) |
| Construction | 129 (96.3%) | 5 (3.7%) |
| Manufacturing | 91 (92.9%) | 7 (7.1%) |
| Wholesale Trade | 16 (100.0%) | 0 (0.0%) |
| Retail Trade | 68 (32.2%) | 143 (67.8%) |
| Transportation & Warehousing | 83 (100.0%) | 0 (0.0%) |
| Utilities | 13 (52.0%) | 12 (48.0%) |
| Information | 7 (100.0%) | 0 (0.0%) |
| Finance & Insurance | 6 (15.8%) | 32 (84.2%) |
| Real Estate, Rental & Leasing | 0 (0.0%) | 11 (100.0%) |
| Professional & Scientific | 19 (21.3%) | 70 (78.6%) |
| Enterprise Management | 0 (0.0%) | 46 (100.0%) |
| Administrative & Support | 10 (13.3%) | 65 (86.7%) |
| Educational Services | 22 (30.1%) | 51 (69.9%) |
| Health Care & Social Assistance | 0 (0.0%) | 113 (100.0%) |
| Arts, Entertainment & Recreation | 14 (100.0%) | 0 (0.0%) |
| Accommodation & Food Services | 34 (27.9%) | 88 (72.1%) |
| Public Administration | 73 (66.4%) | 37 (33.6%) |
| Total | 666 (48.3%) | 712 (51.7%) |
Education in Eatonville
School Enrollment in Eatonville
The most common levels of schooling among the 937 students in Eatonville are middle school (280 | 29.9%), college / undergraduate (170 | 18.1%), and elementary school (151 | 16.1%).
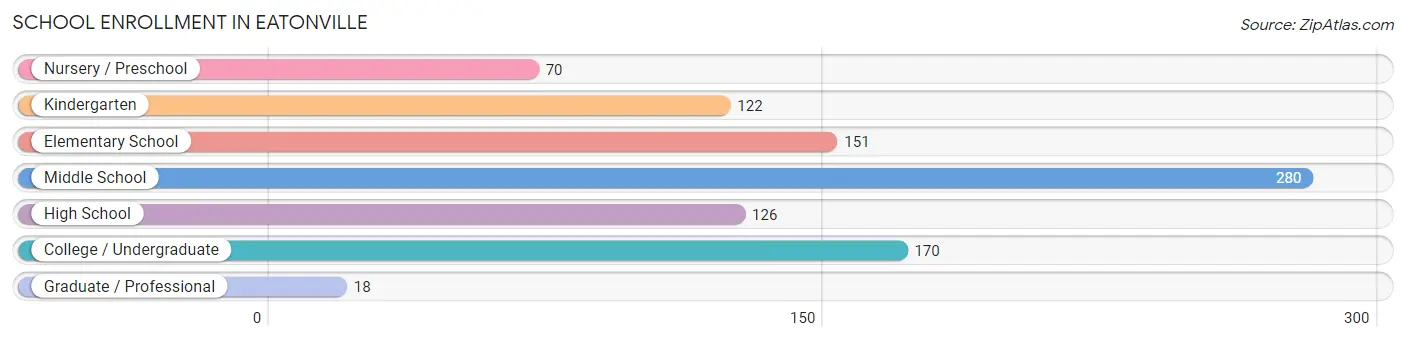
| School Level | # Students | % Students |
| Nursery / Preschool | 70 | 7.5% |
| Kindergarten | 122 | 13.0% |
| Elementary School | 151 | 16.1% |
| Middle School | 280 | 29.9% |
| High School | 126 | 13.5% |
| College / Undergraduate | 170 | 18.1% |
| Graduate / Professional | 18 | 1.9% |
| Total | 937 | 100.0% |
School Enrollment by Age by Funding Source in Eatonville
Out of a total of 937 students who are enrolled in schools in Eatonville, 101 (10.8%) attend a private institution, while the remaining 836 (89.2%) are enrolled in public schools. The age group of 35 years and over has the highest likelihood of being enrolled in private schools, with 18 (46.2% in the age bracket) enrolled. Conversely, the age group of 3 to 4 year olds has the lowest likelihood of being enrolled in a private school, with 59 (100.0% in the age bracket) attending a public institution.
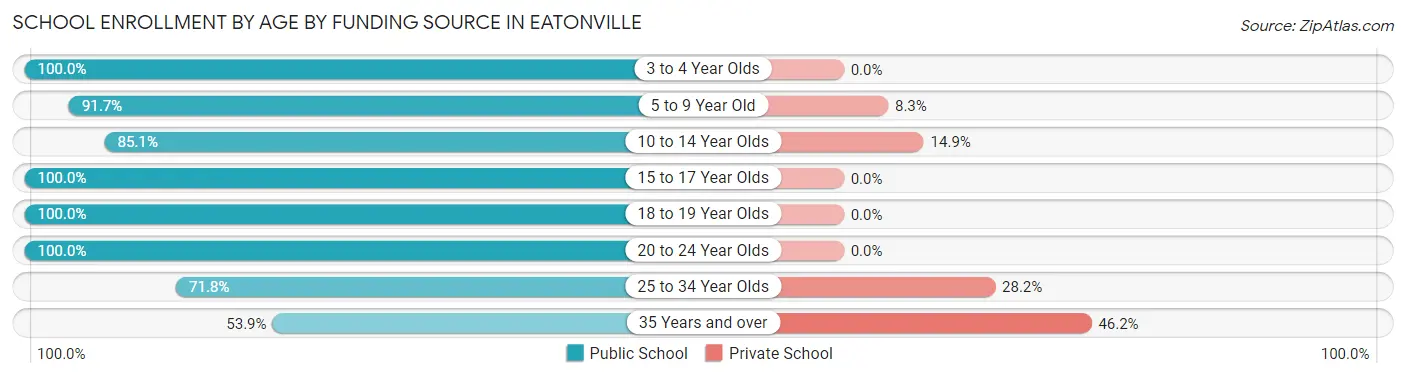
| Age Bracket | Public School | Private School |
| 3 to 4 Year Olds | 59 (100.0%) | 0 (0.0%) |
| 5 to 9 Year Old | 222 (91.7%) | 20 (8.3%) |
| 10 to 14 Year Olds | 297 (85.1%) | 52 (14.9%) |
| 15 to 17 Year Olds | 95 (100.0%) | 0 (0.0%) |
| 18 to 19 Year Olds | 81 (100.0%) | 0 (0.0%) |
| 20 to 24 Year Olds | 33 (100.0%) | 0 (0.0%) |
| 25 to 34 Year Olds | 28 (71.8%) | 11 (28.2%) |
| 35 Years and over | 21 (53.8%) | 18 (46.2%) |
| Total | 836 (89.2%) | 101 (10.8%) |
Educational Attainment by Field of Study in Eatonville
Education (55 | 19.3%), business (43 | 15.1%), social sciences (38 | 13.3%), arts & humanities (33 | 11.6%), and bio, nature & agricultural (29 | 10.2%) are the most common fields of study among 285 individuals in Eatonville who have obtained a bachelor's degree or higher.
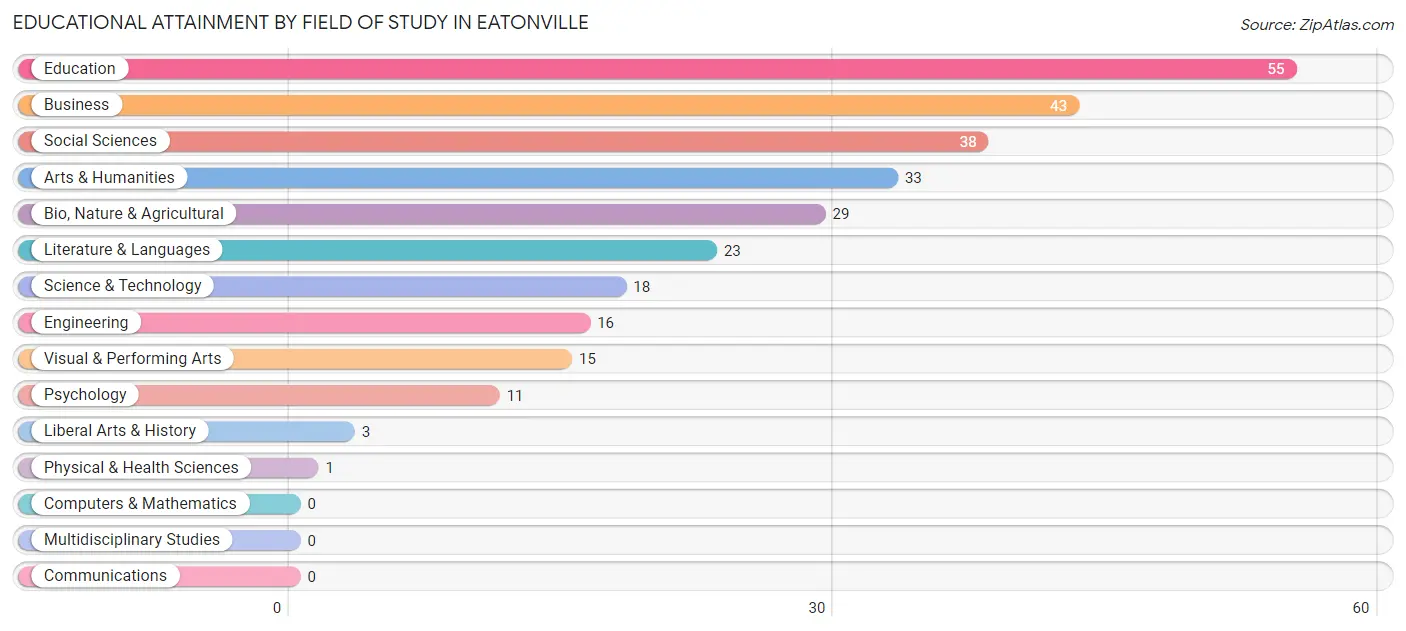
| Field of Study | # Graduates | % Graduates |
| Computers & Mathematics | 0 | 0.0% |
| Bio, Nature & Agricultural | 29 | 10.2% |
| Physical & Health Sciences | 1 | 0.4% |
| Psychology | 11 | 3.9% |
| Social Sciences | 38 | 13.3% |
| Engineering | 16 | 5.6% |
| Multidisciplinary Studies | 0 | 0.0% |
| Science & Technology | 18 | 6.3% |
| Business | 43 | 15.1% |
| Education | 55 | 19.3% |
| Literature & Languages | 23 | 8.1% |
| Liberal Arts & History | 3 | 1.1% |
| Visual & Performing Arts | 15 | 5.3% |
| Communications | 0 | 0.0% |
| Arts & Humanities | 33 | 11.6% |
| Total | 285 | 100.0% |
Transportation & Commute in Eatonville
Vehicle Availability by Sex in Eatonville
The most prevalent vehicle ownership categories in Eatonville are males with 2 vehicles (210, accounting for 33.6%) and females with 2 vehicles (279, making up 30.0%).
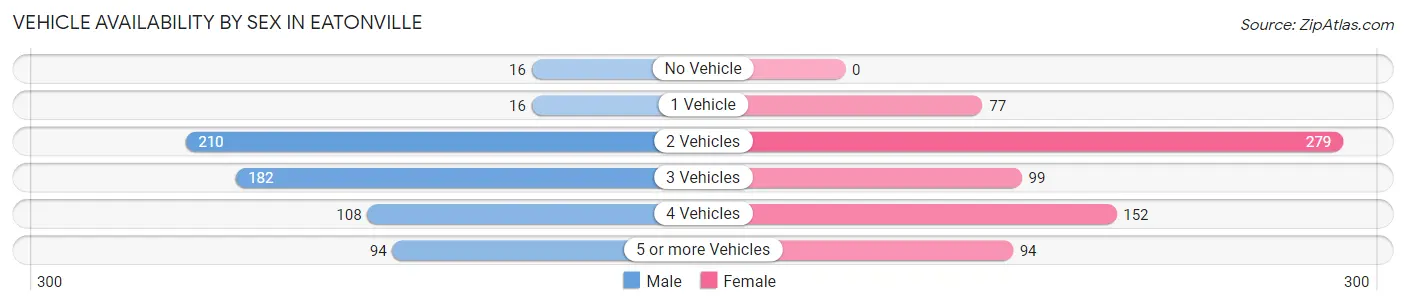
| Vehicles Available | Male | Female |
| No Vehicle | 16 (2.6%) | 0 (0.0%) |
| 1 Vehicle | 16 (2.6%) | 77 (11.0%) |
| 2 Vehicles | 210 (33.6%) | 279 (39.8%) |
| 3 Vehicles | 182 (29.1%) | 99 (14.1%) |
| 4 Vehicles | 108 (17.2%) | 152 (21.7%) |
| 5 or more Vehicles | 94 (15.0%) | 94 (13.4%) |
| Total | 626 (100.0%) | 701 (100.0%) |
Commute Time in Eatonville
The most frequently occuring commute durations in Eatonville are 45 to 59 minutes (314 commuters, 26.0%), 30 to 34 minutes (195 commuters, 16.2%), and less than 5 minutes (157 commuters, 13.0%).
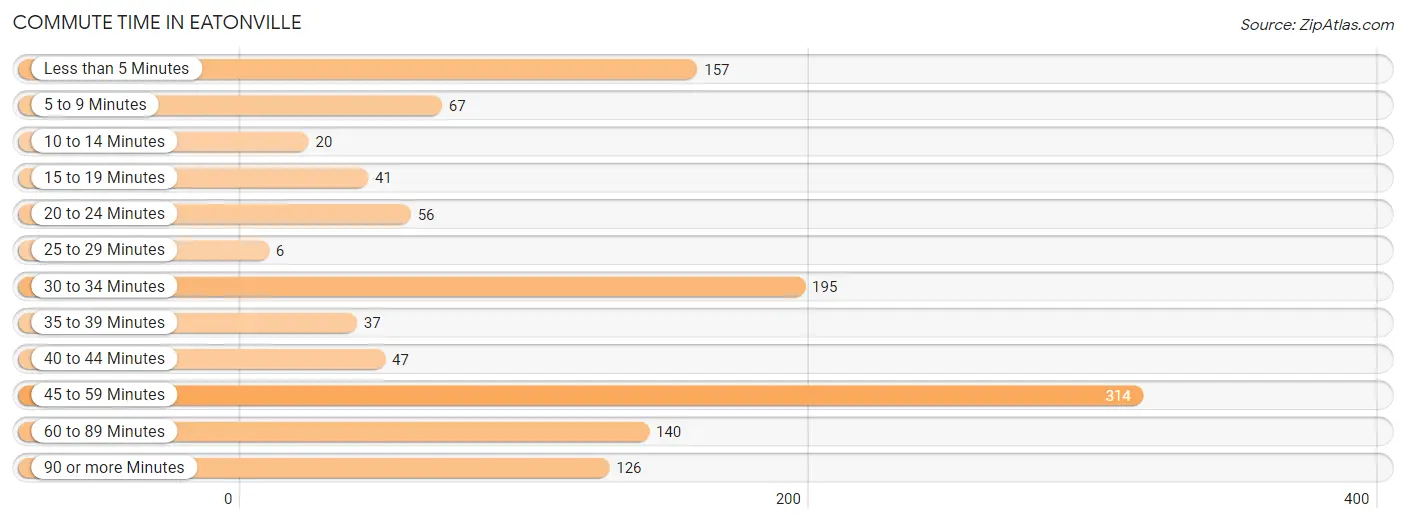
| Commute Time | # Commuters | % Commuters |
| Less than 5 Minutes | 157 | 13.0% |
| 5 to 9 Minutes | 67 | 5.6% |
| 10 to 14 Minutes | 20 | 1.7% |
| 15 to 19 Minutes | 41 | 3.4% |
| 20 to 24 Minutes | 56 | 4.6% |
| 25 to 29 Minutes | 6 | 0.5% |
| 30 to 34 Minutes | 195 | 16.2% |
| 35 to 39 Minutes | 37 | 3.1% |
| 40 to 44 Minutes | 47 | 3.9% |
| 45 to 59 Minutes | 314 | 26.0% |
| 60 to 89 Minutes | 140 | 11.6% |
| 90 or more Minutes | 126 | 10.4% |
Commute Time by Sex in Eatonville
The most common commute times in Eatonville are 45 to 59 minutes (150 commuters, 25.0%) for males and 45 to 59 minutes (164 commuters, 27.1%) for females.
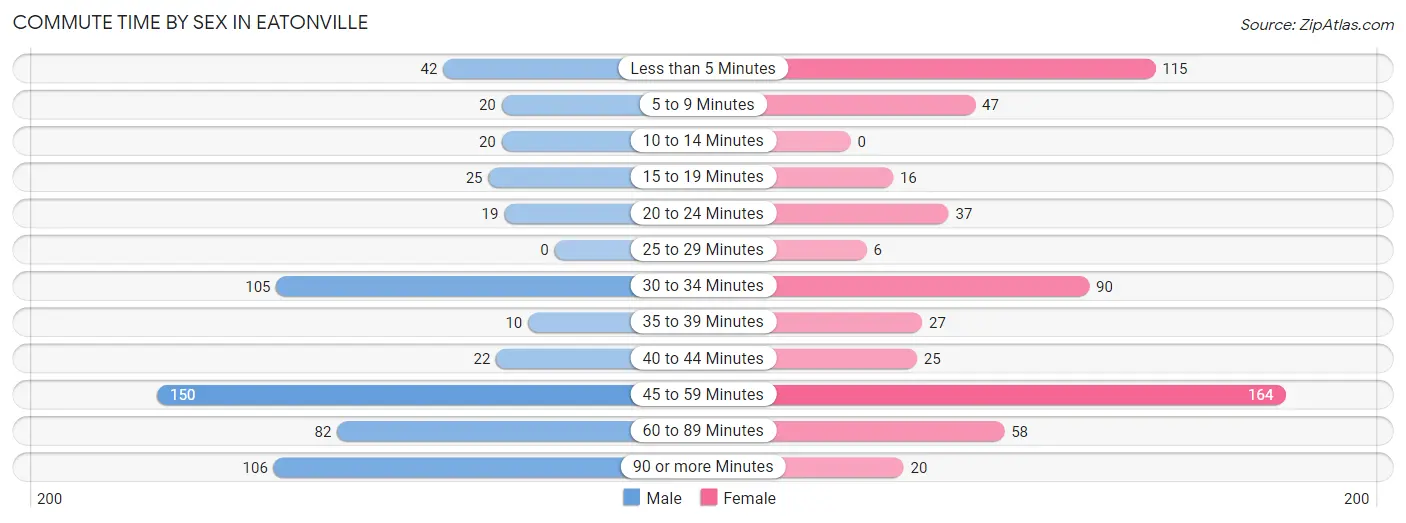
| Commute Time | Male | Female |
| Less than 5 Minutes | 42 (7.0%) | 115 (19.0%) |
| 5 to 9 Minutes | 20 (3.3%) | 47 (7.8%) |
| 10 to 14 Minutes | 20 (3.3%) | 0 (0.0%) |
| 15 to 19 Minutes | 25 (4.2%) | 16 (2.6%) |
| 20 to 24 Minutes | 19 (3.2%) | 37 (6.1%) |
| 25 to 29 Minutes | 0 (0.0%) | 6 (1.0%) |
| 30 to 34 Minutes | 105 (17.5%) | 90 (14.9%) |
| 35 to 39 Minutes | 10 (1.7%) | 27 (4.5%) |
| 40 to 44 Minutes | 22 (3.7%) | 25 (4.1%) |
| 45 to 59 Minutes | 150 (25.0%) | 164 (27.1%) |
| 60 to 89 Minutes | 82 (13.6%) | 58 (9.6%) |
| 90 or more Minutes | 106 (17.6%) | 20 (3.3%) |
Time of Departure to Work by Sex in Eatonville
The most frequent times of departure to work in Eatonville are 12:00 AM to 4:59 AM (92, 15.3%) for males and 12:00 PM to 3:59 PM (154, 25.5%) for females.
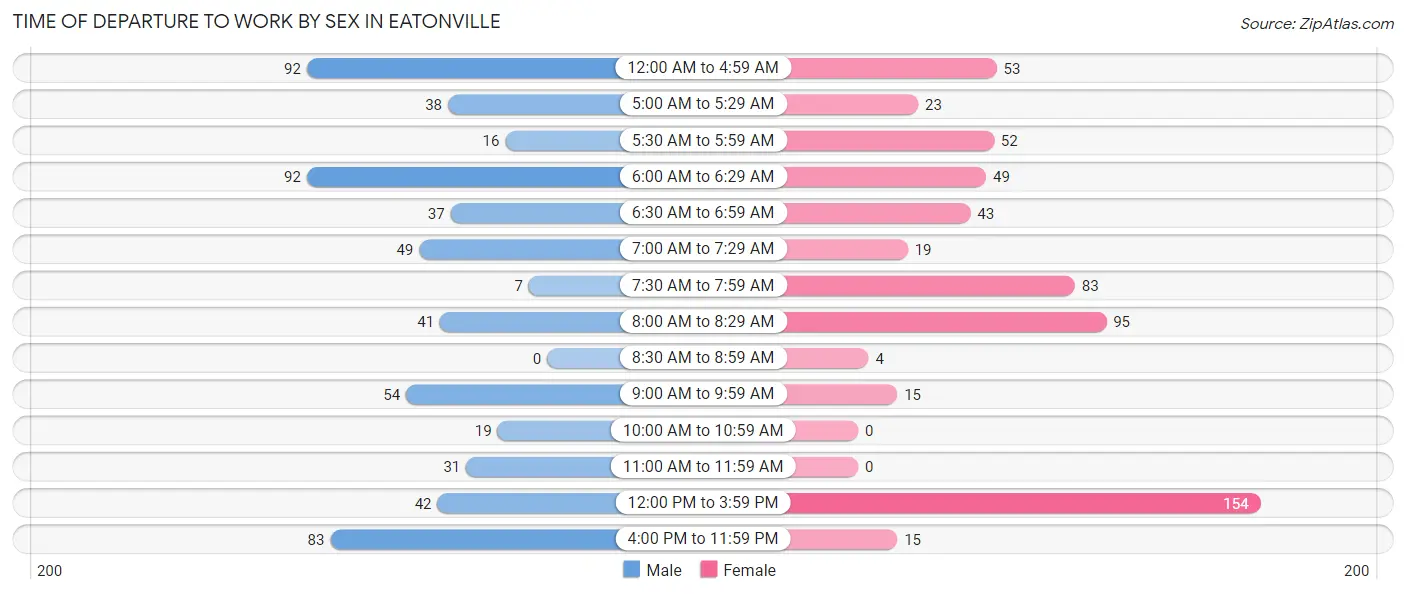
| Time of Departure | Male | Female |
| 12:00 AM to 4:59 AM | 92 (15.3%) | 53 (8.8%) |
| 5:00 AM to 5:29 AM | 38 (6.3%) | 23 (3.8%) |
| 5:30 AM to 5:59 AM | 16 (2.7%) | 52 (8.6%) |
| 6:00 AM to 6:29 AM | 92 (15.3%) | 49 (8.1%) |
| 6:30 AM to 6:59 AM | 37 (6.2%) | 43 (7.1%) |
| 7:00 AM to 7:29 AM | 49 (8.2%) | 19 (3.1%) |
| 7:30 AM to 7:59 AM | 7 (1.2%) | 83 (13.7%) |
| 8:00 AM to 8:29 AM | 41 (6.8%) | 95 (15.7%) |
| 8:30 AM to 8:59 AM | 0 (0.0%) | 4 (0.7%) |
| 9:00 AM to 9:59 AM | 54 (9.0%) | 15 (2.5%) |
| 10:00 AM to 10:59 AM | 19 (3.2%) | 0 (0.0%) |
| 11:00 AM to 11:59 AM | 31 (5.2%) | 0 (0.0%) |
| 12:00 PM to 3:59 PM | 42 (7.0%) | 154 (25.5%) |
| 4:00 PM to 11:59 PM | 83 (13.8%) | 15 (2.5%) |
| Total | 601 (100.0%) | 605 (100.0%) |
Housing Occupancy in Eatonville
Occupancy by Ownership in Eatonville
Of the total 914 dwellings in Eatonville, owner-occupied units account for 645 (70.6%), while renter-occupied units make up 269 (29.4%).
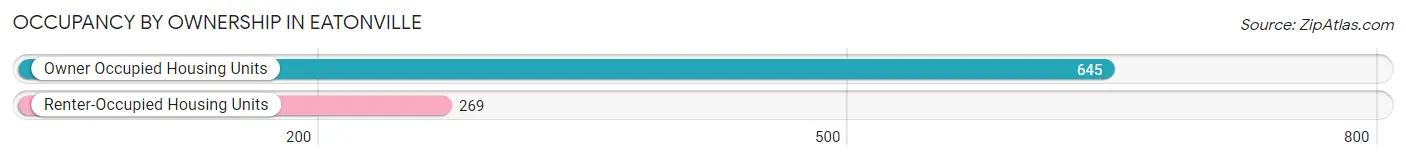
| Occupancy | # Housing Units | % Housing Units |
| Owner Occupied Housing Units | 645 | 70.6% |
| Renter-Occupied Housing Units | 269 | 29.4% |
| Total Occupied Housing Units | 914 | 100.0% |
Occupancy by Household Size in Eatonville
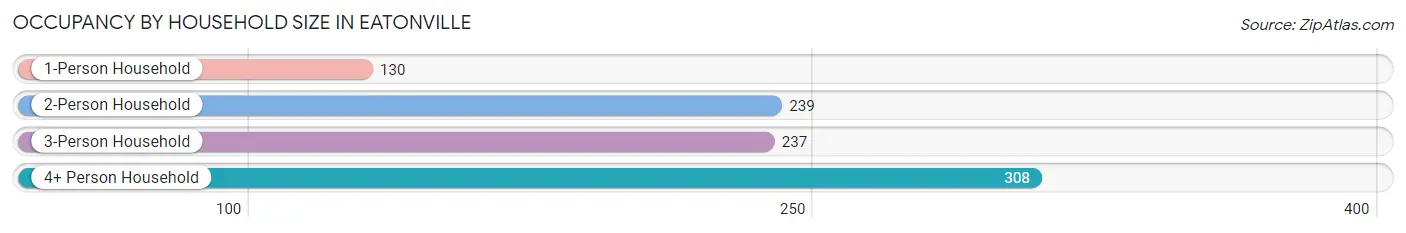
| Household Size | # Housing Units | % Housing Units |
| 1-Person Household | 130 | 14.2% |
| 2-Person Household | 239 | 26.2% |
| 3-Person Household | 237 | 25.9% |
| 4+ Person Household | 308 | 33.7% |
| Total Housing Units | 914 | 100.0% |
Occupancy by Ownership by Household Size in Eatonville
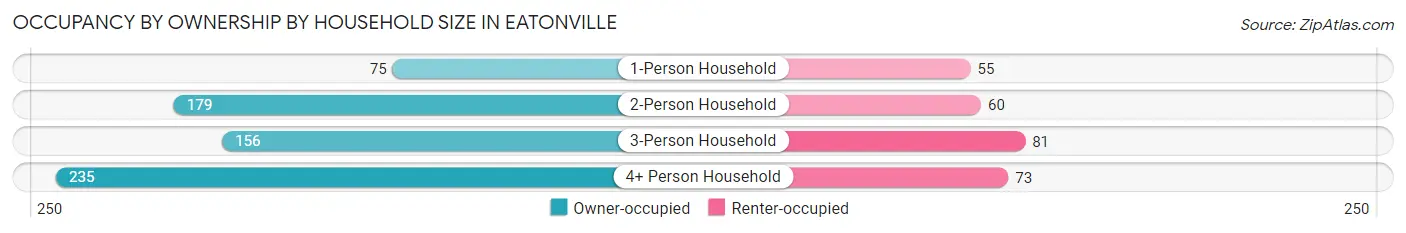
| Household Size | Owner-occupied | Renter-occupied |
| 1-Person Household | 75 (57.7%) | 55 (42.3%) |
| 2-Person Household | 179 (74.9%) | 60 (25.1%) |
| 3-Person Household | 156 (65.8%) | 81 (34.2%) |
| 4+ Person Household | 235 (76.3%) | 73 (23.7%) |
| Total Housing Units | 645 (70.6%) | 269 (29.4%) |
Occupancy by Educational Attainment in Eatonville

| Household Size | Owner-occupied | Renter-occupied |
| Less than High School | 39 (100.0%) | 0 (0.0%) |
| High School Diploma | 180 (61.9%) | 111 (38.1%) |
| College/Associate Degree | 279 (65.8%) | 145 (34.2%) |
| Bachelor's Degree or higher | 147 (91.9%) | 13 (8.1%) |
Occupancy by Age of Householder in Eatonville
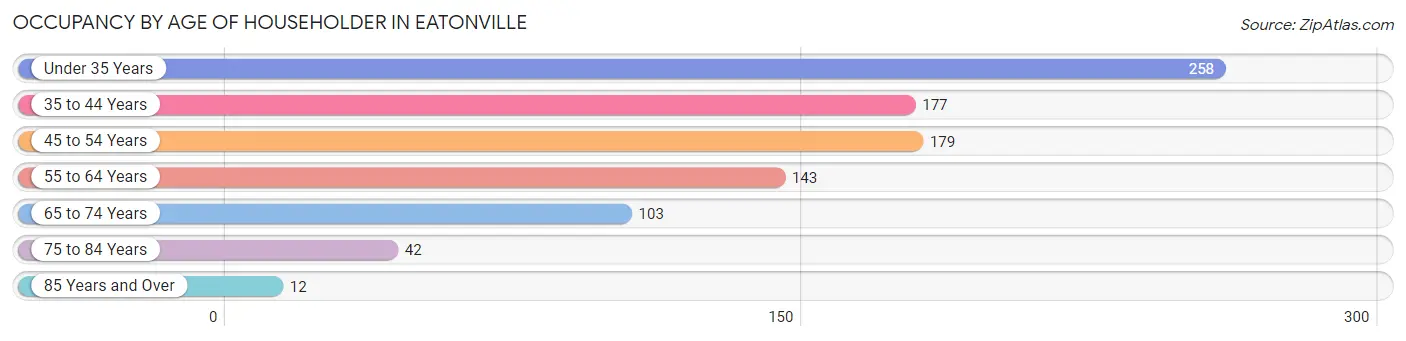
| Age Bracket | # Households | % Households |
| Under 35 Years | 258 | 28.2% |
| 35 to 44 Years | 177 | 19.4% |
| 45 to 54 Years | 179 | 19.6% |
| 55 to 64 Years | 143 | 15.7% |
| 65 to 74 Years | 103 | 11.3% |
| 75 to 84 Years | 42 | 4.6% |
| 85 Years and Over | 12 | 1.3% |
| Total | 914 | 100.0% |
Housing Finances in Eatonville
Median Income by Occupancy in Eatonville
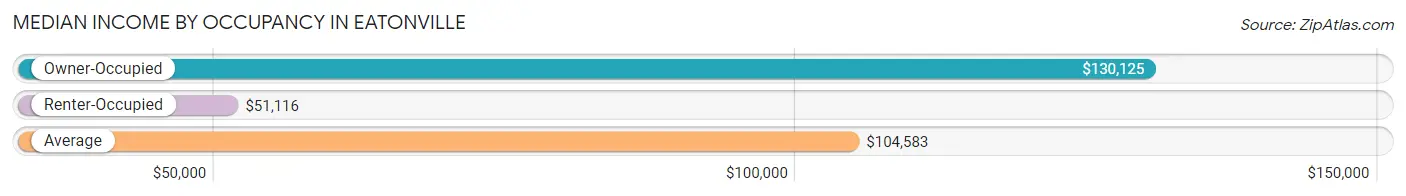
| Occupancy Type | # Households | Median Income |
| Owner-Occupied | 645 (70.6%) | $130,125 |
| Renter-Occupied | 269 (29.4%) | $51,116 |
| Average | 914 (100.0%) | $104,583 |
Occupancy by Householder Income Bracket in Eatonville
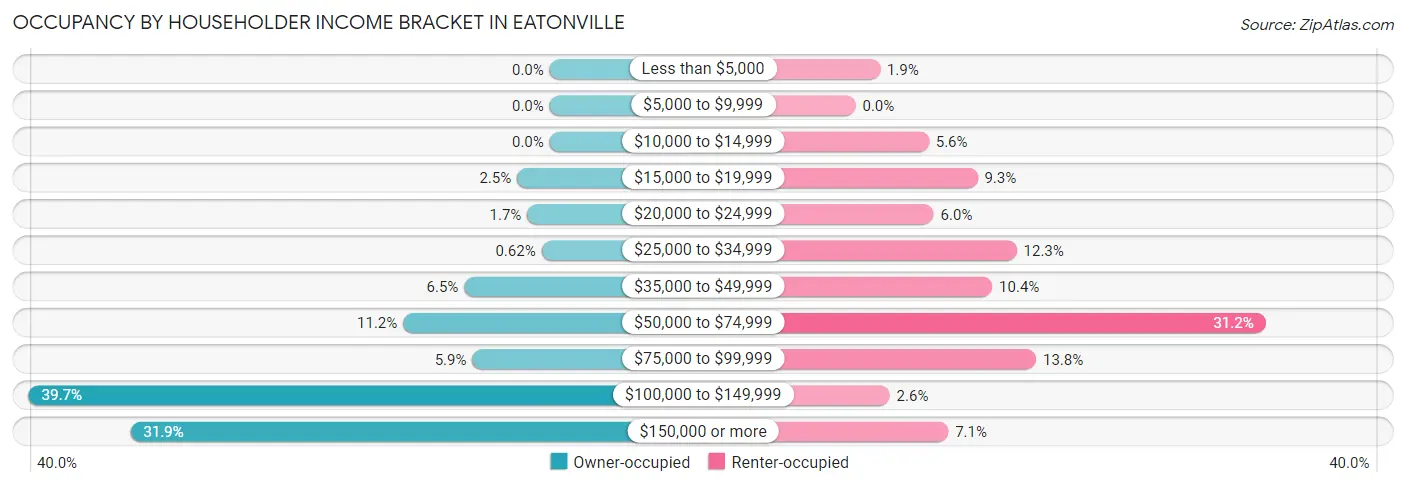
| Income Bracket | Owner-occupied | Renter-occupied |
| Less than $5,000 | 0 (0.0%) | 5 (1.9%) |
| $5,000 to $9,999 | 0 (0.0%) | 0 (0.0%) |
| $10,000 to $14,999 | 0 (0.0%) | 15 (5.6%) |
| $15,000 to $19,999 | 16 (2.5%) | 25 (9.3%) |
| $20,000 to $24,999 | 11 (1.7%) | 16 (5.9%) |
| $25,000 to $34,999 | 4 (0.6%) | 33 (12.3%) |
| $35,000 to $49,999 | 42 (6.5%) | 28 (10.4%) |
| $50,000 to $74,999 | 72 (11.2%) | 84 (31.2%) |
| $75,000 to $99,999 | 38 (5.9%) | 37 (13.8%) |
| $100,000 to $149,999 | 256 (39.7%) | 7 (2.6%) |
| $150,000 or more | 206 (31.9%) | 19 (7.1%) |
| Total | 645 (100.0%) | 269 (100.0%) |
Monthly Housing Cost Tiers in Eatonville
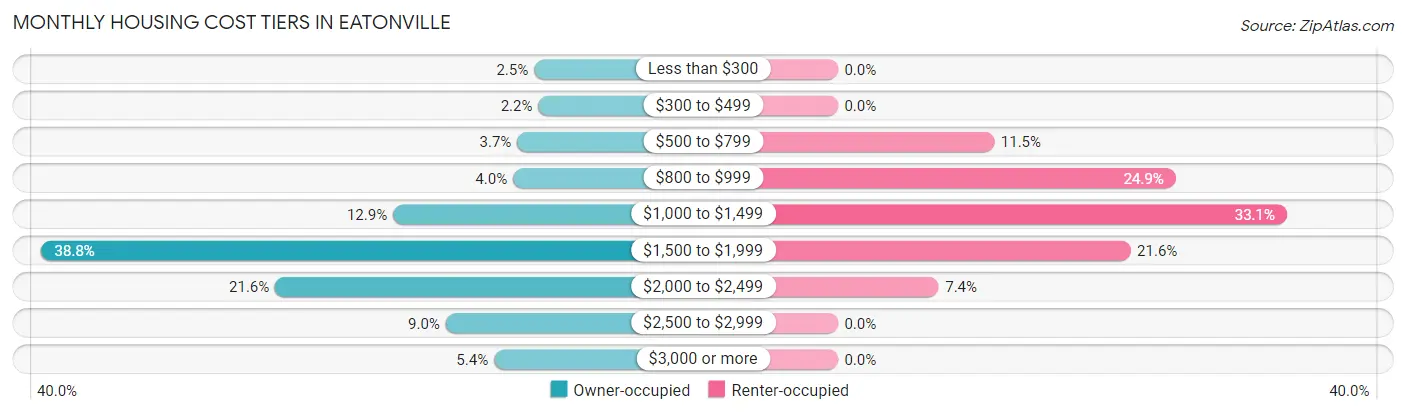
| Monthly Cost | Owner-occupied | Renter-occupied |
| Less than $300 | 16 (2.5%) | 0 (0.0%) |
| $300 to $499 | 14 (2.2%) | 0 (0.0%) |
| $500 to $799 | 24 (3.7%) | 31 (11.5%) |
| $800 to $999 | 26 (4.0%) | 67 (24.9%) |
| $1,000 to $1,499 | 83 (12.9%) | 89 (33.1%) |
| $1,500 to $1,999 | 250 (38.8%) | 58 (21.6%) |
| $2,000 to $2,499 | 139 (21.5%) | 20 (7.4%) |
| $2,500 to $2,999 | 58 (9.0%) | 0 (0.0%) |
| $3,000 or more | 35 (5.4%) | 0 (0.0%) |
| Total | 645 (100.0%) | 269 (100.0%) |
Physical Housing Characteristics in Eatonville
Housing Structures in Eatonville
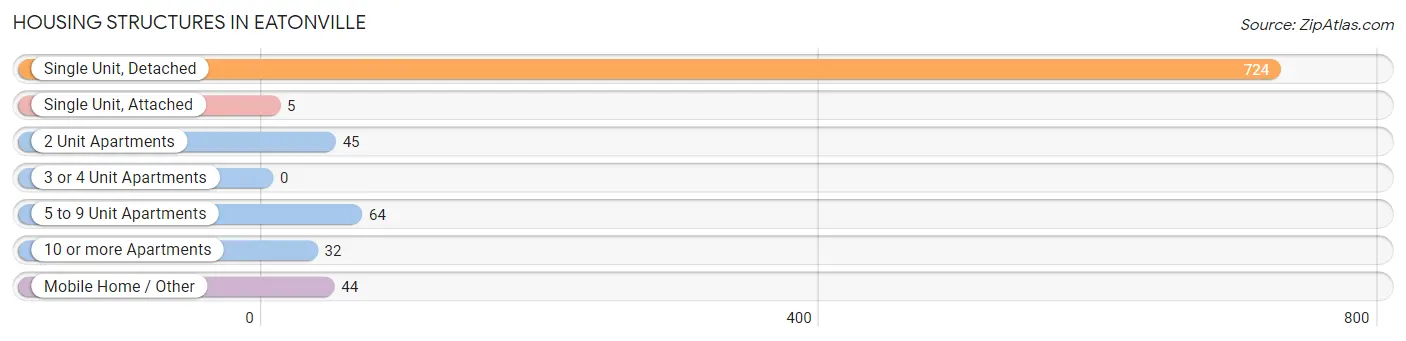
| Structure Type | # Housing Units | % Housing Units |
| Single Unit, Detached | 724 | 79.2% |
| Single Unit, Attached | 5 | 0.5% |
| 2 Unit Apartments | 45 | 4.9% |
| 3 or 4 Unit Apartments | 0 | 0.0% |
| 5 to 9 Unit Apartments | 64 | 7.0% |
| 10 or more Apartments | 32 | 3.5% |
| Mobile Home / Other | 44 | 4.8% |
| Total | 914 | 100.0% |
Housing Structures by Occupancy in Eatonville
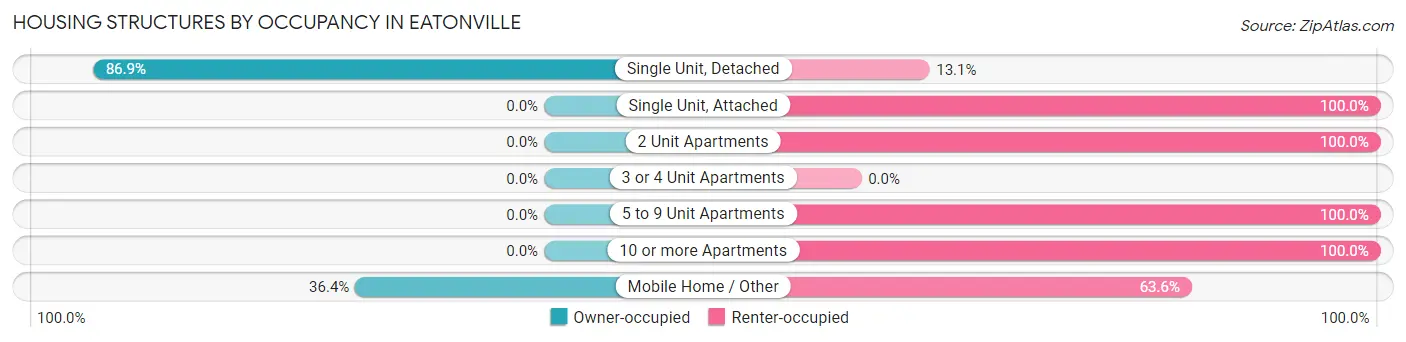
| Structure Type | Owner-occupied | Renter-occupied |
| Single Unit, Detached | 629 (86.9%) | 95 (13.1%) |
| Single Unit, Attached | 0 (0.0%) | 5 (100.0%) |
| 2 Unit Apartments | 0 (0.0%) | 45 (100.0%) |
| 3 or 4 Unit Apartments | 0 (0.0%) | 0 (0.0%) |
| 5 to 9 Unit Apartments | 0 (0.0%) | 64 (100.0%) |
| 10 or more Apartments | 0 (0.0%) | 32 (100.0%) |
| Mobile Home / Other | 16 (36.4%) | 28 (63.6%) |
| Total | 645 (70.6%) | 269 (29.4%) |
Housing Structures by Number of Rooms in Eatonville
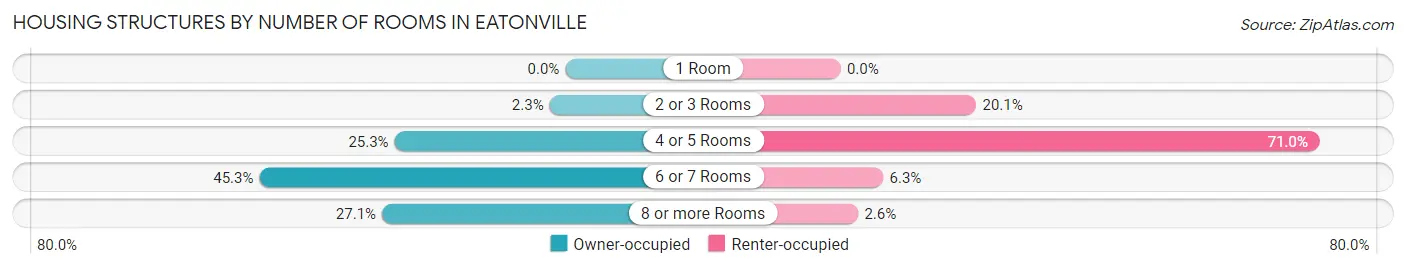
| Number of Rooms | Owner-occupied | Renter-occupied |
| 1 Room | 0 (0.0%) | 0 (0.0%) |
| 2 or 3 Rooms | 15 (2.3%) | 54 (20.1%) |
| 4 or 5 Rooms | 163 (25.3%) | 191 (71.0%) |
| 6 or 7 Rooms | 292 (45.3%) | 17 (6.3%) |
| 8 or more Rooms | 175 (27.1%) | 7 (2.6%) |
| Total | 645 (100.0%) | 269 (100.0%) |
Housing Structure by Heating Type in Eatonville
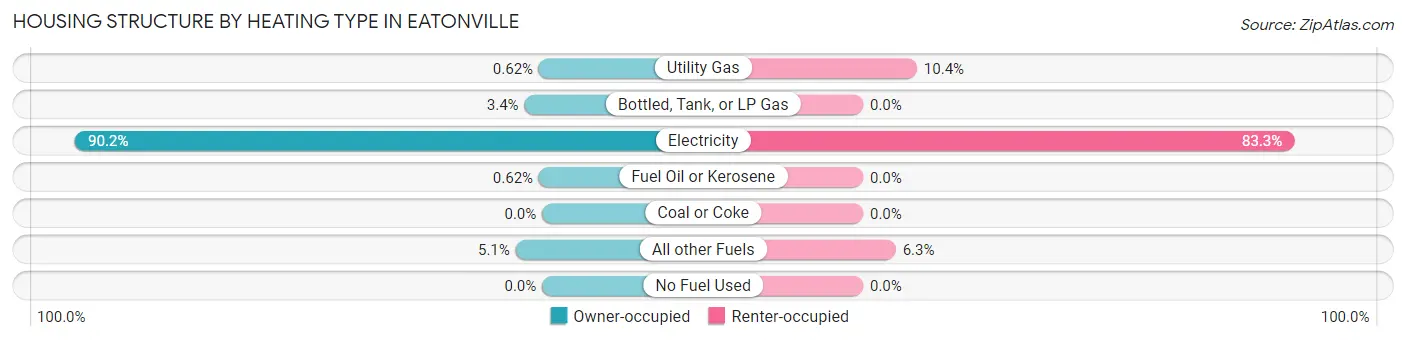
| Heating Type | Owner-occupied | Renter-occupied |
| Utility Gas | 4 (0.6%) | 28 (10.4%) |
| Bottled, Tank, or LP Gas | 22 (3.4%) | 0 (0.0%) |
| Electricity | 582 (90.2%) | 224 (83.3%) |
| Fuel Oil or Kerosene | 4 (0.6%) | 0 (0.0%) |
| Coal or Coke | 0 (0.0%) | 0 (0.0%) |
| All other Fuels | 33 (5.1%) | 17 (6.3%) |
| No Fuel Used | 0 (0.0%) | 0 (0.0%) |
| Total | 645 (100.0%) | 269 (100.0%) |
Household Vehicle Usage in Eatonville
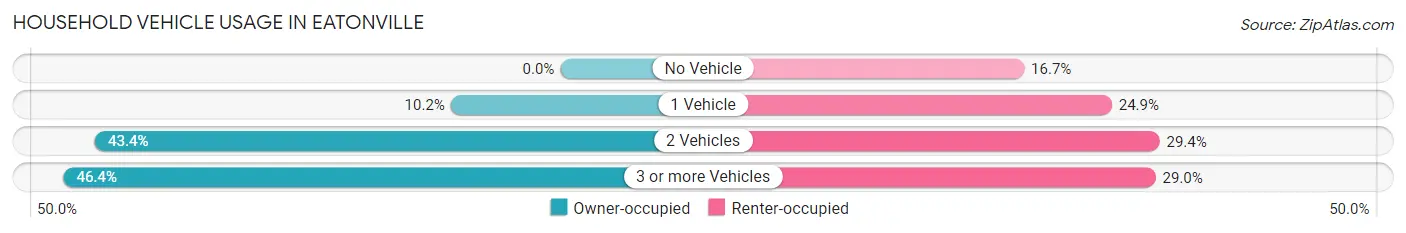
| Vehicles per Household | Owner-occupied | Renter-occupied |
| No Vehicle | 0 (0.0%) | 45 (16.7%) |
| 1 Vehicle | 66 (10.2%) | 67 (24.9%) |
| 2 Vehicles | 280 (43.4%) | 79 (29.4%) |
| 3 or more Vehicles | 299 (46.4%) | 78 (29.0%) |
| Total | 645 (100.0%) | 269 (100.0%) |
Real Estate & Mortgages in Eatonville
Real Estate and Mortgage Overview in Eatonville
| Characteristic | Without Mortgage | With Mortgage |
| Housing Units | 66 | 579 |
| Median Property Value | $408,700 | $351,500 |
| Median Household Income | $53,125 | $206 |
| Monthly Housing Costs | $560 | $29 |
| Real Estate Taxes | $3,200 | $4 |
Property Value by Mortgage Status in Eatonville
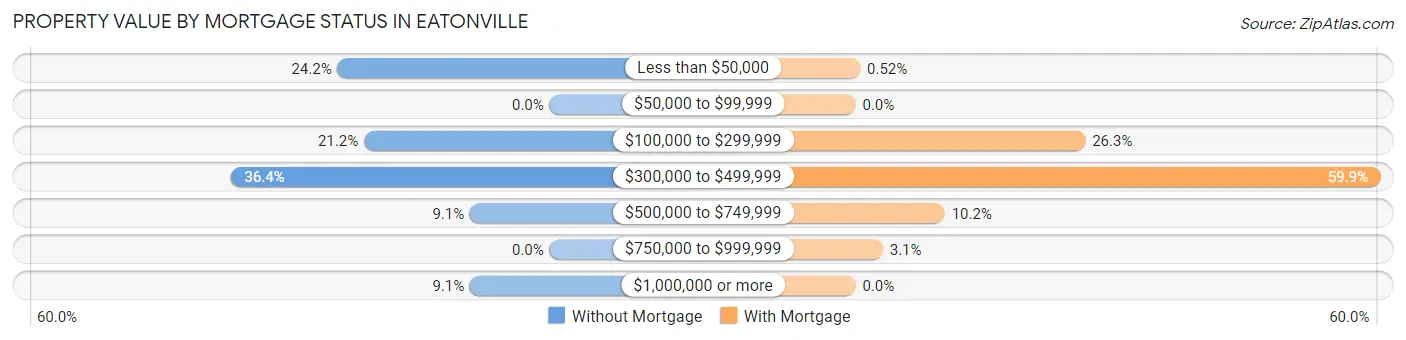
| Property Value | Without Mortgage | With Mortgage |
| Less than $50,000 | 16 (24.2%) | 3 (0.5%) |
| $50,000 to $99,999 | 0 (0.0%) | 0 (0.0%) |
| $100,000 to $299,999 | 14 (21.2%) | 152 (26.3%) |
| $300,000 to $499,999 | 24 (36.4%) | 347 (59.9%) |
| $500,000 to $749,999 | 6 (9.1%) | 59 (10.2%) |
| $750,000 to $999,999 | 0 (0.0%) | 18 (3.1%) |
| $1,000,000 or more | 6 (9.1%) | 0 (0.0%) |
| Total | 66 (100.0%) | 579 (100.0%) |
Household Income by Mortgage Status in Eatonville
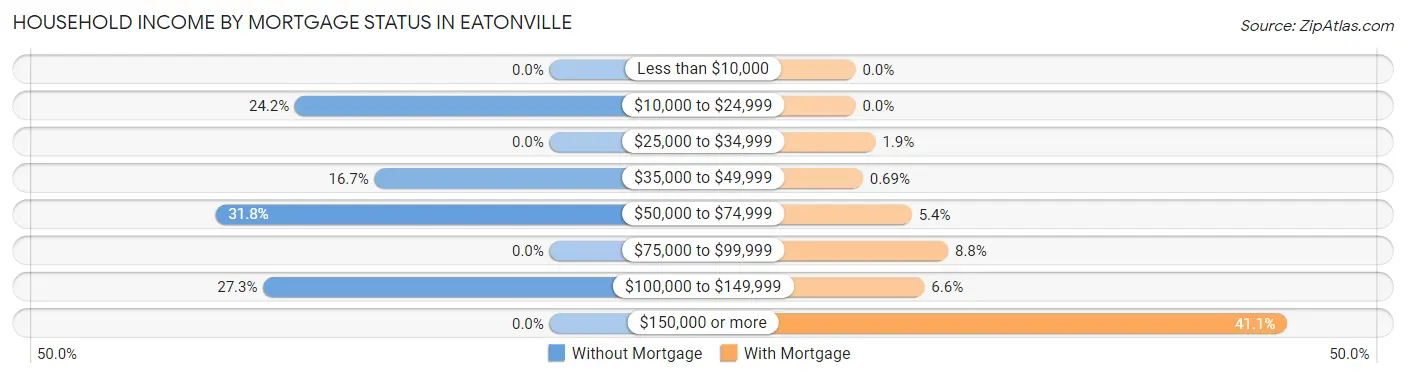
| Household Income | Without Mortgage | With Mortgage |
| Less than $10,000 | 0 (0.0%) | 0 (0.0%) |
| $10,000 to $24,999 | 16 (24.2%) | 0 (0.0%) |
| $25,000 to $34,999 | 0 (0.0%) | 11 (1.9%) |
| $35,000 to $49,999 | 11 (16.7%) | 4 (0.7%) |
| $50,000 to $74,999 | 21 (31.8%) | 31 (5.3%) |
| $75,000 to $99,999 | 0 (0.0%) | 51 (8.8%) |
| $100,000 to $149,999 | 18 (27.3%) | 38 (6.6%) |
| $150,000 or more | 0 (0.0%) | 238 (41.1%) |
| Total | 66 (100.0%) | 579 (100.0%) |
Property Value to Household Income Ratio in Eatonville
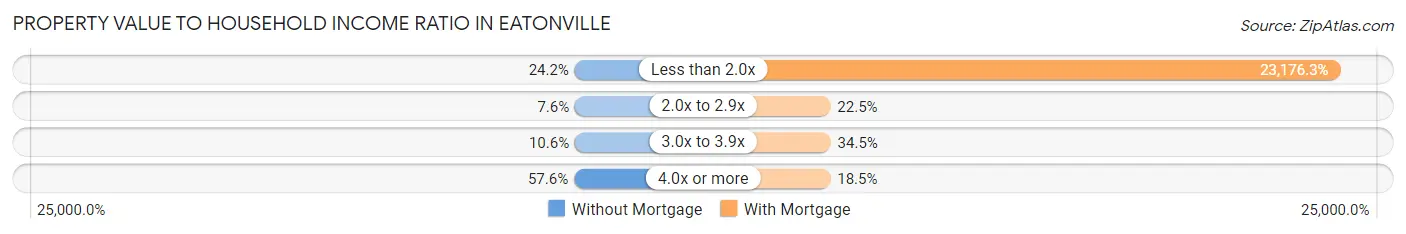
| Value-to-Income Ratio | Without Mortgage | With Mortgage |
| Less than 2.0x | 16 (24.2%) | 134,191 (23,176.3%) |
| 2.0x to 2.9x | 5 (7.6%) | 130 (22.5%) |
| 3.0x to 3.9x | 7 (10.6%) | 200 (34.5%) |
| 4.0x or more | 38 (57.6%) | 107 (18.5%) |
| Total | 66 (100.0%) | 579 (100.0%) |
Real Estate Taxes by Mortgage Status in Eatonville
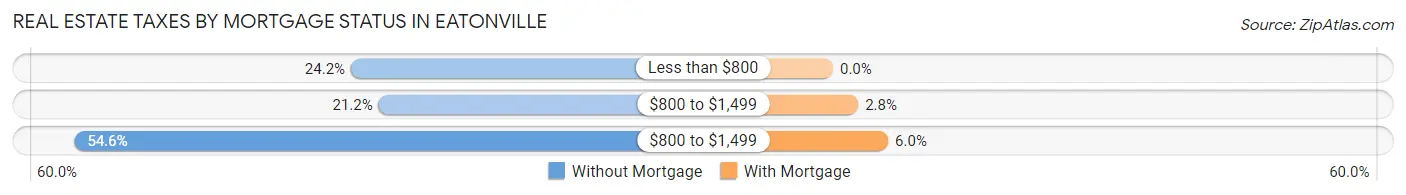
| Property Taxes | Without Mortgage | With Mortgage |
| Less than $800 | 16 (24.2%) | 0 (0.0%) |
| $800 to $1,499 | 14 (21.2%) | 16 (2.8%) |
| $800 to $1,499 | 36 (54.5%) | 35 (6.0%) |
| Total | 66 (100.0%) | 579 (100.0%) |
Health & Disability in Eatonville
Health Insurance Coverage by Age in Eatonville
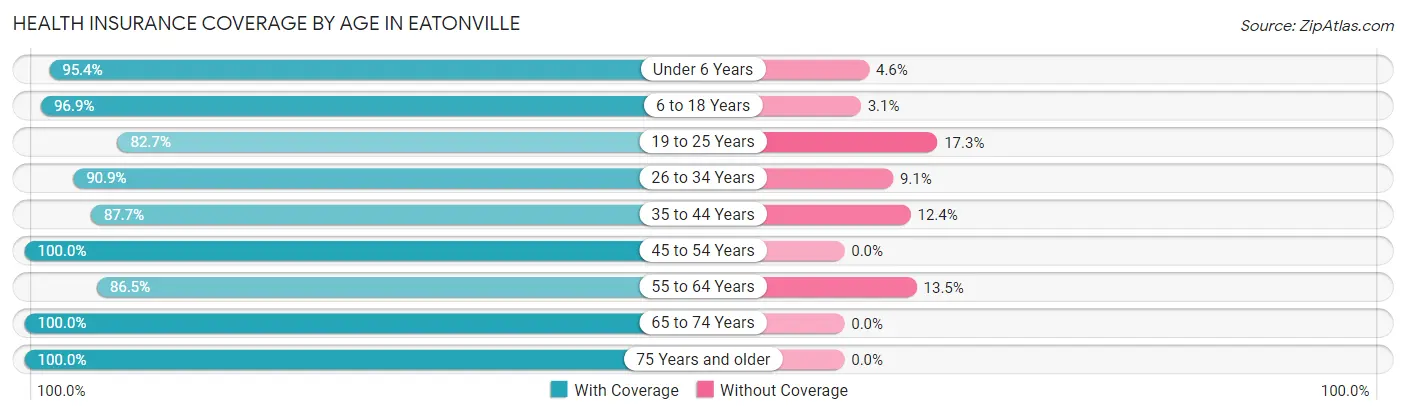
| Age Bracket | With Coverage | Without Coverage |
| Under 6 Years | 269 (95.4%) | 13 (4.6%) |
| 6 to 18 Years | 665 (96.9%) | 21 (3.1%) |
| 19 to 25 Years | 291 (82.7%) | 61 (17.3%) |
| 26 to 34 Years | 321 (90.9%) | 32 (9.1%) |
| 35 to 44 Years | 284 (87.6%) | 40 (12.3%) |
| 45 to 54 Years | 312 (100.0%) | 0 (0.0%) |
| 55 to 64 Years | 199 (86.5%) | 31 (13.5%) |
| 65 to 74 Years | 196 (100.0%) | 0 (0.0%) |
| 75 Years and older | 87 (100.0%) | 0 (0.0%) |
| Total | 2,624 (93.0%) | 198 (7.0%) |
Health Insurance Coverage by Citizenship Status in Eatonville
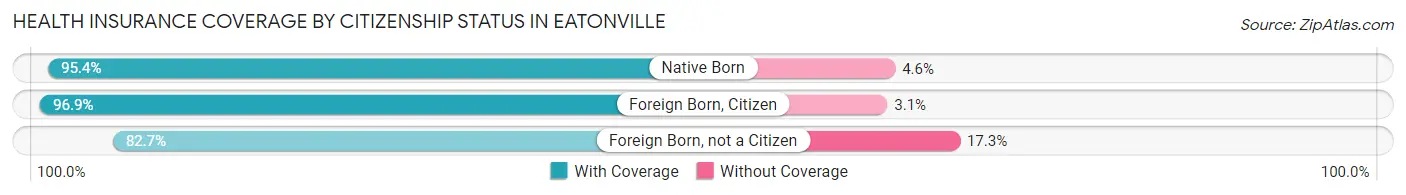
| Citizenship Status | With Coverage | Without Coverage |
| Native Born | 269 (95.4%) | 13 (4.6%) |
| Foreign Born, Citizen | 665 (96.9%) | 21 (3.1%) |
| Foreign Born, not a Citizen | 291 (82.7%) | 61 (17.3%) |
Health Insurance Coverage by Household Income in Eatonville
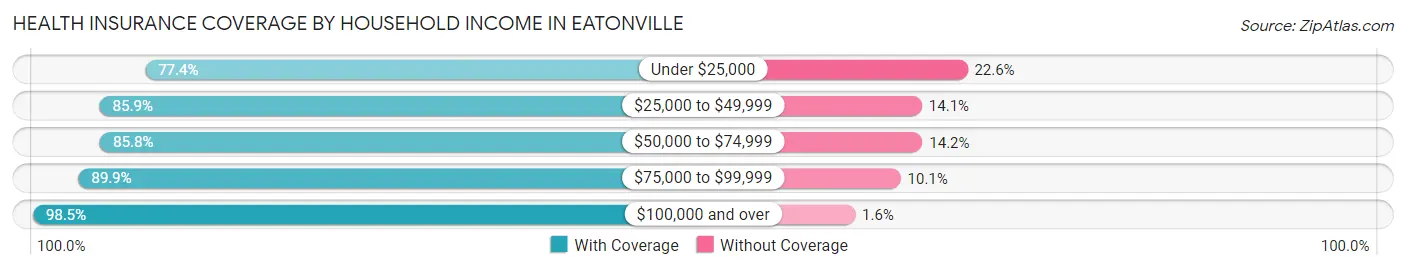
| Household Income | With Coverage | Without Coverage |
| Under $25,000 | 113 (77.4%) | 33 (22.6%) |
| $25,000 to $49,999 | 226 (85.9%) | 37 (14.1%) |
| $50,000 to $74,999 | 479 (85.8%) | 79 (14.2%) |
| $75,000 to $99,999 | 214 (89.9%) | 24 (10.1%) |
| $100,000 and over | 1,592 (98.5%) | 25 (1.5%) |
Public vs Private Health Insurance Coverage by Age in Eatonville
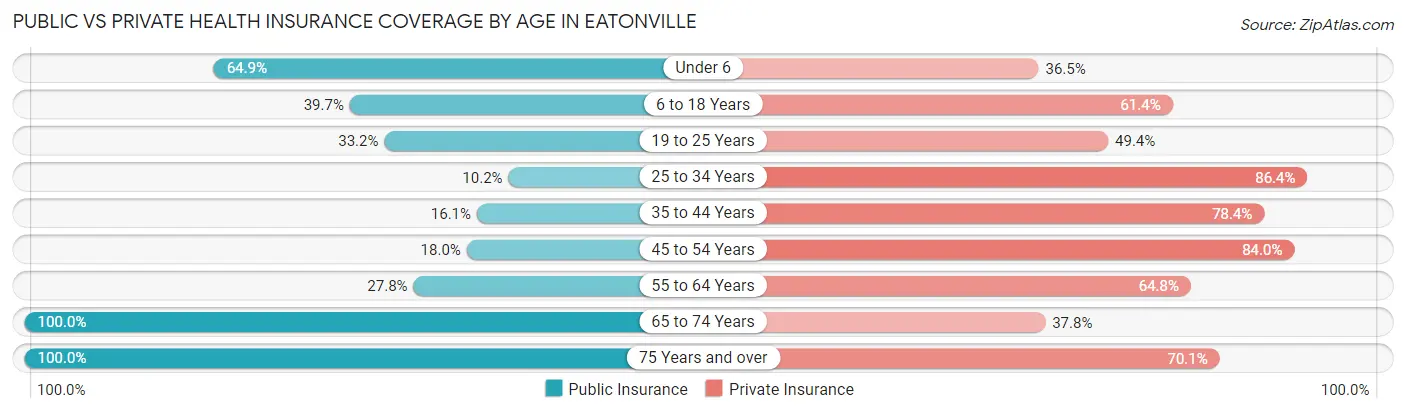
| Age Bracket | Public Insurance | Private Insurance |
| Under 6 | 183 (64.9%) | 103 (36.5%) |
| 6 to 18 Years | 272 (39.7%) | 421 (61.4%) |
| 19 to 25 Years | 117 (33.2%) | 174 (49.4%) |
| 25 to 34 Years | 36 (10.2%) | 305 (86.4%) |
| 35 to 44 Years | 52 (16.1%) | 254 (78.4%) |
| 45 to 54 Years | 56 (17.9%) | 262 (84.0%) |
| 55 to 64 Years | 64 (27.8%) | 149 (64.8%) |
| 65 to 74 Years | 196 (100.0%) | 74 (37.8%) |
| 75 Years and over | 87 (100.0%) | 61 (70.1%) |
| Total | 1,063 (37.7%) | 1,803 (63.9%) |
Disability Status by Sex by Age in Eatonville
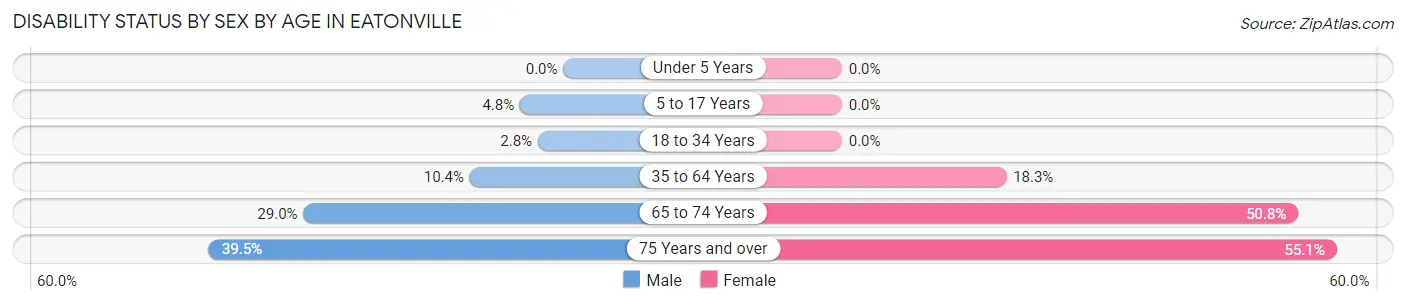
| Age Bracket | Male | Female |
| Under 5 Years | 0 (0.0%) | 0 (0.0%) |
| 5 to 17 Years | 15 (4.8%) | 0 (0.0%) |
| 18 to 34 Years | 8 (2.8%) | 0 (0.0%) |
| 35 to 64 Years | 47 (10.4%) | 76 (18.3%) |
| 65 to 74 Years | 22 (28.9%) | 61 (50.8%) |
| 75 Years and over | 15 (39.5%) | 27 (55.1%) |
Disability Class by Sex by Age in Eatonville
Disability Class: Hearing Difficulty
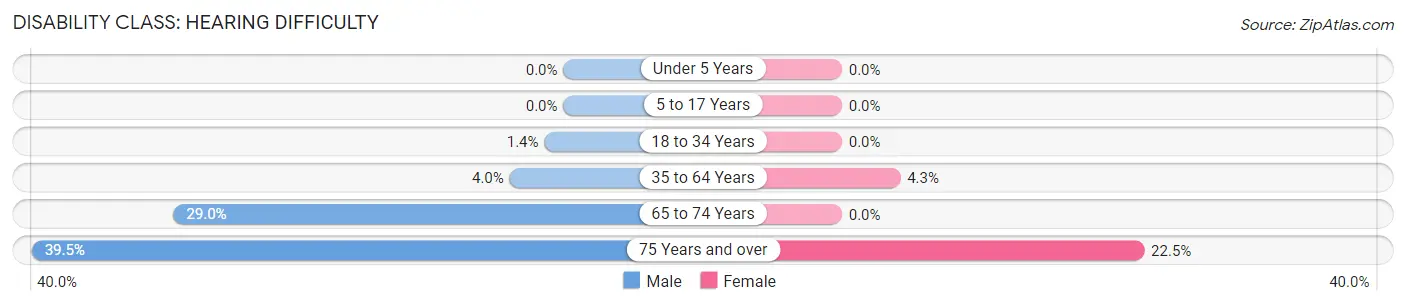
| Age Bracket | Male | Female |
| Under 5 Years | 0 (0.0%) | 0 (0.0%) |
| 5 to 17 Years | 0 (0.0%) | 0 (0.0%) |
| 18 to 34 Years | 4 (1.4%) | 0 (0.0%) |
| 35 to 64 Years | 18 (4.0%) | 18 (4.3%) |
| 65 to 74 Years | 22 (28.9%) | 0 (0.0%) |
| 75 Years and over | 15 (39.5%) | 11 (22.5%) |
Disability Class: Vision Difficulty
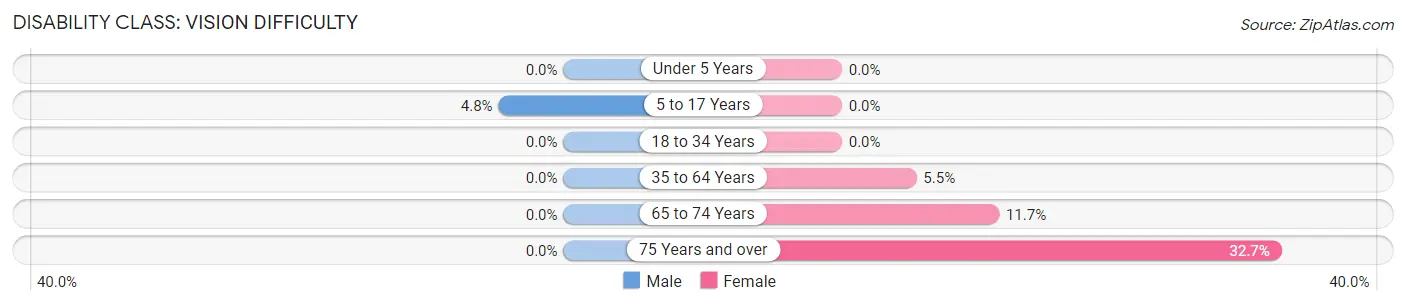
| Age Bracket | Male | Female |
| Under 5 Years | 0 (0.0%) | 0 (0.0%) |
| 5 to 17 Years | 15 (4.8%) | 0 (0.0%) |
| 18 to 34 Years | 0 (0.0%) | 0 (0.0%) |
| 35 to 64 Years | 0 (0.0%) | 23 (5.5%) |
| 65 to 74 Years | 0 (0.0%) | 14 (11.7%) |
| 75 Years and over | 0 (0.0%) | 16 (32.7%) |
Disability Class: Cognitive Difficulty
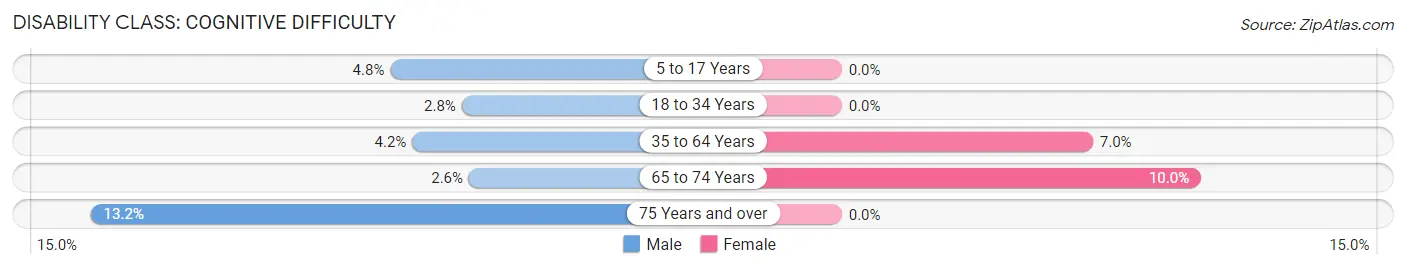
| Age Bracket | Male | Female |
| 5 to 17 Years | 15 (4.8%) | 0 (0.0%) |
| 18 to 34 Years | 8 (2.8%) | 0 (0.0%) |
| 35 to 64 Years | 19 (4.2%) | 29 (7.0%) |
| 65 to 74 Years | 2 (2.6%) | 12 (10.0%) |
| 75 Years and over | 5 (13.2%) | 0 (0.0%) |
Disability Class: Ambulatory Difficulty
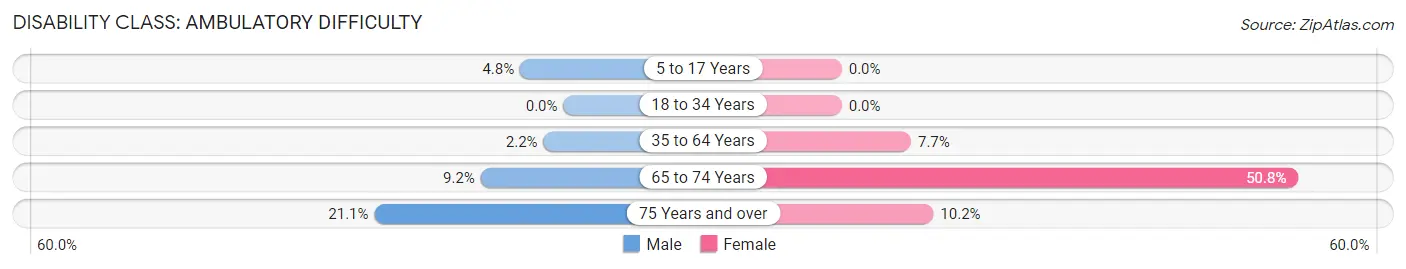
| Age Bracket | Male | Female |
| 5 to 17 Years | 15 (4.8%) | 0 (0.0%) |
| 18 to 34 Years | 0 (0.0%) | 0 (0.0%) |
| 35 to 64 Years | 10 (2.2%) | 32 (7.7%) |
| 65 to 74 Years | 7 (9.2%) | 61 (50.8%) |
| 75 Years and over | 8 (21.0%) | 5 (10.2%) |
Disability Class: Self-Care Difficulty
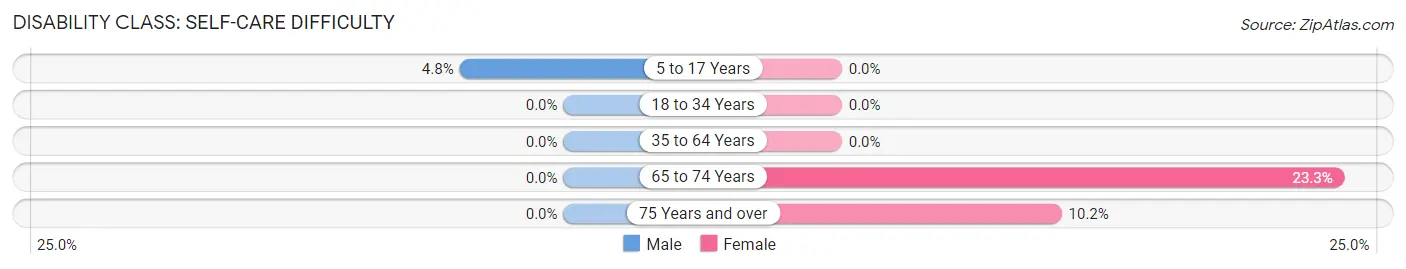
| Age Bracket | Male | Female |
| 5 to 17 Years | 15 (4.8%) | 0 (0.0%) |
| 18 to 34 Years | 0 (0.0%) | 0 (0.0%) |
| 35 to 64 Years | 0 (0.0%) | 0 (0.0%) |
| 65 to 74 Years | 0 (0.0%) | 28 (23.3%) |
| 75 Years and over | 0 (0.0%) | 5 (10.2%) |
Technology Access in Eatonville
Computing Device Access in Eatonville
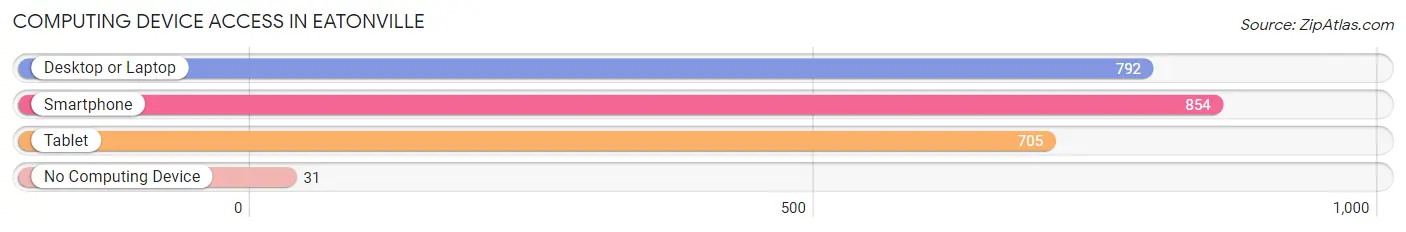
| Device Type | # Households | % Households |
| Desktop or Laptop | 792 | 86.7% |
| Smartphone | 854 | 93.4% |
| Tablet | 705 | 77.1% |
| No Computing Device | 31 | 3.4% |
| Total | 914 | 100.0% |
Internet Access in Eatonville
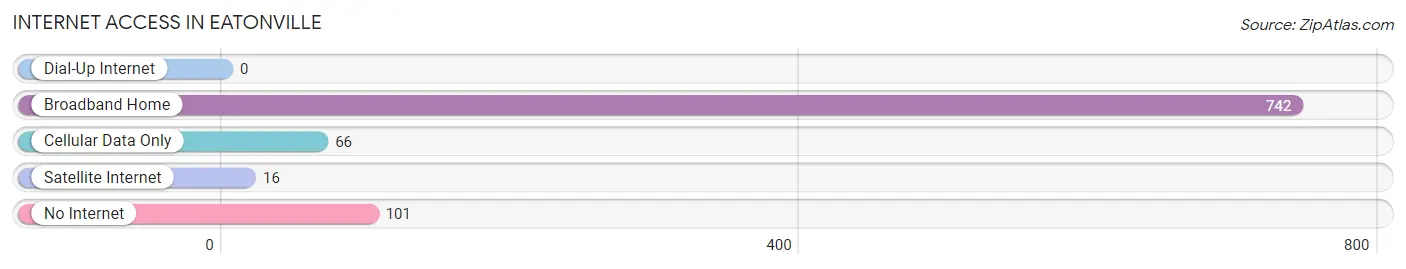
| Internet Type | # Households | % Households |
| Dial-Up Internet | 0 | 0.0% |
| Broadband Home | 742 | 81.2% |
| Cellular Data Only | 66 | 7.2% |
| Satellite Internet | 16 | 1.8% |
| No Internet | 101 | 11.1% |
| Total | 914 | 100.0% |
Eatonville Summary
Eatonville, Washington is a small town located in Pierce County, Washington, United States. It is situated in the foothills of the Cascade Mountains, approximately 25 miles south of Tacoma and 40 miles southeast of Seattle. The town has a population of 2,711 as of the 2010 census, making it the smallest incorporated town in the state of Washington.
History
Eatonville was founded in 1883 by Thomas C. Van Eaton, a Civil War veteran who had moved to the area from Iowa. He named the town after himself and began to develop it as a logging and farming community. The town was officially incorporated in 1891 and was the first incorporated town in Pierce County.
In the early 1900s, Eatonville was a thriving logging and farming community. The town was home to several sawmills, a shingle mill, and a grist mill. The town also had a hotel, a general store, a post office, and a school.
In the 1920s, the logging industry began to decline and the town’s economy shifted to focus on tourism. The town was a popular destination for outdoor recreation, such as fishing, hunting, and camping. The town also became a popular destination for weekend getaways and summer vacations.
In the 1950s, the town began to experience a decline in population as people moved away to larger cities. The town’s economy shifted to focus on the timber industry once again, and the town’s population began to slowly increase.
Geography
Eatonville is located in the foothills of the Cascade Mountains, approximately 25 miles south of Tacoma and 40 miles southeast of Seattle. The town is situated on the banks of the Nisqually River, which flows through the town and provides a source of recreation for the town’s residents.
The town is surrounded by forests and mountains, providing a beautiful backdrop for outdoor activities. The town is also located close to several lakes, including Lake Kapowsin, Lake Tanwax, and Lake Mayfield.
Economy
The economy of Eatonville is largely based on the timber industry. The town is home to several sawmills and logging companies, which provide employment for many of the town’s residents.
The town is also home to several small businesses, including restaurants, retail stores, and service providers. The town is also home to several tourist attractions, such as the Nisqually National Wildlife Refuge and the Mount Rainier National Park.
Demographics
As of the 2010 census, the population of Eatonville was 2,711. The town has a median age of 39.7 years and a median household income of $45,945. The town is predominantly white (90.2%), with small percentages of African American (2.2%), Native American (1.2%), Asian (1.1%), and Hispanic (2.3%) residents.
Conclusion
Eatonville, Washington is a small town located in Pierce County, Washington, United States. It is situated in the foothills of the Cascade Mountains, approximately 25 miles south of Tacoma and 40 miles southeast of Seattle. The town has a population of 2,711 as of the 2010 census, making it the smallest incorporated town in the state of Washington. The town’s economy is largely based on the timber industry, and the town is also home to several small businesses and tourist attractions. The town is predominantly white, with small percentages of African American, Native American, Asian, and Hispanic residents.
Common Questions
What is Per Capita Income in Eatonville?
Per Capita income in Eatonville is $36,835.
What is the Median Family Income in Eatonville?
Median Family Income in Eatonville is $100,250.
What is the Median Household income in Eatonville?
Median Household Income in Eatonville is $104,583.
What is Income or Wage Gap in Eatonville?
Income or Wage Gap in Eatonville is 40.5%.
Women in Eatonville earn 59.5 cents for every dollar earned by a man.
What is Family Income Deficit in Eatonville?
Family Income Deficit in Eatonville is $9,168.
Families that are below poverty line in Eatonville earn $9,168 less on average than the poverty threshold level.
What is Inequality or Gini Index in Eatonville?
Inequality or Gini Index in Eatonville is 0.37.
What is the Total Population of Eatonville?
Total Population of Eatonville is 2,845.
What is the Total Male Population of Eatonville?
Total Male Population of Eatonville is 1,310.
What is the Total Female Population of Eatonville?
Total Female Population of Eatonville is 1,535.
What is the Ratio of Males per 100 Females in Eatonville?
There are 85.34 Males per 100 Females in Eatonville.
What is the Ratio of Females per 100 Males in Eatonville?
There are 117.18 Females per 100 Males in Eatonville.
What is the Median Population Age in Eatonville?
Median Population Age in Eatonville is 28.5 Years.
What is the Average Family Size in Eatonville
Average Family Size in Eatonville is 3.4 People.
What is the Average Household Size in Eatonville
Average Household Size in Eatonville is 3.1 People.
How Large is the Labor Force in Eatonville?
There are 1,475 People in the Labor Forcein in Eatonville.
What is the Percentage of People in the Labor Force in Eatonville?
73.3% of People are in the Labor Force in Eatonville.
What is the Unemployment Rate in Eatonville?
Unemployment Rate in Eatonville is 5.0%.