Lake Shore, WA Map & Demographics
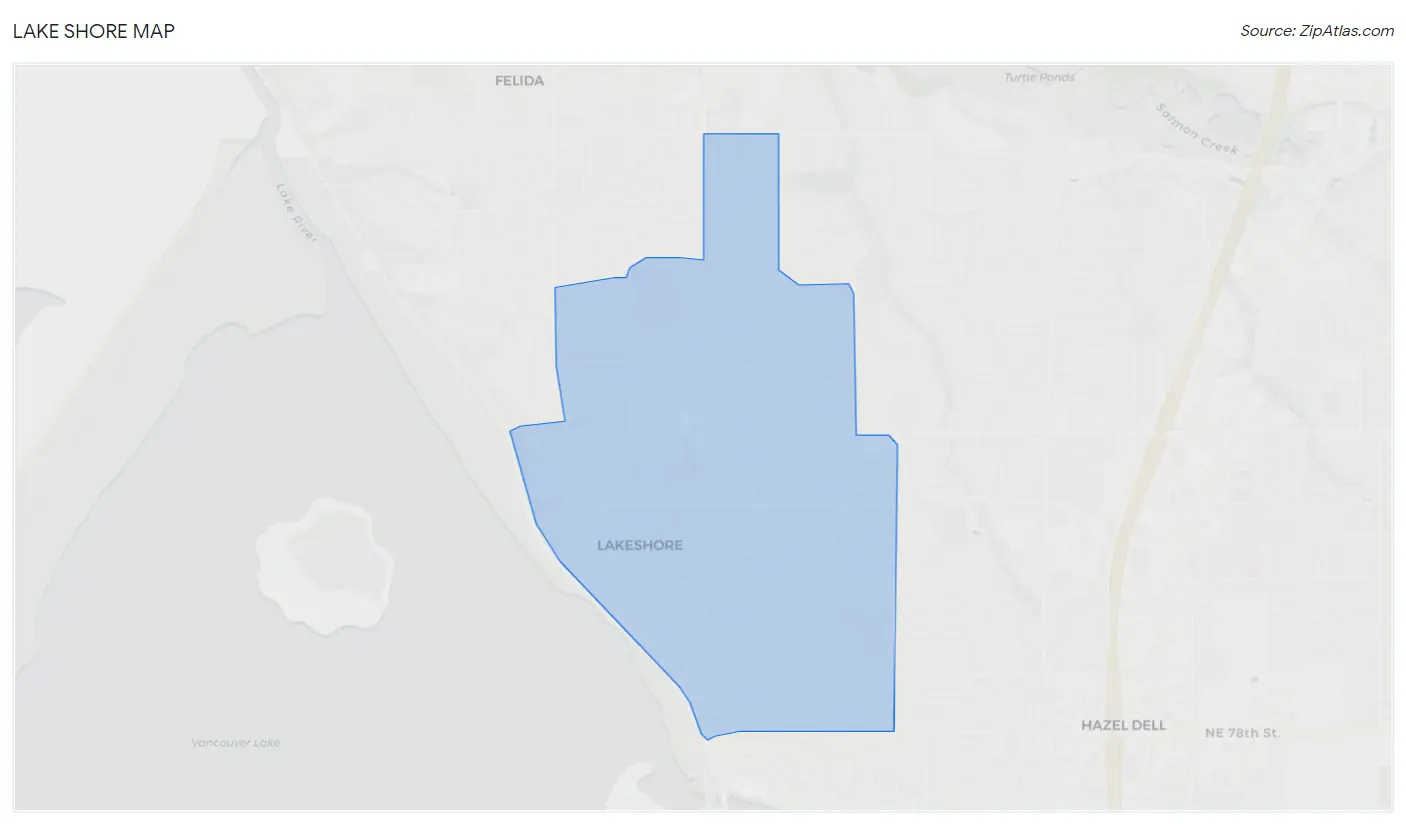
Lake Shore Map
Lake Shore Overview
$54,885
PER CAPITA INCOME
$142,411
AVG FAMILY INCOME
$130,985
AVG HOUSEHOLD INCOME
36.9%
WAGE / INCOME GAP [ % ]
63.1¢/ $1
WAGE / INCOME GAP [ $ ]
0.33
INEQUALITY / GINI INDEX
6,587
TOTAL POPULATION
3,351
MALE POPULATION
3,236
FEMALE POPULATION
103.55
MALES / 100 FEMALES
96.57
FEMALES / 100 MALES
47.1
MEDIAN AGE
2.8
AVG FAMILY SIZE
2.5
AVG HOUSEHOLD SIZE
3,680
LABOR FORCE [ PEOPLE ]
66.9%
PERCENT IN LABOR FORCE
3.8%
UNEMPLOYMENT RATE
Income in Lake Shore
Income Overview in Lake Shore
Per Capita Income in Lake Shore is $54,885, while median incomes of families and households are $142,411 and $130,985 respectively.
| Characteristic | Number | Measure |
| Per Capita Income | 6,587 | $54,885 |
| Median Family Income | 2,046 | $142,411 |
| Mean Family Income | 2,046 | $149,254 |
| Median Household Income | 2,626 | $130,985 |
| Mean Household Income | 2,626 | $137,041 |
| Income Deficit | 2,046 | $0 |
| Wage / Income Gap (%) | 6,587 | 36.87% |
| Wage / Income Gap ($) | 6,587 | 63.13¢ per $1 |
| Gini / Inequality Index | 6,587 | 0.33 |
Earnings by Sex in Lake Shore
Average Earnings in Lake Shore are $66,440, $80,625 for men and $50,901 for women, a difference of 36.9%.
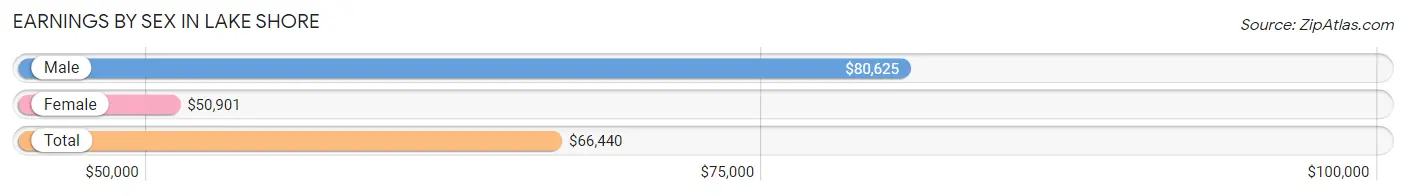
| Sex | Number | Average Earnings |
| Male | 2,120 (57.3%) | $80,625 |
| Female | 1,577 (42.7%) | $50,901 |
| Total | 3,697 (100.0%) | $66,440 |
Earnings by Sex by Income Bracket in Lake Shore
The most common earnings brackets in Lake Shore are $100,000+ for men (702 | 33.1%) and $100,000+ for women (316 | 20.0%).
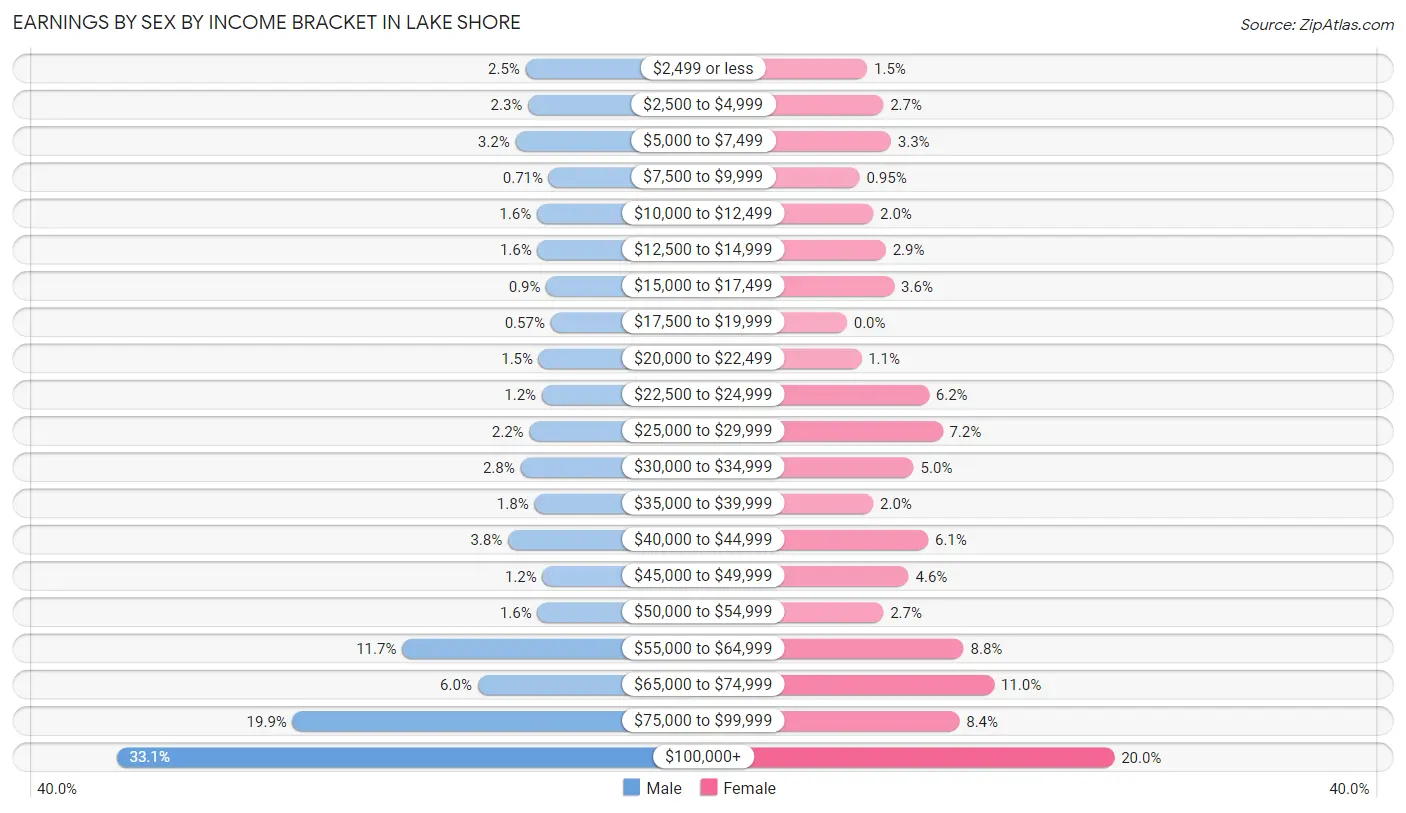
| Income | Male | Female |
| $2,499 or less | 52 (2.5%) | 24 (1.5%) |
| $2,500 to $4,999 | 48 (2.3%) | 43 (2.7%) |
| $5,000 to $7,499 | 68 (3.2%) | 52 (3.3%) |
| $7,500 to $9,999 | 15 (0.7%) | 15 (0.9%) |
| $10,000 to $12,499 | 34 (1.6%) | 31 (2.0%) |
| $12,500 to $14,999 | 33 (1.6%) | 46 (2.9%) |
| $15,000 to $17,499 | 19 (0.9%) | 56 (3.5%) |
| $17,500 to $19,999 | 12 (0.6%) | 0 (0.0%) |
| $20,000 to $22,499 | 31 (1.5%) | 17 (1.1%) |
| $22,500 to $24,999 | 26 (1.2%) | 97 (6.1%) |
| $25,000 to $29,999 | 46 (2.2%) | 113 (7.2%) |
| $30,000 to $34,999 | 60 (2.8%) | 79 (5.0%) |
| $35,000 to $39,999 | 38 (1.8%) | 31 (2.0%) |
| $40,000 to $44,999 | 80 (3.8%) | 96 (6.1%) |
| $45,000 to $49,999 | 25 (1.2%) | 73 (4.6%) |
| $50,000 to $54,999 | 33 (1.6%) | 43 (2.7%) |
| $55,000 to $64,999 | 248 (11.7%) | 138 (8.7%) |
| $65,000 to $74,999 | 128 (6.0%) | 174 (11.0%) |
| $75,000 to $99,999 | 422 (19.9%) | 133 (8.4%) |
| $100,000+ | 702 (33.1%) | 316 (20.0%) |
| Total | 2,120 (100.0%) | 1,577 (100.0%) |
Earnings by Sex by Educational Attainment in Lake Shore
Average earnings in Lake Shore are $85,114 for men and $60,169 for women, a difference of 29.3%. Men with an educational attainment of college or associate's degree enjoy the highest average annual earnings of $108,934, while those with high school diploma education earn the least with $63,944. Women with an educational attainment of graduate degree earn the most with the average annual earnings of $100,850, while those with high school diploma education have the smallest earnings of $30,543.
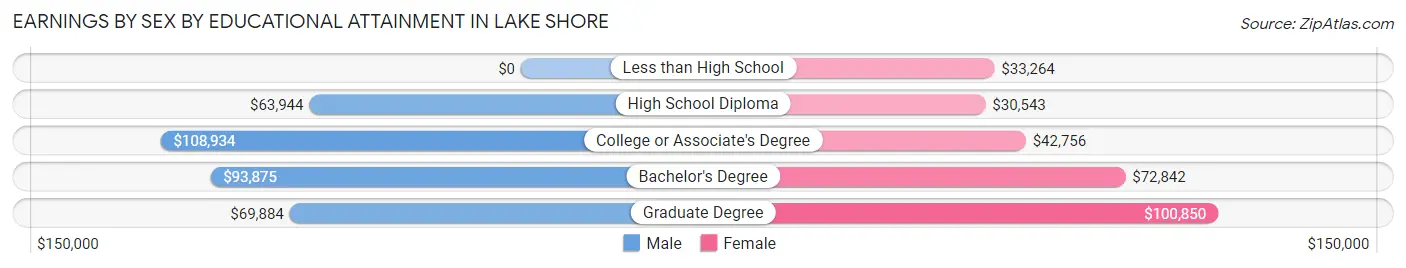
| Educational Attainment | Male Income | Female Income |
| Less than High School | - | - |
| High School Diploma | $63,944 | $30,543 |
| College or Associate's Degree | $108,934 | $42,756 |
| Bachelor's Degree | $93,875 | $72,842 |
| Graduate Degree | $69,884 | $100,850 |
| Total | $85,114 | $60,169 |
Family Income in Lake Shore
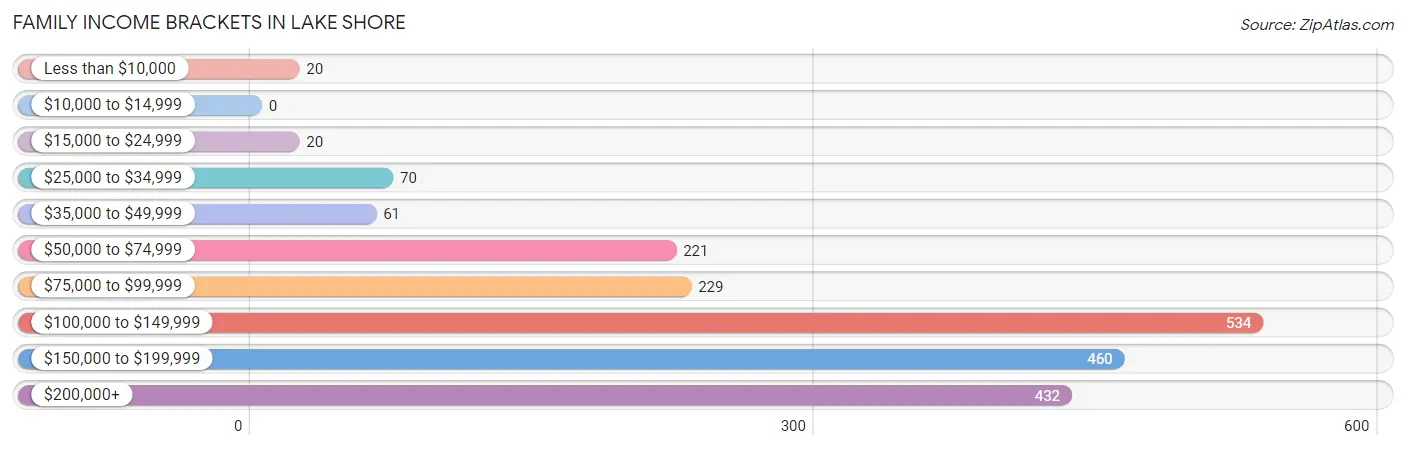
Family Income Brackets in Lake Shore
According to the Lake Shore family income data, there are 534 families falling into the $100,000 to $149,999 income range, which is the most common income bracket and makes up 26.1% of all families.
| Income Bracket | # Families | % Families |
| Less than $10,000 | 20 | 1.0% |
| $10,000 to $14,999 | 0 | 0.0% |
| $15,000 to $24,999 | 20 | 1.0% |
| $25,000 to $34,999 | 70 | 3.4% |
| $35,000 to $49,999 | 61 | 3.0% |
| $50,000 to $74,999 | 221 | 10.8% |
| $75,000 to $99,999 | 229 | 11.2% |
| $100,000 to $149,999 | 534 | 26.1% |
| $150,000 to $199,999 | 460 | 22.5% |
| $200,000+ | 432 | 21.1% |
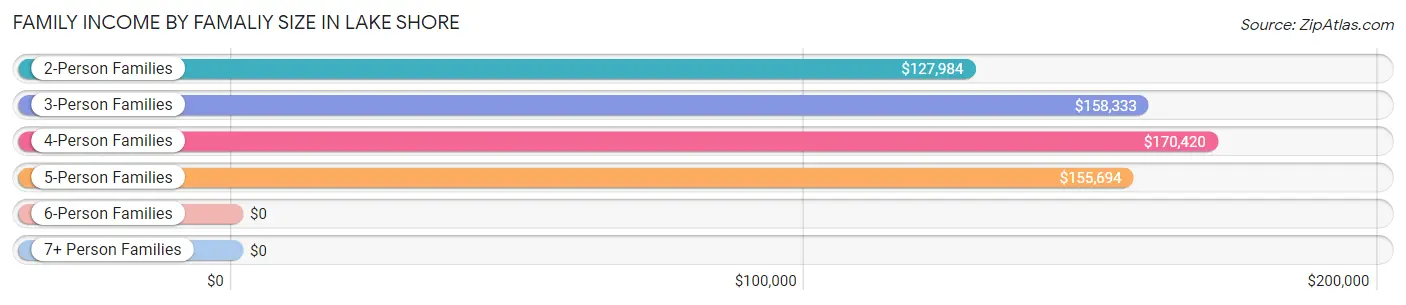
Family Income by Famaliy Size in Lake Shore
4-person families (403 | 19.7%) account for the highest median family income in Lake Shore with $170,420 per family, while 2-person families (1,116 | 54.5%) have the highest median income of $63,992 per family member.
| Income Bracket | # Families | Median Income |
| 2-Person Families | 1,116 (54.5%) | $127,984 |
| 3-Person Families | 408 (19.9%) | $158,333 |
| 4-Person Families | 403 (19.7%) | $170,420 |
| 5-Person Families | 87 (4.3%) | $155,694 |
| 6-Person Families | 10 (0.5%) | $0 |
| 7+ Person Families | 22 (1.1%) | $0 |
| Total | 2,046 (100.0%) | $142,411 |
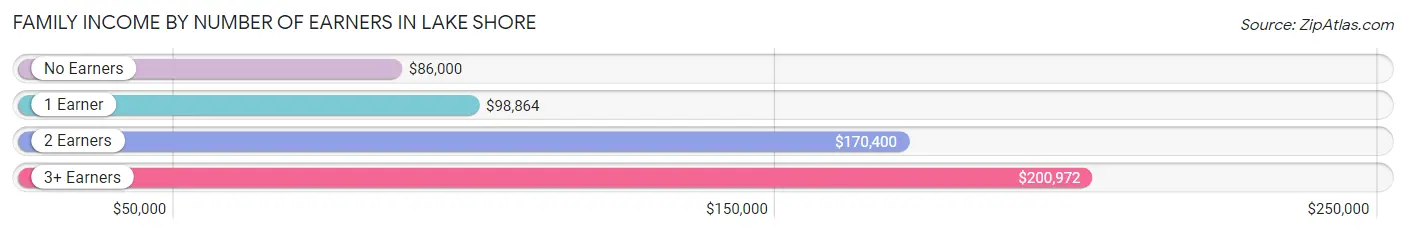
Family Income by Number of Earners in Lake Shore
The median family income in Lake Shore is $142,411, with families comprising 3+ earners (247) having the highest median family income of $200,972, while families with no earners (350) have the lowest median family income of $86,000, accounting for 12.1% and 17.1% of families, respectively.
| Number of Earners | # Families | Median Income |
| No Earners | 350 (17.1%) | $86,000 |
| 1 Earner | 558 (27.3%) | $98,864 |
| 2 Earners | 891 (43.5%) | $170,400 |
| 3+ Earners | 247 (12.1%) | $200,972 |
| Total | 2,046 (100.0%) | $142,411 |
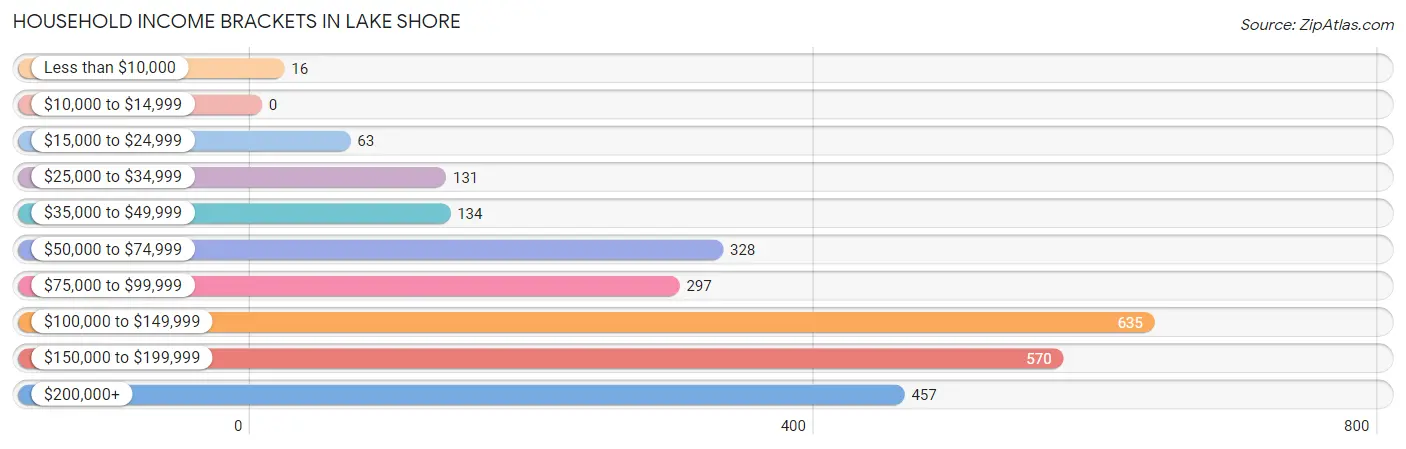
Household Income in Lake Shore
Household Income Brackets in Lake Shore
With 635 households falling in the category, the $100,000 to $149,999 income range is the most frequent in Lake Shore, accounting for 24.2% of all households.
| Income Bracket | # Households | % Households |
| Less than $10,000 | 16 | 0.6% |
| $10,000 to $14,999 | 0 | 0.0% |
| $15,000 to $24,999 | 63 | 2.4% |
| $25,000 to $34,999 | 131 | 5.0% |
| $35,000 to $49,999 | 134 | 5.1% |
| $50,000 to $74,999 | 328 | 12.5% |
| $75,000 to $99,999 | 297 | 11.3% |
| $100,000 to $149,999 | 635 | 24.2% |
| $150,000 to $199,999 | 570 | 21.7% |
| $200,000+ | 457 | 17.4% |
Household Income by Householder Age in Lake Shore
The median household income in Lake Shore is $130,985, with the highest median household income of $152,390 found in the 45 to 64 years age bracket for the primary householder. A total of 1,077 households (41.0%) fall into this category. Meanwhile, the 15 to 24 years age bracket for the primary householder has the lowest median household income of $0, with 29 households (1.1%) in this group.
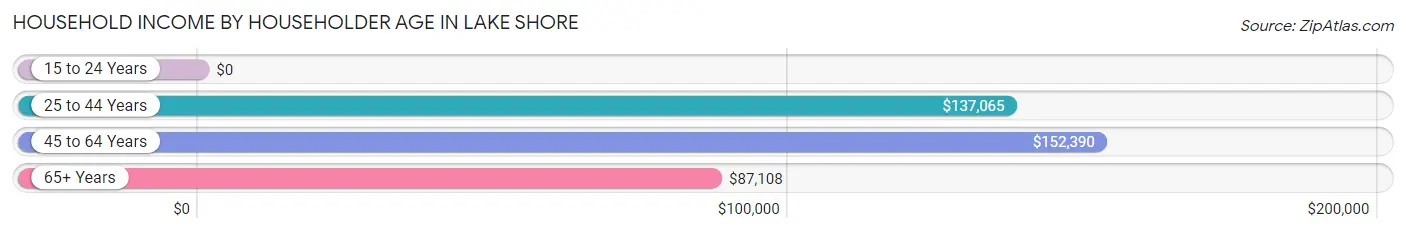
| Income Bracket | # Households | Median Income |
| 15 to 24 Years | 29 (1.1%) | $0 |
| 25 to 44 Years | 626 (23.8%) | $137,065 |
| 45 to 64 Years | 1,077 (41.0%) | $152,390 |
| 65+ Years | 894 (34.0%) | $87,108 |
| Total | 2,626 (100.0%) | $130,985 |
Poverty in Lake Shore
Income Below Poverty by Sex and Age in Lake Shore
With 2.0% poverty level for males and 1.2% for females among the residents of Lake Shore, under 5 year old males and 18 to 24 year old females are the most vulnerable to poverty, with 18 males (22.2%) and 15 females (11.5%) in their respective age groups living below the poverty level.
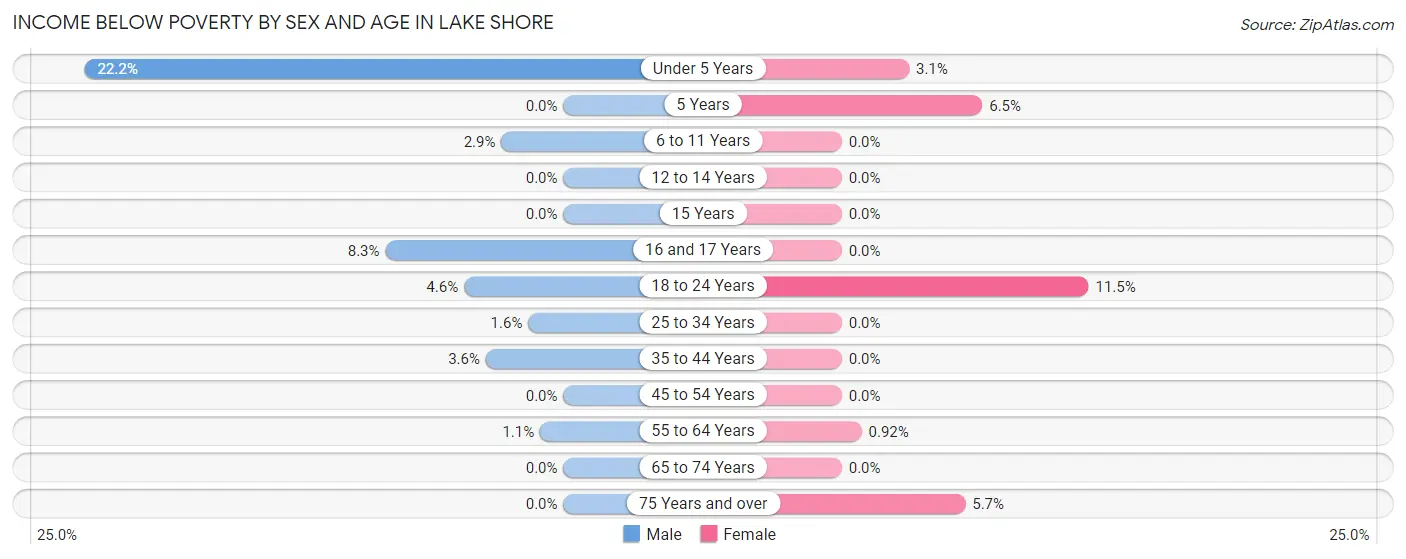
| Age Bracket | Male | Female |
| Under 5 Years | 18 (22.2%) | 4 (3.1%) |
| 5 Years | 0 (0.0%) | 3 (6.5%) |
| 6 to 11 Years | 3 (2.9%) | 0 (0.0%) |
| 12 to 14 Years | 0 (0.0%) | 0 (0.0%) |
| 15 Years | 0 (0.0%) | 0 (0.0%) |
| 16 and 17 Years | 10 (8.3%) | 0 (0.0%) |
| 18 to 24 Years | 10 (4.6%) | 15 (11.5%) |
| 25 to 34 Years | 4 (1.6%) | 0 (0.0%) |
| 35 to 44 Years | 18 (3.6%) | 0 (0.0%) |
| 45 to 54 Years | 0 (0.0%) | 0 (0.0%) |
| 55 to 64 Years | 5 (1.1%) | 5 (0.9%) |
| 65 to 74 Years | 0 (0.0%) | 0 (0.0%) |
| 75 Years and over | 0 (0.0%) | 13 (5.7%) |
| Total | 68 (2.0%) | 40 (1.2%) |
Income Above Poverty by Sex and Age in Lake Shore
According to the poverty statistics in Lake Shore, males aged 5 years and females aged 6 to 11 years are the age groups that are most secure financially, with 100.0% of males and 100.0% of females in these age groups living above the poverty line.
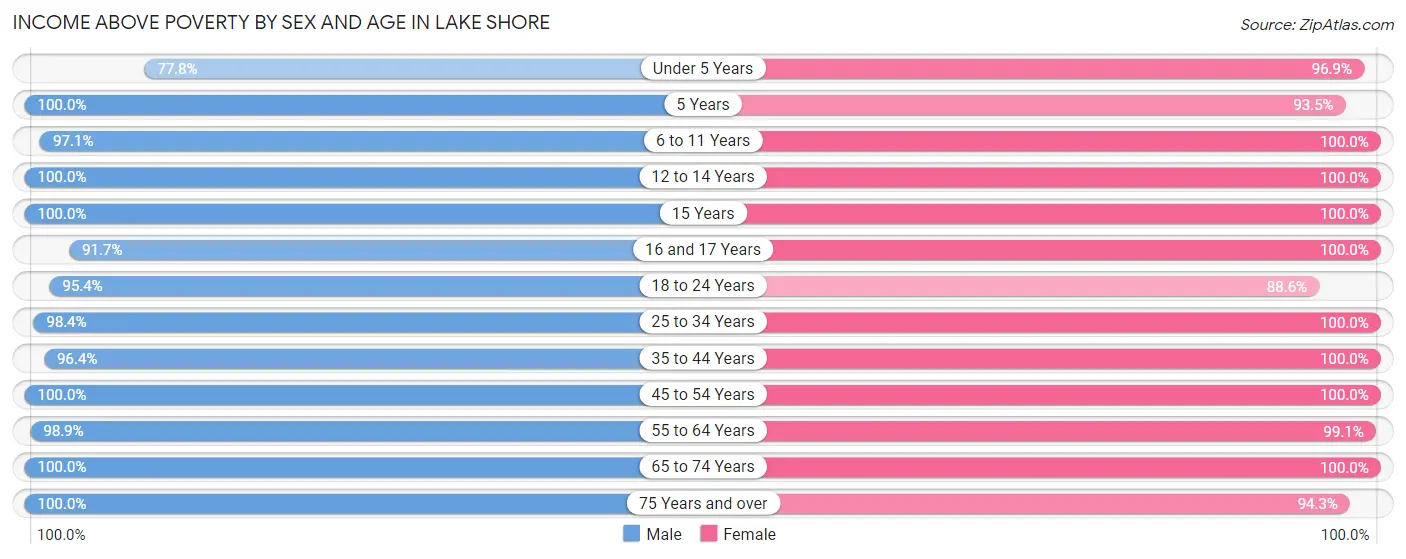
| Age Bracket | Male | Female |
| Under 5 Years | 63 (77.8%) | 124 (96.9%) |
| 5 Years | 8 (100.0%) | 43 (93.5%) |
| 6 to 11 Years | 101 (97.1%) | 229 (100.0%) |
| 12 to 14 Years | 88 (100.0%) | 149 (100.0%) |
| 15 Years | 217 (100.0%) | 36 (100.0%) |
| 16 and 17 Years | 111 (91.7%) | 93 (100.0%) |
| 18 to 24 Years | 207 (95.4%) | 116 (88.5%) |
| 25 to 34 Years | 241 (98.4%) | 288 (100.0%) |
| 35 to 44 Years | 482 (96.4%) | 332 (100.0%) |
| 45 to 54 Years | 628 (100.0%) | 594 (100.0%) |
| 55 to 64 Years | 456 (98.9%) | 541 (99.1%) |
| 65 to 74 Years | 421 (100.0%) | 437 (100.0%) |
| 75 Years and over | 260 (100.0%) | 214 (94.3%) |
| Total | 3,283 (98.0%) | 3,196 (98.8%) |
Income Below Poverty Among Married-Couple Families in Lake Shore
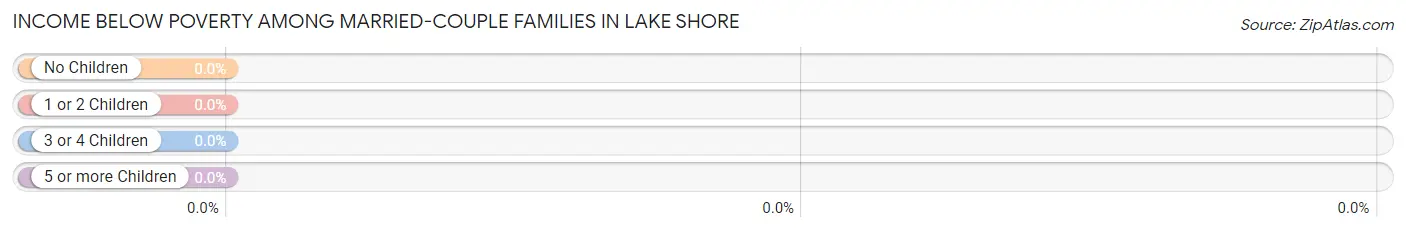
| Children | Above Poverty | Below Poverty |
| No Children | 1,026 (100.0%) | 0 (0.0%) |
| 1 or 2 Children | 600 (100.0%) | 0 (0.0%) |
| 3 or 4 Children | 72 (100.0%) | 0 (0.0%) |
| 5 or more Children | 14 (100.0%) | 0 (0.0%) |
| Total | 1,712 (100.0%) | 0 (0.0%) |
Income Below Poverty Among Single-Parent Households in Lake Shore
According to the poverty data in Lake Shore, 9.5% or 18 single-father households and 2.1% or 3 single-mother households are living below the poverty line. Among single-father households, those with 1 or 2 children have the highest poverty rate, with 18 households (36.0%) experiencing poverty. Likewise, among single-mother households, those with 3 or 4 children have the highest poverty rate, with 3 households (100.0%) falling below the poverty line.
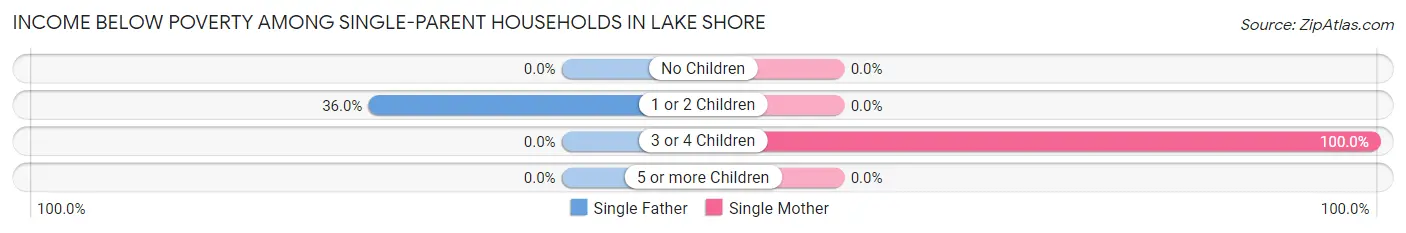
| Children | Single Father | Single Mother |
| No Children | 0 (0.0%) | 0 (0.0%) |
| 1 or 2 Children | 18 (36.0%) | 0 (0.0%) |
| 3 or 4 Children | 0 (0.0%) | 3 (100.0%) |
| 5 or more Children | 0 (0.0%) | 0 (0.0%) |
| Total | 18 (9.5%) | 3 (2.1%) |
Income Below Poverty Among Married-Couple vs Single-Parent Households in Lake Shore
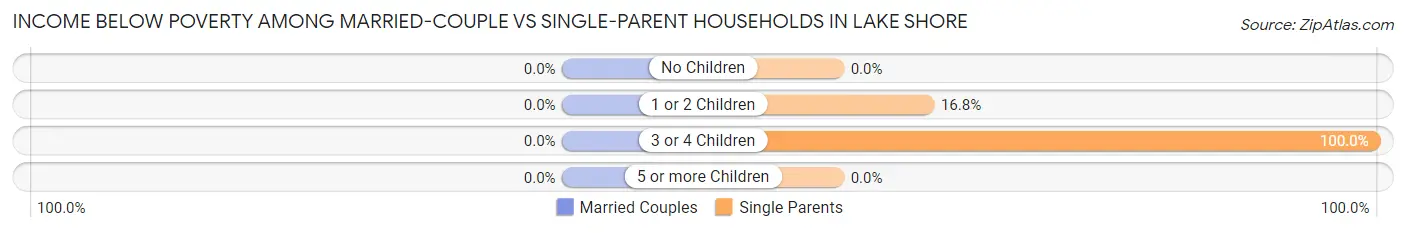
| Children | Married-Couple Families | Single-Parent Households |
| No Children | 0 (0.0%) | 0 (0.0%) |
| 1 or 2 Children | 0 (0.0%) | 18 (16.8%) |
| 3 or 4 Children | 0 (0.0%) | 3 (100.0%) |
| 5 or more Children | 0 (0.0%) | 0 (0.0%) |
| Total | 0 (0.0%) | 21 (6.3%) |
Race in Lake Shore
The most populous races in Lake Shore are White / Caucasian (5,879 | 89.2%), Hispanic or Latino (393 | 6.0%), and Two or more Races (263 | 4.0%).
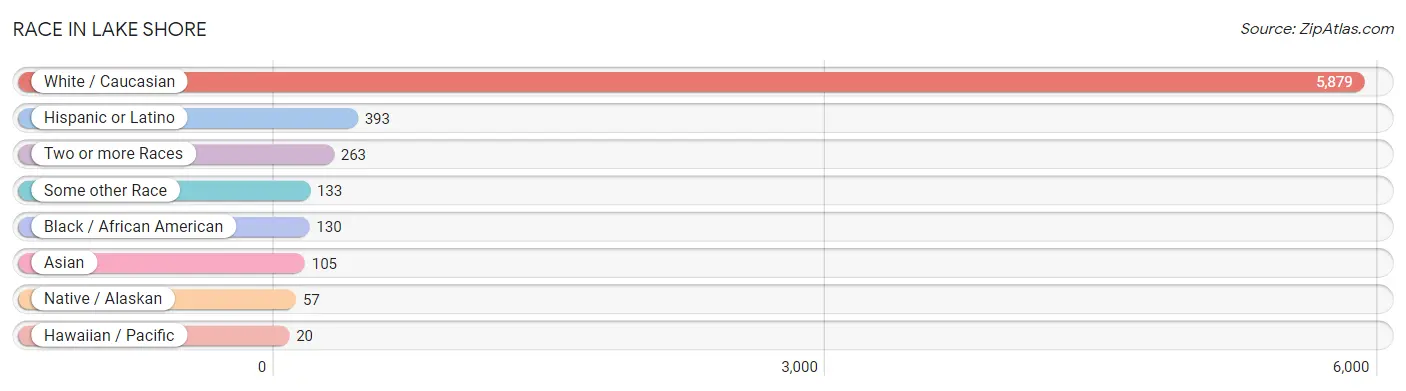
| Race | # Population | % Population |
| Asian | 105 | 1.6% |
| Black / African American | 130 | 2.0% |
| Hawaiian / Pacific | 20 | 0.3% |
| Hispanic or Latino | 393 | 6.0% |
| Native / Alaskan | 57 | 0.9% |
| White / Caucasian | 5,879 | 89.2% |
| Two or more Races | 263 | 4.0% |
| Some other Race | 133 | 2.0% |
| Total | 6,587 | 100.0% |
Ancestry in Lake Shore
The most populous ancestries reported in Lake Shore are German (1,706 | 25.9%), English (1,390 | 21.1%), Irish (916 | 13.9%), Norwegian (448 | 6.8%), and European (338 | 5.1%), together accounting for 72.8% of all Lake Shore residents.
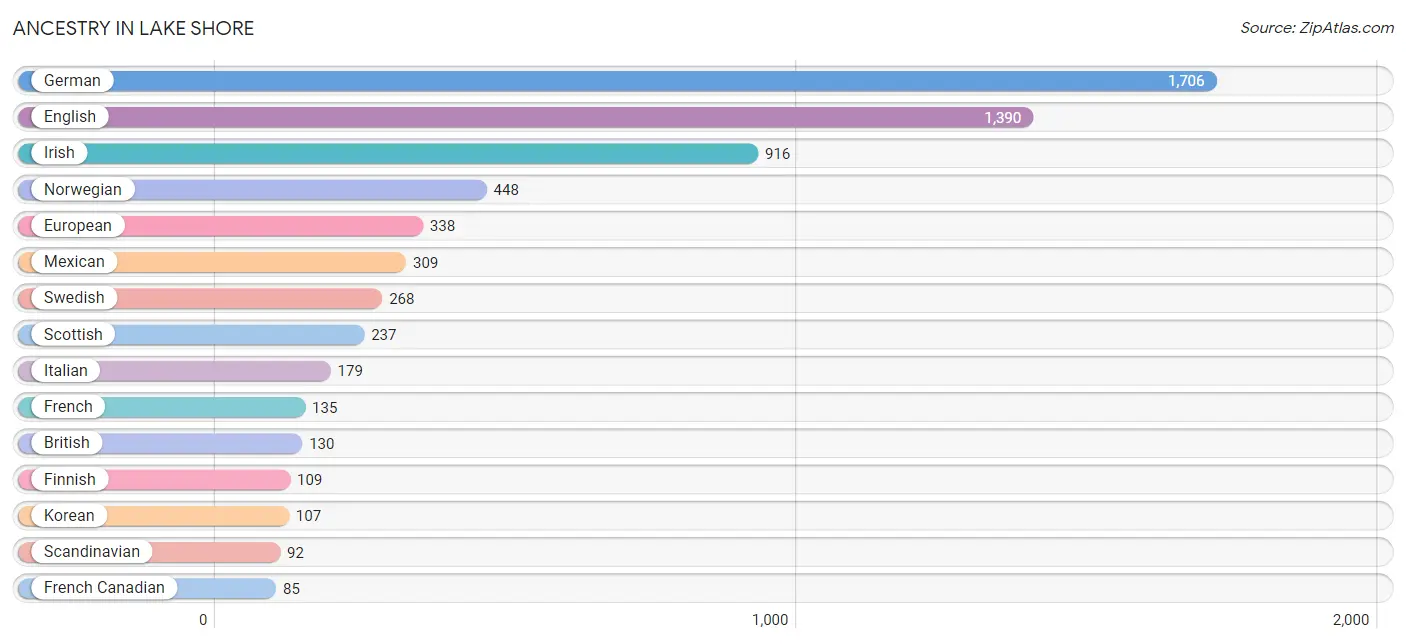
| Ancestry | # Population | % Population |
| African | 12 | 0.2% |
| American | 60 | 0.9% |
| Arab | 26 | 0.4% |
| Austrian | 11 | 0.2% |
| Bhutanese | 54 | 0.8% |
| British | 130 | 2.0% |
| Burmese | 19 | 0.3% |
| Colombian | 16 | 0.2% |
| Danish | 63 | 1.0% |
| Dutch | 20 | 0.3% |
| Eastern European | 10 | 0.2% |
| English | 1,390 | 21.1% |
| European | 338 | 5.1% |
| Finnish | 109 | 1.7% |
| French | 135 | 2.1% |
| French Canadian | 85 | 1.3% |
| German | 1,706 | 25.9% |
| Greek | 15 | 0.2% |
| Iranian | 59 | 0.9% |
| Irish | 916 | 13.9% |
| Italian | 179 | 2.7% |
| Korean | 107 | 1.6% |
| Lithuanian | 49 | 0.7% |
| Macedonian | 9 | 0.1% |
| Mexican | 309 | 4.7% |
| Mexican American Indian | 51 | 0.8% |
| Moroccan | 26 | 0.4% |
| Native Hawaiian | 77 | 1.2% |
| Northern European | 42 | 0.6% |
| Norwegian | 448 | 6.8% |
| Polish | 65 | 1.0% |
| Portuguese | 33 | 0.5% |
| Romanian | 83 | 1.3% |
| Russian | 83 | 1.3% |
| Scandinavian | 92 | 1.4% |
| Scotch-Irish | 85 | 1.3% |
| Scottish | 237 | 3.6% |
| South American | 16 | 0.2% |
| Spanish | 68 | 1.0% |
| Sri Lankan | 30 | 0.5% |
| Subsaharan African | 12 | 0.2% |
| Swedish | 268 | 4.1% |
| Swiss | 51 | 0.8% |
| Ukrainian | 14 | 0.2% |
| Welsh | 76 | 1.1% | View All 45 Rows |
Immigrants in Lake Shore
The most numerous immigrant groups reported in Lake Shore came from Europe (158 | 2.4%), Northern Europe (121 | 1.8%), Asia (95 | 1.4%), South Eastern Asia (52 | 0.8%), and England (47 | 0.7%), together accounting for 7.2% of all Lake Shore residents.
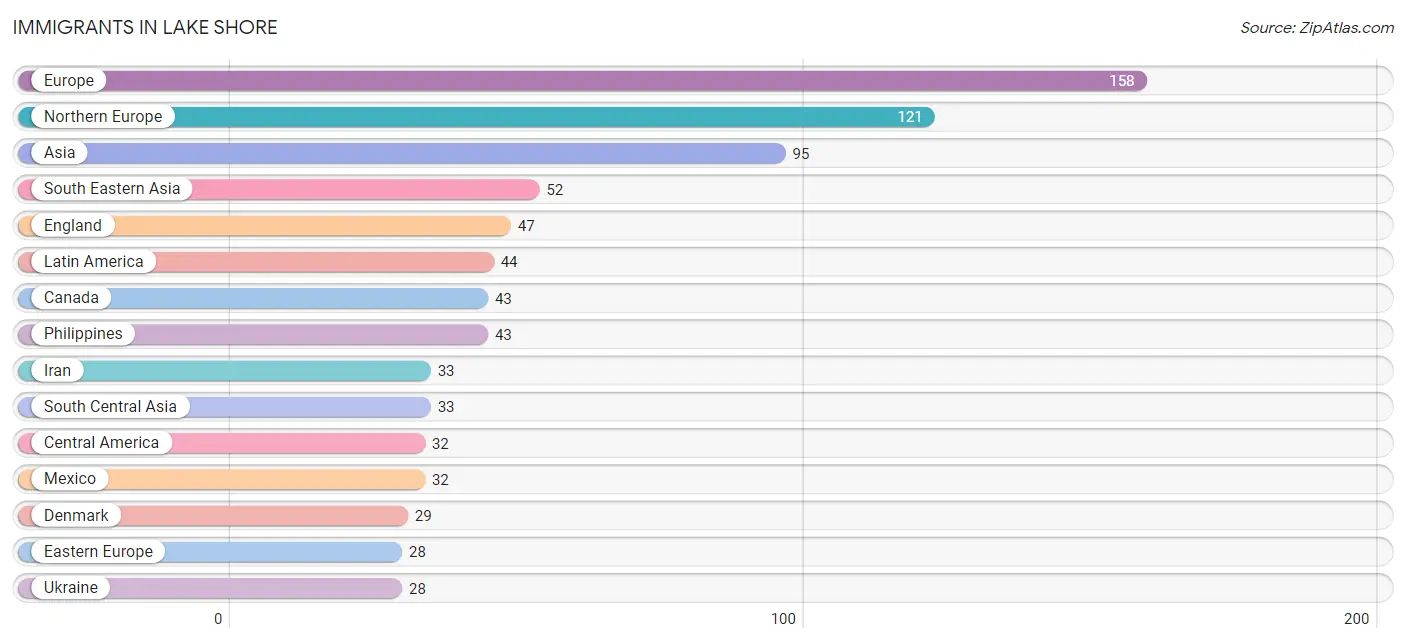
| Immigration Origin | # Population | % Population |
| Africa | 25 | 0.4% |
| Asia | 95 | 1.4% |
| Brazil | 12 | 0.2% |
| Canada | 43 | 0.6% |
| Central America | 32 | 0.5% |
| Denmark | 29 | 0.4% |
| Eastern Asia | 10 | 0.2% |
| Eastern Europe | 28 | 0.4% |
| England | 47 | 0.7% |
| Europe | 158 | 2.4% |
| Greece | 9 | 0.1% |
| Iran | 33 | 0.5% |
| Japan | 10 | 0.2% |
| Latin America | 44 | 0.7% |
| Mexico | 32 | 0.5% |
| Northern Europe | 121 | 1.8% |
| Philippines | 43 | 0.6% |
| South Africa | 25 | 0.4% |
| South America | 12 | 0.2% |
| South Central Asia | 33 | 0.5% |
| South Eastern Asia | 52 | 0.8% |
| Southern Europe | 9 | 0.1% |
| Ukraine | 28 | 0.4% |
| Vietnam | 9 | 0.1% | View All 24 Rows |
Sex and Age in Lake Shore
Sex and Age in Lake Shore
The most populous age groups in Lake Shore are 15 to 19 Years (390 | 11.6%) for men and 45 to 49 Years (365 | 11.3%) for women.
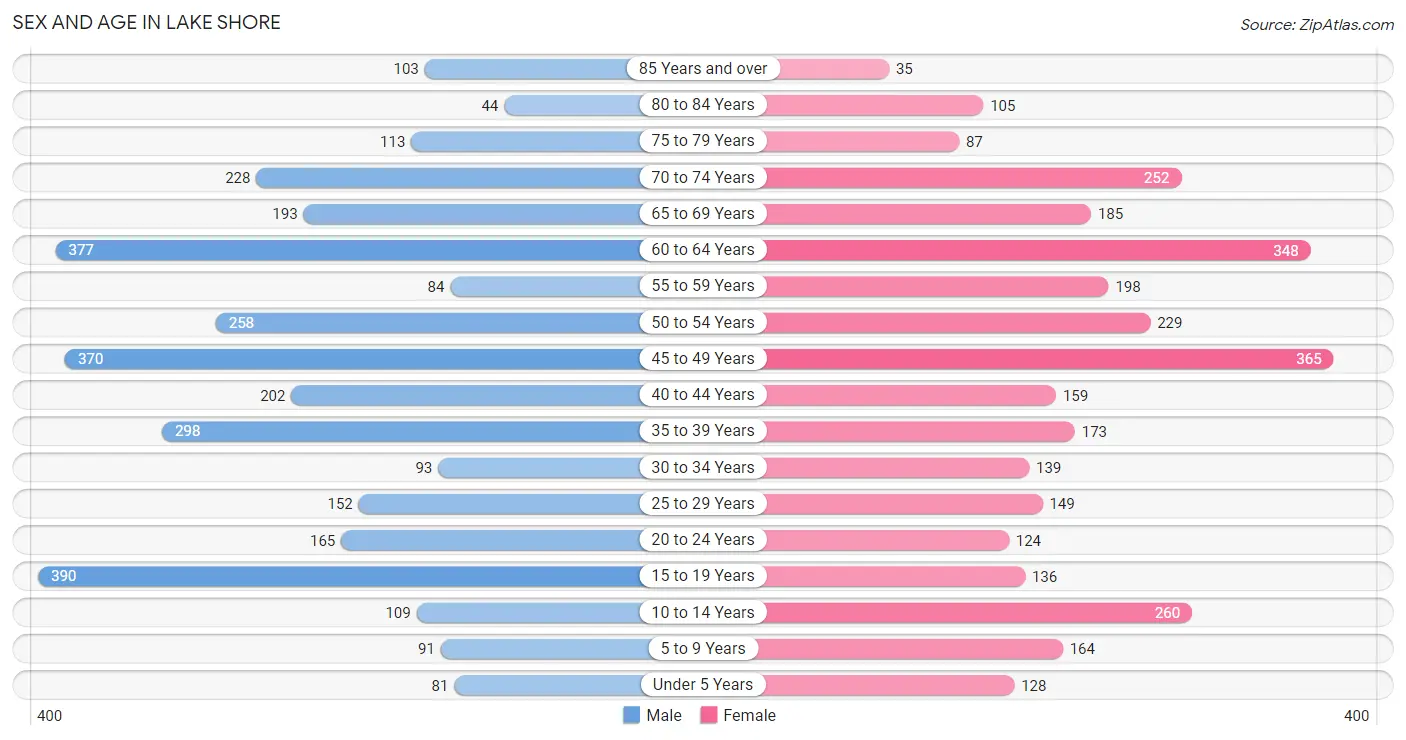
| Age Bracket | Male | Female |
| Under 5 Years | 81 (2.4%) | 128 (4.0%) |
| 5 to 9 Years | 91 (2.7%) | 164 (5.1%) |
| 10 to 14 Years | 109 (3.3%) | 260 (8.0%) |
| 15 to 19 Years | 390 (11.6%) | 136 (4.2%) |
| 20 to 24 Years | 165 (4.9%) | 124 (3.8%) |
| 25 to 29 Years | 152 (4.5%) | 149 (4.6%) |
| 30 to 34 Years | 93 (2.8%) | 139 (4.3%) |
| 35 to 39 Years | 298 (8.9%) | 173 (5.3%) |
| 40 to 44 Years | 202 (6.0%) | 159 (4.9%) |
| 45 to 49 Years | 370 (11.0%) | 365 (11.3%) |
| 50 to 54 Years | 258 (7.7%) | 229 (7.1%) |
| 55 to 59 Years | 84 (2.5%) | 198 (6.1%) |
| 60 to 64 Years | 377 (11.3%) | 348 (10.7%) |
| 65 to 69 Years | 193 (5.8%) | 185 (5.7%) |
| 70 to 74 Years | 228 (6.8%) | 252 (7.8%) |
| 75 to 79 Years | 113 (3.4%) | 87 (2.7%) |
| 80 to 84 Years | 44 (1.3%) | 105 (3.2%) |
| 85 Years and over | 103 (3.1%) | 35 (1.1%) |
| Total | 3,351 (100.0%) | 3,236 (100.0%) |
Families and Households in Lake Shore
Median Family Size in Lake Shore
The median family size in Lake Shore is 2.80 persons per family, with married-couple families (1,712 | 83.7%) accounting for the largest median family size of 2.88 persons per family. On the other hand, single male/father families (189 | 9.2%) represent the smallest median family size with 2.24 persons per family.
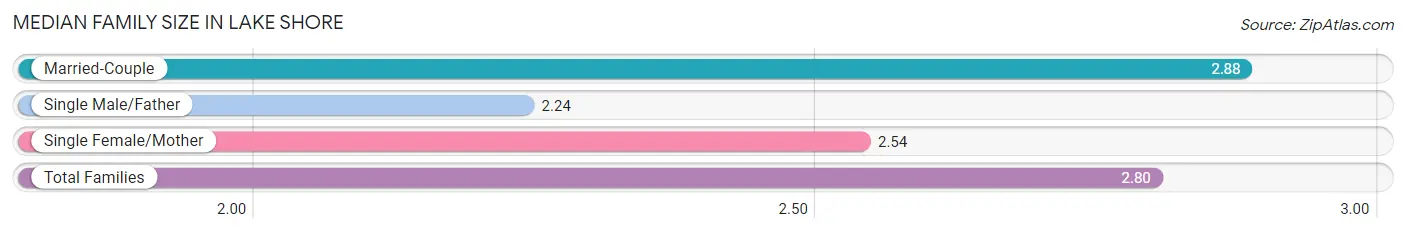
| Family Type | # Families | Family Size |
| Married-Couple | 1,712 (83.7%) | 2.88 |
| Single Male/Father | 189 (9.2%) | 2.24 |
| Single Female/Mother | 145 (7.1%) | 2.54 |
| Total Families | 2,046 (100.0%) | 2.80 |
Median Household Size in Lake Shore
The median household size in Lake Shore is 2.50 persons per household, with married-couple households (1,712 | 65.2%) accounting for the largest median household size of 2.9 persons per household. non-family households (580 | 22.1%) represent the smallest median household size with 1.27 persons per household.
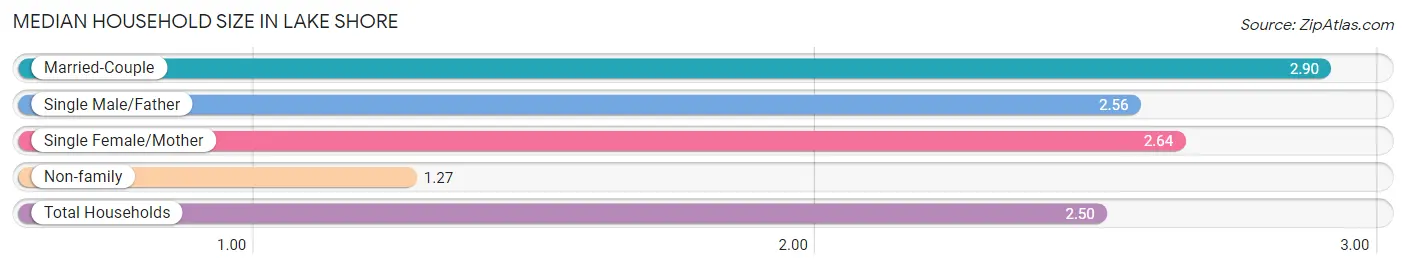
| Household Type | # Households | Household Size |
| Married-Couple | 1,712 (65.2%) | 2.90 |
| Single Male/Father | 189 (7.2%) | 2.56 |
| Single Female/Mother | 145 (5.5%) | 2.64 |
| Non-family | 580 (22.1%) | 1.27 |
| Total Households | 2,626 (100.0%) | 2.50 |
Household Size by Marriage Status in Lake Shore
Out of a total of 2,626 households in Lake Shore, 2,046 (77.9%) are family households, while 580 (22.1%) are nonfamily households. The most numerous type of family households are 2-person households, comprising 1,060, and the most common type of nonfamily households are 1-person households, comprising 464.
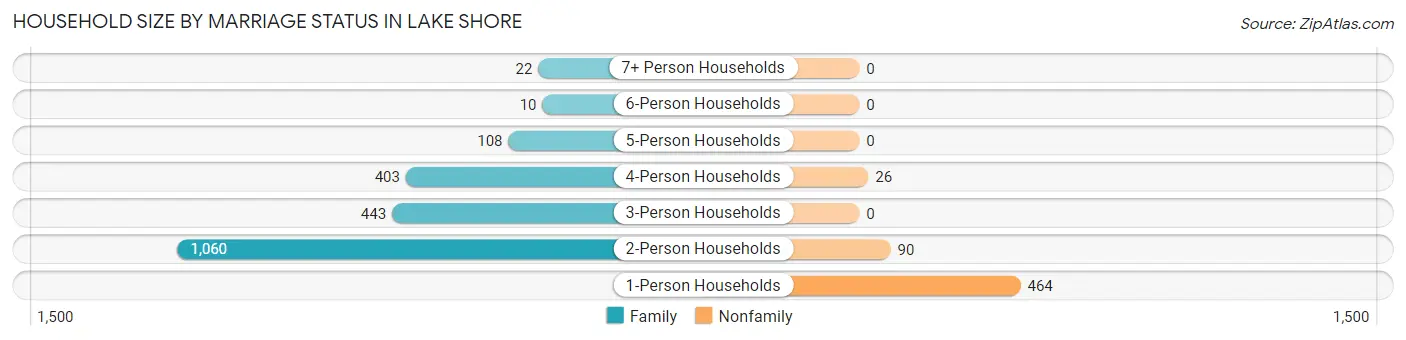
| Household Size | Family Households | Nonfamily Households |
| 1-Person Households | - | 464 (17.7%) |
| 2-Person Households | 1,060 (40.4%) | 90 (3.4%) |
| 3-Person Households | 443 (16.9%) | 0 (0.0%) |
| 4-Person Households | 403 (15.3%) | 26 (1.0%) |
| 5-Person Households | 108 (4.1%) | 0 (0.0%) |
| 6-Person Households | 10 (0.4%) | 0 (0.0%) |
| 7+ Person Households | 22 (0.8%) | 0 (0.0%) |
| Total | 2,046 (77.9%) | 580 (22.1%) |
Female Fertility in Lake Shore
Fertility by Age in Lake Shore
Average fertility rate in Lake Shore is 66.0 births per 1,000 women. Women in the age bracket of 20 to 34 years have the highest fertility rate with 175.0 births per 1,000 women. Women in the age bracket of 20 to 34 years acount for 81.8% of all women with births.
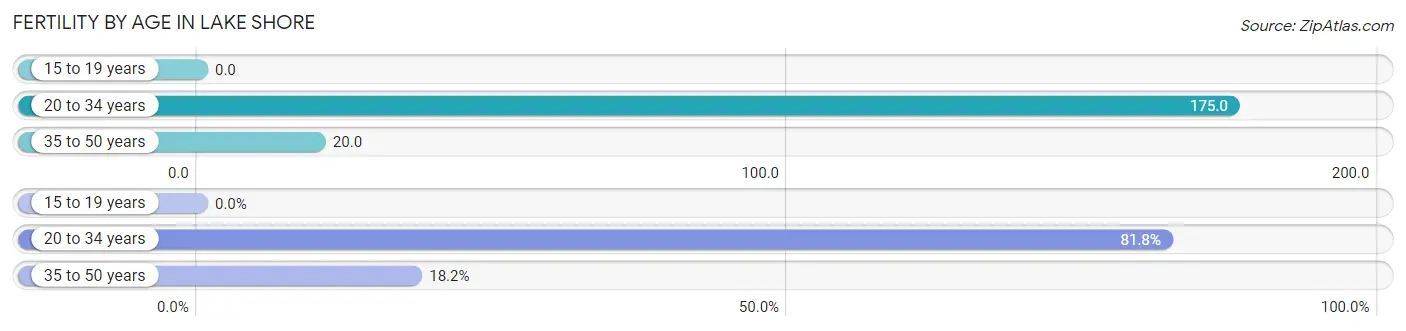
| Age Bracket | Women with Births | Births / 1,000 Women |
| 15 to 19 years | 0 (0.0%) | 0.0 |
| 20 to 34 years | 72 (81.8%) | 175.0 |
| 35 to 50 years | 16 (18.2%) | 20.0 |
| Total | 88 (100.0%) | 66.0 |
Fertility by Age by Marriage Status in Lake Shore
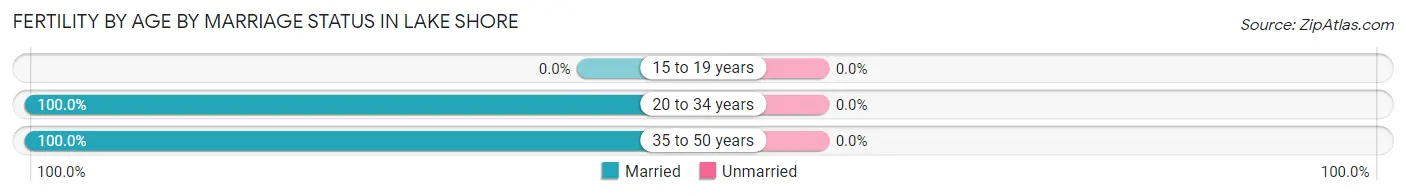
| Age Bracket | Married | Unmarried |
| 15 to 19 years | 0 (0.0%) | 0 (0.0%) |
| 20 to 34 years | 72 (100.0%) | 0 (0.0%) |
| 35 to 50 years | 16 (100.0%) | 0 (0.0%) |
| Total | 88 (100.0%) | 0 (0.0%) |
Fertility by Education in Lake Shore
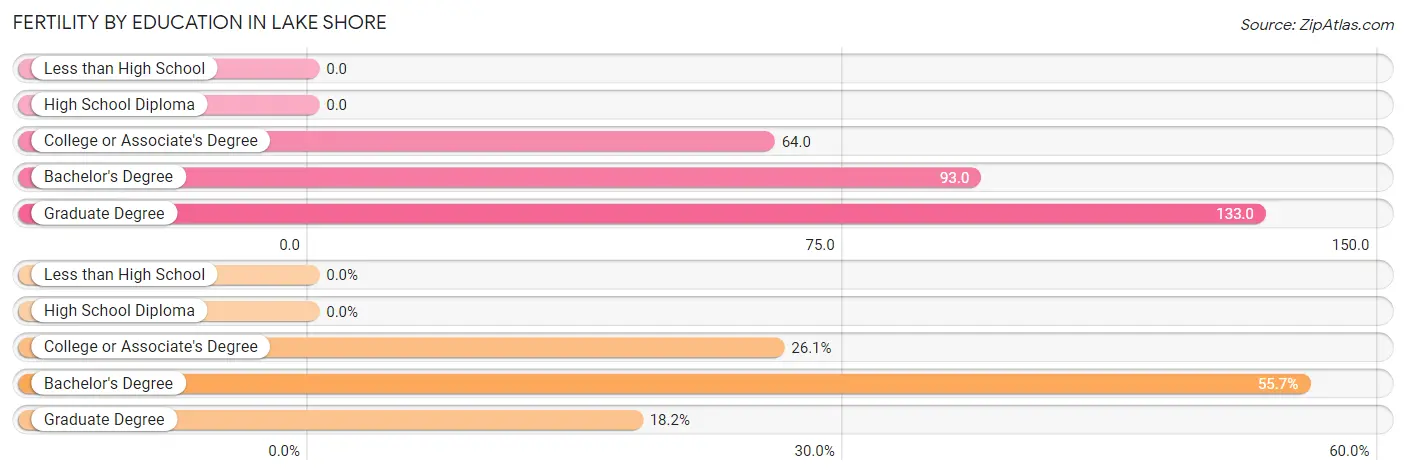
| Educational Attainment | Women with Births | Births / 1,000 Women |
| Less than High School | 0 (0.0%) | 0.0 |
| High School Diploma | 0 (0.0%) | 0.0 |
| College or Associate's Degree | 23 (26.1%) | 64.0 |
| Bachelor's Degree | 49 (55.7%) | 93.0 |
| Graduate Degree | 16 (18.2%) | 133.0 |
| Total | 88 (100.0%) | 66.0 |
Fertility by Education by Marriage Status in Lake Shore
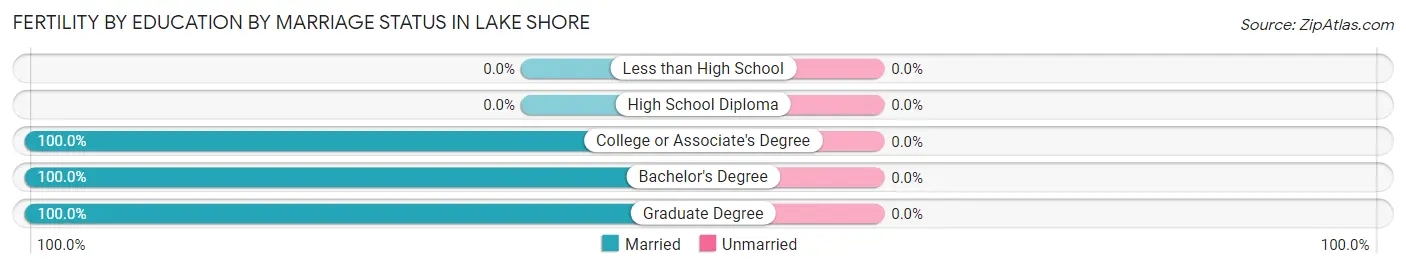
| Educational Attainment | Married | Unmarried |
| Less than High School | 0 (0.0%) | 0 (0.0%) |
| High School Diploma | 0 (0.0%) | 0 (0.0%) |
| College or Associate's Degree | 23 (100.0%) | 0 (0.0%) |
| Bachelor's Degree | 49 (100.0%) | 0 (0.0%) |
| Graduate Degree | 16 (100.0%) | 0 (0.0%) |
| Total | 88 (100.0%) | 0 (0.0%) |
Employment Characteristics in Lake Shore
Employment by Class of Employer in Lake Shore
Among the 3,498 employed individuals in Lake Shore, private company employees (2,244 | 64.1%), local government employees (316 | 9.0%), and not-for-profit organizations (247 | 7.1%) make up the most common classes of employment.
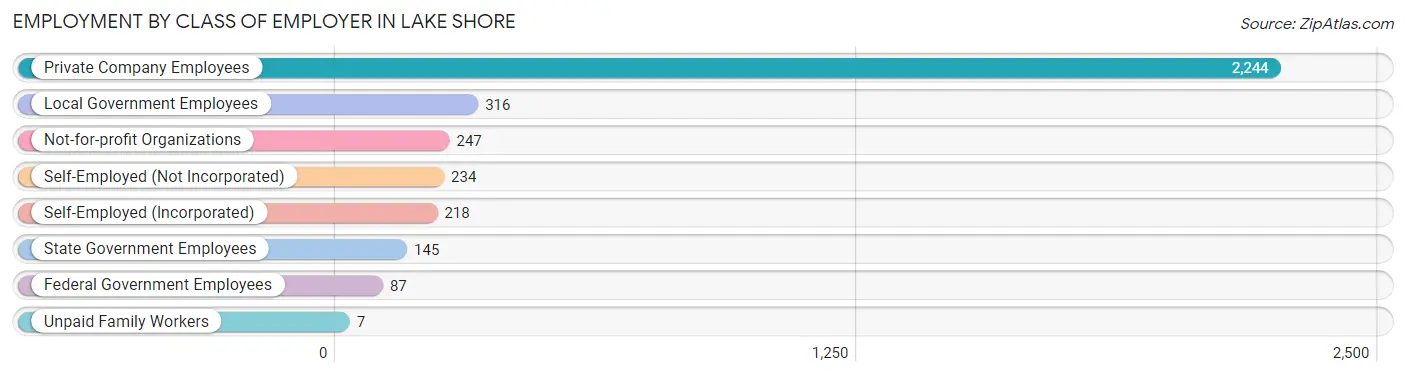
| Employer Class | # Employees | % Employees |
| Private Company Employees | 2,244 | 64.1% |
| Self-Employed (Incorporated) | 218 | 6.2% |
| Self-Employed (Not Incorporated) | 234 | 6.7% |
| Not-for-profit Organizations | 247 | 7.1% |
| Local Government Employees | 316 | 9.0% |
| State Government Employees | 145 | 4.2% |
| Federal Government Employees | 87 | 2.5% |
| Unpaid Family Workers | 7 | 0.2% |
| Total | 3,498 | 100.0% |
Employment Status by Age in Lake Shore
According to the labor force statistics for Lake Shore, out of the total population over 16 years of age (5,501), 66.9% or 3,680 individuals are in the labor force, with 3.8% or 140 of them unemployed. The age group with the highest labor force participation rate is 25 to 29 years, with 100.0% or 301 individuals in the labor force. Within the labor force, the 30 to 34 years age range has the highest percentage of unemployed individuals, with 15.6% or 34 of them being unemployed.
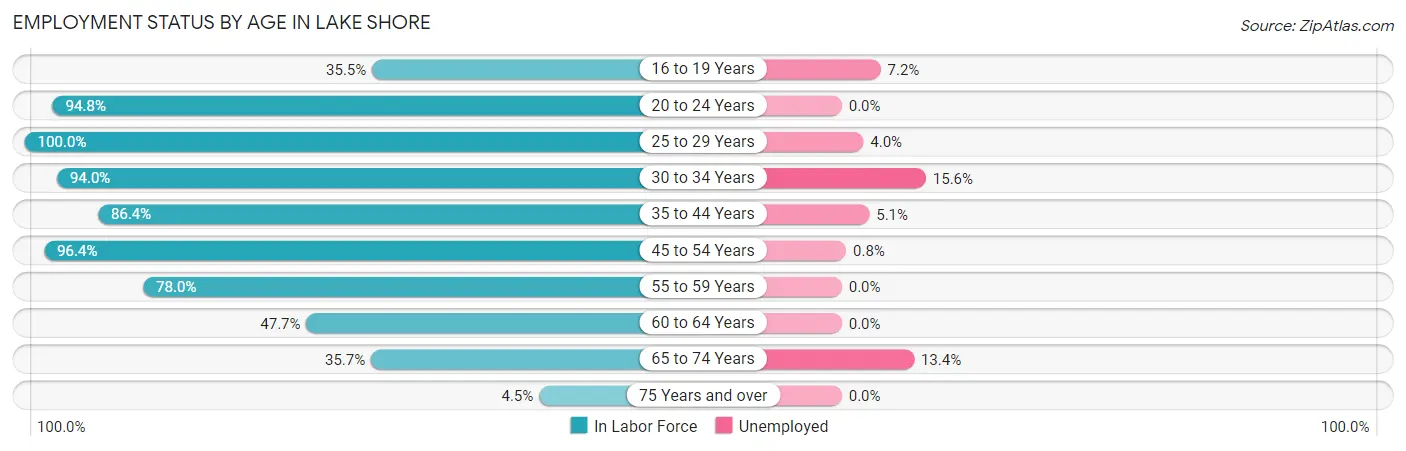
| Age Bracket | In Labor Force | Unemployed |
| 16 to 19 Years | 97 (35.5%) | 7 (7.2%) |
| 20 to 24 Years | 274 (94.8%) | 0 (0.0%) |
| 25 to 29 Years | 301 (100.0%) | 12 (4.0%) |
| 30 to 34 Years | 218 (94.0%) | 34 (15.6%) |
| 35 to 44 Years | 719 (86.4%) | 37 (5.1%) |
| 45 to 54 Years | 1,178 (96.4%) | 9 (0.8%) |
| 55 to 59 Years | 220 (78.0%) | 0 (0.0%) |
| 60 to 64 Years | 346 (47.7%) | 0 (0.0%) |
| 65 to 74 Years | 306 (35.7%) | 41 (13.4%) |
| 75 Years and over | 22 (4.5%) | 0 (0.0%) |
| Total | 3,680 (66.9%) | 140 (3.8%) |
Employment Status by Educational Attainment in Lake Shore
According to labor force statistics for Lake Shore, 83.0% of individuals (2,983) out of the total population between 25 and 64 years of age (3,594) are in the labor force, with 3.1% or 92 of them being unemployed. The group with the highest labor force participation rate are those with the educational attainment of bachelor's degree or higher, with 90.3% or 1,350 individuals in the labor force. Within the labor force, individuals with college / associate degree education have the highest percentage of unemployment, with 8.8% or 93 of them being unemployed.
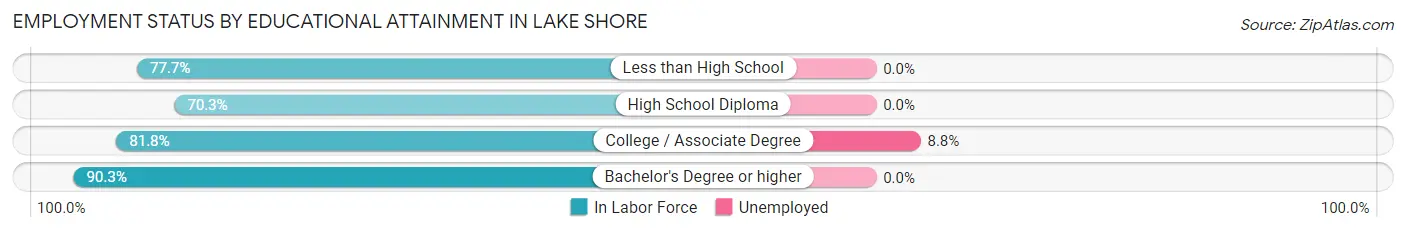
| Educational Attainment | In Labor Force | Unemployed |
| Less than High School | 73 (77.7%) | 0 (0.0%) |
| High School Diploma | 497 (70.3%) | 0 (0.0%) |
| College / Associate Degree | 1,062 (81.8%) | 114 (8.8%) |
| Bachelor's Degree or higher | 1,350 (90.3%) | 0 (0.0%) |
| Total | 2,983 (83.0%) | 111 (3.1%) |
Employment Occupations by Sex in Lake Shore
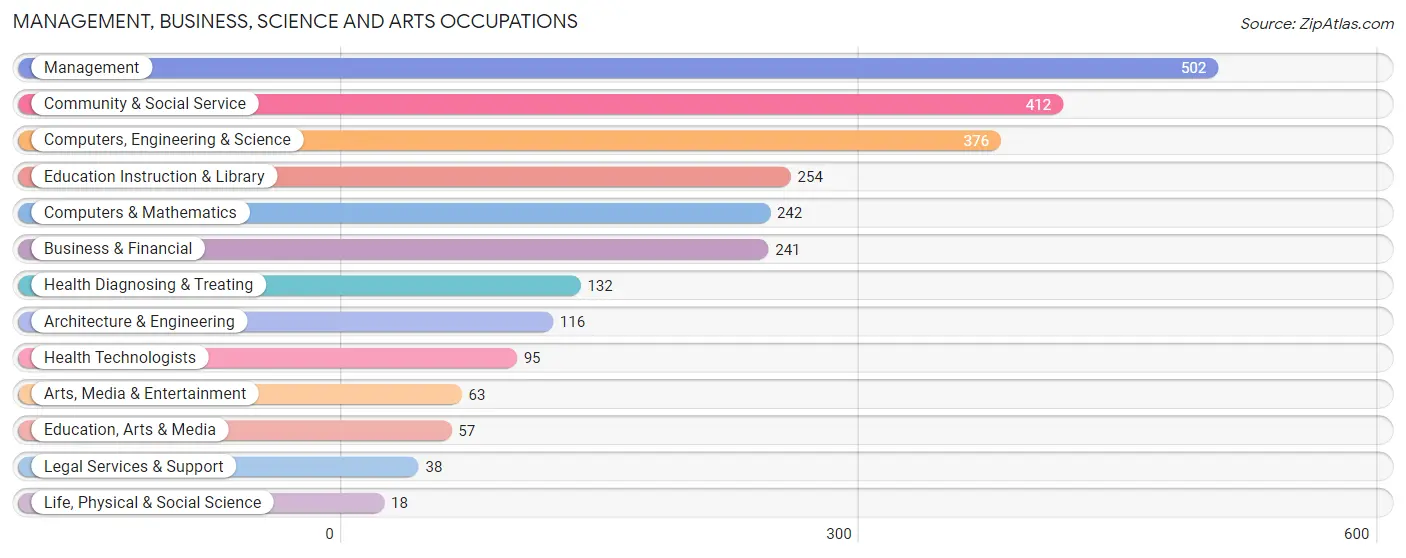
Management, Business, Science and Arts Occupations
The most common Management, Business, Science and Arts occupations in Lake Shore are Management (502 | 14.2%), Community & Social Service (412 | 11.6%), Computers, Engineering & Science (376 | 10.6%), Education Instruction & Library (254 | 7.2%), and Computers & Mathematics (242 | 6.8%).
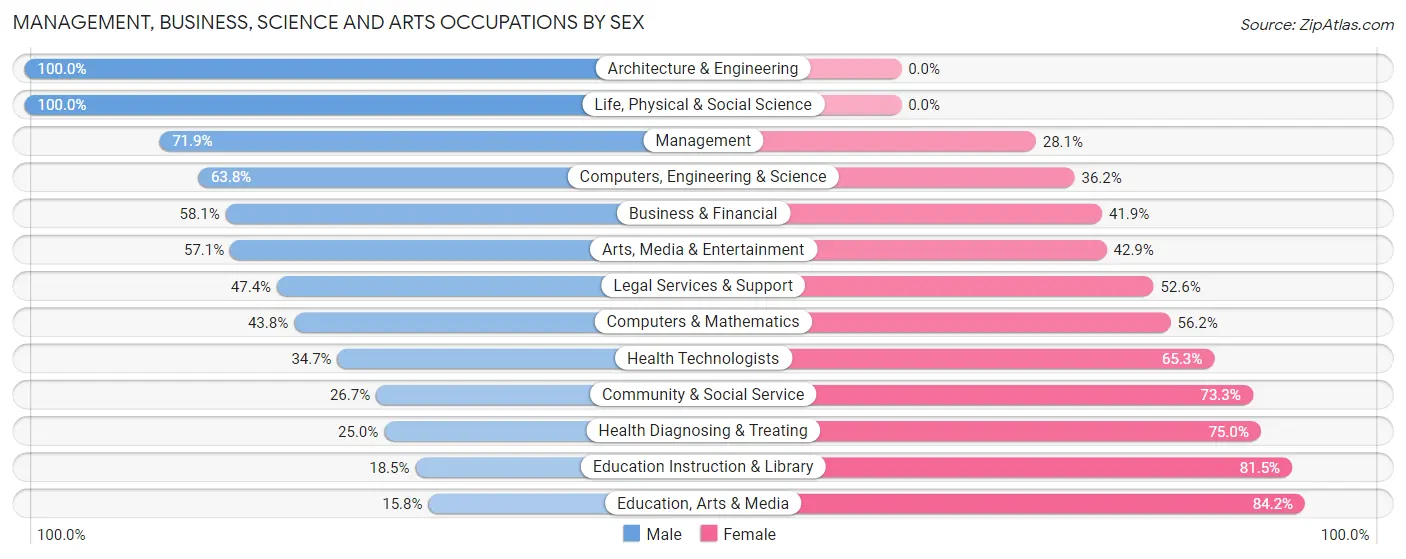
Management, Business, Science and Arts Occupations by Sex
Within the Management, Business, Science and Arts occupations in Lake Shore, the most male-oriented occupations are Architecture & Engineering (100.0%), Life, Physical & Social Science (100.0%), and Management (71.9%), while the most female-oriented occupations are Education, Arts & Media (84.2%), Education Instruction & Library (81.5%), and Health Diagnosing & Treating (75.0%).
| Occupation | Male | Female |
| Management | 361 (71.9%) | 141 (28.1%) |
| Business & Financial | 140 (58.1%) | 101 (41.9%) |
| Computers, Engineering & Science | 240 (63.8%) | 136 (36.2%) |
| Computers & Mathematics | 106 (43.8%) | 136 (56.2%) |
| Architecture & Engineering | 116 (100.0%) | 0 (0.0%) |
| Life, Physical & Social Science | 18 (100.0%) | 0 (0.0%) |
| Community & Social Service | 110 (26.7%) | 302 (73.3%) |
| Education, Arts & Media | 9 (15.8%) | 48 (84.2%) |
| Legal Services & Support | 18 (47.4%) | 20 (52.6%) |
| Education Instruction & Library | 47 (18.5%) | 207 (81.5%) |
| Arts, Media & Entertainment | 36 (57.1%) | 27 (42.9%) |
| Health Diagnosing & Treating | 33 (25.0%) | 99 (75.0%) |
| Health Technologists | 33 (34.7%) | 62 (65.3%) |
| Total (Category) | 884 (53.2%) | 779 (46.8%) |
| Total (Overall) | 1,989 (56.2%) | 1,551 (43.8%) |
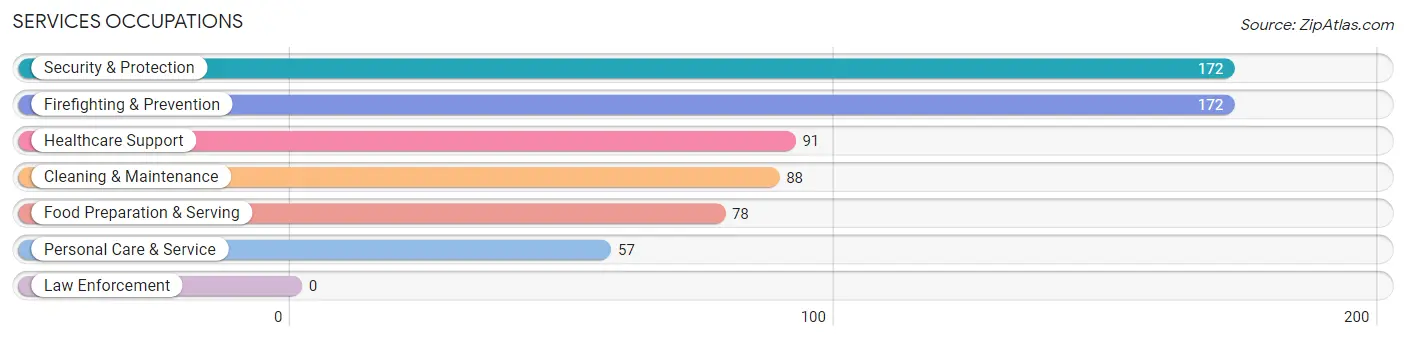
Services Occupations
The most common Services occupations in Lake Shore are Security & Protection (172 | 4.9%), Firefighting & Prevention (172 | 4.9%), Healthcare Support (91 | 2.6%), Cleaning & Maintenance (88 | 2.5%), and Food Preparation & Serving (78 | 2.2%).
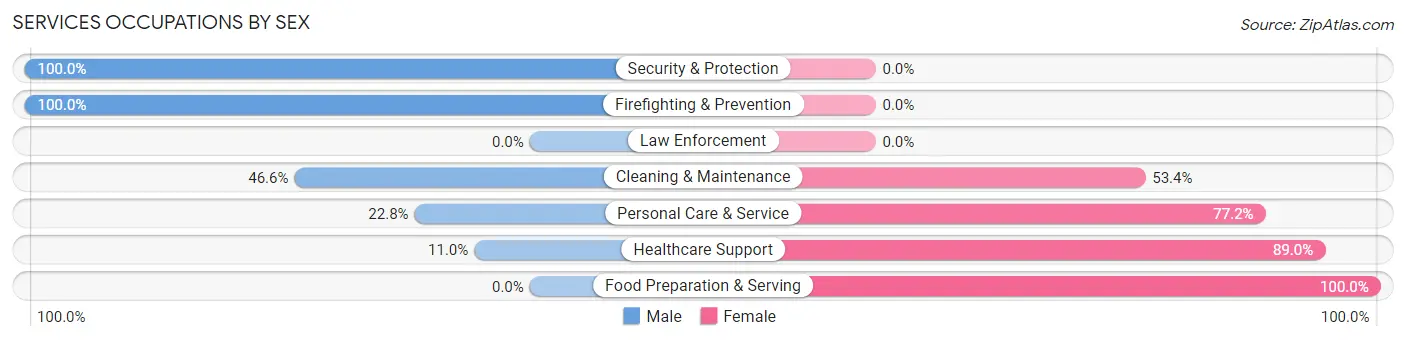
Services Occupations by Sex
Within the Services occupations in Lake Shore, the most male-oriented occupations are Security & Protection (100.0%), Firefighting & Prevention (100.0%), and Cleaning & Maintenance (46.6%), while the most female-oriented occupations are Food Preparation & Serving (100.0%), Healthcare Support (89.0%), and Personal Care & Service (77.2%).
| Occupation | Male | Female |
| Healthcare Support | 10 (11.0%) | 81 (89.0%) |
| Security & Protection | 172 (100.0%) | 0 (0.0%) |
| Firefighting & Prevention | 172 (100.0%) | 0 (0.0%) |
| Law Enforcement | 0 (0.0%) | 0 (0.0%) |
| Food Preparation & Serving | 0 (0.0%) | 78 (100.0%) |
| Cleaning & Maintenance | 41 (46.6%) | 47 (53.4%) |
| Personal Care & Service | 13 (22.8%) | 44 (77.2%) |
| Total (Category) | 236 (48.6%) | 250 (51.4%) |
| Total (Overall) | 1,989 (56.2%) | 1,551 (43.8%) |
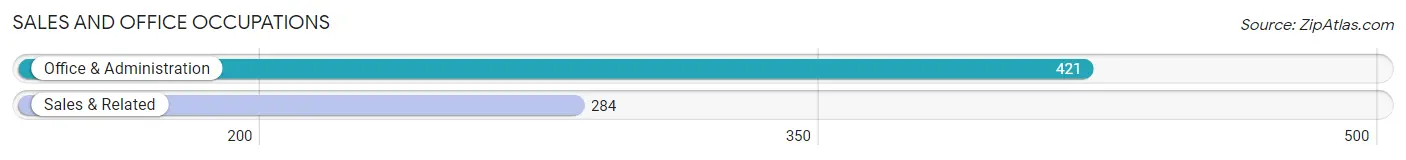
Sales and Office Occupations
The most common Sales and Office occupations in Lake Shore are Office & Administration (421 | 11.9%), and Sales & Related (284 | 8.0%).
Sales and Office Occupations by Sex
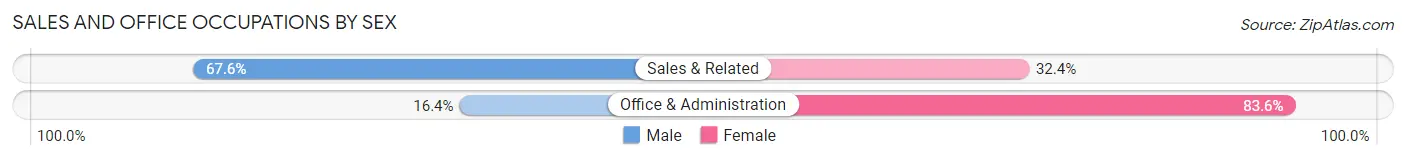
| Occupation | Male | Female |
| Sales & Related | 192 (67.6%) | 92 (32.4%) |
| Office & Administration | 69 (16.4%) | 352 (83.6%) |
| Total (Category) | 261 (37.0%) | 444 (63.0%) |
| Total (Overall) | 1,989 (56.2%) | 1,551 (43.8%) |
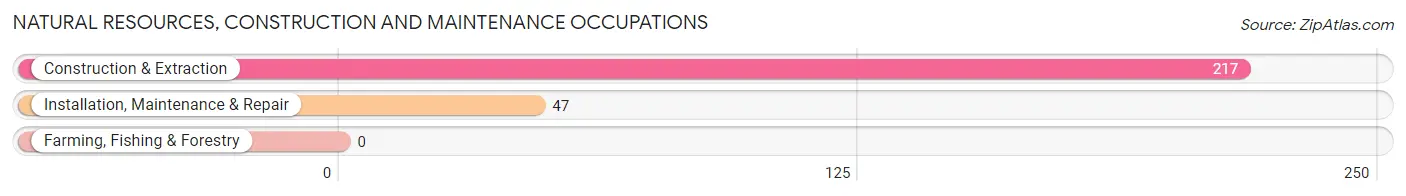
Natural Resources, Construction and Maintenance Occupations
The most common Natural Resources, Construction and Maintenance occupations in Lake Shore are Construction & Extraction (217 | 6.1%), and Installation, Maintenance & Repair (47 | 1.3%).
Natural Resources, Construction and Maintenance Occupations by Sex
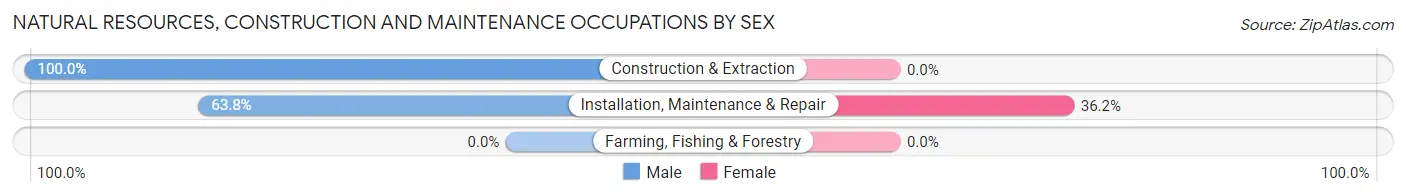
| Occupation | Male | Female |
| Farming, Fishing & Forestry | 0 (0.0%) | 0 (0.0%) |
| Construction & Extraction | 217 (100.0%) | 0 (0.0%) |
| Installation, Maintenance & Repair | 30 (63.8%) | 17 (36.2%) |
| Total (Category) | 247 (93.6%) | 17 (6.4%) |
| Total (Overall) | 1,989 (56.2%) | 1,551 (43.8%) |
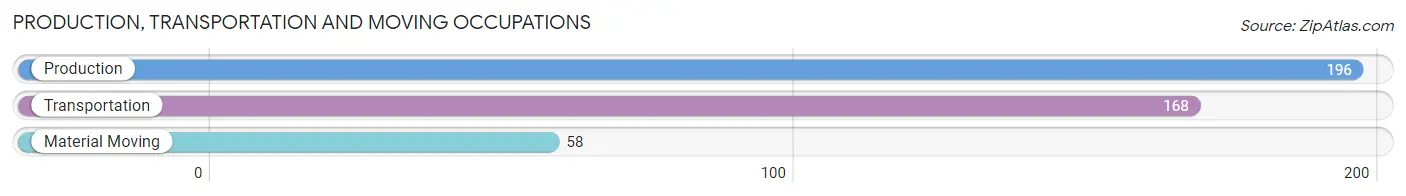
Production, Transportation and Moving Occupations
The most common Production, Transportation and Moving occupations in Lake Shore are Production (196 | 5.5%), Transportation (168 | 4.8%), and Material Moving (58 | 1.6%).
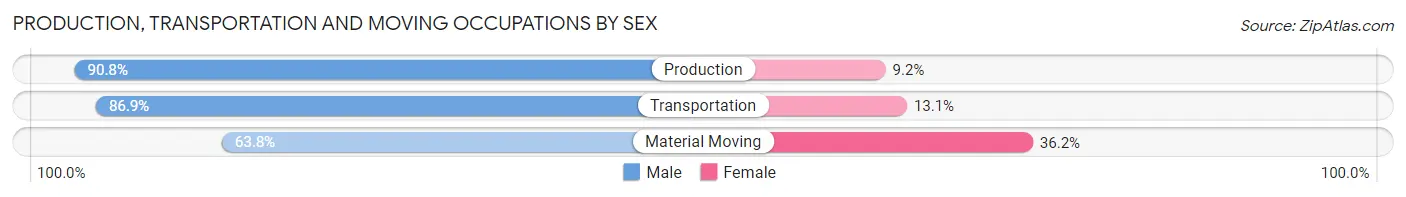
Production, Transportation and Moving Occupations by Sex
| Occupation | Male | Female |
| Production | 178 (90.8%) | 18 (9.2%) |
| Transportation | 146 (86.9%) | 22 (13.1%) |
| Material Moving | 37 (63.8%) | 21 (36.2%) |
| Total (Category) | 361 (85.6%) | 61 (14.4%) |
| Total (Overall) | 1,989 (56.2%) | 1,551 (43.8%) |
Employment Industries by Sex in Lake Shore
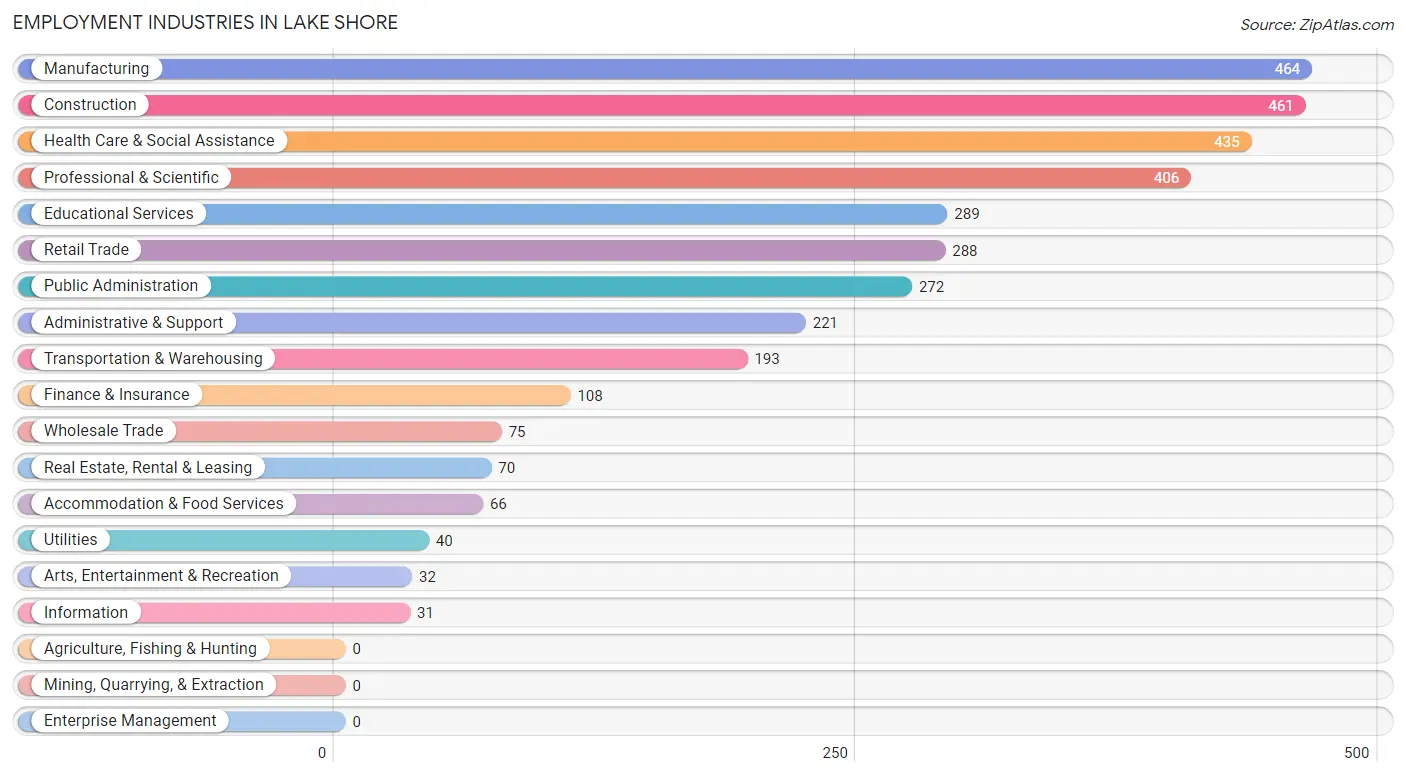
Employment Industries in Lake Shore
The major employment industries in Lake Shore include Manufacturing (464 | 13.1%), Construction (461 | 13.0%), Health Care & Social Assistance (435 | 12.3%), Professional & Scientific (406 | 11.5%), and Educational Services (289 | 8.2%).
Employment Industries by Sex in Lake Shore
The Lake Shore industries that see more men than women are Wholesale Trade (88.0%), Construction (87.4%), and Real Estate, Rental & Leasing (87.1%), whereas the industries that tend to have a higher number of women are Information (100.0%), Accommodation & Food Services (100.0%), and Health Care & Social Assistance (85.1%).
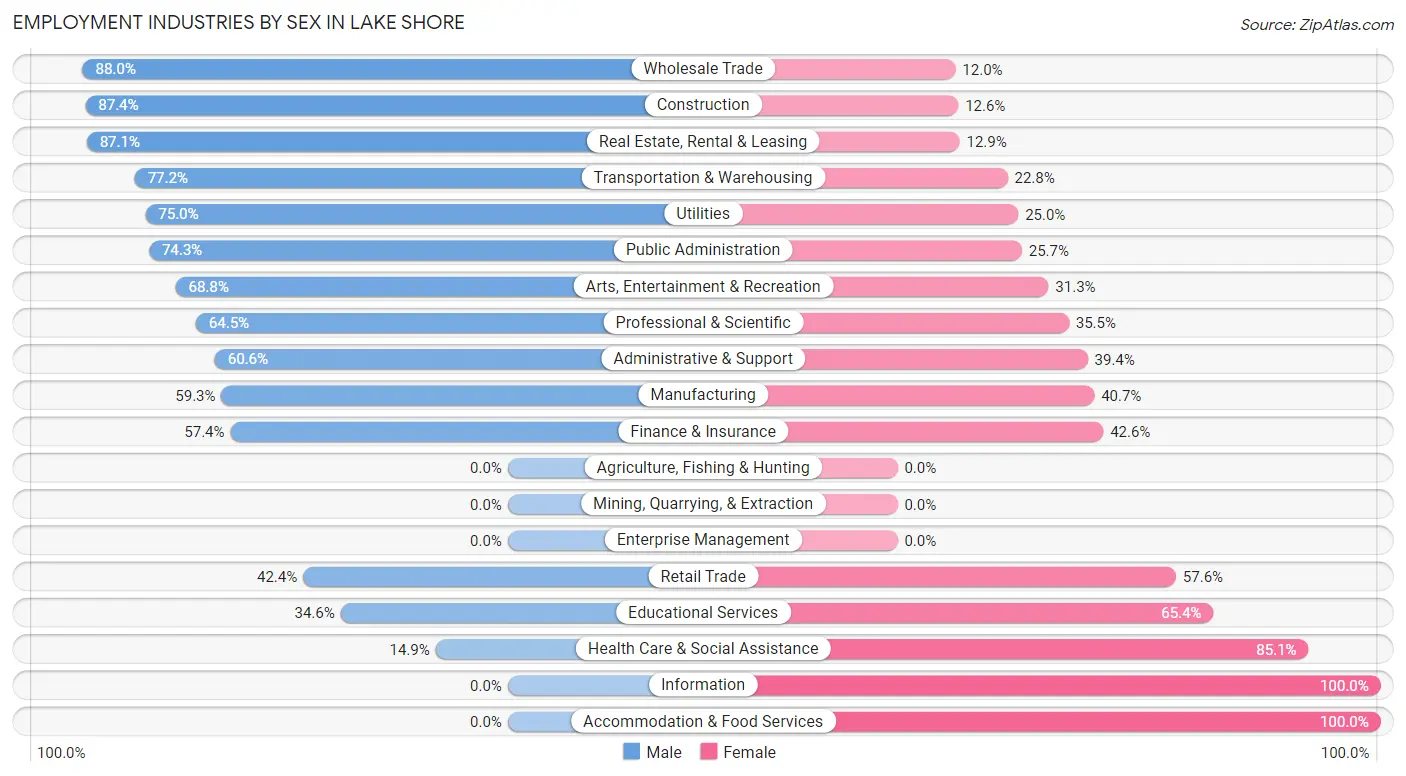
| Industry | Male | Female |
| Agriculture, Fishing & Hunting | 0 (0.0%) | 0 (0.0%) |
| Mining, Quarrying, & Extraction | 0 (0.0%) | 0 (0.0%) |
| Construction | 403 (87.4%) | 58 (12.6%) |
| Manufacturing | 275 (59.3%) | 189 (40.7%) |
| Wholesale Trade | 66 (88.0%) | 9 (12.0%) |
| Retail Trade | 122 (42.4%) | 166 (57.6%) |
| Transportation & Warehousing | 149 (77.2%) | 44 (22.8%) |
| Utilities | 30 (75.0%) | 10 (25.0%) |
| Information | 0 (0.0%) | 31 (100.0%) |
| Finance & Insurance | 62 (57.4%) | 46 (42.6%) |
| Real Estate, Rental & Leasing | 61 (87.1%) | 9 (12.9%) |
| Professional & Scientific | 262 (64.5%) | 144 (35.5%) |
| Enterprise Management | 0 (0.0%) | 0 (0.0%) |
| Administrative & Support | 134 (60.6%) | 87 (39.4%) |
| Educational Services | 100 (34.6%) | 189 (65.4%) |
| Health Care & Social Assistance | 65 (14.9%) | 370 (85.1%) |
| Arts, Entertainment & Recreation | 22 (68.8%) | 10 (31.2%) |
| Accommodation & Food Services | 0 (0.0%) | 66 (100.0%) |
| Public Administration | 202 (74.3%) | 70 (25.7%) |
| Total | 1,989 (56.2%) | 1,551 (43.8%) |
Education in Lake Shore
School Enrollment in Lake Shore
The most common levels of schooling among the 1,317 students in Lake Shore are high school (466 | 35.4%), middle school (345 | 26.2%), and elementary school (218 | 16.6%).
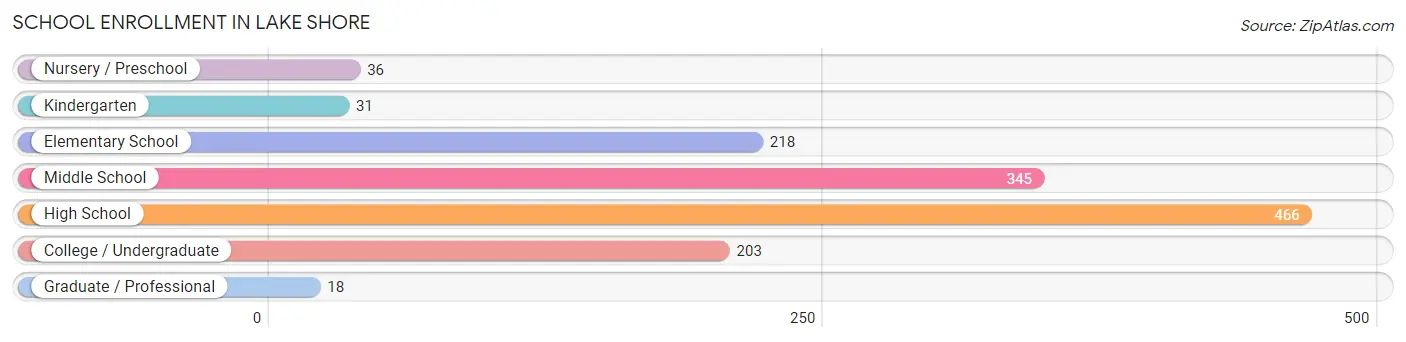
| School Level | # Students | % Students |
| Nursery / Preschool | 36 | 2.7% |
| Kindergarten | 31 | 2.4% |
| Elementary School | 218 | 16.6% |
| Middle School | 345 | 26.2% |
| High School | 466 | 35.4% |
| College / Undergraduate | 203 | 15.4% |
| Graduate / Professional | 18 | 1.4% |
| Total | 1,317 | 100.0% |
School Enrollment by Age by Funding Source in Lake Shore
Out of a total of 1,317 students who are enrolled in schools in Lake Shore, 173 (13.1%) attend a private institution, while the remaining 1,144 (86.9%) are enrolled in public schools. The age group of 3 to 4 year olds has the highest likelihood of being enrolled in private schools, with 13 (100.0% in the age bracket) enrolled. Conversely, the age group of 18 to 19 year olds has the lowest likelihood of being enrolled in a private school, with 41 (100.0% in the age bracket) attending a public institution.
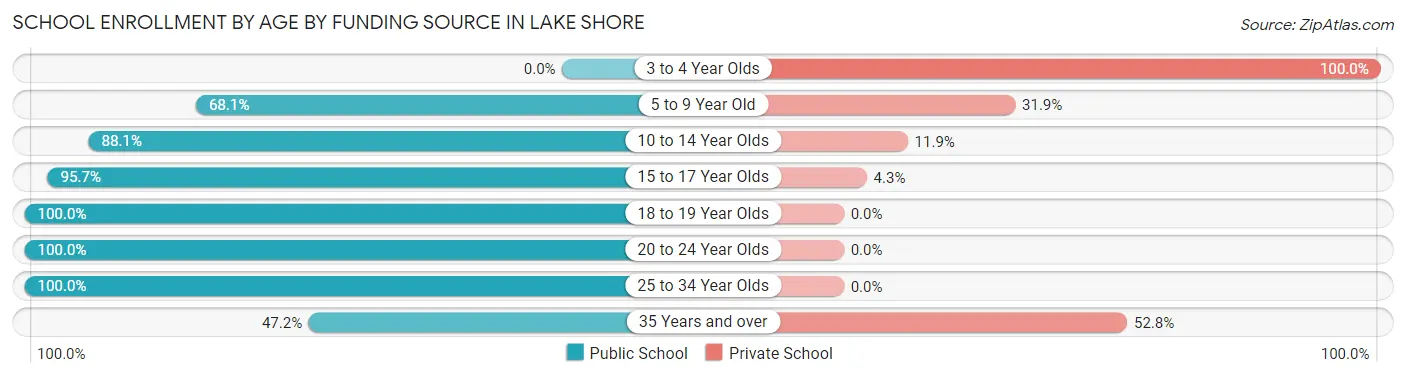
| Age Bracket | Public School | Private School |
| 3 to 4 Year Olds | 0 (0.0%) | 13 (100.0%) |
| 5 to 9 Year Old | 162 (68.1%) | 76 (31.9%) |
| 10 to 14 Year Olds | 325 (88.1%) | 44 (11.9%) |
| 15 to 17 Year Olds | 447 (95.7%) | 20 (4.3%) |
| 18 to 19 Year Olds | 41 (100.0%) | 0 (0.0%) |
| 20 to 24 Year Olds | 136 (100.0%) | 0 (0.0%) |
| 25 to 34 Year Olds | 17 (100.0%) | 0 (0.0%) |
| 35 Years and over | 17 (47.2%) | 19 (52.8%) |
| Total | 1,144 (86.9%) | 173 (13.1%) |
Educational Attainment by Field of Study in Lake Shore
Business (393 | 18.2%), literature & languages (266 | 12.3%), education (252 | 11.7%), science & technology (204 | 9.5%), and social sciences (181 | 8.4%) are the most common fields of study among 2,158 individuals in Lake Shore who have obtained a bachelor's degree or higher.
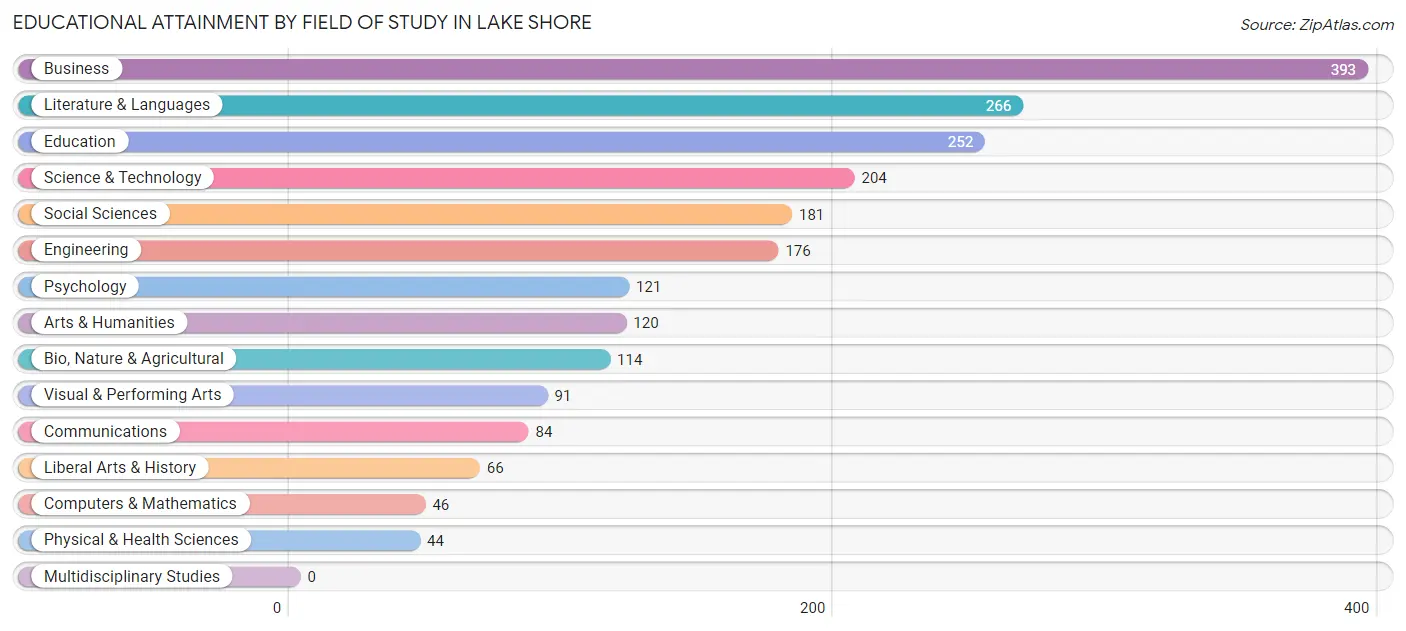
| Field of Study | # Graduates | % Graduates |
| Computers & Mathematics | 46 | 2.1% |
| Bio, Nature & Agricultural | 114 | 5.3% |
| Physical & Health Sciences | 44 | 2.0% |
| Psychology | 121 | 5.6% |
| Social Sciences | 181 | 8.4% |
| Engineering | 176 | 8.2% |
| Multidisciplinary Studies | 0 | 0.0% |
| Science & Technology | 204 | 9.5% |
| Business | 393 | 18.2% |
| Education | 252 | 11.7% |
| Literature & Languages | 266 | 12.3% |
| Liberal Arts & History | 66 | 3.1% |
| Visual & Performing Arts | 91 | 4.2% |
| Communications | 84 | 3.9% |
| Arts & Humanities | 120 | 5.6% |
| Total | 2,158 | 100.0% |
Transportation & Commute in Lake Shore
Vehicle Availability by Sex in Lake Shore
The most prevalent vehicle ownership categories in Lake Shore are males with 2 vehicles (869, accounting for 44.2%) and females with 2 vehicles (551, making up 56.8%).
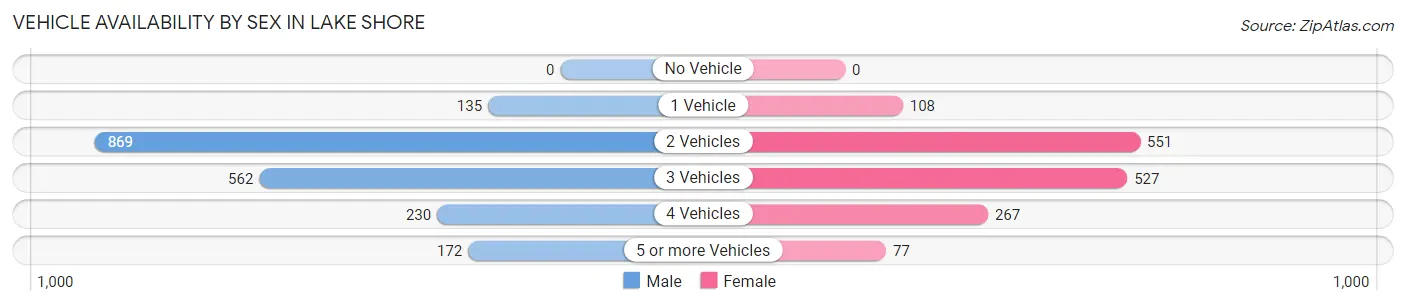
| Vehicles Available | Male | Female |
| No Vehicle | 0 (0.0%) | 0 (0.0%) |
| 1 Vehicle | 135 (6.9%) | 108 (7.1%) |
| 2 Vehicles | 869 (44.2%) | 551 (36.0%) |
| 3 Vehicles | 562 (28.6%) | 527 (34.4%) |
| 4 Vehicles | 230 (11.7%) | 267 (17.4%) |
| 5 or more Vehicles | 172 (8.7%) | 77 (5.0%) |
| Total | 1,968 (100.0%) | 1,530 (100.0%) |
Commute Time in Lake Shore
The most frequently occuring commute durations in Lake Shore are 30 to 34 minutes (640 commuters, 22.1%), 20 to 24 minutes (474 commuters, 16.4%), and 10 to 14 minutes (407 commuters, 14.1%).
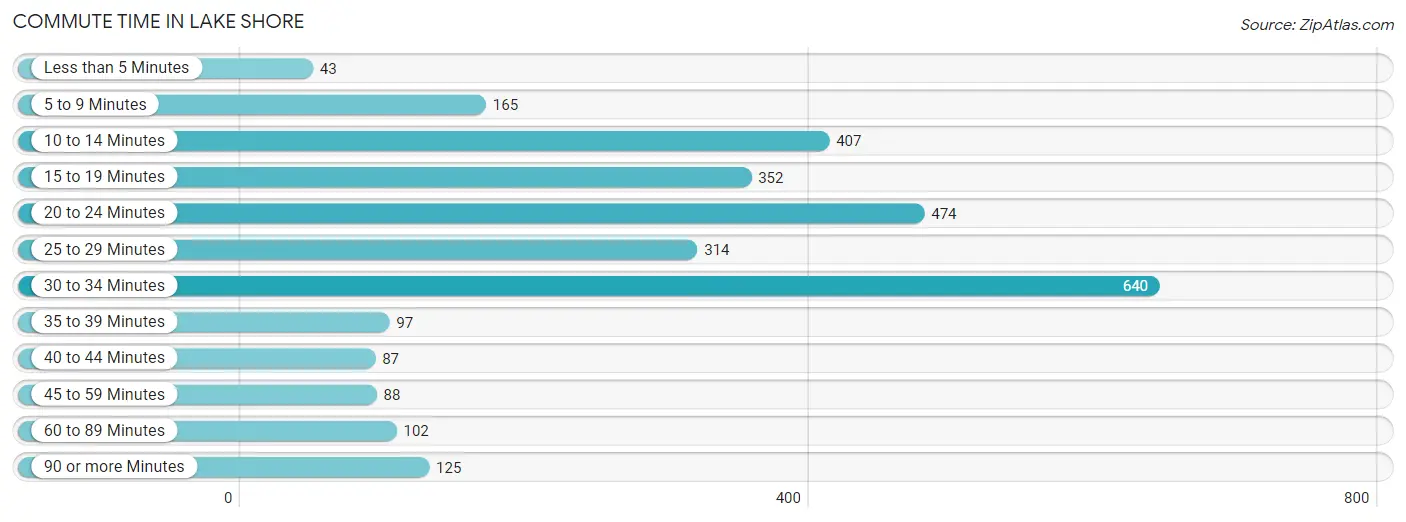
| Commute Time | # Commuters | % Commuters |
| Less than 5 Minutes | 43 | 1.5% |
| 5 to 9 Minutes | 165 | 5.7% |
| 10 to 14 Minutes | 407 | 14.1% |
| 15 to 19 Minutes | 352 | 12.2% |
| 20 to 24 Minutes | 474 | 16.4% |
| 25 to 29 Minutes | 314 | 10.8% |
| 30 to 34 Minutes | 640 | 22.1% |
| 35 to 39 Minutes | 97 | 3.4% |
| 40 to 44 Minutes | 87 | 3.0% |
| 45 to 59 Minutes | 88 | 3.0% |
| 60 to 89 Minutes | 102 | 3.5% |
| 90 or more Minutes | 125 | 4.3% |
Commute Time by Sex in Lake Shore
The most common commute times in Lake Shore are 30 to 34 minutes (283 commuters, 17.9%) for males and 30 to 34 minutes (357 commuters, 27.2%) for females.
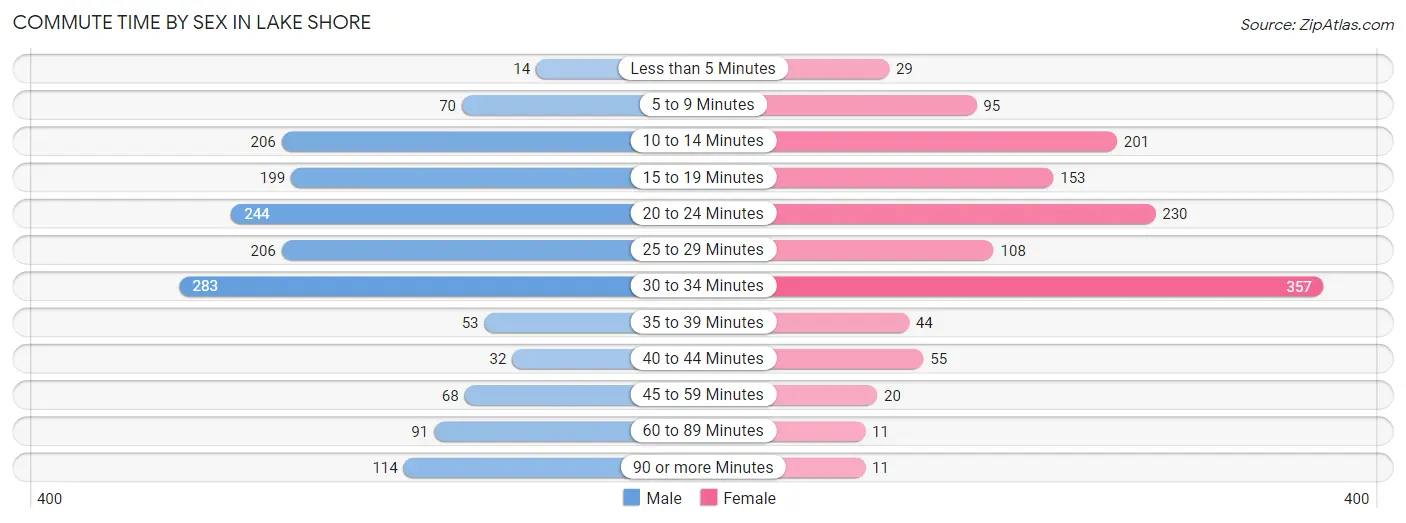
| Commute Time | Male | Female |
| Less than 5 Minutes | 14 (0.9%) | 29 (2.2%) |
| 5 to 9 Minutes | 70 (4.4%) | 95 (7.2%) |
| 10 to 14 Minutes | 206 (13.0%) | 201 (15.3%) |
| 15 to 19 Minutes | 199 (12.6%) | 153 (11.6%) |
| 20 to 24 Minutes | 244 (15.4%) | 230 (17.5%) |
| 25 to 29 Minutes | 206 (13.0%) | 108 (8.2%) |
| 30 to 34 Minutes | 283 (17.9%) | 357 (27.2%) |
| 35 to 39 Minutes | 53 (3.4%) | 44 (3.4%) |
| 40 to 44 Minutes | 32 (2.0%) | 55 (4.2%) |
| 45 to 59 Minutes | 68 (4.3%) | 20 (1.5%) |
| 60 to 89 Minutes | 91 (5.8%) | 11 (0.8%) |
| 90 or more Minutes | 114 (7.2%) | 11 (0.8%) |
Time of Departure to Work by Sex in Lake Shore
The most frequent times of departure to work in Lake Shore are 6:00 AM to 6:29 AM (317, 20.1%) for males and 6:00 AM to 6:29 AM (275, 20.9%) for females.
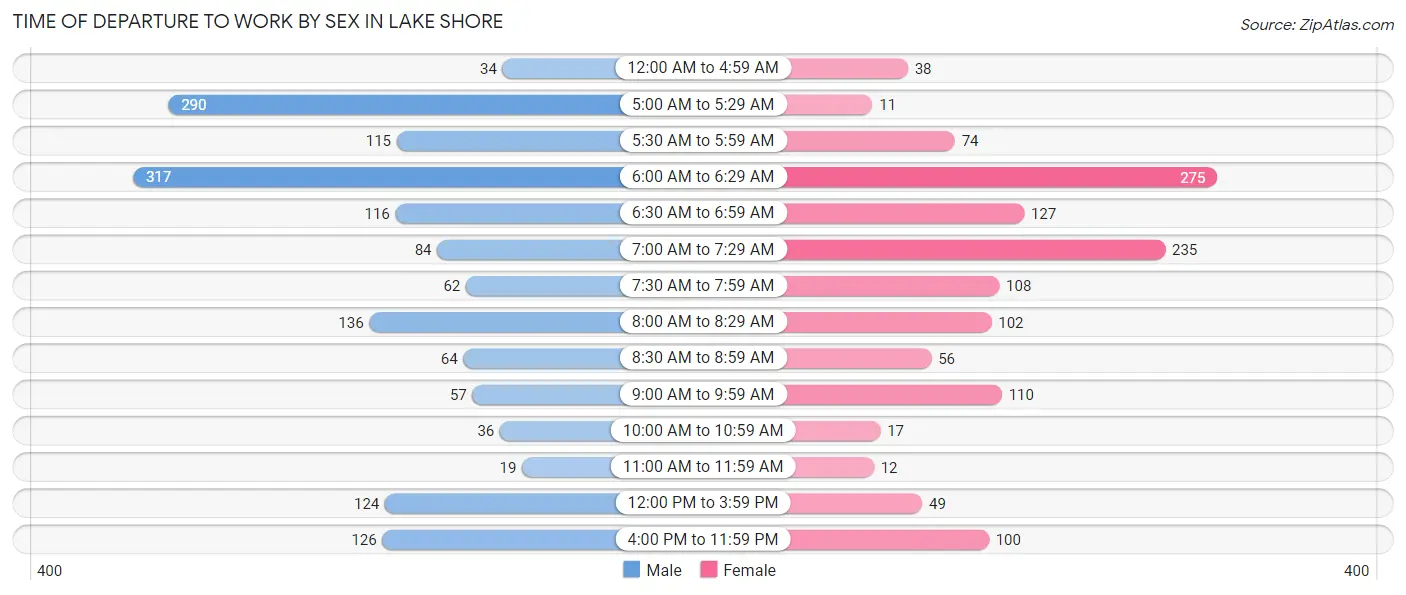
| Time of Departure | Male | Female |
| 12:00 AM to 4:59 AM | 34 (2.1%) | 38 (2.9%) |
| 5:00 AM to 5:29 AM | 290 (18.3%) | 11 (0.8%) |
| 5:30 AM to 5:59 AM | 115 (7.3%) | 74 (5.6%) |
| 6:00 AM to 6:29 AM | 317 (20.1%) | 275 (20.9%) |
| 6:30 AM to 6:59 AM | 116 (7.3%) | 127 (9.7%) |
| 7:00 AM to 7:29 AM | 84 (5.3%) | 235 (17.9%) |
| 7:30 AM to 7:59 AM | 62 (3.9%) | 108 (8.2%) |
| 8:00 AM to 8:29 AM | 136 (8.6%) | 102 (7.8%) |
| 8:30 AM to 8:59 AM | 64 (4.1%) | 56 (4.3%) |
| 9:00 AM to 9:59 AM | 57 (3.6%) | 110 (8.4%) |
| 10:00 AM to 10:59 AM | 36 (2.3%) | 17 (1.3%) |
| 11:00 AM to 11:59 AM | 19 (1.2%) | 12 (0.9%) |
| 12:00 PM to 3:59 PM | 124 (7.9%) | 49 (3.7%) |
| 4:00 PM to 11:59 PM | 126 (8.0%) | 100 (7.6%) |
| Total | 1,580 (100.0%) | 1,314 (100.0%) |
Housing Occupancy in Lake Shore
Occupancy by Ownership in Lake Shore
Of the total 2,626 dwellings in Lake Shore, owner-occupied units account for 2,317 (88.2%), while renter-occupied units make up 309 (11.8%).
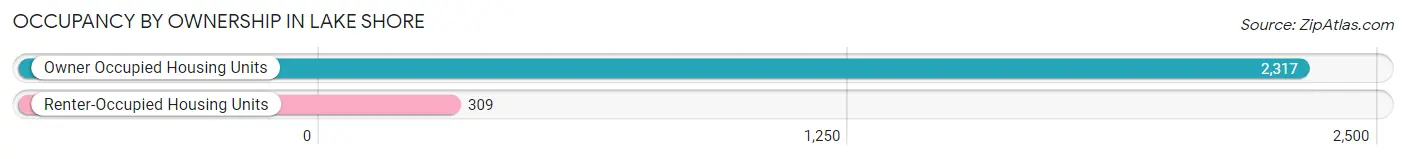
| Occupancy | # Housing Units | % Housing Units |
| Owner Occupied Housing Units | 2,317 | 88.2% |
| Renter-Occupied Housing Units | 309 | 11.8% |
| Total Occupied Housing Units | 2,626 | 100.0% |
Occupancy by Household Size in Lake Shore
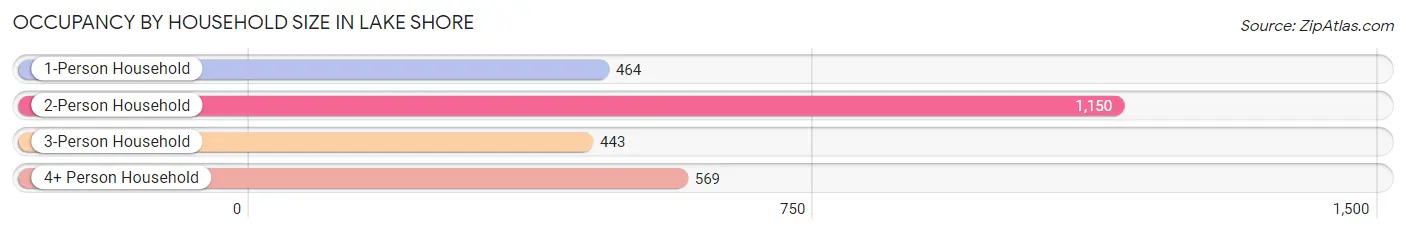
| Household Size | # Housing Units | % Housing Units |
| 1-Person Household | 464 | 17.7% |
| 2-Person Household | 1,150 | 43.8% |
| 3-Person Household | 443 | 16.9% |
| 4+ Person Household | 569 | 21.7% |
| Total Housing Units | 2,626 | 100.0% |
Occupancy by Ownership by Household Size in Lake Shore
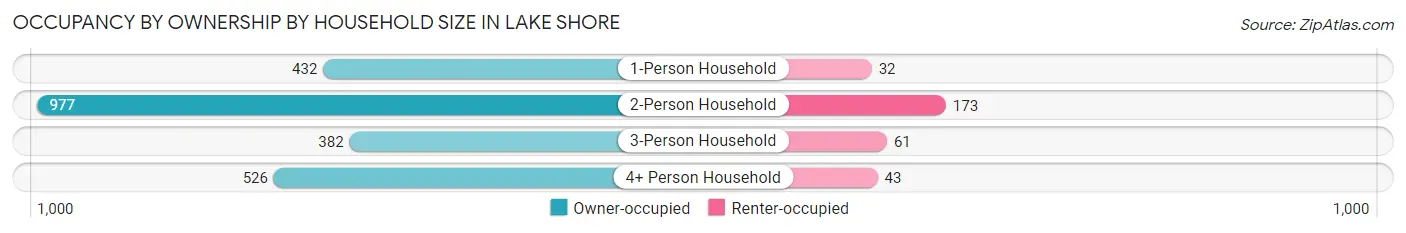
| Household Size | Owner-occupied | Renter-occupied |
| 1-Person Household | 432 (93.1%) | 32 (6.9%) |
| 2-Person Household | 977 (85.0%) | 173 (15.0%) |
| 3-Person Household | 382 (86.2%) | 61 (13.8%) |
| 4+ Person Household | 526 (92.4%) | 43 (7.6%) |
| Total Housing Units | 2,317 (88.2%) | 309 (11.8%) |
Occupancy by Educational Attainment in Lake Shore
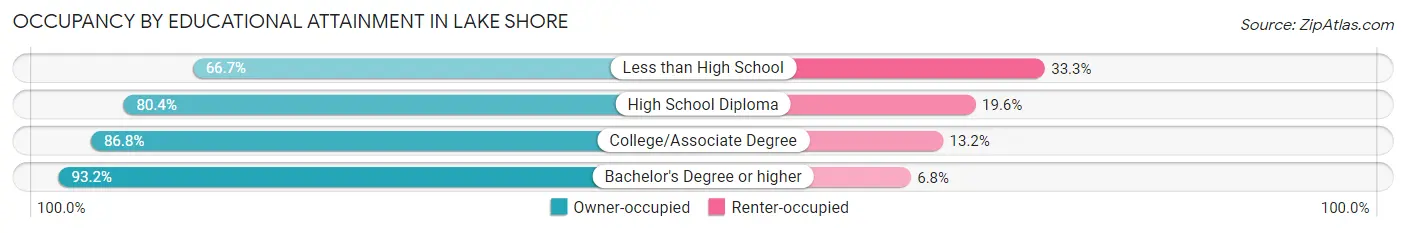
| Household Size | Owner-occupied | Renter-occupied |
| Less than High School | 22 (66.7%) | 11 (33.3%) |
| High School Diploma | 369 (80.4%) | 90 (19.6%) |
| College/Associate Degree | 864 (86.8%) | 131 (13.2%) |
| Bachelor's Degree or higher | 1,062 (93.2%) | 77 (6.8%) |
Occupancy by Age of Householder in Lake Shore
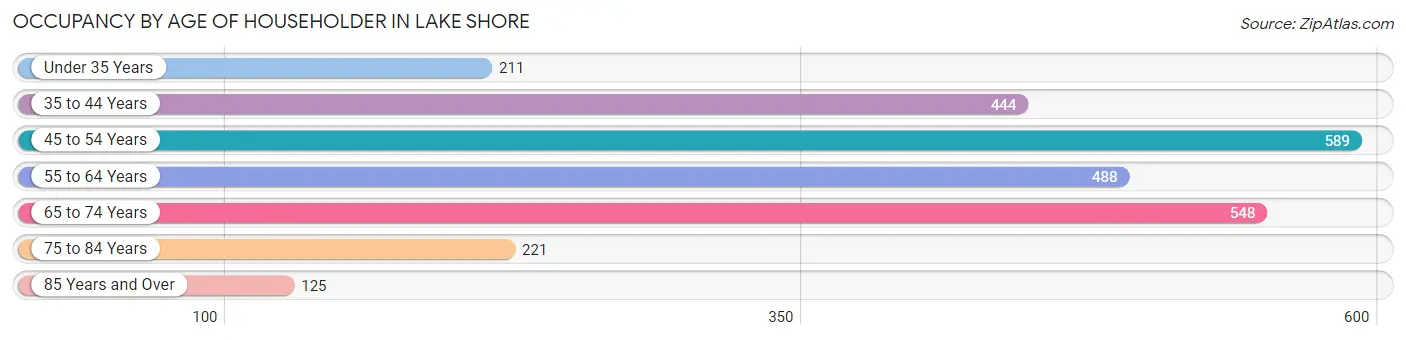
| Age Bracket | # Households | % Households |
| Under 35 Years | 211 | 8.0% |
| 35 to 44 Years | 444 | 16.9% |
| 45 to 54 Years | 589 | 22.4% |
| 55 to 64 Years | 488 | 18.6% |
| 65 to 74 Years | 548 | 20.9% |
| 75 to 84 Years | 221 | 8.4% |
| 85 Years and Over | 125 | 4.8% |
| Total | 2,626 | 100.0% |
Housing Finances in Lake Shore
Median Income by Occupancy in Lake Shore
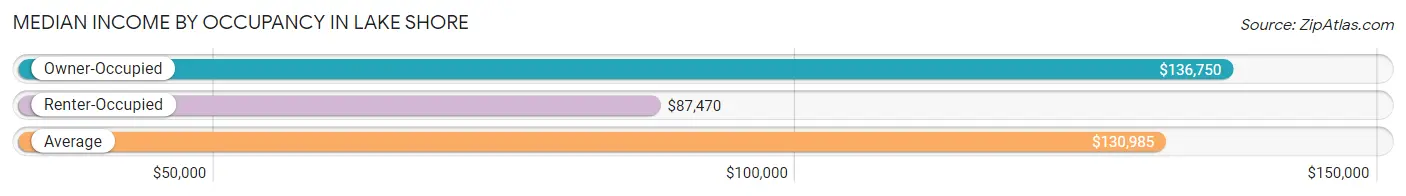
| Occupancy Type | # Households | Median Income |
| Owner-Occupied | 2,317 (88.2%) | $136,750 |
| Renter-Occupied | 309 (11.8%) | $87,470 |
| Average | 2,626 (100.0%) | $130,985 |
Occupancy by Householder Income Bracket in Lake Shore
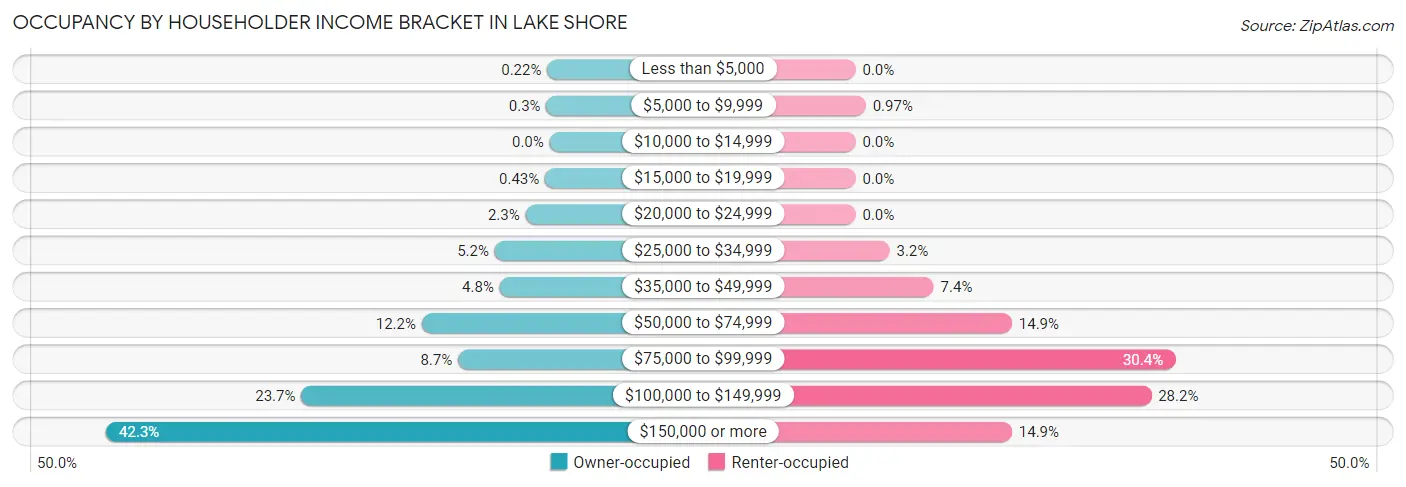
| Income Bracket | Owner-occupied | Renter-occupied |
| Less than $5,000 | 5 (0.2%) | 0 (0.0%) |
| $5,000 to $9,999 | 7 (0.3%) | 3 (1.0%) |
| $10,000 to $14,999 | 0 (0.0%) | 0 (0.0%) |
| $15,000 to $19,999 | 10 (0.4%) | 0 (0.0%) |
| $20,000 to $24,999 | 53 (2.3%) | 0 (0.0%) |
| $25,000 to $34,999 | 121 (5.2%) | 10 (3.2%) |
| $35,000 to $49,999 | 110 (4.8%) | 23 (7.4%) |
| $50,000 to $74,999 | 282 (12.2%) | 46 (14.9%) |
| $75,000 to $99,999 | 202 (8.7%) | 94 (30.4%) |
| $100,000 to $149,999 | 548 (23.6%) | 87 (28.2%) |
| $150,000 or more | 979 (42.2%) | 46 (14.9%) |
| Total | 2,317 (100.0%) | 309 (100.0%) |
Monthly Housing Cost Tiers in Lake Shore
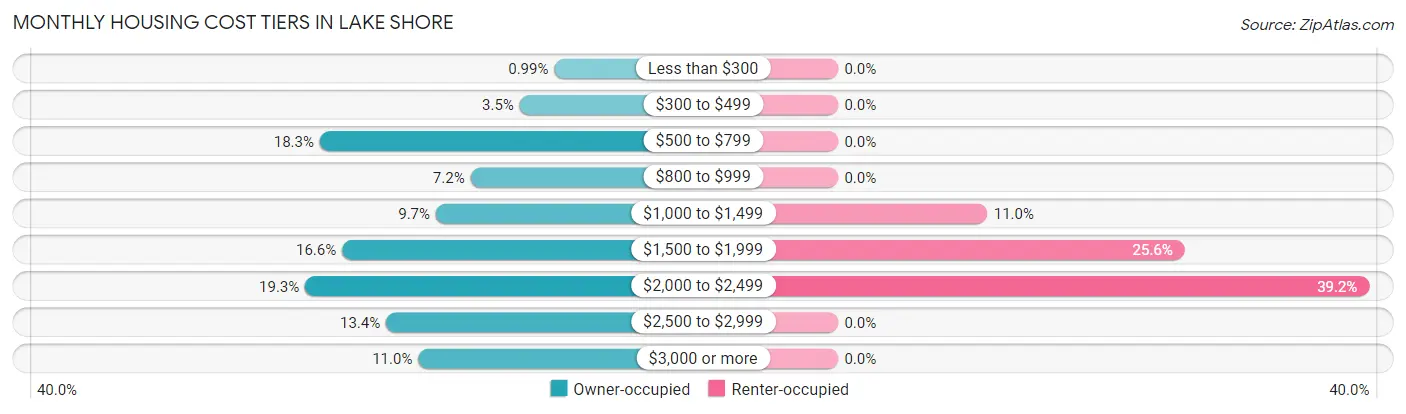
| Monthly Cost | Owner-occupied | Renter-occupied |
| Less than $300 | 23 (1.0%) | 0 (0.0%) |
| $300 to $499 | 82 (3.5%) | 0 (0.0%) |
| $500 to $799 | 423 (18.3%) | 0 (0.0%) |
| $800 to $999 | 166 (7.2%) | 0 (0.0%) |
| $1,000 to $1,499 | 225 (9.7%) | 34 (11.0%) |
| $1,500 to $1,999 | 385 (16.6%) | 79 (25.6%) |
| $2,000 to $2,499 | 448 (19.3%) | 121 (39.2%) |
| $2,500 to $2,999 | 310 (13.4%) | 0 (0.0%) |
| $3,000 or more | 255 (11.0%) | 0 (0.0%) |
| Total | 2,317 (100.0%) | 309 (100.0%) |
Physical Housing Characteristics in Lake Shore
Housing Structures in Lake Shore
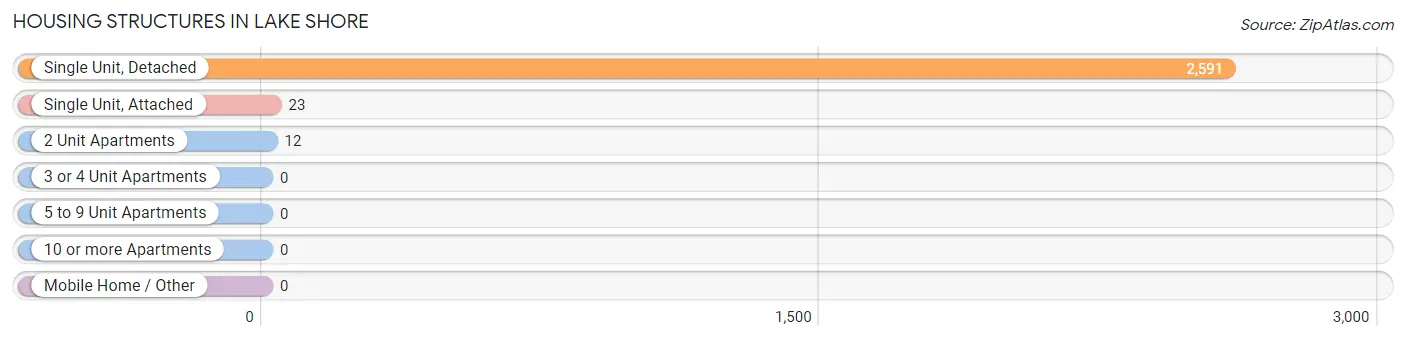
| Structure Type | # Housing Units | % Housing Units |
| Single Unit, Detached | 2,591 | 98.7% |
| Single Unit, Attached | 23 | 0.9% |
| 2 Unit Apartments | 12 | 0.5% |
| 3 or 4 Unit Apartments | 0 | 0.0% |
| 5 to 9 Unit Apartments | 0 | 0.0% |
| 10 or more Apartments | 0 | 0.0% |
| Mobile Home / Other | 0 | 0.0% |
| Total | 2,626 | 100.0% |
Housing Structures by Occupancy in Lake Shore
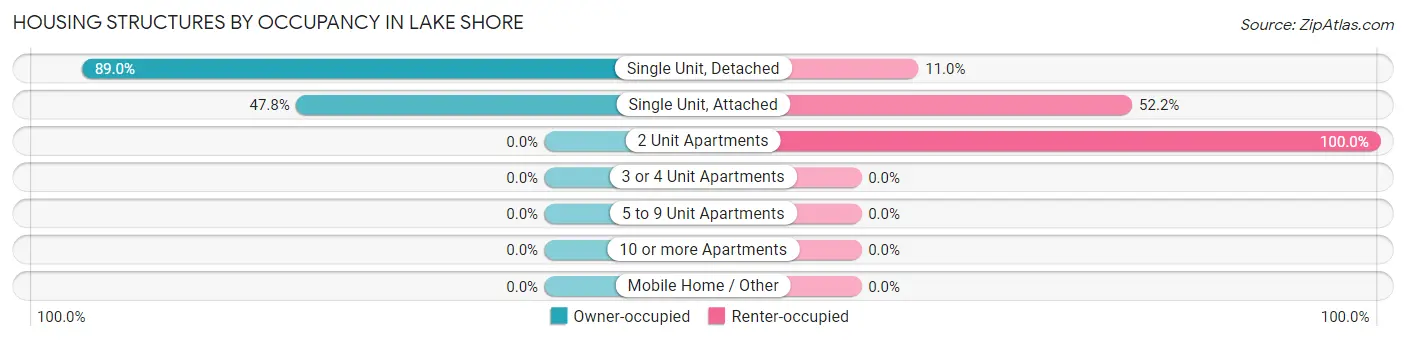
| Structure Type | Owner-occupied | Renter-occupied |
| Single Unit, Detached | 2,306 (89.0%) | 285 (11.0%) |
| Single Unit, Attached | 11 (47.8%) | 12 (52.2%) |
| 2 Unit Apartments | 0 (0.0%) | 12 (100.0%) |
| 3 or 4 Unit Apartments | 0 (0.0%) | 0 (0.0%) |
| 5 to 9 Unit Apartments | 0 (0.0%) | 0 (0.0%) |
| 10 or more Apartments | 0 (0.0%) | 0 (0.0%) |
| Mobile Home / Other | 0 (0.0%) | 0 (0.0%) |
| Total | 2,317 (88.2%) | 309 (11.8%) |
Housing Structures by Number of Rooms in Lake Shore
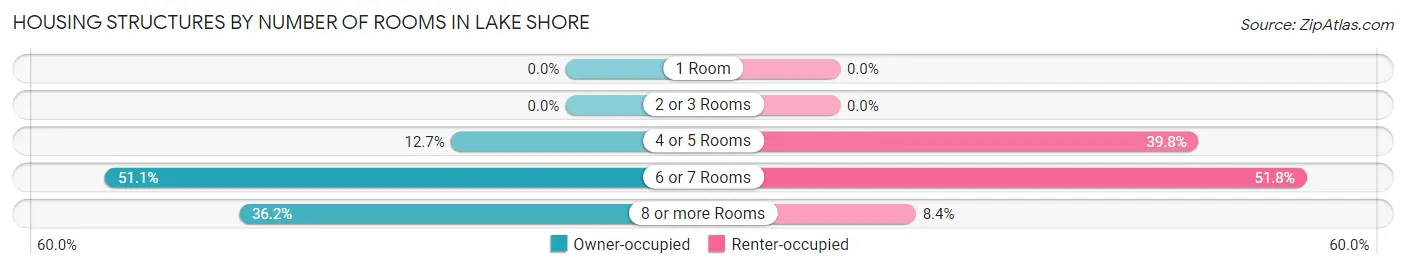
| Number of Rooms | Owner-occupied | Renter-occupied |
| 1 Room | 0 (0.0%) | 0 (0.0%) |
| 2 or 3 Rooms | 0 (0.0%) | 0 (0.0%) |
| 4 or 5 Rooms | 295 (12.7%) | 123 (39.8%) |
| 6 or 7 Rooms | 1,183 (51.1%) | 160 (51.8%) |
| 8 or more Rooms | 839 (36.2%) | 26 (8.4%) |
| Total | 2,317 (100.0%) | 309 (100.0%) |
Housing Structure by Heating Type in Lake Shore
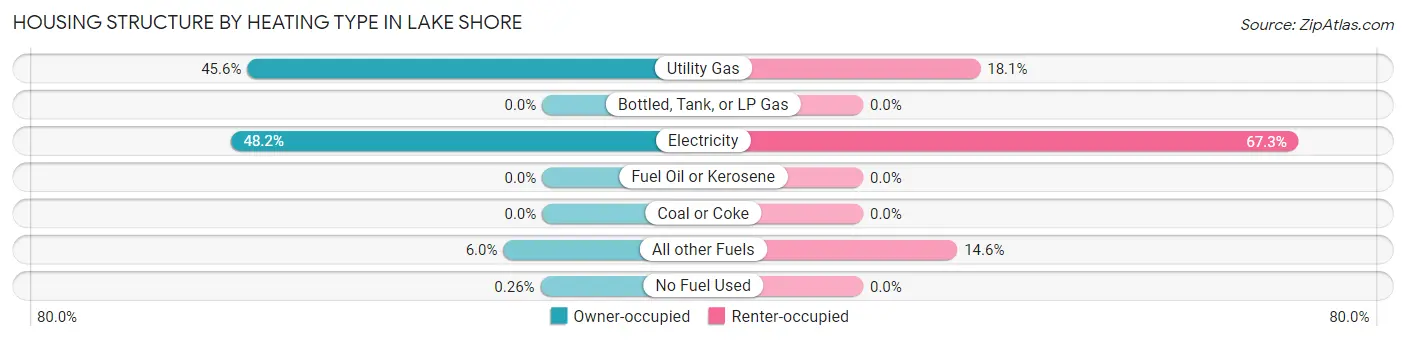
| Heating Type | Owner-occupied | Renter-occupied |
| Utility Gas | 1,056 (45.6%) | 56 (18.1%) |
| Bottled, Tank, or LP Gas | 0 (0.0%) | 0 (0.0%) |
| Electricity | 1,116 (48.2%) | 208 (67.3%) |
| Fuel Oil or Kerosene | 0 (0.0%) | 0 (0.0%) |
| Coal or Coke | 0 (0.0%) | 0 (0.0%) |
| All other Fuels | 139 (6.0%) | 45 (14.6%) |
| No Fuel Used | 6 (0.3%) | 0 (0.0%) |
| Total | 2,317 (100.0%) | 309 (100.0%) |
Household Vehicle Usage in Lake Shore
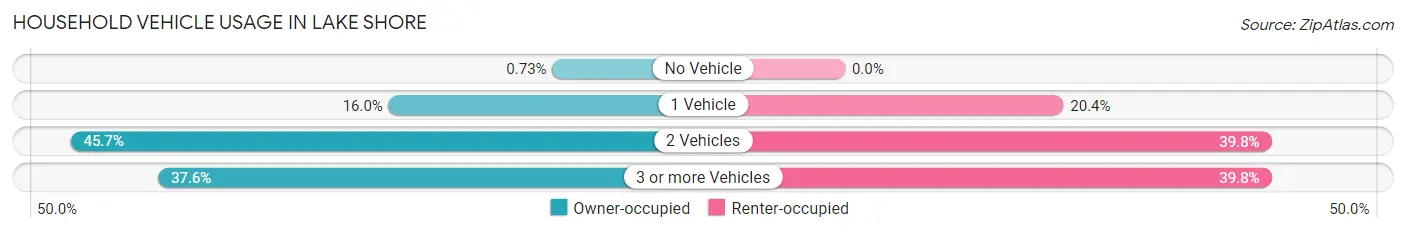
| Vehicles per Household | Owner-occupied | Renter-occupied |
| No Vehicle | 17 (0.7%) | 0 (0.0%) |
| 1 Vehicle | 371 (16.0%) | 63 (20.4%) |
| 2 Vehicles | 1,059 (45.7%) | 123 (39.8%) |
| 3 or more Vehicles | 870 (37.6%) | 123 (39.8%) |
| Total | 2,317 (100.0%) | 309 (100.0%) |
Real Estate & Mortgages in Lake Shore
Real Estate and Mortgage Overview in Lake Shore
| Characteristic | Without Mortgage | With Mortgage |
| Housing Units | 687 | 1,630 |
| Median Property Value | $487,100 | $467,800 |
| Median Household Income | $94,875 | $833 |
| Monthly Housing Costs | $677 | $255 |
| Real Estate Taxes | $4,656 | $92 |
Property Value by Mortgage Status in Lake Shore
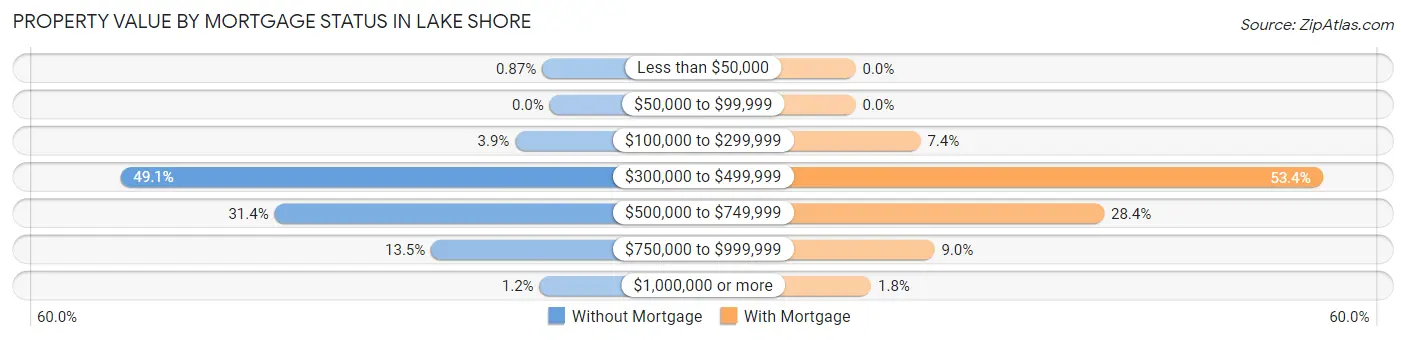
| Property Value | Without Mortgage | With Mortgage |
| Less than $50,000 | 6 (0.9%) | 0 (0.0%) |
| $50,000 to $99,999 | 0 (0.0%) | 0 (0.0%) |
| $100,000 to $299,999 | 27 (3.9%) | 121 (7.4%) |
| $300,000 to $499,999 | 337 (49.0%) | 870 (53.4%) |
| $500,000 to $749,999 | 216 (31.4%) | 463 (28.4%) |
| $750,000 to $999,999 | 93 (13.5%) | 147 (9.0%) |
| $1,000,000 or more | 8 (1.2%) | 29 (1.8%) |
| Total | 687 (100.0%) | 1,630 (100.0%) |
Household Income by Mortgage Status in Lake Shore
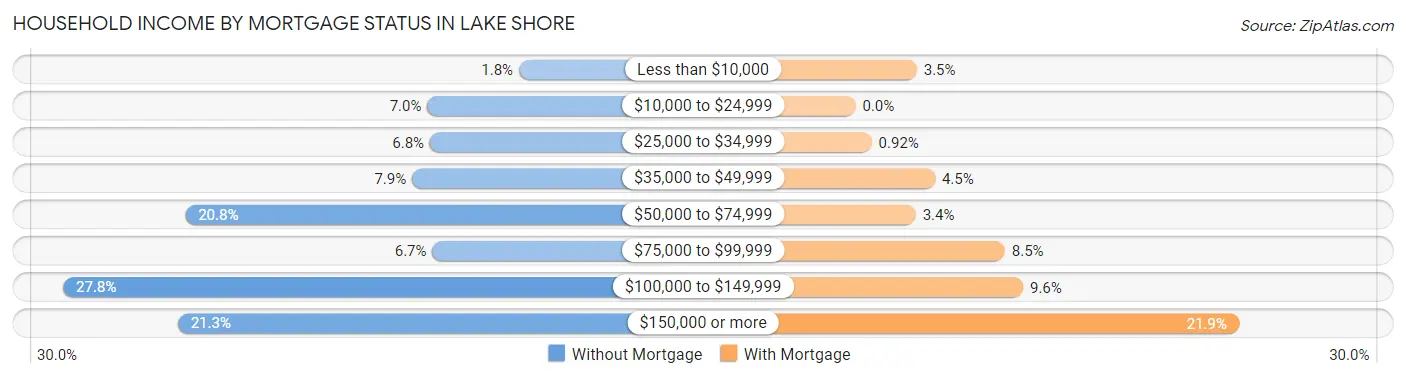
| Household Income | Without Mortgage | With Mortgage |
| Less than $10,000 | 12 (1.8%) | 57 (3.5%) |
| $10,000 to $24,999 | 48 (7.0%) | 0 (0.0%) |
| $25,000 to $34,999 | 47 (6.8%) | 15 (0.9%) |
| $35,000 to $49,999 | 54 (7.9%) | 74 (4.5%) |
| $50,000 to $74,999 | 143 (20.8%) | 56 (3.4%) |
| $75,000 to $99,999 | 46 (6.7%) | 139 (8.5%) |
| $100,000 to $149,999 | 191 (27.8%) | 156 (9.6%) |
| $150,000 or more | 146 (21.2%) | 357 (21.9%) |
| Total | 687 (100.0%) | 1,630 (100.0%) |
Property Value to Household Income Ratio in Lake Shore
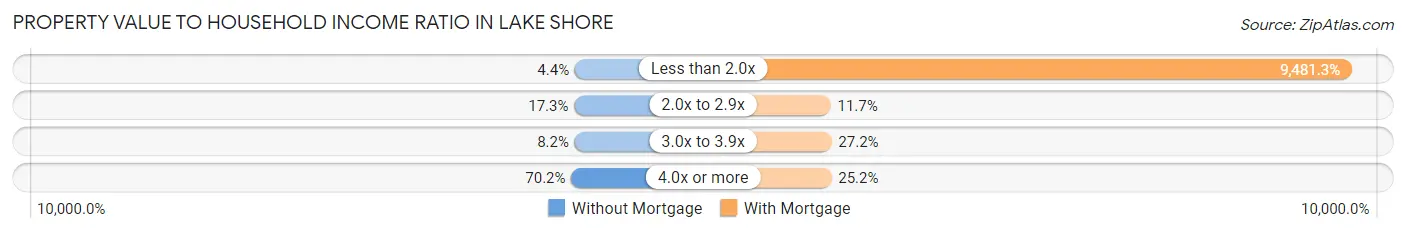
| Value-to-Income Ratio | Without Mortgage | With Mortgage |
| Less than 2.0x | 30 (4.4%) | 154,545 (9,481.3%) |
| 2.0x to 2.9x | 119 (17.3%) | 190 (11.7%) |
| 3.0x to 3.9x | 56 (8.2%) | 443 (27.2%) |
| 4.0x or more | 482 (70.2%) | 410 (25.2%) |
| Total | 687 (100.0%) | 1,630 (100.0%) |
Real Estate Taxes by Mortgage Status in Lake Shore
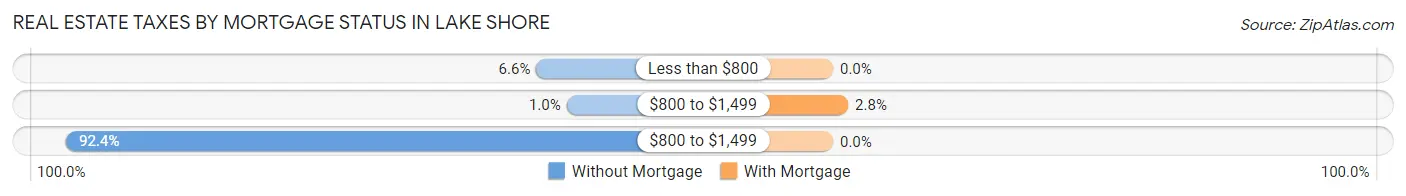
| Property Taxes | Without Mortgage | With Mortgage |
| Less than $800 | 45 (6.6%) | 0 (0.0%) |
| $800 to $1,499 | 7 (1.0%) | 45 (2.8%) |
| $800 to $1,499 | 635 (92.4%) | 0 (0.0%) |
| Total | 687 (100.0%) | 1,630 (100.0%) |
Health & Disability in Lake Shore
Health Insurance Coverage by Age in Lake Shore
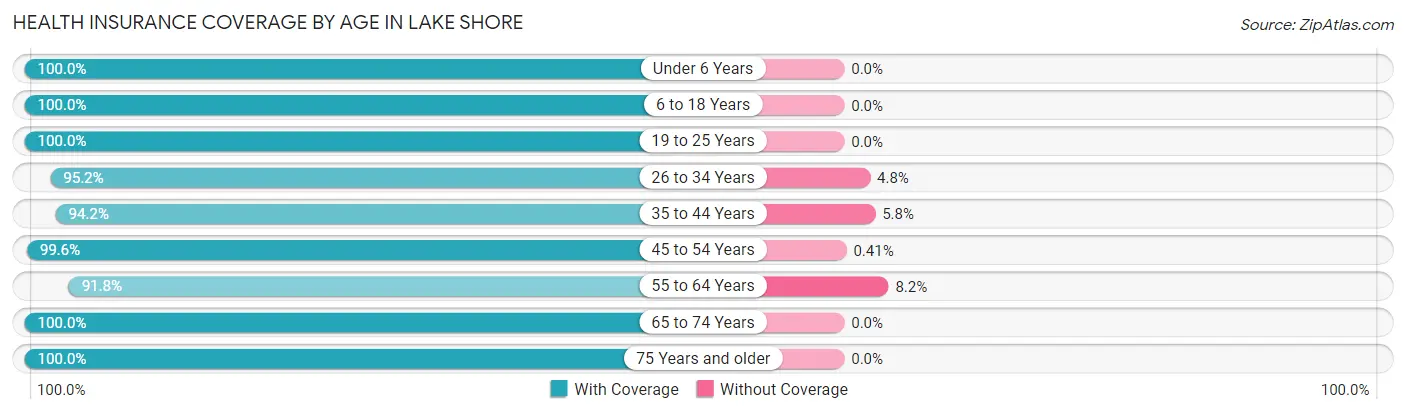
| Age Bracket | With Coverage | Without Coverage |
| Under 6 Years | 263 (100.0%) | 0 (0.0%) |
| 6 to 18 Years | 1,071 (100.0%) | 0 (0.0%) |
| 19 to 25 Years | 369 (100.0%) | 0 (0.0%) |
| 26 to 34 Years | 455 (95.2%) | 23 (4.8%) |
| 35 to 44 Years | 784 (94.2%) | 48 (5.8%) |
| 45 to 54 Years | 1,217 (99.6%) | 5 (0.4%) |
| 55 to 64 Years | 924 (91.8%) | 83 (8.2%) |
| 65 to 74 Years | 858 (100.0%) | 0 (0.0%) |
| 75 Years and older | 487 (100.0%) | 0 (0.0%) |
| Total | 6,428 (97.6%) | 159 (2.4%) |
Health Insurance Coverage by Citizenship Status in Lake Shore
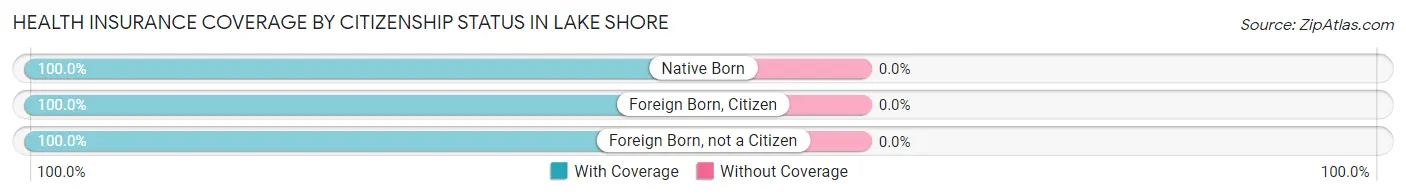
| Citizenship Status | With Coverage | Without Coverage |
| Native Born | 263 (100.0%) | 0 (0.0%) |
| Foreign Born, Citizen | 1,071 (100.0%) | 0 (0.0%) |
| Foreign Born, not a Citizen | 369 (100.0%) | 0 (0.0%) |
Health Insurance Coverage by Household Income in Lake Shore
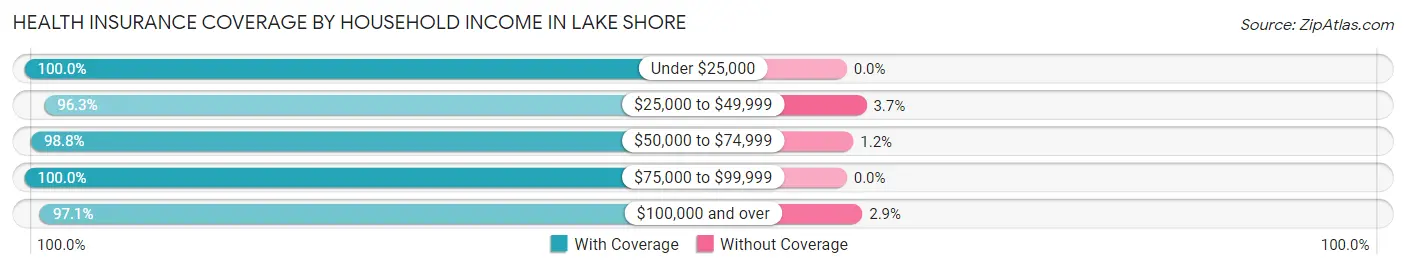
| Household Income | With Coverage | Without Coverage |
| Under $25,000 | 127 (100.0%) | 0 (0.0%) |
| $25,000 to $49,999 | 470 (96.3%) | 18 (3.7%) |
| $50,000 to $74,999 | 722 (98.8%) | 9 (1.2%) |
| $75,000 to $99,999 | 673 (100.0%) | 0 (0.0%) |
| $100,000 and over | 4,419 (97.1%) | 132 (2.9%) |
Public vs Private Health Insurance Coverage by Age in Lake Shore
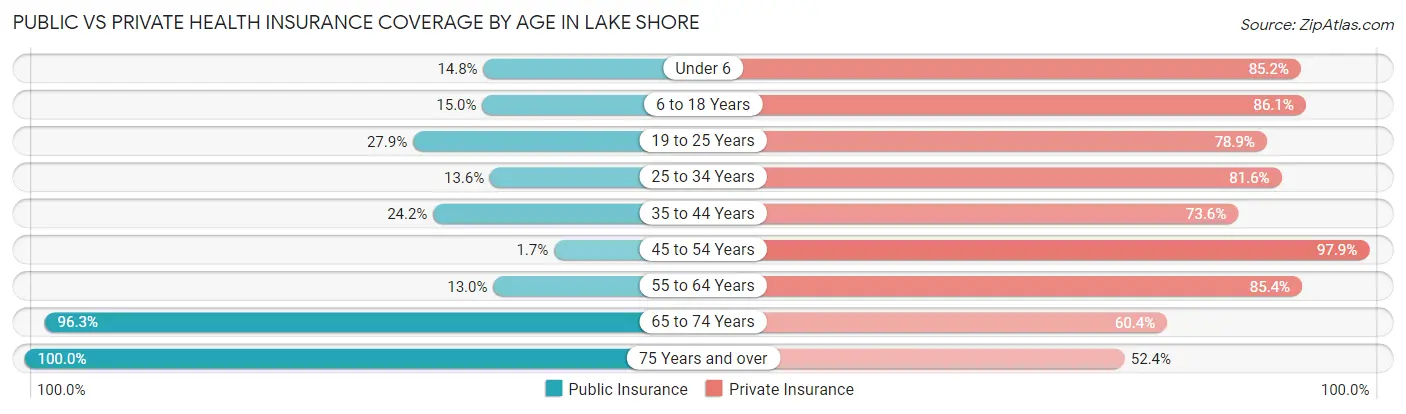
| Age Bracket | Public Insurance | Private Insurance |
| Under 6 | 39 (14.8%) | 224 (85.2%) |
| 6 to 18 Years | 161 (15.0%) | 922 (86.1%) |
| 19 to 25 Years | 103 (27.9%) | 291 (78.9%) |
| 25 to 34 Years | 65 (13.6%) | 390 (81.6%) |
| 35 to 44 Years | 201 (24.2%) | 612 (73.6%) |
| 45 to 54 Years | 21 (1.7%) | 1,196 (97.9%) |
| 55 to 64 Years | 131 (13.0%) | 860 (85.4%) |
| 65 to 74 Years | 826 (96.3%) | 518 (60.4%) |
| 75 Years and over | 487 (100.0%) | 255 (52.4%) |
| Total | 2,034 (30.9%) | 5,268 (80.0%) |
Disability Status by Sex by Age in Lake Shore
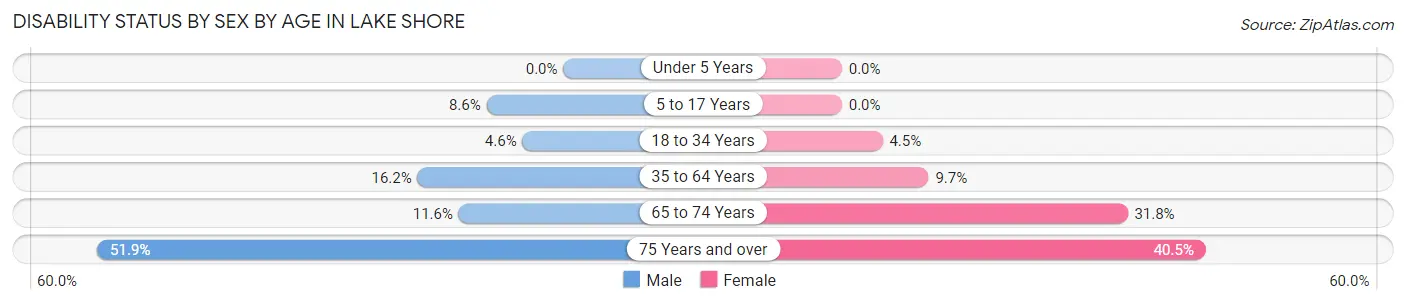
| Age Bracket | Male | Female |
| Under 5 Years | 0 (0.0%) | 0 (0.0%) |
| 5 to 17 Years | 46 (8.6%) | 0 (0.0%) |
| 18 to 34 Years | 21 (4.5%) | 19 (4.5%) |
| 35 to 64 Years | 258 (16.2%) | 142 (9.7%) |
| 65 to 74 Years | 49 (11.6%) | 139 (31.8%) |
| 75 Years and over | 135 (51.9%) | 92 (40.5%) |
Disability Class by Sex by Age in Lake Shore
Disability Class: Hearing Difficulty
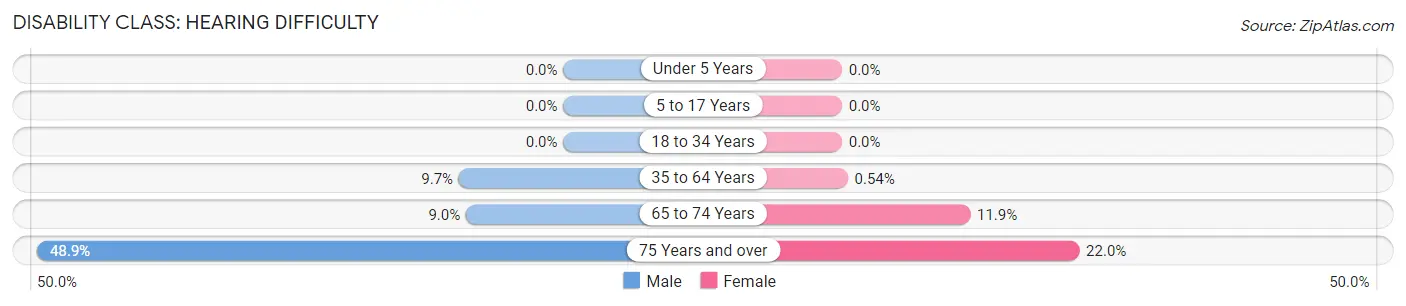
| Age Bracket | Male | Female |
| Under 5 Years | 0 (0.0%) | 0 (0.0%) |
| 5 to 17 Years | 0 (0.0%) | 0 (0.0%) |
| 18 to 34 Years | 0 (0.0%) | 0 (0.0%) |
| 35 to 64 Years | 154 (9.7%) | 8 (0.5%) |
| 65 to 74 Years | 38 (9.0%) | 52 (11.9%) |
| 75 Years and over | 127 (48.8%) | 50 (22.0%) |
Disability Class: Vision Difficulty
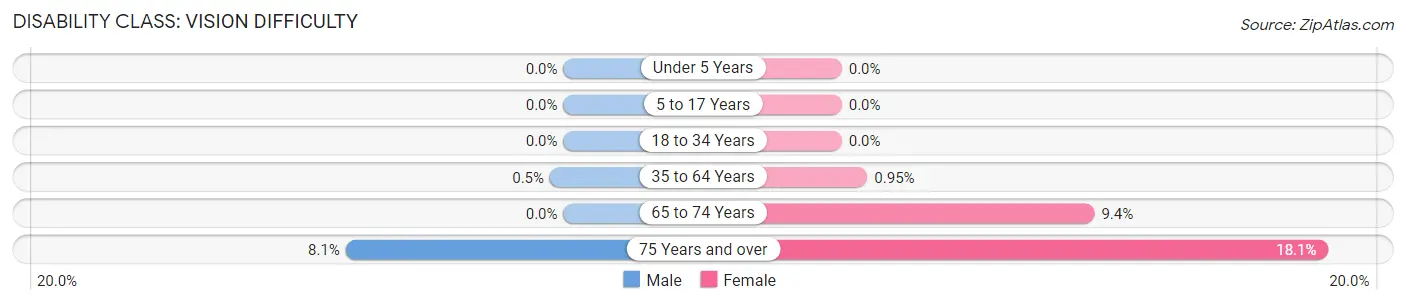
| Age Bracket | Male | Female |
| Under 5 Years | 0 (0.0%) | 0 (0.0%) |
| 5 to 17 Years | 0 (0.0%) | 0 (0.0%) |
| 18 to 34 Years | 0 (0.0%) | 0 (0.0%) |
| 35 to 64 Years | 8 (0.5%) | 14 (0.9%) |
| 65 to 74 Years | 0 (0.0%) | 41 (9.4%) |
| 75 Years and over | 21 (8.1%) | 41 (18.1%) |
Disability Class: Cognitive Difficulty
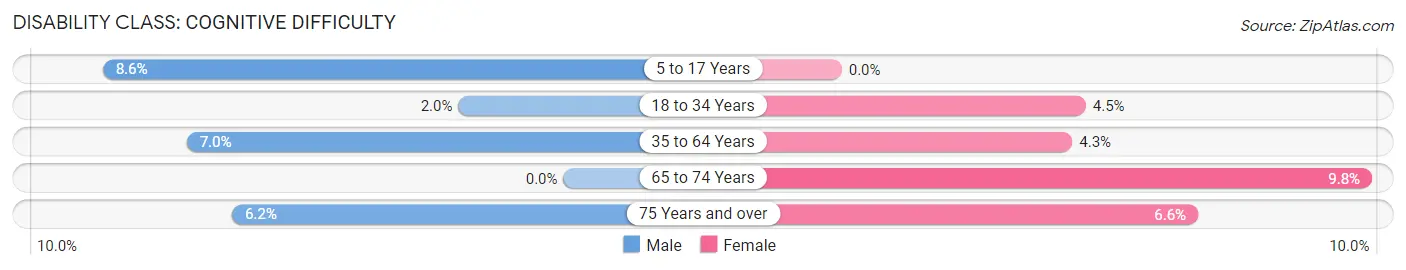
| Age Bracket | Male | Female |
| 5 to 17 Years | 46 (8.6%) | 0 (0.0%) |
| 18 to 34 Years | 9 (1.9%) | 19 (4.5%) |
| 35 to 64 Years | 111 (7.0%) | 63 (4.3%) |
| 65 to 74 Years | 0 (0.0%) | 43 (9.8%) |
| 75 Years and over | 16 (6.1%) | 15 (6.6%) |
Disability Class: Ambulatory Difficulty
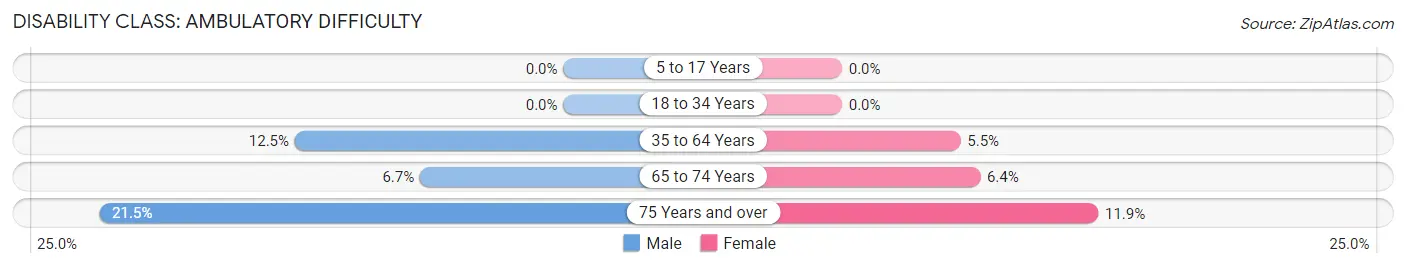
| Age Bracket | Male | Female |
| 5 to 17 Years | 0 (0.0%) | 0 (0.0%) |
| 18 to 34 Years | 0 (0.0%) | 0 (0.0%) |
| 35 to 64 Years | 198 (12.5%) | 81 (5.5%) |
| 65 to 74 Years | 28 (6.7%) | 28 (6.4%) |
| 75 Years and over | 56 (21.5%) | 27 (11.9%) |
Disability Class: Self-Care Difficulty
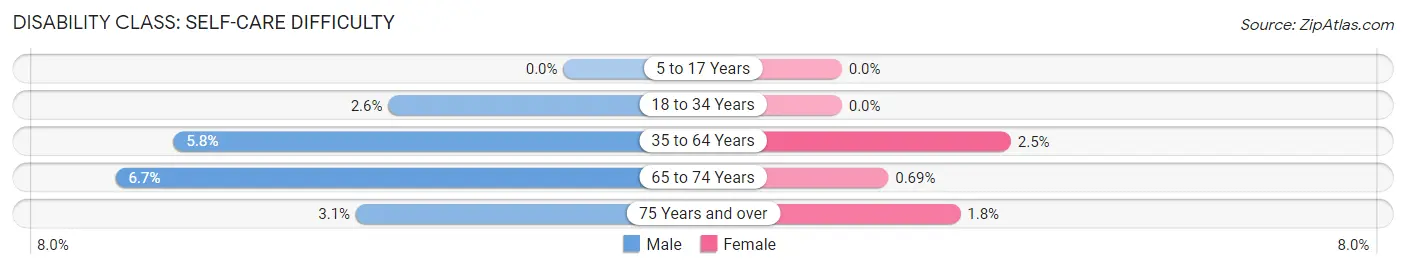
| Age Bracket | Male | Female |
| 5 to 17 Years | 0 (0.0%) | 0 (0.0%) |
| 18 to 34 Years | 12 (2.6%) | 0 (0.0%) |
| 35 to 64 Years | 92 (5.8%) | 37 (2.5%) |
| 65 to 74 Years | 28 (6.7%) | 3 (0.7%) |
| 75 Years and over | 8 (3.1%) | 4 (1.8%) |
Technology Access in Lake Shore
Computing Device Access in Lake Shore
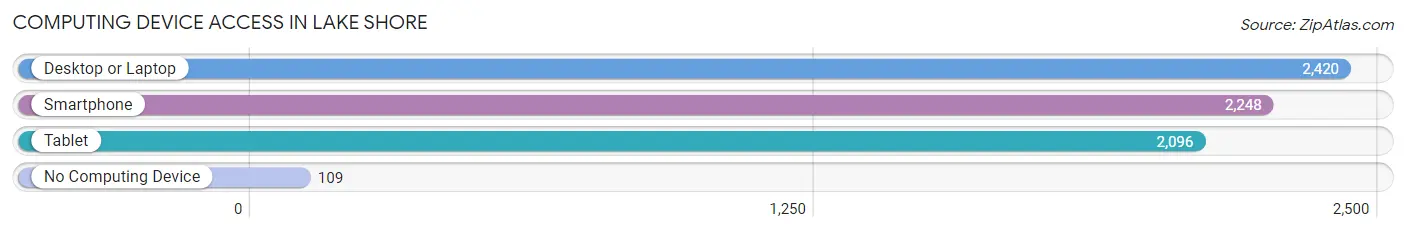
| Device Type | # Households | % Households |
| Desktop or Laptop | 2,420 | 92.2% |
| Smartphone | 2,248 | 85.6% |
| Tablet | 2,096 | 79.8% |
| No Computing Device | 109 | 4.2% |
| Total | 2,626 | 100.0% |
Internet Access in Lake Shore
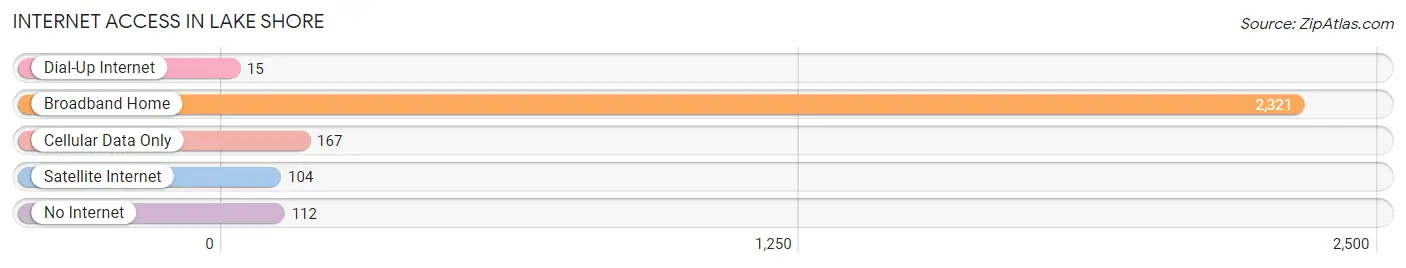
| Internet Type | # Households | % Households |
| Dial-Up Internet | 15 | 0.6% |
| Broadband Home | 2,321 | 88.4% |
| Cellular Data Only | 167 | 6.4% |
| Satellite Internet | 104 | 4.0% |
| No Internet | 112 | 4.3% |
| Total | 2,626 | 100.0% |
Lake Shore Summary
Lake Shore, Washington is a small town located in the northwest corner of the state, just south of the Canadian border. It is situated on the shores of Lake Roosevelt, a large reservoir created by the Grand Coulee Dam. The town has a population of just over 1,000 people and is part of Stevens County.
History
The area around Lake Shore was first inhabited by the Spokane Tribe, who lived in the area for thousands of years before the arrival of European settlers. The first white settlers arrived in the late 1800s, and the town was officially founded in 1902. The town was originally called “Lakeview”, but the name was changed to “Lake Shore” in 1906.
The town was initially a logging and farming community, but the construction of the Grand Coulee Dam in the 1930s changed the area drastically. The dam created Lake Roosevelt, which flooded much of the surrounding land and forced many of the residents to relocate. The town was rebuilt and the population began to grow again.
Geography
Lake Shore is located in the northwest corner of Washington, just south of the Canadian border. It is situated on the shores of Lake Roosevelt, a large reservoir created by the Grand Coulee Dam. The town is surrounded by rolling hills and forests, and is located near the Columbia River.
The climate in Lake Shore is typical of the Pacific Northwest, with mild summers and cold winters. The average annual temperature is around 50 degrees Fahrenheit, and the average annual precipitation is around 20 inches.
Economy
The economy of Lake Shore is largely based on tourism and recreation. The town is a popular destination for fishing, boating, and camping, and there are several resorts and campgrounds in the area. The town is also home to several small businesses, including restaurants, shops, and a marina.
The town is also home to a number of government agencies, including the Bureau of Reclamation, the U.S. Forest Service, and the U.S. Fish and Wildlife Service. These agencies employ a number of people in the area and provide a significant source of income for the town.
Demographics
As of the 2010 census, the population of Lake Shore was 1,072. The racial makeup of the town was 94.3% White, 0.7% African American, 0.7% Native American, 0.7% Asian, 0.2% Pacific Islander, and 2.7% from other races. The median household income was $37,500, and the median age was 44.
The town is served by the Lake Shore School District, which includes an elementary school, a middle school, and a high school. The town is also home to a branch of Spokane Community College.
Conclusion
Lake Shore, Washington is a small town located in the northwest corner of the state, just south of the Canadian border. It is situated on the shores of Lake Roosevelt, a large reservoir created by the Grand Coulee Dam. The town has a population of just over 1,000 people and is part of Stevens County. The economy of Lake Shore is largely based on tourism and recreation, and the town is home to several government agencies. The town is served by the Lake Shore School District, and is home to a branch of Spokane Community College.
Common Questions
What is Per Capita Income in Lake Shore?
Per Capita income in Lake Shore is $54,885.
What is the Median Family Income in Lake Shore?
Median Family Income in Lake Shore is $142,411.
What is the Median Household income in Lake Shore?
Median Household Income in Lake Shore is $130,985.
What is Income or Wage Gap in Lake Shore?
Income or Wage Gap in Lake Shore is 36.9%.
Women in Lake Shore earn 63.1 cents for every dollar earned by a man.
What is Inequality or Gini Index in Lake Shore?
Inequality or Gini Index in Lake Shore is 0.33.
What is the Total Population of Lake Shore?
Total Population of Lake Shore is 6,587.
What is the Total Male Population of Lake Shore?
Total Male Population of Lake Shore is 3,351.
What is the Total Female Population of Lake Shore?
Total Female Population of Lake Shore is 3,236.
What is the Ratio of Males per 100 Females in Lake Shore?
There are 103.55 Males per 100 Females in Lake Shore.
What is the Ratio of Females per 100 Males in Lake Shore?
There are 96.57 Females per 100 Males in Lake Shore.
What is the Median Population Age in Lake Shore?
Median Population Age in Lake Shore is 47.1 Years.
What is the Average Family Size in Lake Shore
Average Family Size in Lake Shore is 2.8 People.
What is the Average Household Size in Lake Shore
Average Household Size in Lake Shore is 2.5 People.
How Large is the Labor Force in Lake Shore?
There are 3,680 People in the Labor Forcein in Lake Shore.
What is the Percentage of People in the Labor Force in Lake Shore?
66.9% of People are in the Labor Force in Lake Shore.
What is the Unemployment Rate in Lake Shore?
Unemployment Rate in Lake Shore is 3.8%.