Cities with the Lowest Poverty Level Among Children Under the Age of 5 in Iowa
RELATED REPORTS & OPTIONS
Lowest Poverty | Child 0-5
Iowa
Compare Cities
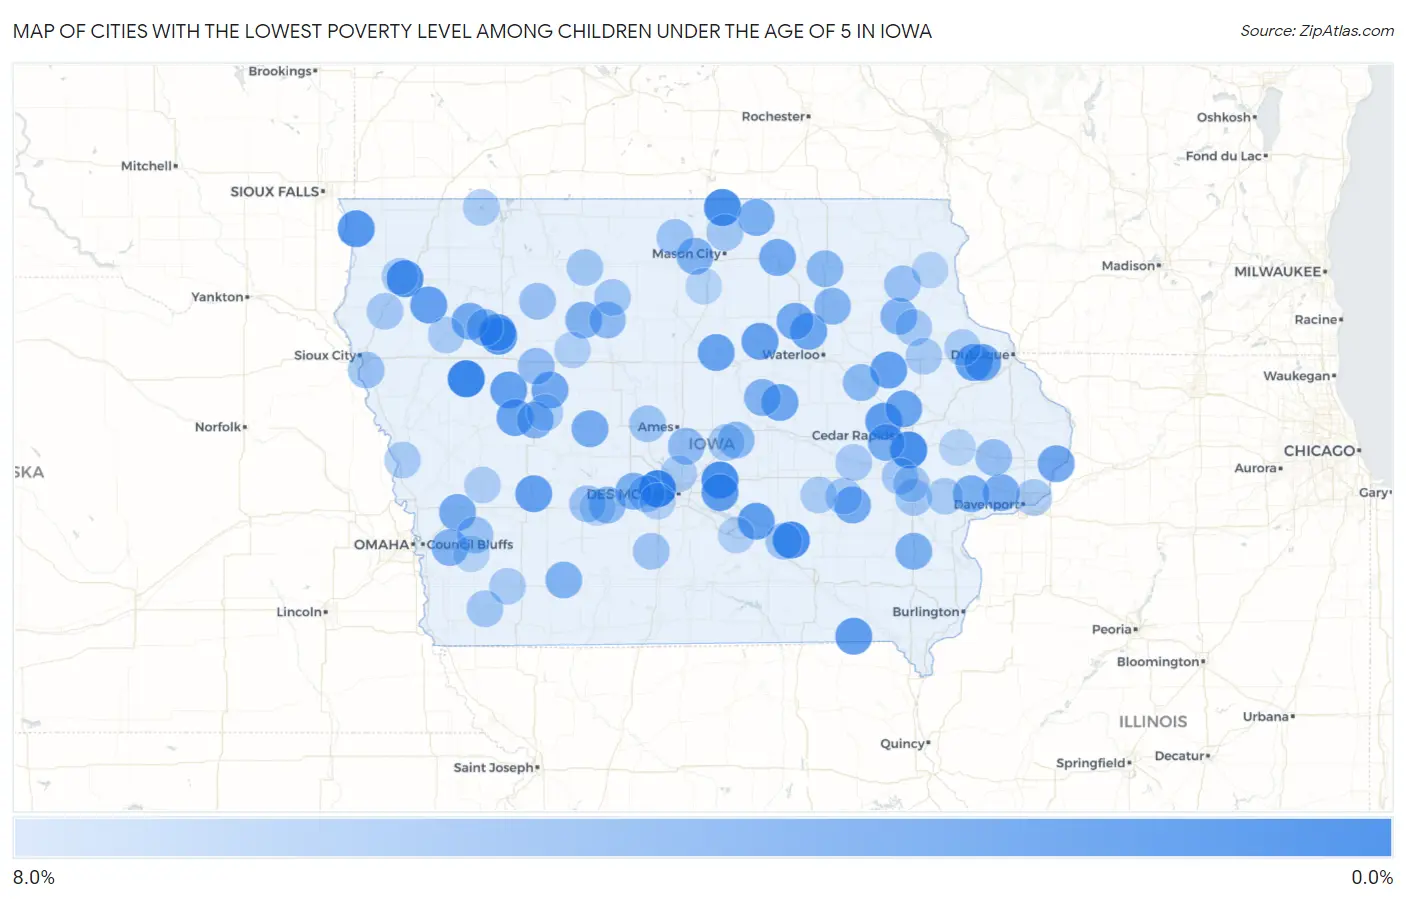
Map of Cities with the Lowest Poverty Level Among Children Under the Age of 5 in Iowa
8.0%
0.0%
Cities with the Lowest Poverty Level Among Children Under the Age of 5 in Iowa
| City | Child Poverty | vs State | vs National | |
| 1. | Clive | 0.70% | 14.3%(-13.6)#1 | 18.1%(-17.4)#48 |
| 2. | Ida Grove | 0.77% | 14.3%(-13.5)#2 | 18.1%(-17.3)#58 |
| 3. | University Park | 1.4% | 14.3%(-12.9)#3 | 18.1%(-16.6)#195 |
| 4. | Colfax | 1.7% | 14.3%(-12.6)#4 | 18.1%(-16.4)#245 |
| 5. | Northwood | 1.8% | 14.3%(-12.5)#5 | 18.1%(-16.3)#275 |
| 6. | Ely | 1.8% | 14.3%(-12.5)#6 | 18.1%(-16.2)#292 |
| 7. | Alton | 2.0% | 14.3%(-12.3)#7 | 18.1%(-16.0)#355 |
| 8. | Inwood | 2.5% | 14.3%(-11.8)#8 | 18.1%(-15.6)#504 |
| 9. | Lakeside | 2.6% | 14.3%(-11.7)#9 | 18.1%(-15.4)#553 |
| 10. | Storm Lake | 2.9% | 14.3%(-11.4)#10 | 18.1%(-15.2)#667 |
| 11. | Palo | 2.9% | 14.3%(-11.4)#11 | 18.1%(-15.1)#685 |
| 12. | Cantril | 2.9% | 14.3%(-11.4)#12 | 18.1%(-15.1)#687 |
| 13. | Prairie City | 3.0% | 14.3%(-11.3)#13 | 18.1%(-15.1)#703 |
| 14. | Pella | 3.0% | 14.3%(-11.3)#14 | 18.1%(-15.0)#714 |
| 15. | Marcus | 3.1% | 14.3%(-11.2)#15 | 18.1%(-14.9)#752 |
| 16. | Wall Lake | 3.1% | 14.3%(-11.2)#16 | 18.1%(-14.9)#757 |
| 17. | Exira | 3.2% | 14.3%(-11.1)#17 | 18.1%(-14.9)#779 |
| 18. | Quasqueton | 3.2% | 14.3%(-11.1)#18 | 18.1%(-14.9)#780 |
| 19. | Farley | 3.2% | 14.3%(-11.1)#19 | 18.1%(-14.9)#786 |
| 20. | Aplington | 3.3% | 14.3%(-11.0)#20 | 18.1%(-14.8)#818 |
| 21. | Iowa Falls | 3.4% | 14.3%(-10.9)#21 | 18.1%(-14.7)#858 |
| 22. | Epworth | 3.5% | 14.3%(-10.8)#22 | 18.1%(-14.6)#910 |
| 23. | Arcadia | 3.5% | 14.3%(-10.8)#23 | 18.1%(-14.5)#930 |
| 24. | Janesville | 3.7% | 14.3%(-10.6)#24 | 18.1%(-14.4)#997 |
| 25. | Alburnett | 3.7% | 14.3%(-10.6)#25 | 18.1%(-14.4)#1,000 |
| 26. | Gladbrook | 3.8% | 14.3%(-10.5)#26 | 18.1%(-14.3)#1,035 |
| 27. | Lake City | 3.9% | 14.3%(-10.4)#27 | 18.1%(-14.1)#1,095 |
| 28. | Camanche | 3.9% | 14.3%(-10.4)#28 | 18.1%(-14.1)#1,102 |
| 29. | Shell Rock | 4.0% | 14.3%(-10.3)#29 | 18.1%(-14.1)#1,121 |
| 30. | Aurelia | 4.2% | 14.3%(-10.1)#30 | 18.1%(-13.9)#1,197 |
| 31. | North English | 4.2% | 14.3%(-10.1)#31 | 18.1%(-13.9)#1,199 |
| 32. | Floyd | 4.2% | 14.3%(-10.1)#32 | 18.1%(-13.9)#1,213 |
| 33. | Jefferson | 4.2% | 14.3%(-10.1)#33 | 18.1%(-13.8)#1,232 |
| 34. | Minden | 4.3% | 14.3%(-10.0)#34 | 18.1%(-13.8)#1,251 |
| 35. | Fairfax | 4.4% | 14.3%(-9.93)#35 | 18.1%(-13.7)#1,280 |
| 36. | Walcott | 4.4% | 14.3%(-9.92)#36 | 18.1%(-13.7)#1,283 |
| 37. | Wilton | 4.4% | 14.3%(-9.88)#37 | 18.1%(-13.6)#1,298 |
| 38. | St Ansgar | 4.4% | 14.3%(-9.86)#38 | 18.1%(-13.6)#1,312 |
| 39. | Adel | 4.6% | 14.3%(-9.73)#39 | 18.1%(-13.5)#1,375 |
| 40. | Crawfordsville | 4.7% | 14.3%(-9.65)#40 | 18.1%(-13.4)#1,403 |
| 41. | Treynor | 4.8% | 14.3%(-9.48)#41 | 18.1%(-13.2)#1,497 |
| 42. | Gilmore City | 4.8% | 14.3%(-9.48)#42 | 18.1%(-13.2)#1,498 |
| 43. | Conrad | 4.8% | 14.3%(-9.46)#43 | 18.1%(-13.2)#1,504 |
| 44. | Carroll | 4.9% | 14.3%(-9.44)#44 | 18.1%(-13.2)#1,509 |
| 45. | Ventura | 4.9% | 14.3%(-9.42)#45 | 18.1%(-13.2)#1,519 |
| 46. | Arlington | 5.0% | 14.3%(-9.30)#46 | 18.1%(-13.1)#1,572 |
| 47. | Prescott | 5.0% | 14.3%(-9.30)#47 | 18.1%(-13.1)#1,576 |
| 48. | Tripoli | 5.1% | 14.3%(-9.24)#48 | 18.1%(-13.0)#1,601 |
| 49. | Alta | 5.2% | 14.3%(-9.10)#49 | 18.1%(-12.9)#1,656 |
| 50. | Melbourne | 5.3% | 14.3%(-9.04)#50 | 18.1%(-12.8)#1,688 |
| 51. | Brandon | 5.3% | 14.3%(-9.04)#51 | 18.1%(-12.8)#1,696 |
| 52. | New Hampton | 5.3% | 14.3%(-9.02)#52 | 18.1%(-12.8)#1,704 |
| 53. | Dexter | 5.4% | 14.3%(-8.94)#53 | 18.1%(-12.7)#1,730 |
| 54. | Cambridge | 5.6% | 14.3%(-8.67)#54 | 18.1%(-12.4)#1,846 |
| 55. | Humboldt | 5.6% | 14.3%(-8.66)#55 | 18.1%(-12.4)#1,849 |
| 56. | Lytton | 5.9% | 14.3%(-8.42)#56 | 18.1%(-12.2)#1,947 |
| 57. | Waukee | 6.0% | 14.3%(-8.26)#57 | 18.1%(-12.0)#1,998 |
| 58. | Wheatland | 6.1% | 14.3%(-8.24)#58 | 18.1%(-12.0)#2,005 |
| 59. | Laurens | 6.2% | 14.3%(-8.15)#59 | 18.1%(-11.9)#2,045 |
| 60. | Oakland | 6.2% | 14.3%(-8.11)#60 | 18.1%(-11.9)#2,062 |
| 61. | Sergeant Bluff | 6.2% | 14.3%(-8.06)#61 | 18.1%(-11.8)#2,078 |
| 62. | Elgin | 6.2% | 14.3%(-8.05)#62 | 18.1%(-11.8)#2,098 |
| 63. | Menlo | 6.2% | 14.3%(-8.05)#63 | 18.1%(-11.8)#2,105 |
| 64. | Boone | 6.4% | 14.3%(-7.92)#64 | 18.1%(-11.7)#2,144 |
| 65. | Forest City | 6.4% | 14.3%(-7.90)#65 | 18.1%(-11.7)#2,156 |
| 66. | Beacon | 6.5% | 14.3%(-7.85)#66 | 18.1%(-11.6)#2,172 |
| 67. | Truro | 6.5% | 14.3%(-7.78)#67 | 18.1%(-11.5)#2,203 |
| 68. | Manly | 6.7% | 14.3%(-7.63)#68 | 18.1%(-11.4)#2,252 |
| 69. | Essex | 6.7% | 14.3%(-7.63)#69 | 18.1%(-11.4)#2,258 |
| 70. | Hills | 6.7% | 14.3%(-7.63)#70 | 18.1%(-11.4)#2,259 |
| 71. | Whittemore | 6.7% | 14.3%(-7.63)#71 | 18.1%(-11.4)#2,263 |
| 72. | Livermore | 6.7% | 14.3%(-7.63)#72 | 18.1%(-11.4)#2,265 |
| 73. | Millersburg | 6.7% | 14.3%(-7.63)#73 | 18.1%(-11.4)#2,276 |
| 74. | Tiffin | 6.7% | 14.3%(-7.58)#74 | 18.1%(-11.3)#2,292 |
| 75. | Le Mars | 6.8% | 14.3%(-7.51)#75 | 18.1%(-11.3)#2,322 |
| 76. | Strawberry Point | 6.8% | 14.3%(-7.48)#76 | 18.1%(-11.2)#2,336 |
| 77. | Rhodes | 6.9% | 14.3%(-7.40)#77 | 18.1%(-11.2)#2,381 |
| 78. | Orange City | 6.9% | 14.3%(-7.39)#78 | 18.1%(-11.2)#2,385 |
| 79. | Manchester | 6.9% | 14.3%(-7.38)#79 | 18.1%(-11.1)#2,388 |
| 80. | University Heights | 7.0% | 14.3%(-7.34)#80 | 18.1%(-11.1)#2,403 |
| 81. | Bettendorf | 7.0% | 14.3%(-7.33)#81 | 18.1%(-11.1)#2,408 |
| 82. | Marengo | 7.0% | 14.3%(-7.26)#82 | 18.1%(-11.0)#2,438 |
| 83. | Stanton | 7.1% | 14.3%(-7.16)#83 | 18.1%(-10.9)#2,490 |
| 84. | New Vienna | 7.1% | 14.3%(-7.16)#84 | 18.1%(-10.9)#2,494 |
| 85. | Quimby | 7.1% | 14.3%(-7.16)#85 | 18.1%(-10.9)#2,495 |
| 86. | Deep River | 7.1% | 14.3%(-7.16)#86 | 18.1%(-10.9)#2,496 |
| 87. | Little Sioux | 7.1% | 14.3%(-7.16)#87 | 18.1%(-10.9)#2,498 |
| 88. | Lidderdale | 7.1% | 14.3%(-7.16)#88 | 18.1%(-10.9)#2,499 |
| 89. | West Liberty | 7.2% | 14.3%(-7.12)#89 | 18.1%(-10.9)#2,511 |
| 90. | Ankeny | 7.2% | 14.3%(-7.07)#90 | 18.1%(-10.8)#2,521 |
| 91. | Lake Park | 7.2% | 14.3%(-7.05)#91 | 18.1%(-10.8)#2,529 |
| 92. | Harlan | 7.4% | 14.3%(-6.94)#92 | 18.1%(-10.7)#2,578 |
| 93. | Manson | 7.4% | 14.3%(-6.85)#93 | 18.1%(-10.6)#2,612 |
| 94. | Knoxville | 7.5% | 14.3%(-6.84)#94 | 18.1%(-10.6)#2,616 |
| 95. | West Des Moines | 7.5% | 14.3%(-6.80)#95 | 18.1%(-10.6)#2,631 |
| 96. | Monona | 7.7% | 14.3%(-6.61)#96 | 18.1%(-10.4)#2,708 |
| 97. | Stanwood | 7.7% | 14.3%(-6.61)#97 | 18.1%(-10.4)#2,718 |
| 98. | Thornton | 7.7% | 14.3%(-6.61)#98 | 18.1%(-10.4)#2,723 |
| 99. | Macedonia | 7.7% | 14.3%(-6.61)#99 | 18.1%(-10.4)#2,729 |
| 100. | Stuart | 7.8% | 14.3%(-6.52)#100 | 18.1%(-10.3)#2,753 |
Common Questions
What are the Top 10 Cities with the Lowest Poverty Level Among Children Under the Age of 5 in Iowa?
Top 10 Cities with the Lowest Poverty Level Among Children Under the Age of 5 in Iowa are:
#1
0.70%
#2
0.77%
#3
1.4%
#4
1.7%
#5
1.8%
#6
1.8%
#7
2.0%
#8
2.5%
#9
2.6%
#10
2.9%
What city has the Lowest Poverty Level Among Children Under the Age of 5 in Iowa?
Clive has the Lowest Poverty Level Among Children Under the Age of 5 in Iowa with 0.70%.
What is the Poverty Level Among Children Under the Age of 5 in the State of Iowa?
Poverty Level Among Children Under the Age of 5 in Iowa is 14.3%.
What is the Poverty Level Among Children Under the Age of 5 in the United States?
Poverty Level Among Children Under the Age of 5 in the United States is 18.1%.