Grand Mound, WA Map & Demographics
Grand Mound Map
Grand Mound Overview
$28,479
PER CAPITA INCOME
$80,406
AVG FAMILY INCOME
$59,695
AVG HOUSEHOLD INCOME
10.3%
WAGE / INCOME GAP [ % ]
89.7¢/ $1
WAGE / INCOME GAP [ $ ]
0.29
INEQUALITY / GINI INDEX
3,442
TOTAL POPULATION
1,449
MALE POPULATION
1,993
FEMALE POPULATION
72.70
MALES / 100 FEMALES
137.54
FEMALES / 100 MALES
33.5
MEDIAN AGE
3.3
AVG FAMILY SIZE
2.6
AVG HOUSEHOLD SIZE
1,577
LABOR FORCE [ PEOPLE ]
59.9%
PERCENT IN LABOR FORCE
5.1%
UNEMPLOYMENT RATE
Income in Grand Mound
Income Overview in Grand Mound
Per Capita Income in Grand Mound is $28,479, while median incomes of families and households are $80,406 and $59,695 respectively.
| Characteristic | Number | Measure |
| Per Capita Income | 3,442 | $28,479 |
| Median Family Income | 836 | $80,406 |
| Mean Family Income | 836 | $77,749 |
| Median Household Income | 1,313 | $59,695 |
| Mean Household Income | 1,313 | $72,191 |
| Income Deficit | 836 | $0 |
| Wage / Income Gap (%) | 3,442 | 10.28% |
| Wage / Income Gap ($) | 3,442 | 89.72¢ per $1 |
| Gini / Inequality Index | 3,442 | 0.29 |
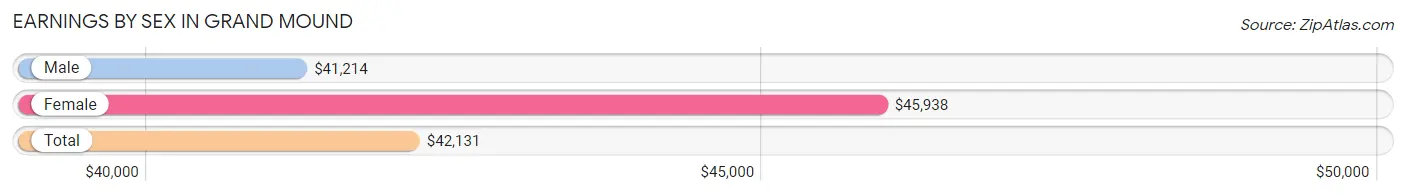
Earnings by Sex in Grand Mound
Average Earnings in Grand Mound are $42,131, $41,214 for men and $45,938 for women, a difference of 10.3%.
| Sex | Number | Average Earnings |
| Male | 724 (45.8%) | $41,214 |
| Female | 856 (54.2%) | $45,938 |
| Total | 1,580 (100.0%) | $42,131 |
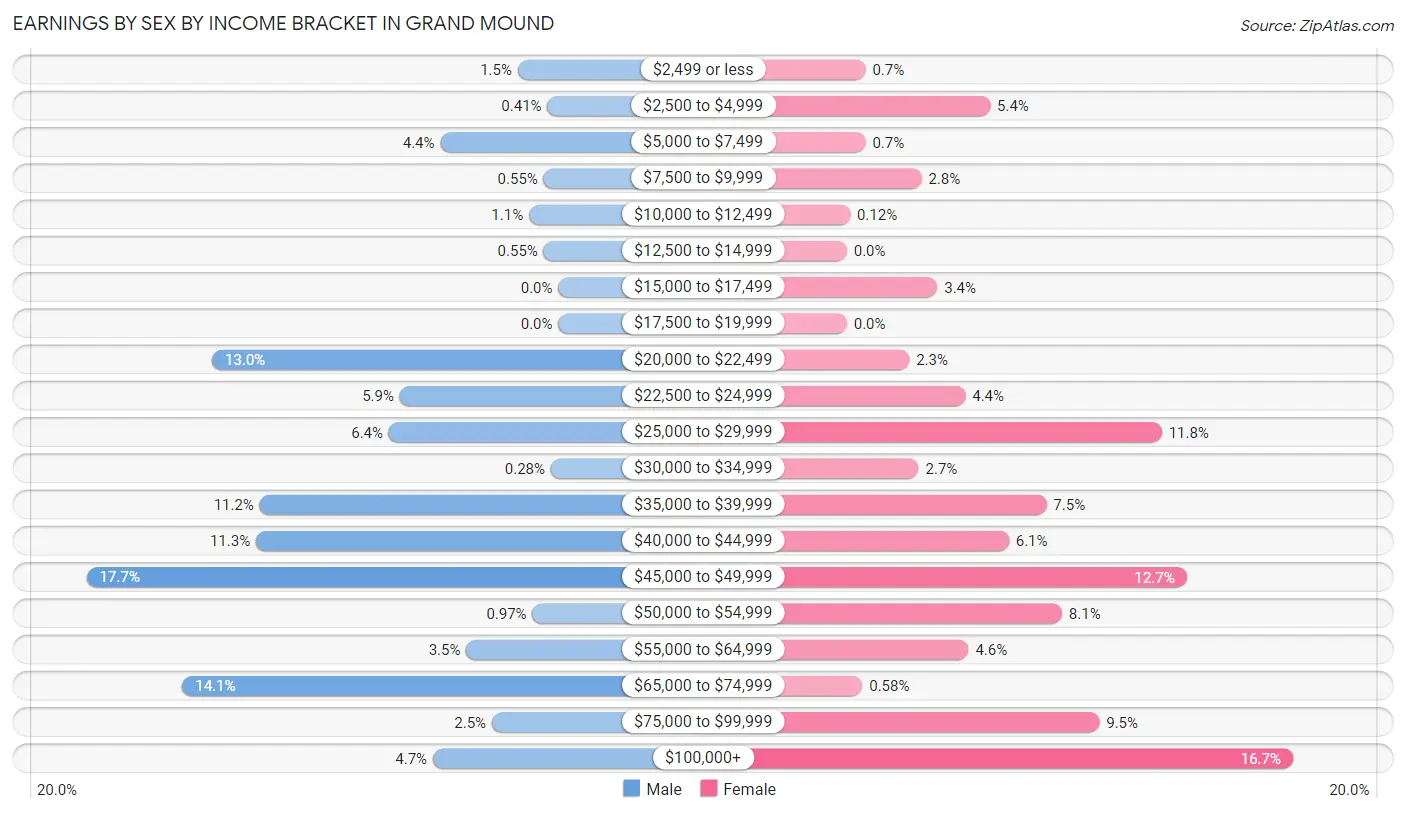
Earnings by Sex by Income Bracket in Grand Mound
The most common earnings brackets in Grand Mound are $45,000 to $49,999 for men (128 | 17.7%) and $100,000+ for women (143 | 16.7%).
| Income | Male | Female |
| $2,499 or less | 11 (1.5%) | 6 (0.7%) |
| $2,500 to $4,999 | 3 (0.4%) | 46 (5.4%) |
| $5,000 to $7,499 | 32 (4.4%) | 6 (0.7%) |
| $7,500 to $9,999 | 4 (0.5%) | 24 (2.8%) |
| $10,000 to $12,499 | 8 (1.1%) | 1 (0.1%) |
| $12,500 to $14,999 | 4 (0.5%) | 0 (0.0%) |
| $15,000 to $17,499 | 0 (0.0%) | 29 (3.4%) |
| $17,500 to $19,999 | 0 (0.0%) | 0 (0.0%) |
| $20,000 to $22,499 | 94 (13.0%) | 20 (2.3%) |
| $22,500 to $24,999 | 43 (5.9%) | 38 (4.4%) |
| $25,000 to $29,999 | 46 (6.4%) | 101 (11.8%) |
| $30,000 to $34,999 | 2 (0.3%) | 23 (2.7%) |
| $35,000 to $39,999 | 81 (11.2%) | 64 (7.5%) |
| $40,000 to $44,999 | 82 (11.3%) | 52 (6.1%) |
| $45,000 to $49,999 | 128 (17.7%) | 109 (12.7%) |
| $50,000 to $54,999 | 7 (1.0%) | 69 (8.1%) |
| $55,000 to $64,999 | 25 (3.5%) | 39 (4.6%) |
| $65,000 to $74,999 | 102 (14.1%) | 5 (0.6%) |
| $75,000 to $99,999 | 18 (2.5%) | 81 (9.5%) |
| $100,000+ | 34 (4.7%) | 143 (16.7%) |
| Total | 724 (100.0%) | 856 (100.0%) |
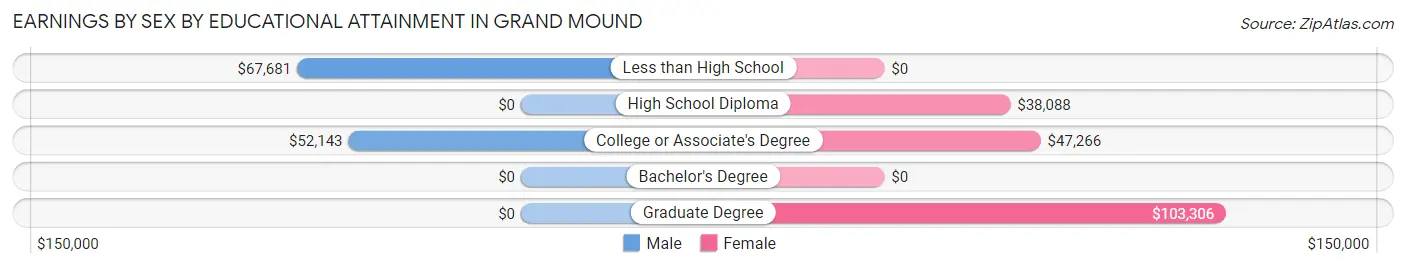
Earnings by Sex by Educational Attainment in Grand Mound
Average earnings in Grand Mound are $43,021 for men and $46,458 for women, a difference of 7.4%. Men with an educational attainment of less than high school enjoy the highest average annual earnings of $67,681, while those with college or associate's degree education earn the least with $52,143. Women with an educational attainment of graduate degree earn the most with the average annual earnings of $103,306, while those with high school diploma education have the smallest earnings of $38,088.
| Educational Attainment | Male Income | Female Income |
| Less than High School | $67,681 | $0 |
| High School Diploma | - | - |
| College or Associate's Degree | $52,143 | $47,266 |
| Bachelor's Degree | - | - |
| Graduate Degree | - | - |
| Total | $43,021 | $46,458 |
Family Income in Grand Mound
Family Income Brackets in Grand Mound
According to the Grand Mound family income data, there are 238 families falling into the $100,000 to $149,999 income range, which is the most common income bracket and makes up 28.5% of all families.
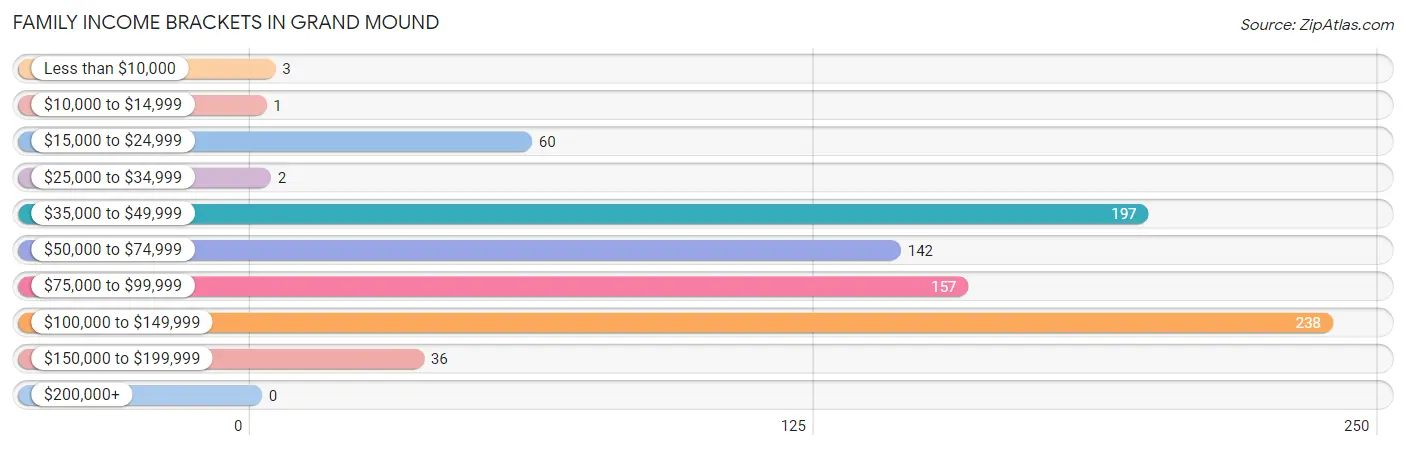
| Income Bracket | # Families | % Families |
| Less than $10,000 | 3 | 0.4% |
| $10,000 to $14,999 | 1 | 0.1% |
| $15,000 to $24,999 | 60 | 7.2% |
| $25,000 to $34,999 | 2 | 0.2% |
| $35,000 to $49,999 | 197 | 23.6% |
| $50,000 to $74,999 | 142 | 17.0% |
| $75,000 to $99,999 | 157 | 18.8% |
| $100,000 to $149,999 | 238 | 28.5% |
| $150,000 to $199,999 | 36 | 4.3% |
| $200,000+ | 0 | 0.0% |
Family Income by Famaliy Size in Grand Mound
6-person families (29 | 3.5%) account for the highest median family income in Grand Mound with $107,734 per family, while 3-person families (269 | 32.2%) have the highest median income of $35,054 per family member.
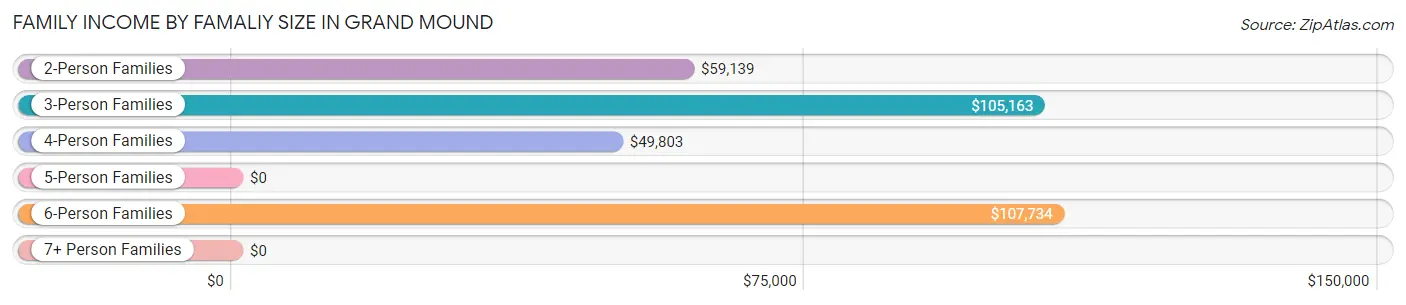
| Income Bracket | # Families | Median Income |
| 2-Person Families | 291 (34.8%) | $59,139 |
| 3-Person Families | 269 (32.2%) | $105,163 |
| 4-Person Families | 72 (8.6%) | $49,803 |
| 5-Person Families | 156 (18.7%) | $0 |
| 6-Person Families | 29 (3.5%) | $107,734 |
| 7+ Person Families | 19 (2.3%) | $0 |
| Total | 836 (100.0%) | $80,406 |
Family Income by Number of Earners in Grand Mound
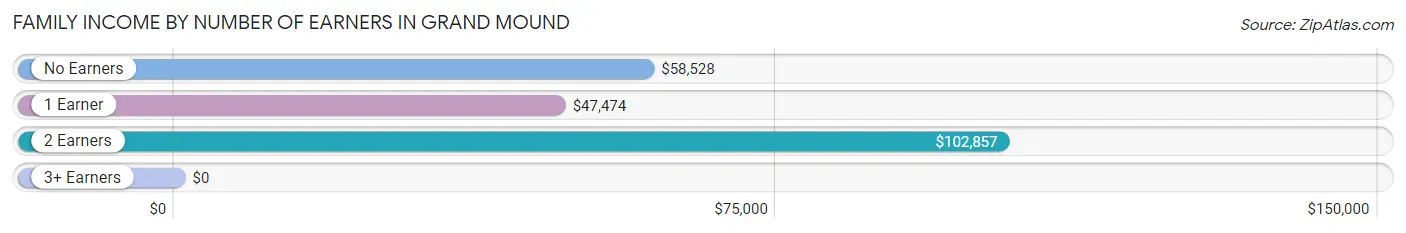
| Number of Earners | # Families | Median Income |
| No Earners | 163 (19.5%) | $58,528 |
| 1 Earner | 375 (44.9%) | $47,474 |
| 2 Earners | 270 (32.3%) | $102,857 |
| 3+ Earners | 28 (3.4%) | $0 |
| Total | 836 (100.0%) | $80,406 |
Household Income in Grand Mound
Household Income Brackets in Grand Mound
With 277 households falling in the category, the $100,000 to $149,999 income range is the most frequent in Grand Mound, accounting for 21.1% of all households.
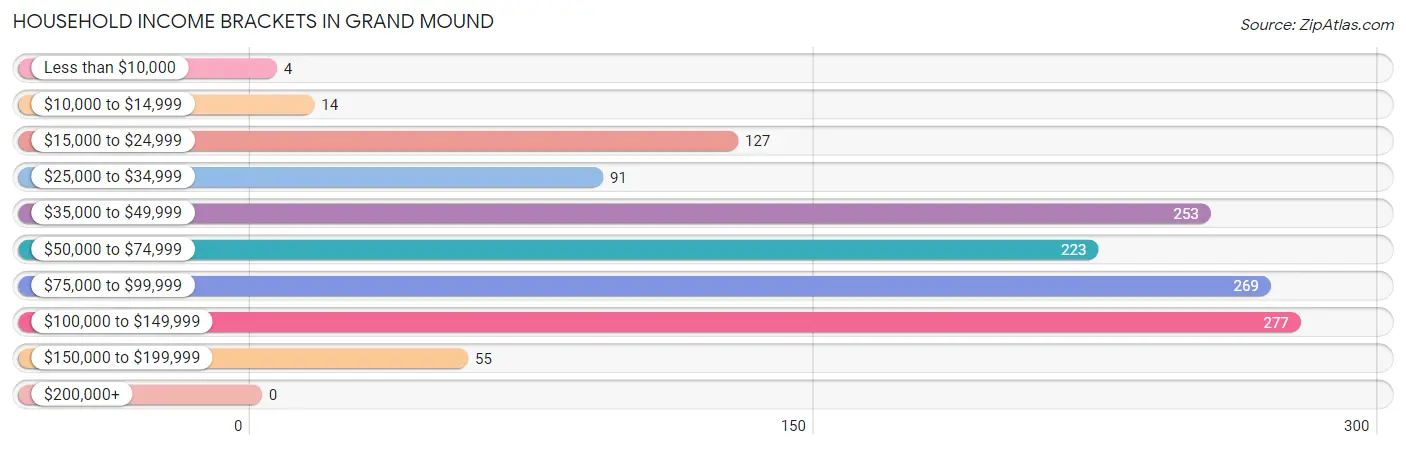
| Income Bracket | # Households | % Households |
| Less than $10,000 | 4 | 0.3% |
| $10,000 to $14,999 | 14 | 1.1% |
| $15,000 to $24,999 | 127 | 9.7% |
| $25,000 to $34,999 | 91 | 6.9% |
| $35,000 to $49,999 | 253 | 19.3% |
| $50,000 to $74,999 | 223 | 17.0% |
| $75,000 to $99,999 | 269 | 20.5% |
| $100,000 to $149,999 | 277 | 21.1% |
| $150,000 to $199,999 | 55 | 4.2% |
| $200,000+ | 0 | 0.0% |
Household Income by Householder Age in Grand Mound
The median household income in Grand Mound is $59,695, with the highest median household income of $90,553 found in the 25 to 44 years age bracket for the primary householder. A total of 661 households (50.3%) fall into this category.
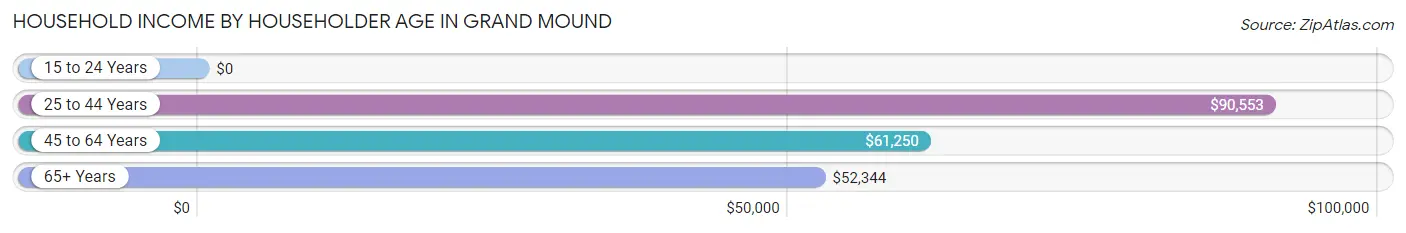
| Income Bracket | # Households | Median Income |
| 15 to 24 Years | 0 (0.0%) | $0 |
| 25 to 44 Years | 661 (50.3%) | $90,553 |
| 45 to 64 Years | 368 (28.0%) | $61,250 |
| 65+ Years | 284 (21.6%) | $52,344 |
| Total | 1,313 (100.0%) | $59,695 |
Poverty in Grand Mound
Income Below Poverty by Sex and Age in Grand Mound
With 9.8% poverty level for males and 7.5% for females among the residents of Grand Mound, 16 and 17 year old males and 55 to 64 year old females are the most vulnerable to poverty, with 34 males (32.7%) and 56 females (26.1%) in their respective age groups living below the poverty level.
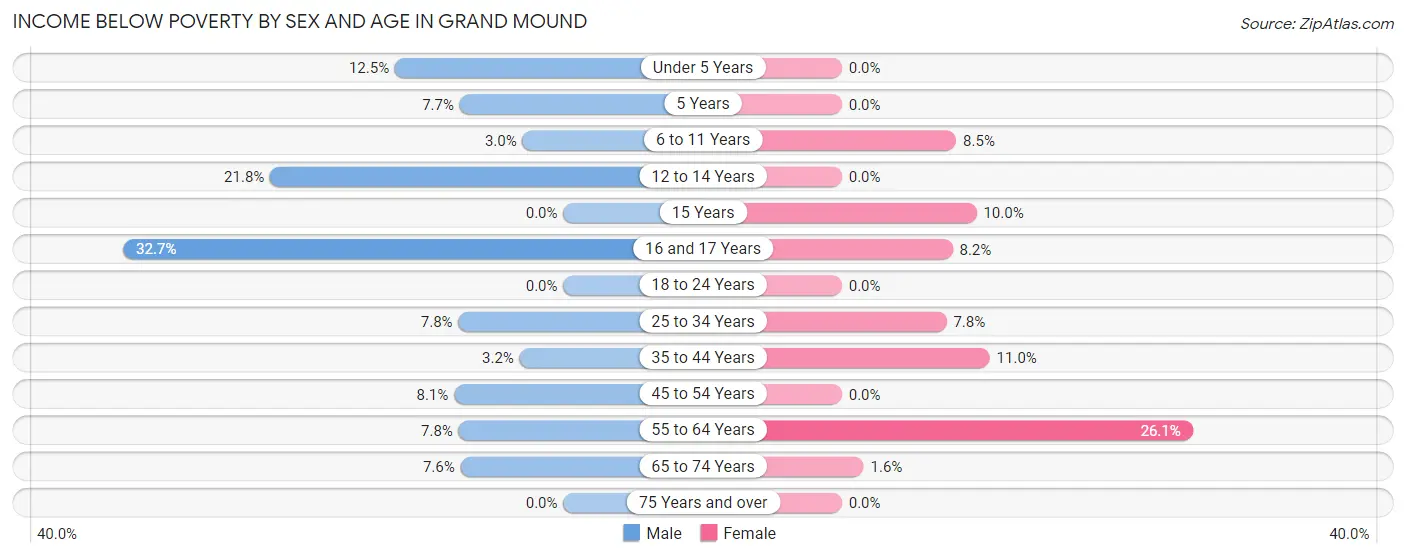
| Age Bracket | Male | Female |
| Under 5 Years | 12 (12.5%) | 0 (0.0%) |
| 5 Years | 1 (7.7%) | 0 (0.0%) |
| 6 to 11 Years | 2 (3.0%) | 9 (8.5%) |
| 12 to 14 Years | 27 (21.8%) | 0 (0.0%) |
| 15 Years | 0 (0.0%) | 1 (10.0%) |
| 16 and 17 Years | 34 (32.7%) | 6 (8.2%) |
| 18 to 24 Years | 0 (0.0%) | 0 (0.0%) |
| 25 to 34 Years | 31 (7.8%) | 29 (7.8%) |
| 35 to 44 Years | 6 (3.2%) | 45 (11.0%) |
| 45 to 54 Years | 3 (8.1%) | 0 (0.0%) |
| 55 to 64 Years | 16 (7.8%) | 56 (26.1%) |
| 65 to 74 Years | 10 (7.6%) | 4 (1.6%) |
| 75 Years and over | 0 (0.0%) | 0 (0.0%) |
| Total | 142 (9.8%) | 150 (7.5%) |
Income Above Poverty by Sex and Age in Grand Mound
According to the poverty statistics in Grand Mound, males aged 18 to 24 years and females aged under 5 years are the age groups that are most secure financially, with 100.0% of males and 100.0% of females in these age groups living above the poverty line.
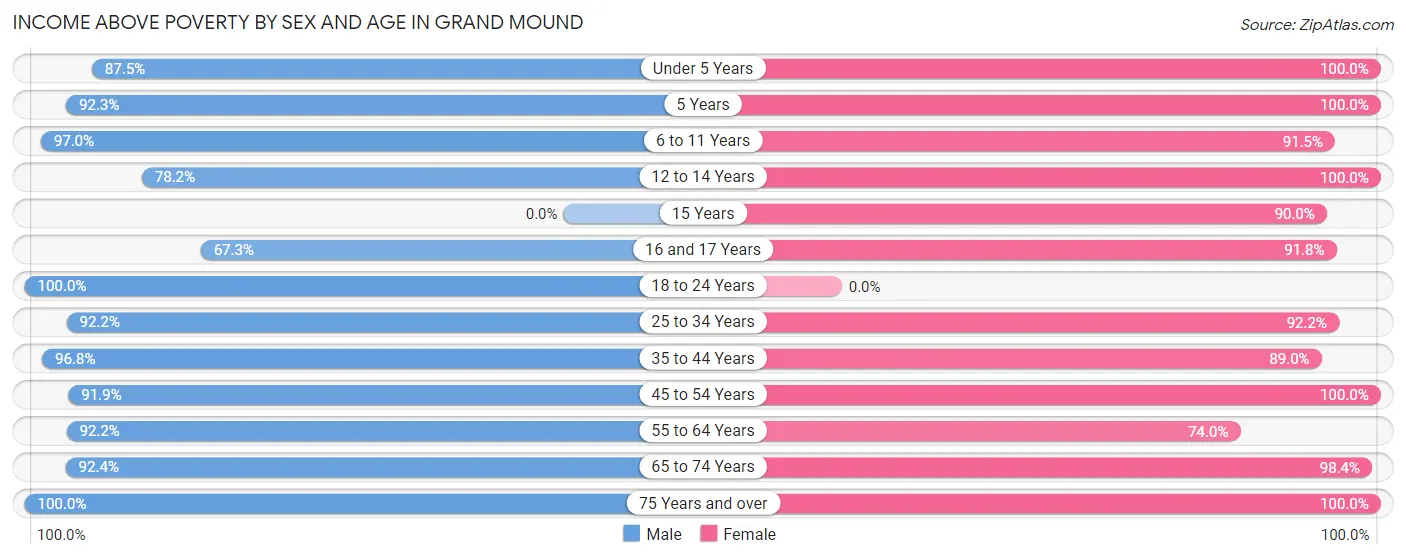
| Age Bracket | Male | Female |
| Under 5 Years | 84 (87.5%) | 225 (100.0%) |
| 5 Years | 12 (92.3%) | 72 (100.0%) |
| 6 to 11 Years | 64 (97.0%) | 97 (91.5%) |
| 12 to 14 Years | 97 (78.2%) | 97 (100.0%) |
| 15 Years | 0 (0.0%) | 9 (90.0%) |
| 16 and 17 Years | 70 (67.3%) | 67 (91.8%) |
| 18 to 24 Years | 68 (100.0%) | 0 (0.0%) |
| 25 to 34 Years | 367 (92.2%) | 344 (92.2%) |
| 35 to 44 Years | 179 (96.8%) | 365 (89.0%) |
| 45 to 54 Years | 34 (91.9%) | 147 (100.0%) |
| 55 to 64 Years | 190 (92.2%) | 159 (74.0%) |
| 65 to 74 Years | 121 (92.4%) | 243 (98.4%) |
| 75 Years and over | 21 (100.0%) | 18 (100.0%) |
| Total | 1,307 (90.2%) | 1,843 (92.5%) |
Income Below Poverty Among Married-Couple Families in Grand Mound
The poverty statistics for married-couple families in Grand Mound show that 3.4% or 22 of the total 645 families live below the poverty line. Families with no children have the highest poverty rate of 7.0%, comprising of 16 families. On the other hand, families with 1 or 2 children have the lowest poverty rate of 0.0%, which includes 0 families.
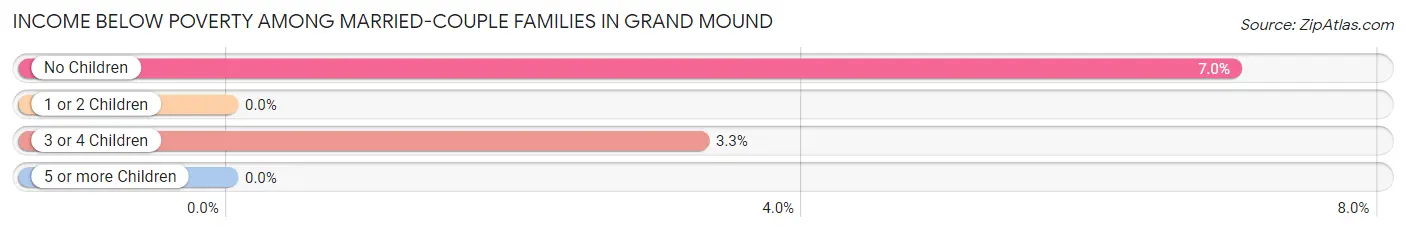
| Children | Above Poverty | Below Poverty |
| No Children | 213 (93.0%) | 16 (7.0%) |
| 1 or 2 Children | 233 (100.0%) | 0 (0.0%) |
| 3 or 4 Children | 177 (96.7%) | 6 (3.3%) |
| 5 or more Children | 0 (0.0%) | 0 (0.0%) |
| Total | 623 (96.6%) | 22 (3.4%) |
Income Below Poverty Among Single-Parent Households in Grand Mound
According to the poverty data in Grand Mound, 60.0% or 3 single-father households and 21.0% or 39 single-mother households are living below the poverty line. Among single-father households, those with 1 or 2 children have the highest poverty rate, with 3 households (60.0%) experiencing poverty. Likewise, among single-mother households, those with 5 or more children have the highest poverty rate, with 1 households (100.0%) falling below the poverty line.
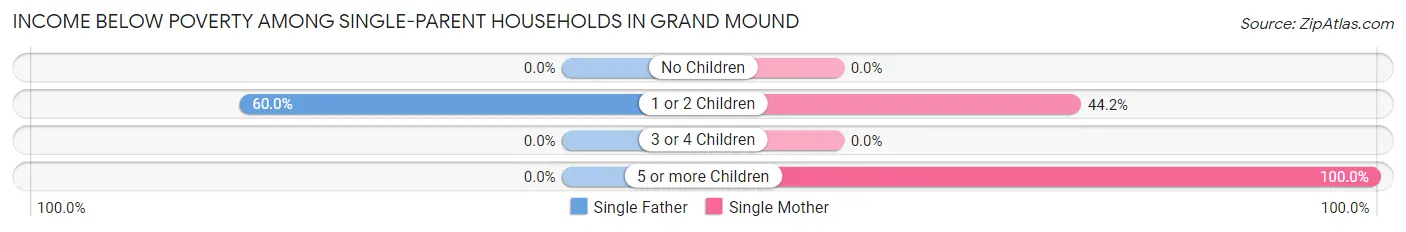
| Children | Single Father | Single Mother |
| No Children | 0 (0.0%) | 0 (0.0%) |
| 1 or 2 Children | 3 (60.0%) | 38 (44.2%) |
| 3 or 4 Children | 0 (0.0%) | 0 (0.0%) |
| 5 or more Children | 0 (0.0%) | 1 (100.0%) |
| Total | 3 (60.0%) | 39 (21.0%) |
Income Below Poverty Among Married-Couple vs Single-Parent Households in Grand Mound
The poverty data for Grand Mound shows that 22 of the married-couple family households (3.4%) and 42 of the single-parent households (22.0%) are living below the poverty level. Within the married-couple family households, those with no children have the highest poverty rate, with 16 households (7.0%) falling below the poverty line. Among the single-parent households, those with 5 or more children have the highest poverty rate, with 1 household (100.0%) living below poverty.
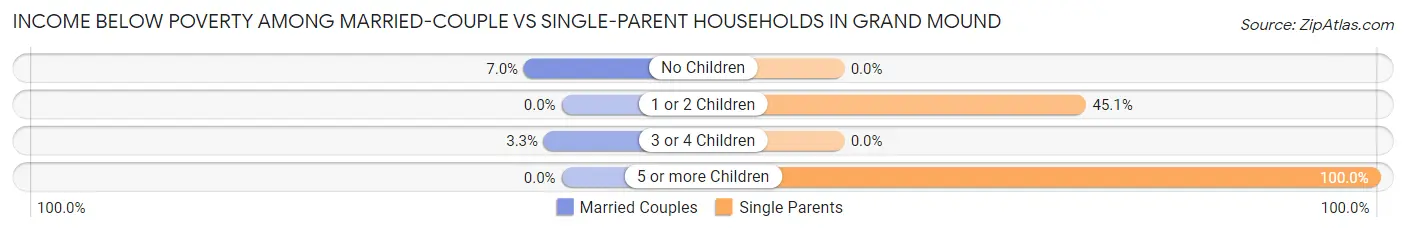
| Children | Married-Couple Families | Single-Parent Households |
| No Children | 16 (7.0%) | 0 (0.0%) |
| 1 or 2 Children | 0 (0.0%) | 41 (45.1%) |
| 3 or 4 Children | 6 (3.3%) | 0 (0.0%) |
| 5 or more Children | 0 (0.0%) | 1 (100.0%) |
| Total | 22 (3.4%) | 42 (22.0%) |
Race in Grand Mound
The most populous races in Grand Mound are White / Caucasian (2,331 | 67.7%), Hispanic or Latino (812 | 23.6%), and Two or more Races (496 | 14.4%).
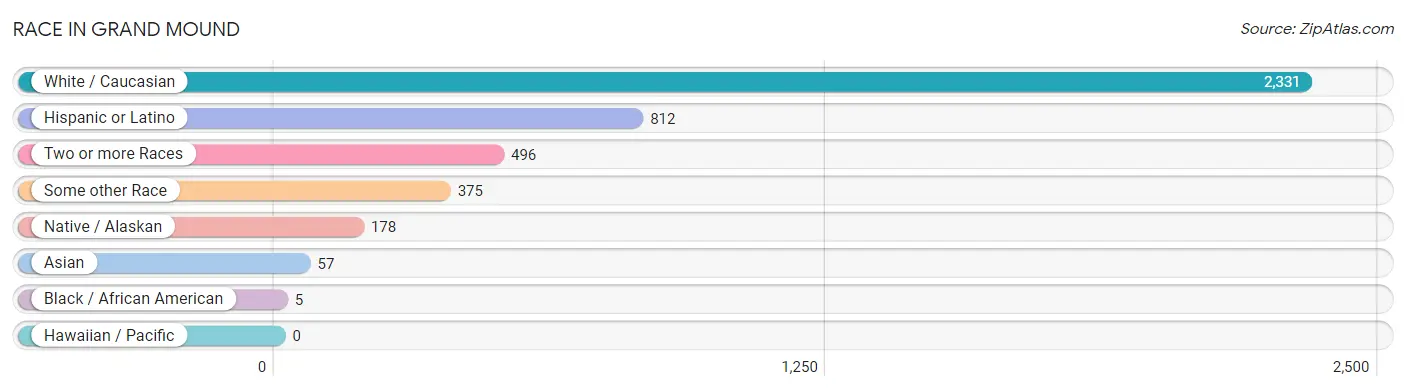
| Race | # Population | % Population |
| Asian | 57 | 1.7% |
| Black / African American | 5 | 0.2% |
| Hawaiian / Pacific | 0 | 0.0% |
| Hispanic or Latino | 812 | 23.6% |
| Native / Alaskan | 178 | 5.2% |
| White / Caucasian | 2,331 | 67.7% |
| Two or more Races | 496 | 14.4% |
| Some other Race | 375 | 10.9% |
| Total | 3,442 | 100.0% |
Ancestry in Grand Mound
The most populous ancestries reported in Grand Mound are Mexican (784 | 22.8%), German (562 | 16.3%), Irish (393 | 11.4%), Finnish (205 | 6.0%), and Norwegian (149 | 4.3%), together accounting for 60.8% of all Grand Mound residents.
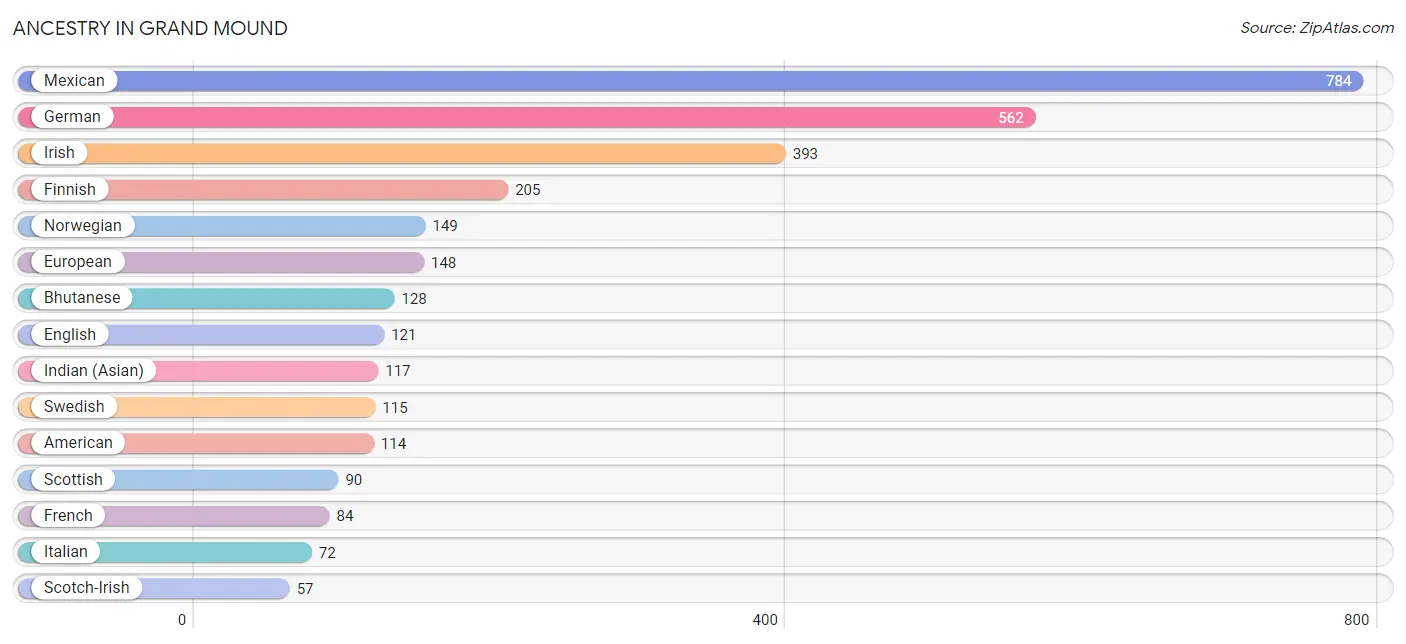
| Ancestry | # Population | % Population |
| African | 5 | 0.2% |
| Aleut | 6 | 0.2% |
| American | 114 | 3.3% |
| Bhutanese | 128 | 3.7% |
| British | 5 | 0.2% |
| Central American | 26 | 0.8% |
| Croatian | 12 | 0.4% |
| Dutch | 12 | 0.4% |
| English | 121 | 3.5% |
| European | 148 | 4.3% |
| Finnish | 205 | 6.0% |
| French | 84 | 2.4% |
| French Canadian | 5 | 0.2% |
| German | 562 | 16.3% |
| Indian (Asian) | 117 | 3.4% |
| Irish | 393 | 11.4% |
| Italian | 72 | 2.1% |
| Malaysian | 28 | 0.8% |
| Mexican | 784 | 22.8% |
| Northern European | 7 | 0.2% |
| Norwegian | 149 | 4.3% |
| Pennsylvania German | 10 | 0.3% |
| Polish | 28 | 0.8% |
| Portuguese | 14 | 0.4% |
| Puget Sound Salish | 34 | 1.0% |
| Russian | 6 | 0.2% |
| Salvadoran | 26 | 0.8% |
| Scandinavian | 45 | 1.3% |
| Scotch-Irish | 57 | 1.7% |
| Scottish | 90 | 2.6% |
| Sri Lankan | 19 | 0.5% |
| Subsaharan African | 5 | 0.2% |
| Swedish | 115 | 3.3% |
| Welsh | 42 | 1.2% |
| Yugoslavian | 18 | 0.5% | View All 35 Rows |
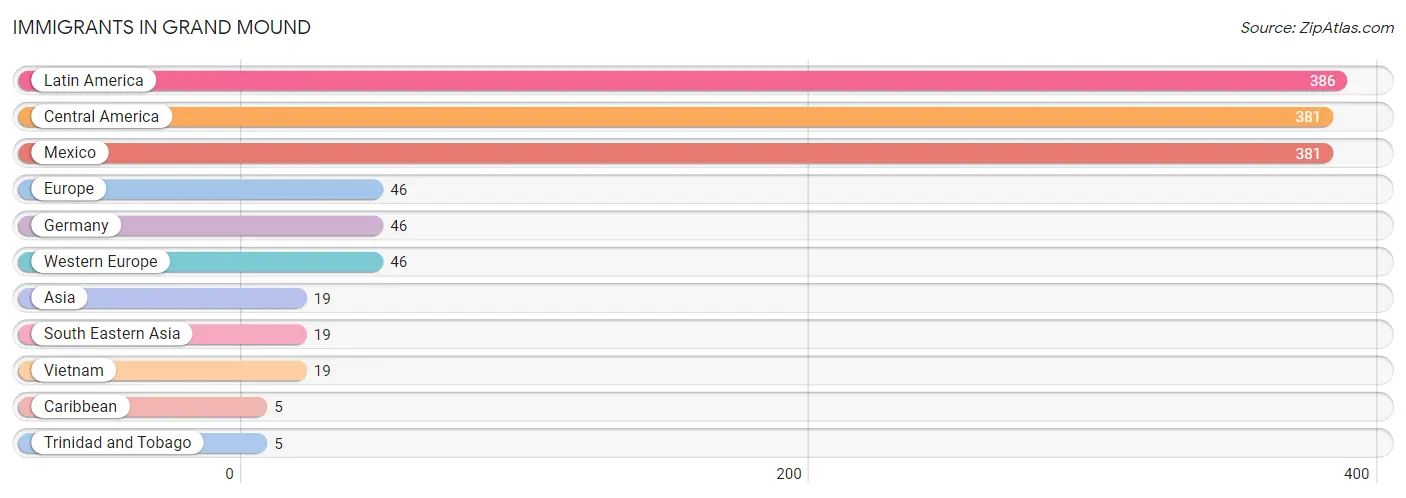
Immigrants in Grand Mound
The most numerous immigrant groups reported in Grand Mound came from Latin America (386 | 11.2%), Central America (381 | 11.1%), Mexico (381 | 11.1%), Europe (46 | 1.3%), and Germany (46 | 1.3%), together accounting for 36.0% of all Grand Mound residents.
| Immigration Origin | # Population | % Population |
| Asia | 19 | 0.5% |
| Caribbean | 5 | 0.2% |
| Central America | 381 | 11.1% |
| Europe | 46 | 1.3% |
| Germany | 46 | 1.3% |
| Latin America | 386 | 11.2% |
| Mexico | 381 | 11.1% |
| South Eastern Asia | 19 | 0.5% |
| Trinidad and Tobago | 5 | 0.2% |
| Vietnam | 19 | 0.5% |
| Western Europe | 46 | 1.3% | View All 11 Rows |
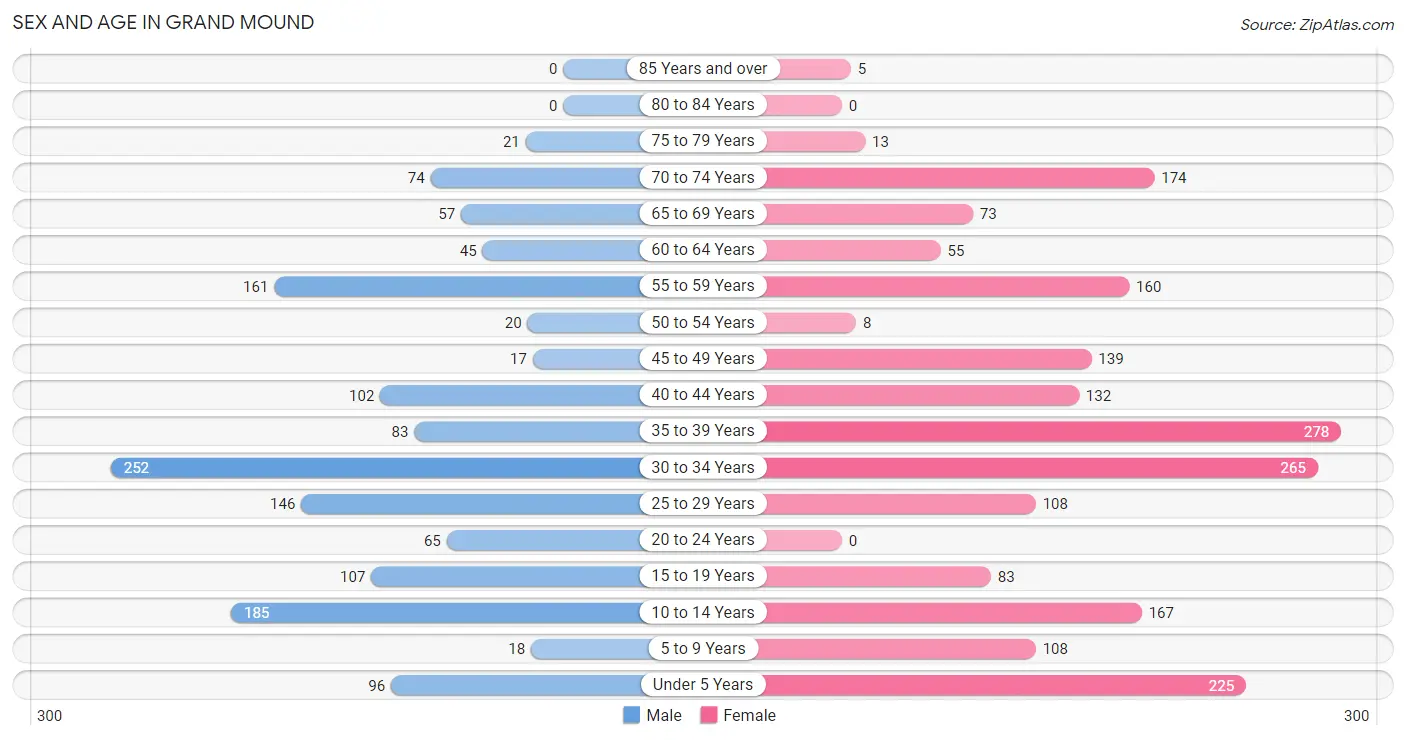
Sex and Age in Grand Mound
Sex and Age in Grand Mound
The most populous age groups in Grand Mound are 30 to 34 Years (252 | 17.4%) for men and 35 to 39 Years (278 | 14.0%) for women.
| Age Bracket | Male | Female |
| Under 5 Years | 96 (6.6%) | 225 (11.3%) |
| 5 to 9 Years | 18 (1.2%) | 108 (5.4%) |
| 10 to 14 Years | 185 (12.8%) | 167 (8.4%) |
| 15 to 19 Years | 107 (7.4%) | 83 (4.2%) |
| 20 to 24 Years | 65 (4.5%) | 0 (0.0%) |
| 25 to 29 Years | 146 (10.1%) | 108 (5.4%) |
| 30 to 34 Years | 252 (17.4%) | 265 (13.3%) |
| 35 to 39 Years | 83 (5.7%) | 278 (14.0%) |
| 40 to 44 Years | 102 (7.0%) | 132 (6.6%) |
| 45 to 49 Years | 17 (1.2%) | 139 (7.0%) |
| 50 to 54 Years | 20 (1.4%) | 8 (0.4%) |
| 55 to 59 Years | 161 (11.1%) | 160 (8.0%) |
| 60 to 64 Years | 45 (3.1%) | 55 (2.8%) |
| 65 to 69 Years | 57 (3.9%) | 73 (3.7%) |
| 70 to 74 Years | 74 (5.1%) | 174 (8.7%) |
| 75 to 79 Years | 21 (1.5%) | 13 (0.6%) |
| 80 to 84 Years | 0 (0.0%) | 0 (0.0%) |
| 85 Years and over | 0 (0.0%) | 5 (0.3%) |
| Total | 1,449 (100.0%) | 1,993 (100.0%) |
Families and Households in Grand Mound
Median Family Size in Grand Mound
The median family size in Grand Mound is 3.28 persons per family, with single female/mother families (186 | 22.3%) accounting for the largest median family size of 3.42 persons per family. On the other hand, single male/father families (5 | 0.6%) represent the smallest median family size with 1.80 persons per family.
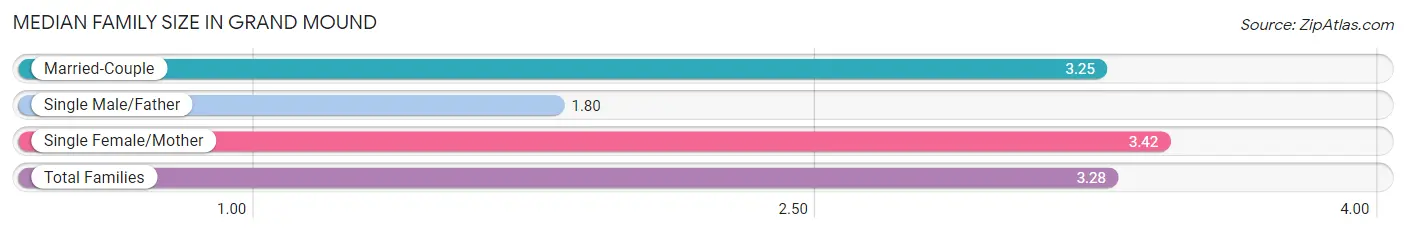
| Family Type | # Families | Family Size |
| Married-Couple | 645 (77.1%) | 3.25 |
| Single Male/Father | 5 (0.6%) | 1.80 |
| Single Female/Mother | 186 (22.3%) | 3.42 |
| Total Families | 836 (100.0%) | 3.28 |
Median Household Size in Grand Mound
The median household size in Grand Mound is 2.62 persons per household, with single female/mother households (186 | 14.2%) accounting for the largest median household size of 3.5 persons per household. non-family households (477 | 36.3%) represent the smallest median household size with 1.44 persons per household.
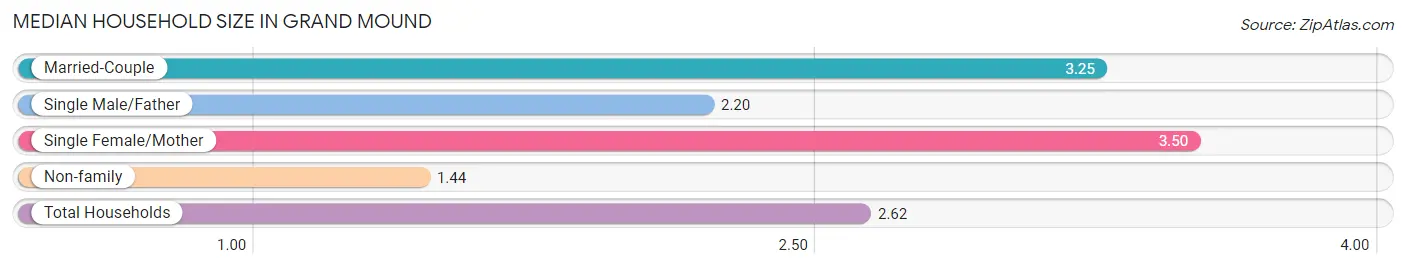
| Household Type | # Households | Household Size |
| Married-Couple | 645 (49.1%) | 3.25 |
| Single Male/Father | 5 (0.4%) | 2.20 |
| Single Female/Mother | 186 (14.2%) | 3.50 |
| Non-family | 477 (36.3%) | 1.44 |
| Total Households | 1,313 (100.0%) | 2.62 |
Household Size by Marriage Status in Grand Mound
Out of a total of 1,313 households in Grand Mound, 836 (63.7%) are family households, while 477 (36.3%) are nonfamily households. The most numerous type of family households are 2-person households, comprising 288, and the most common type of nonfamily households are 1-person households, comprising 269.
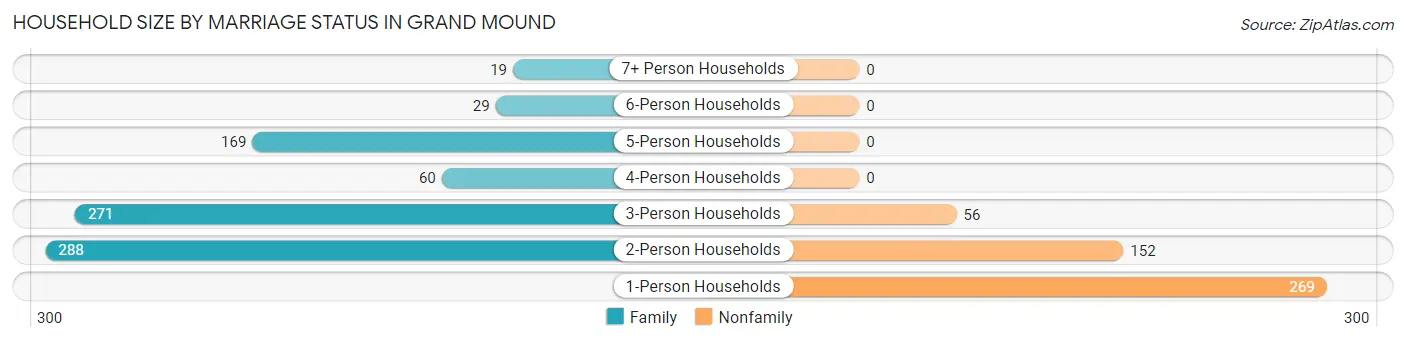
| Household Size | Family Households | Nonfamily Households |
| 1-Person Households | - | 269 (20.5%) |
| 2-Person Households | 288 (21.9%) | 152 (11.6%) |
| 3-Person Households | 271 (20.6%) | 56 (4.3%) |
| 4-Person Households | 60 (4.6%) | 0 (0.0%) |
| 5-Person Households | 169 (12.9%) | 0 (0.0%) |
| 6-Person Households | 29 (2.2%) | 0 (0.0%) |
| 7+ Person Households | 19 (1.5%) | 0 (0.0%) |
| Total | 836 (63.7%) | 477 (36.3%) |
Female Fertility in Grand Mound
Fertility by Age in Grand Mound
Average fertility rate in Grand Mound is 88.0 births per 1,000 women. Women in the age bracket of 20 to 34 years have the highest fertility rate with 105.0 births per 1,000 women. Women in the age bracket of 35 to 50 years acount for 55.7% of all women with births.
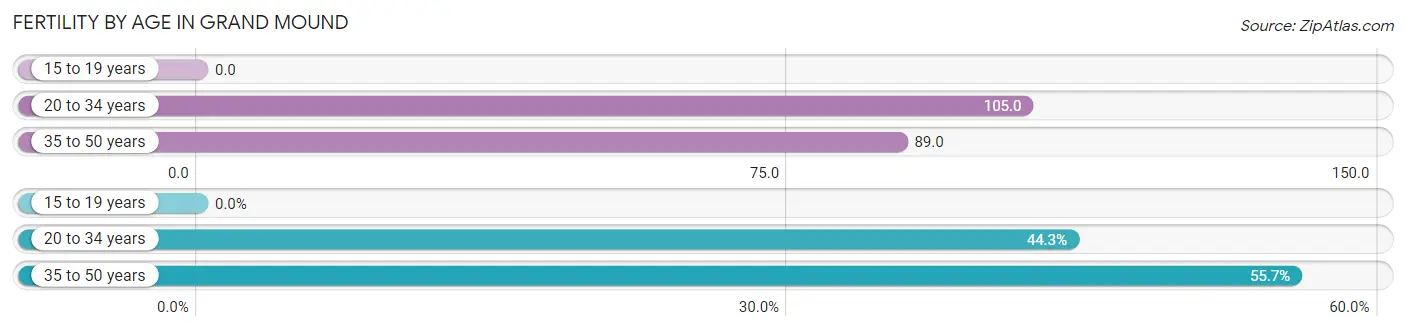
| Age Bracket | Women with Births | Births / 1,000 Women |
| 15 to 19 years | 0 (0.0%) | 0.0 |
| 20 to 34 years | 39 (44.3%) | 105.0 |
| 35 to 50 years | 49 (55.7%) | 89.0 |
| Total | 88 (100.0%) | 88.0 |
Fertility by Age by Marriage Status in Grand Mound
44.3% of women with births (88) in Grand Mound are married. The highest percentage of unmarried women with births falls into 35 to 50 years age bracket with 100.0% of them unmarried at the time of birth, while the lowest percentage of unmarried women with births belong to 20 to 34 years age bracket with 0.0% of them unmarried.

| Age Bracket | Married | Unmarried |
| 15 to 19 years | 0 (0.0%) | 0 (0.0%) |
| 20 to 34 years | 39 (100.0%) | 0 (0.0%) |
| 35 to 50 years | 0 (0.0%) | 49 (100.0%) |
| Total | 39 (44.3%) | 49 (55.7%) |
Fertility by Education in Grand Mound
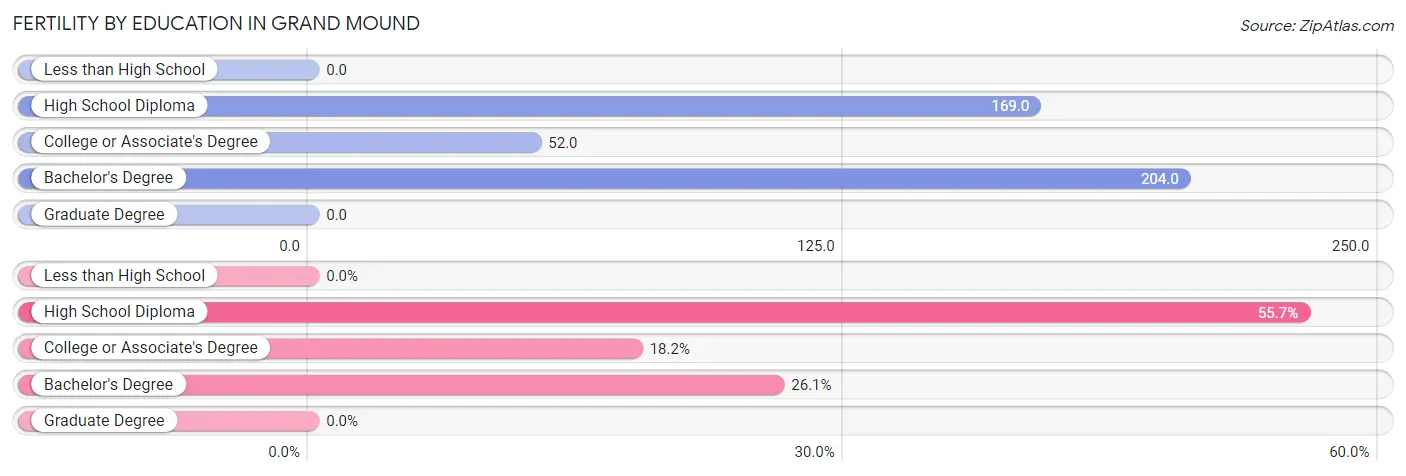
| Educational Attainment | Women with Births | Births / 1,000 Women |
| Less than High School | 0 (0.0%) | 0.0 |
| High School Diploma | 49 (55.7%) | 169.0 |
| College or Associate's Degree | 16 (18.2%) | 52.0 |
| Bachelor's Degree | 23 (26.1%) | 204.0 |
| Graduate Degree | 0 (0.0%) | 0.0 |
| Total | 88 (100.0%) | 88.0 |
Fertility by Education by Marriage Status in Grand Mound
55.7% of women with births in Grand Mound are unmarried. Women with the educational attainment of college or associate's degree are most likely to be married with 100.0% of them married at childbirth, while women with the educational attainment of high school diploma are least likely to be married with 100.0% of them unmarried at childbirth.
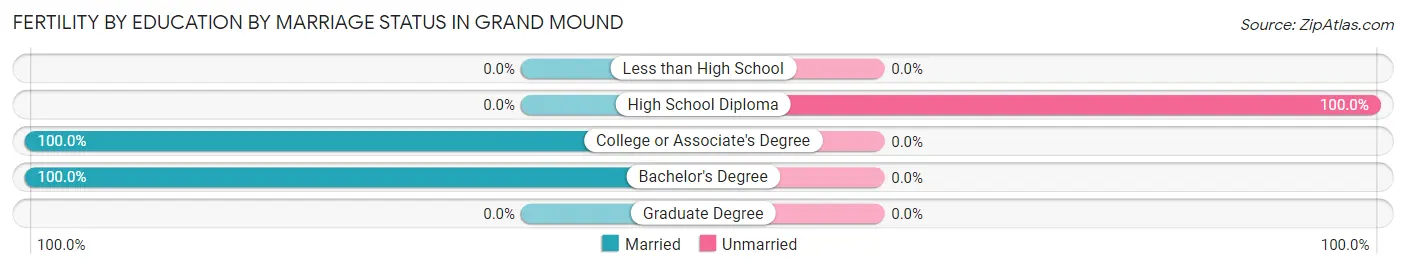
| Educational Attainment | Married | Unmarried |
| Less than High School | 0 (0.0%) | 0 (0.0%) |
| High School Diploma | 0 (0.0%) | 49 (100.0%) |
| College or Associate's Degree | 16 (100.0%) | 0 (0.0%) |
| Bachelor's Degree | 23 (100.0%) | 0 (0.0%) |
| Graduate Degree | 0 (0.0%) | 0 (0.0%) |
| Total | 39 (44.3%) | 49 (55.7%) |
Employment Characteristics in Grand Mound
Employment by Class of Employer in Grand Mound
Among the 1,491 employed individuals in Grand Mound, private company employees (923 | 61.9%), not-for-profit organizations (226 | 15.2%), and state government employees (170 | 11.4%) make up the most common classes of employment.
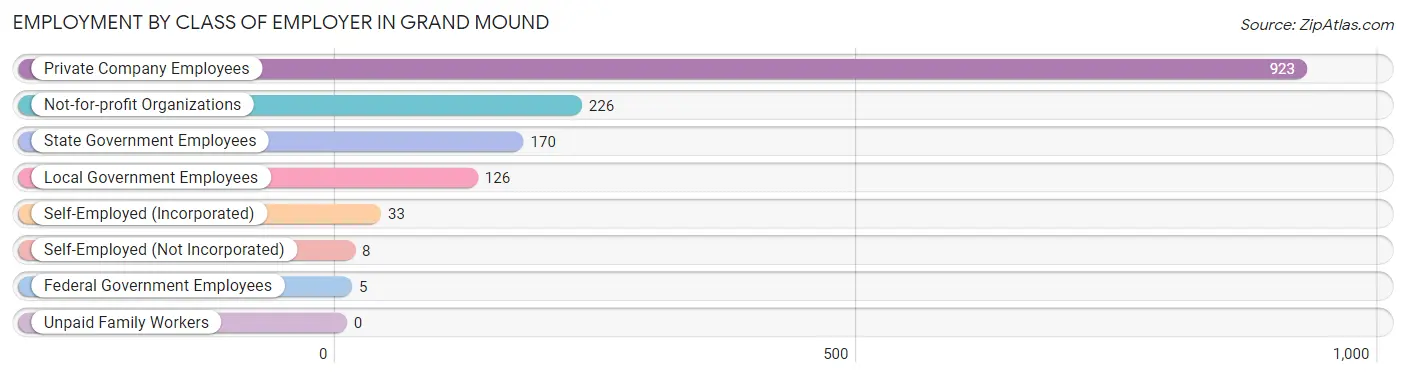
| Employer Class | # Employees | % Employees |
| Private Company Employees | 923 | 61.9% |
| Self-Employed (Incorporated) | 33 | 2.2% |
| Self-Employed (Not Incorporated) | 8 | 0.5% |
| Not-for-profit Organizations | 226 | 15.2% |
| Local Government Employees | 126 | 8.5% |
| State Government Employees | 170 | 11.4% |
| Federal Government Employees | 5 | 0.3% |
| Unpaid Family Workers | 0 | 0.0% |
| Total | 1,491 | 100.0% |
Employment Status by Age in Grand Mound
According to the labor force statistics for Grand Mound, out of the total population over 16 years of age (2,633), 59.9% or 1,577 individuals are in the labor force, with 5.1% or 80 of them unemployed. The age group with the highest labor force participation rate is 20 to 24 years, with 100.0% or 65 individuals in the labor force. Within the labor force, the 16 to 19 years age range has the highest percentage of unemployed individuals, with 71.0% or 44 of them being unemployed.
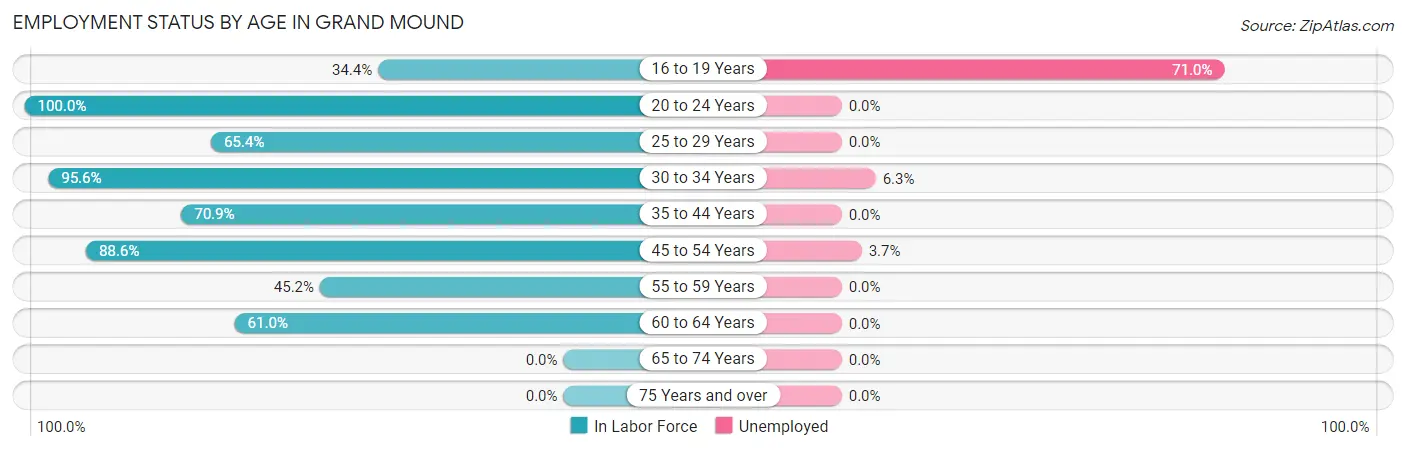
| Age Bracket | In Labor Force | Unemployed |
| 16 to 19 Years | 62 (34.4%) | 44 (71.0%) |
| 20 to 24 Years | 65 (100.0%) | 0 (0.0%) |
| 25 to 29 Years | 166 (65.4%) | 0 (0.0%) |
| 30 to 34 Years | 494 (95.6%) | 31 (6.3%) |
| 35 to 44 Years | 422 (70.9%) | 0 (0.0%) |
| 45 to 54 Years | 163 (88.6%) | 6 (3.7%) |
| 55 to 59 Years | 145 (45.2%) | 0 (0.0%) |
| 60 to 64 Years | 61 (61.0%) | 0 (0.0%) |
| 65 to 74 Years | 0 (0.0%) | 0 (0.0%) |
| 75 Years and over | 0 (0.0%) | 0 (0.0%) |
| Total | 1,577 (59.9%) | 80 (5.1%) |
Employment Status by Educational Attainment in Grand Mound
According to labor force statistics for Grand Mound, 73.6% of individuals (1,451) out of the total population between 25 and 64 years of age (1,971) are in the labor force, with 2.5% or 36 of them being unemployed. The group with the highest labor force participation rate are those with the educational attainment of less than high school, with 92.8% or 206 individuals in the labor force. Within the labor force, individuals with high school diploma education have the highest percentage of unemployment, with 5.8% or 31 of them being unemployed.
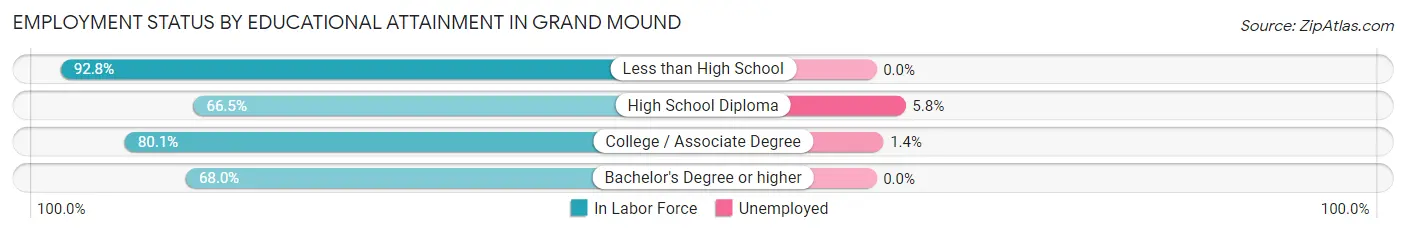
| Educational Attainment | In Labor Force | Unemployed |
| Less than High School | 206 (92.8%) | 0 (0.0%) |
| High School Diploma | 537 (66.5%) | 47 (5.8%) |
| College / Associate Degree | 444 (80.1%) | 8 (1.4%) |
| Bachelor's Degree or higher | 264 (68.0%) | 0 (0.0%) |
| Total | 1,451 (73.6%) | 49 (2.5%) |
Employment Occupations by Sex in Grand Mound
Management, Business, Science and Arts Occupations
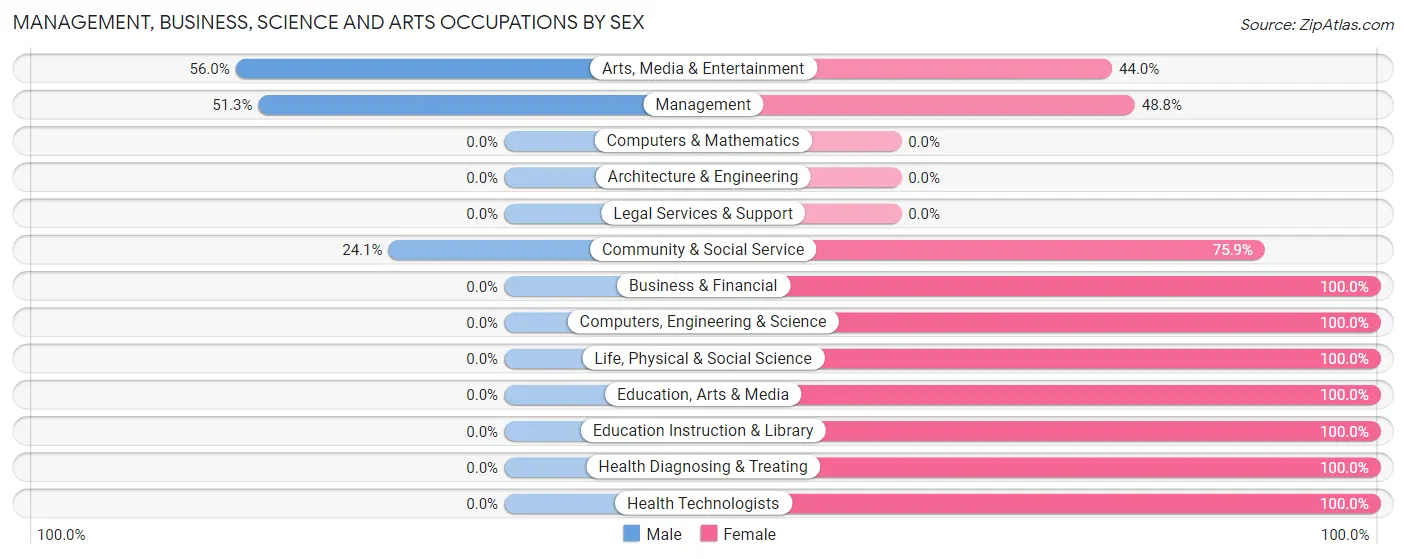
The most common Management, Business, Science and Arts occupations in Grand Mound are Health Diagnosing & Treating (169 | 11.3%), Health Technologists (169 | 11.3%), Community & Social Service (116 | 7.7%), Management (80 | 5.3%), and Education Instruction & Library (59 | 3.9%).
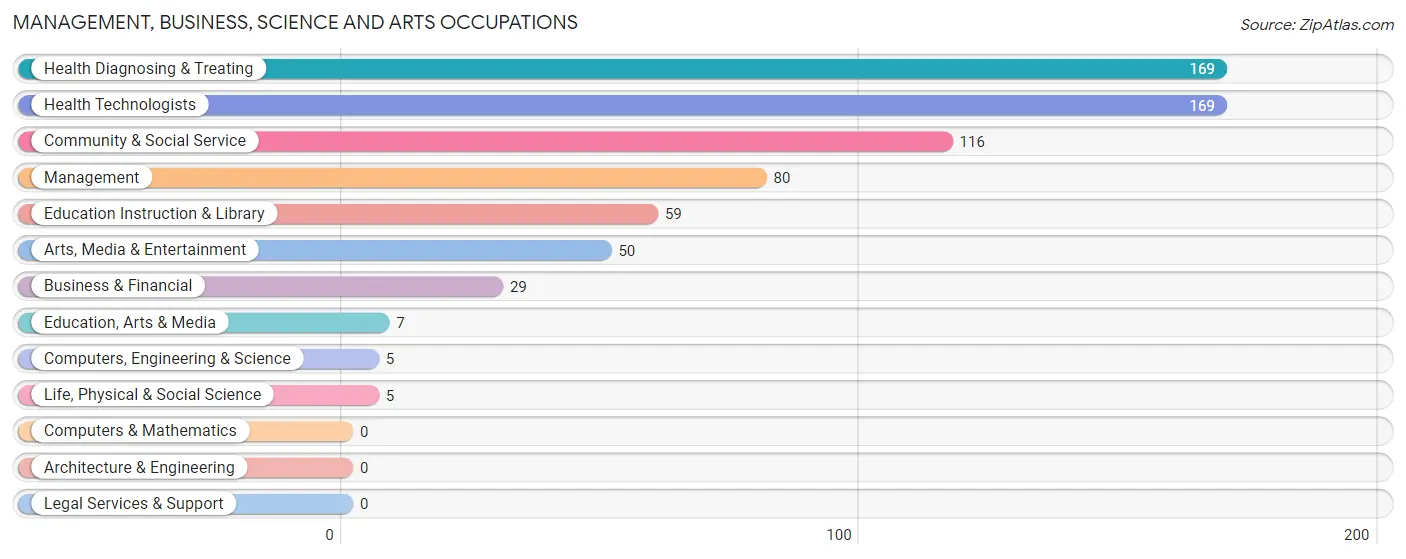
Management, Business, Science and Arts Occupations by Sex
Within the Management, Business, Science and Arts occupations in Grand Mound, the most male-oriented occupations are Arts, Media & Entertainment (56.0%), Management (51.2%), and Community & Social Service (24.1%), while the most female-oriented occupations are Business & Financial (100.0%), Computers, Engineering & Science (100.0%), and Life, Physical & Social Science (100.0%).
| Occupation | Male | Female |
| Management | 41 (51.2%) | 39 (48.7%) |
| Business & Financial | 0 (0.0%) | 29 (100.0%) |
| Computers, Engineering & Science | 0 (0.0%) | 5 (100.0%) |
| Computers & Mathematics | 0 (0.0%) | 0 (0.0%) |
| Architecture & Engineering | 0 (0.0%) | 0 (0.0%) |
| Life, Physical & Social Science | 0 (0.0%) | 5 (100.0%) |
| Community & Social Service | 28 (24.1%) | 88 (75.9%) |
| Education, Arts & Media | 0 (0.0%) | 7 (100.0%) |
| Legal Services & Support | 0 (0.0%) | 0 (0.0%) |
| Education Instruction & Library | 0 (0.0%) | 59 (100.0%) |
| Arts, Media & Entertainment | 28 (56.0%) | 22 (44.0%) |
| Health Diagnosing & Treating | 0 (0.0%) | 169 (100.0%) |
| Health Technologists | 0 (0.0%) | 169 (100.0%) |
| Total (Category) | 69 (17.3%) | 330 (82.7%) |
| Total (Overall) | 670 (44.8%) | 827 (55.2%) |
Services Occupations
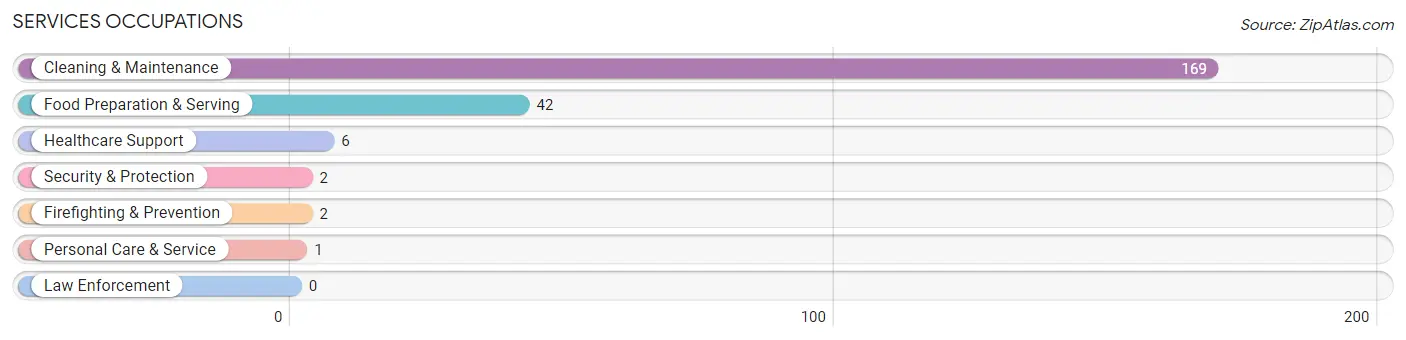
The most common Services occupations in Grand Mound are Cleaning & Maintenance (169 | 11.3%), Food Preparation & Serving (42 | 2.8%), Healthcare Support (6 | 0.4%), Security & Protection (2 | 0.1%), and Firefighting & Prevention (2 | 0.1%).
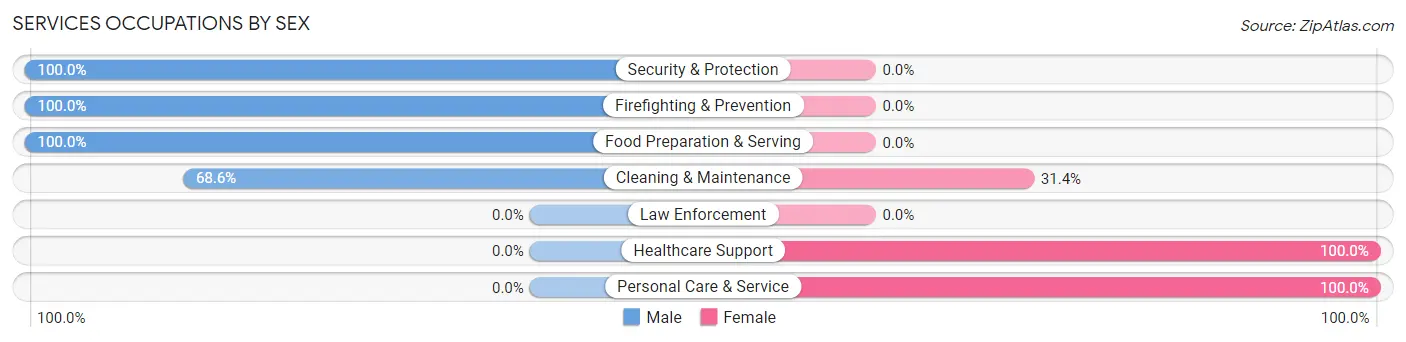
Services Occupations by Sex
Within the Services occupations in Grand Mound, the most male-oriented occupations are Security & Protection (100.0%), Firefighting & Prevention (100.0%), and Food Preparation & Serving (100.0%), while the most female-oriented occupations are Healthcare Support (100.0%), Personal Care & Service (100.0%), and Cleaning & Maintenance (31.4%).
| Occupation | Male | Female |
| Healthcare Support | 0 (0.0%) | 6 (100.0%) |
| Security & Protection | 2 (100.0%) | 0 (0.0%) |
| Firefighting & Prevention | 2 (100.0%) | 0 (0.0%) |
| Law Enforcement | 0 (0.0%) | 0 (0.0%) |
| Food Preparation & Serving | 42 (100.0%) | 0 (0.0%) |
| Cleaning & Maintenance | 116 (68.6%) | 53 (31.4%) |
| Personal Care & Service | 0 (0.0%) | 1 (100.0%) |
| Total (Category) | 160 (72.7%) | 60 (27.3%) |
| Total (Overall) | 670 (44.8%) | 827 (55.2%) |
Sales and Office Occupations
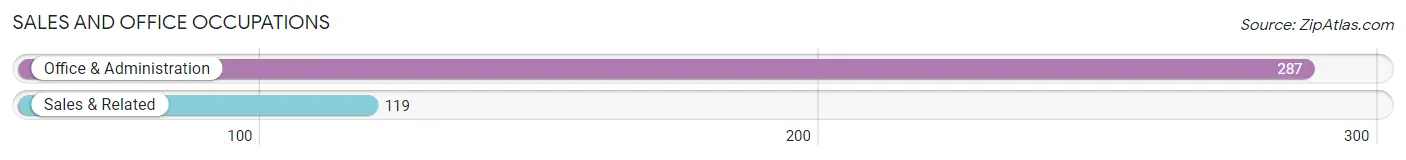
The most common Sales and Office occupations in Grand Mound are Office & Administration (287 | 19.2%), and Sales & Related (119 | 8.0%).
Sales and Office Occupations by Sex
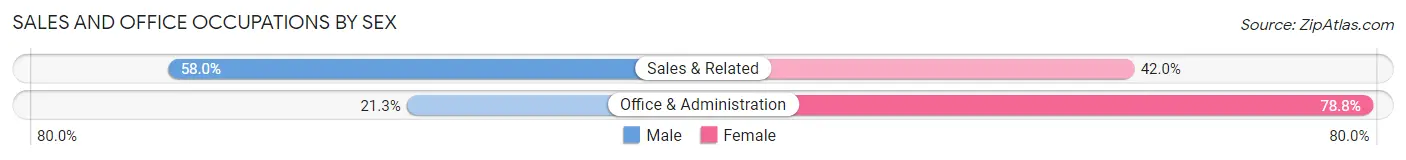
| Occupation | Male | Female |
| Sales & Related | 69 (58.0%) | 50 (42.0%) |
| Office & Administration | 61 (21.2%) | 226 (78.7%) |
| Total (Category) | 130 (32.0%) | 276 (68.0%) |
| Total (Overall) | 670 (44.8%) | 827 (55.2%) |
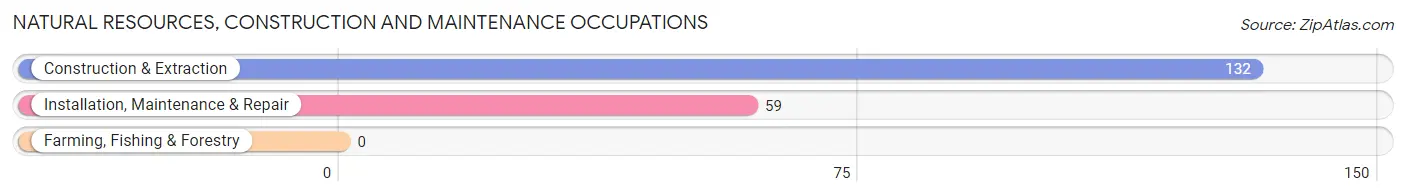
Natural Resources, Construction and Maintenance Occupations
The most common Natural Resources, Construction and Maintenance occupations in Grand Mound are Construction & Extraction (132 | 8.8%), and Installation, Maintenance & Repair (59 | 3.9%).
Natural Resources, Construction and Maintenance Occupations by Sex
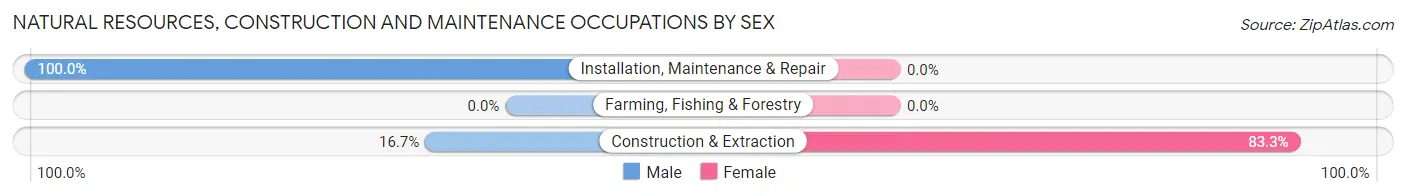
| Occupation | Male | Female |
| Farming, Fishing & Forestry | 0 (0.0%) | 0 (0.0%) |
| Construction & Extraction | 22 (16.7%) | 110 (83.3%) |
| Installation, Maintenance & Repair | 59 (100.0%) | 0 (0.0%) |
| Total (Category) | 81 (42.4%) | 110 (57.6%) |
| Total (Overall) | 670 (44.8%) | 827 (55.2%) |
Production, Transportation and Moving Occupations
The most common Production, Transportation and Moving occupations in Grand Mound are Material Moving (180 | 12.0%), Production (54 | 3.6%), and Transportation (47 | 3.1%).
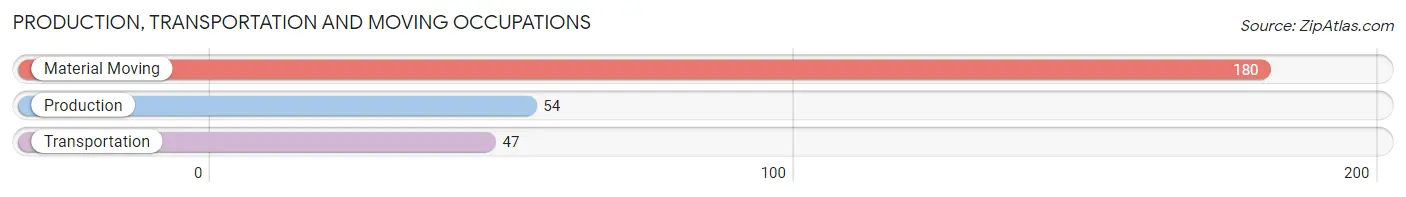
Production, Transportation and Moving Occupations by Sex
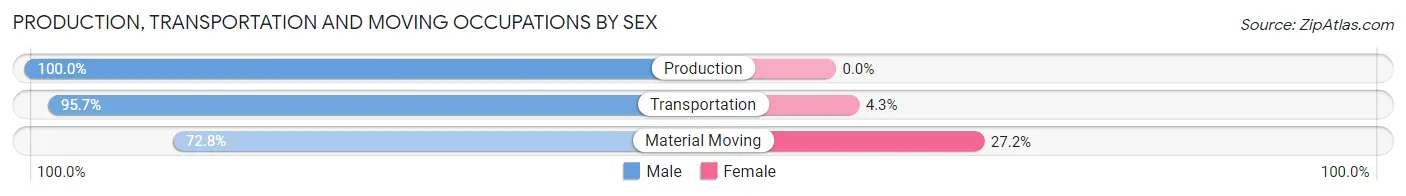
| Occupation | Male | Female |
| Production | 54 (100.0%) | 0 (0.0%) |
| Transportation | 45 (95.7%) | 2 (4.3%) |
| Material Moving | 131 (72.8%) | 49 (27.2%) |
| Total (Category) | 230 (81.9%) | 51 (18.1%) |
| Total (Overall) | 670 (44.8%) | 827 (55.2%) |
Employment Industries by Sex in Grand Mound
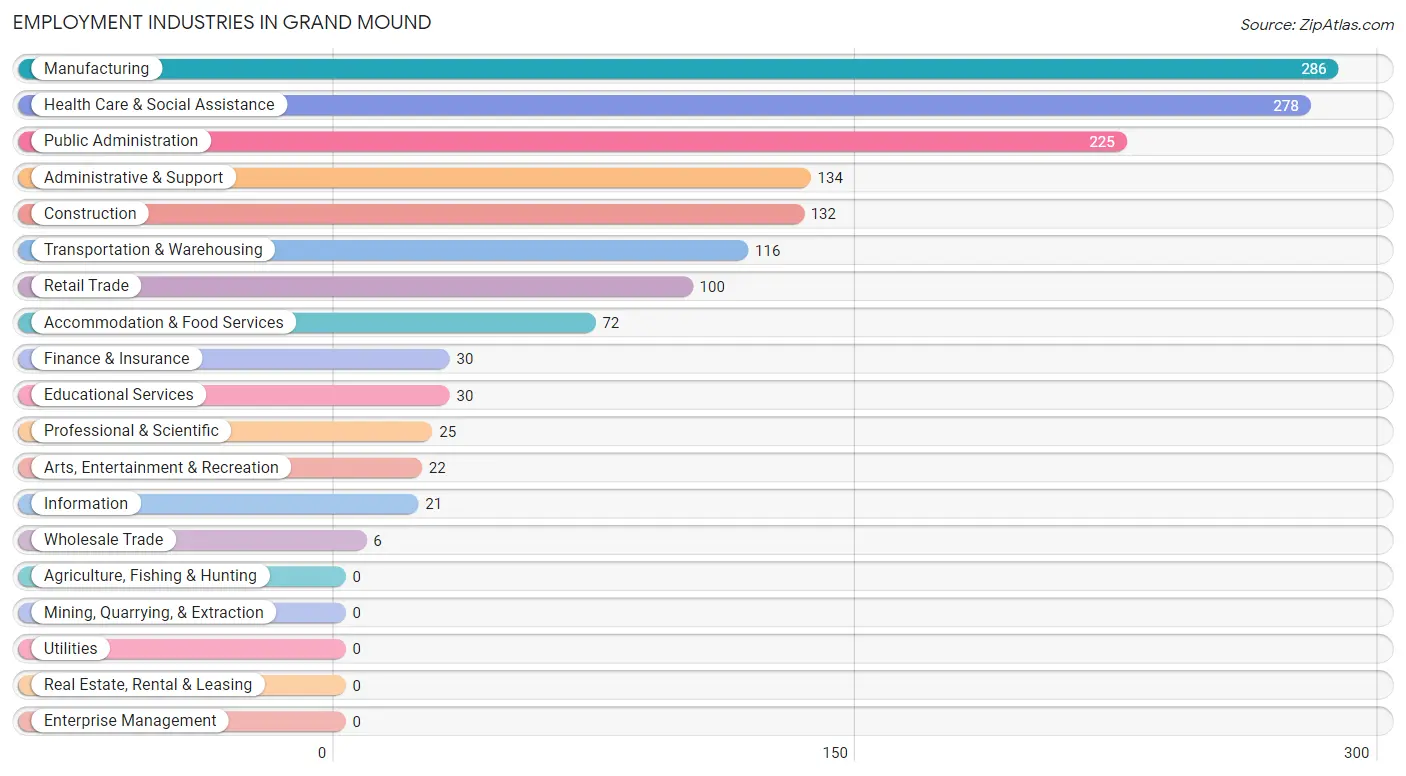
Employment Industries in Grand Mound
The major employment industries in Grand Mound include Manufacturing (286 | 19.1%), Health Care & Social Assistance (278 | 18.6%), Public Administration (225 | 15.0%), Administrative & Support (134 | 8.9%), and Construction (132 | 8.8%).
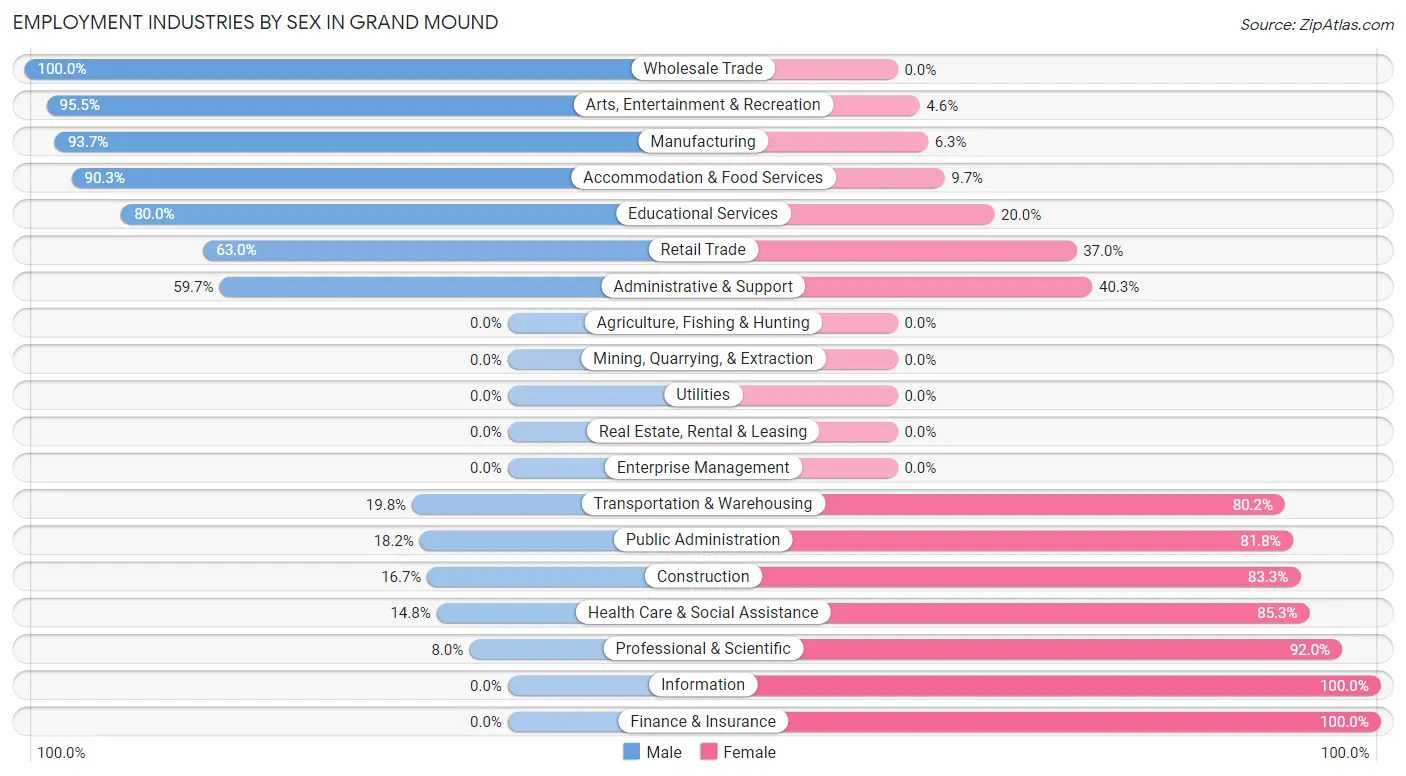
Employment Industries by Sex in Grand Mound
The Grand Mound industries that see more men than women are Wholesale Trade (100.0%), Arts, Entertainment & Recreation (95.5%), and Manufacturing (93.7%), whereas the industries that tend to have a higher number of women are Information (100.0%), Finance & Insurance (100.0%), and Professional & Scientific (92.0%).
| Industry | Male | Female |
| Agriculture, Fishing & Hunting | 0 (0.0%) | 0 (0.0%) |
| Mining, Quarrying, & Extraction | 0 (0.0%) | 0 (0.0%) |
| Construction | 22 (16.7%) | 110 (83.3%) |
| Manufacturing | 268 (93.7%) | 18 (6.3%) |
| Wholesale Trade | 6 (100.0%) | 0 (0.0%) |
| Retail Trade | 63 (63.0%) | 37 (37.0%) |
| Transportation & Warehousing | 23 (19.8%) | 93 (80.2%) |
| Utilities | 0 (0.0%) | 0 (0.0%) |
| Information | 0 (0.0%) | 21 (100.0%) |
| Finance & Insurance | 0 (0.0%) | 30 (100.0%) |
| Real Estate, Rental & Leasing | 0 (0.0%) | 0 (0.0%) |
| Professional & Scientific | 2 (8.0%) | 23 (92.0%) |
| Enterprise Management | 0 (0.0%) | 0 (0.0%) |
| Administrative & Support | 80 (59.7%) | 54 (40.3%) |
| Educational Services | 24 (80.0%) | 6 (20.0%) |
| Health Care & Social Assistance | 41 (14.7%) | 237 (85.3%) |
| Arts, Entertainment & Recreation | 21 (95.5%) | 1 (4.5%) |
| Accommodation & Food Services | 65 (90.3%) | 7 (9.7%) |
| Public Administration | 41 (18.2%) | 184 (81.8%) |
| Total | 670 (44.8%) | 827 (55.2%) |
Education in Grand Mound
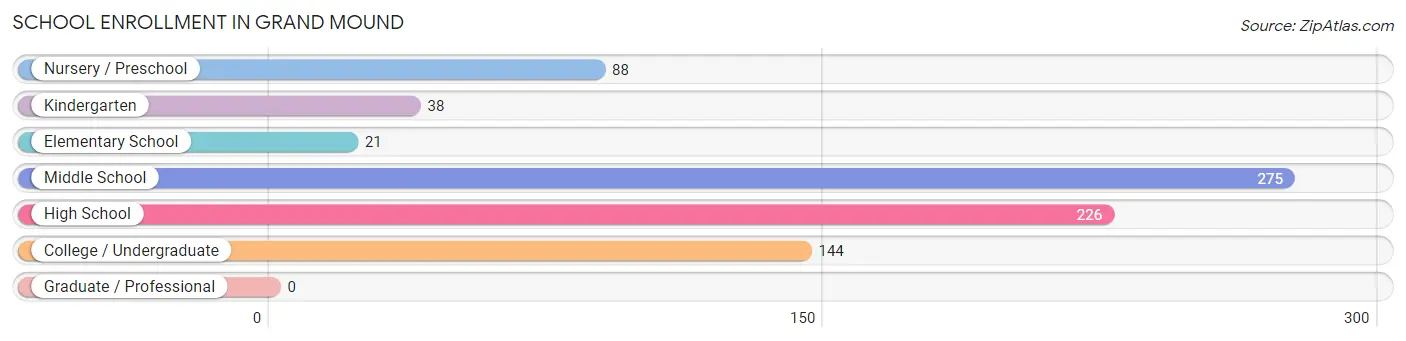
School Enrollment in Grand Mound
The most common levels of schooling among the 792 students in Grand Mound are middle school (275 | 34.7%), high school (226 | 28.5%), and college / undergraduate (144 | 18.2%).
| School Level | # Students | % Students |
| Nursery / Preschool | 88 | 11.1% |
| Kindergarten | 38 | 4.8% |
| Elementary School | 21 | 2.6% |
| Middle School | 275 | 34.7% |
| High School | 226 | 28.5% |
| College / Undergraduate | 144 | 18.2% |
| Graduate / Professional | 0 | 0.0% |
| Total | 792 | 100.0% |
School Enrollment by Age by Funding Source in Grand Mound
Out of a total of 792 students who are enrolled in schools in Grand Mound, 107 (13.5%) attend a private institution, while the remaining 685 (86.5%) are enrolled in public schools. The age group of 3 to 4 year olds has the highest likelihood of being enrolled in private schools, with 16 (100.0% in the age bracket) enrolled. Conversely, the age group of 15 to 17 year olds has the lowest likelihood of being enrolled in a private school, with 187 (100.0% in the age bracket) attending a public institution.
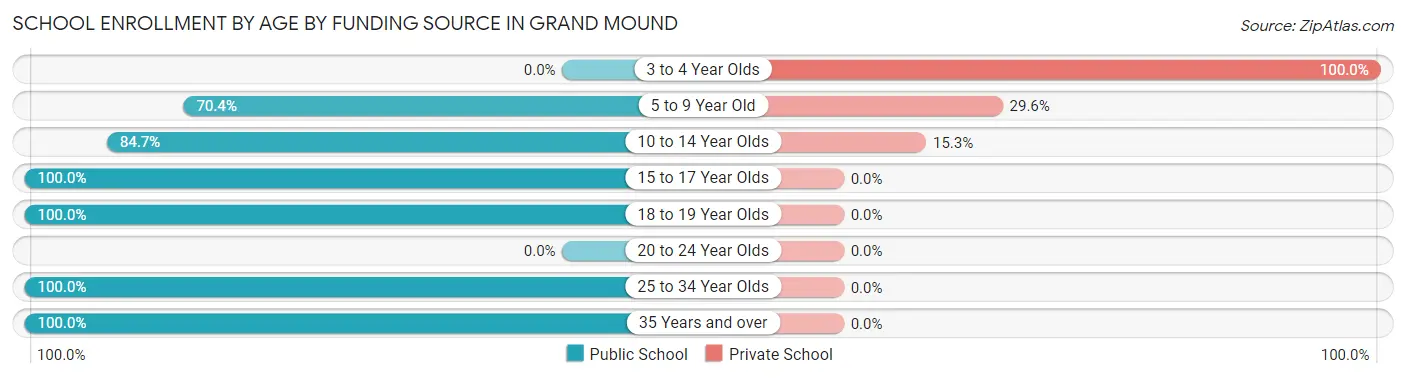
| Age Bracket | Public School | Private School |
| 3 to 4 Year Olds | 0 (0.0%) | 16 (100.0%) |
| 5 to 9 Year Old | 88 (70.4%) | 37 (29.6%) |
| 10 to 14 Year Olds | 298 (84.7%) | 54 (15.3%) |
| 15 to 17 Year Olds | 187 (100.0%) | 0 (0.0%) |
| 18 to 19 Year Olds | 2 (100.0%) | 0 (0.0%) |
| 20 to 24 Year Olds | 0 (0.0%) | 0 (0.0%) |
| 25 to 34 Year Olds | 101 (100.0%) | 0 (0.0%) |
| 35 Years and over | 9 (100.0%) | 0 (0.0%) |
| Total | 685 (86.5%) | 107 (13.5%) |
Educational Attainment by Field of Study in Grand Mound
Business (147 | 33.8%), science & technology (124 | 28.5%), social sciences (45 | 10.3%), education (44 | 10.1%), and psychology (24 | 5.5%) are the most common fields of study among 435 individuals in Grand Mound who have obtained a bachelor's degree or higher.
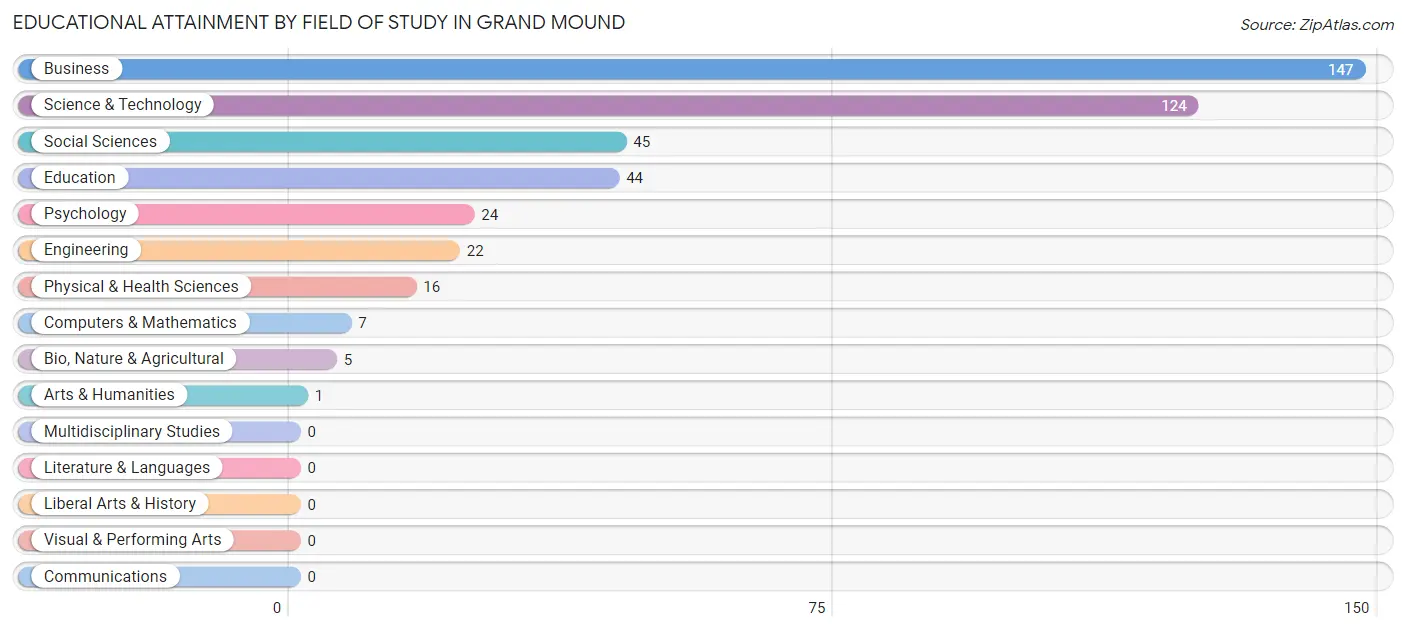
| Field of Study | # Graduates | % Graduates |
| Computers & Mathematics | 7 | 1.6% |
| Bio, Nature & Agricultural | 5 | 1.1% |
| Physical & Health Sciences | 16 | 3.7% |
| Psychology | 24 | 5.5% |
| Social Sciences | 45 | 10.3% |
| Engineering | 22 | 5.1% |
| Multidisciplinary Studies | 0 | 0.0% |
| Science & Technology | 124 | 28.5% |
| Business | 147 | 33.8% |
| Education | 44 | 10.1% |
| Literature & Languages | 0 | 0.0% |
| Liberal Arts & History | 0 | 0.0% |
| Visual & Performing Arts | 0 | 0.0% |
| Communications | 0 | 0.0% |
| Arts & Humanities | 1 | 0.2% |
| Total | 435 | 100.0% |
Transportation & Commute in Grand Mound
Vehicle Availability by Sex in Grand Mound
The most prevalent vehicle ownership categories in Grand Mound are males with 3 vehicles (366, accounting for 55.0%) and females with 3 vehicles (220, making up 44.3%).
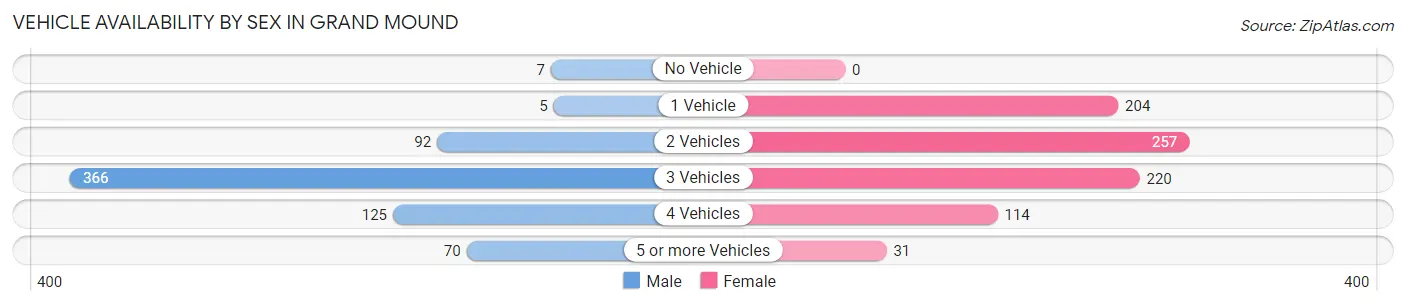
| Vehicles Available | Male | Female |
| No Vehicle | 7 (1.1%) | 0 (0.0%) |
| 1 Vehicle | 5 (0.7%) | 204 (24.7%) |
| 2 Vehicles | 92 (13.8%) | 257 (31.1%) |
| 3 Vehicles | 366 (55.0%) | 220 (26.6%) |
| 4 Vehicles | 125 (18.8%) | 114 (13.8%) |
| 5 or more Vehicles | 70 (10.5%) | 31 (3.7%) |
| Total | 665 (100.0%) | 826 (100.0%) |
Commute Time in Grand Mound
The most frequently occuring commute durations in Grand Mound are 30 to 34 minutes (449 commuters, 31.8%), 25 to 29 minutes (186 commuters, 13.2%), and 10 to 14 minutes (172 commuters, 12.2%).
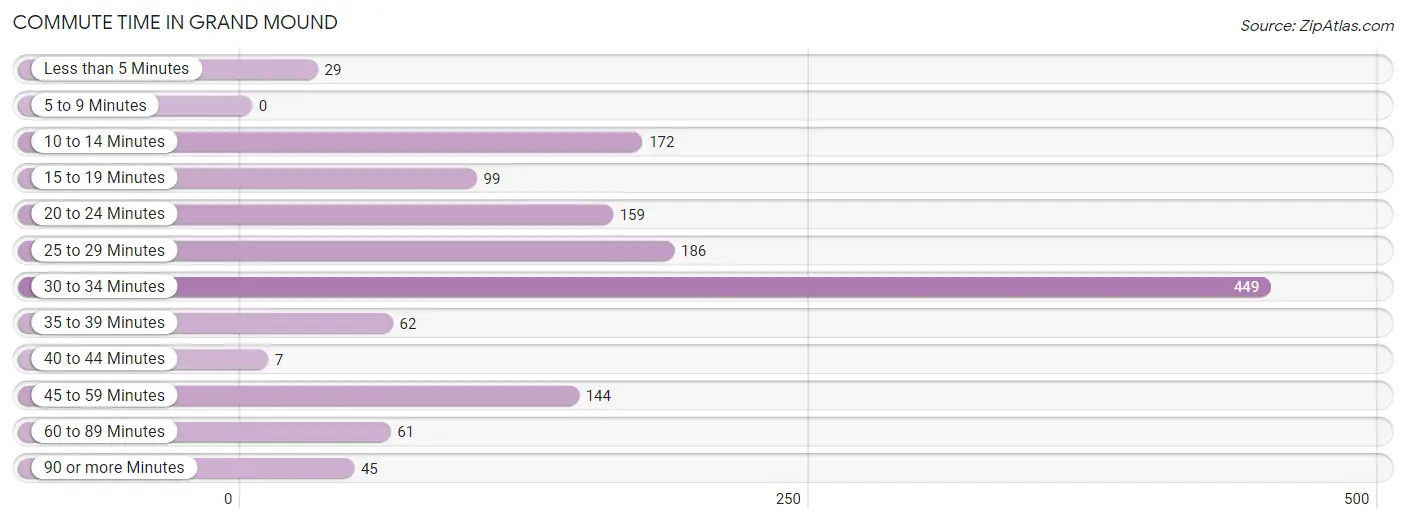
| Commute Time | # Commuters | % Commuters |
| Less than 5 Minutes | 29 | 2.1% |
| 5 to 9 Minutes | 0 | 0.0% |
| 10 to 14 Minutes | 172 | 12.2% |
| 15 to 19 Minutes | 99 | 7.0% |
| 20 to 24 Minutes | 159 | 11.3% |
| 25 to 29 Minutes | 186 | 13.2% |
| 30 to 34 Minutes | 449 | 31.8% |
| 35 to 39 Minutes | 62 | 4.4% |
| 40 to 44 Minutes | 7 | 0.5% |
| 45 to 59 Minutes | 144 | 10.2% |
| 60 to 89 Minutes | 61 | 4.3% |
| 90 or more Minutes | 45 | 3.2% |
Commute Time by Sex in Grand Mound
The most common commute times in Grand Mound are 30 to 34 minutes (318 commuters, 47.8%) for males and 25 to 29 minutes (166 commuters, 22.2%) for females.
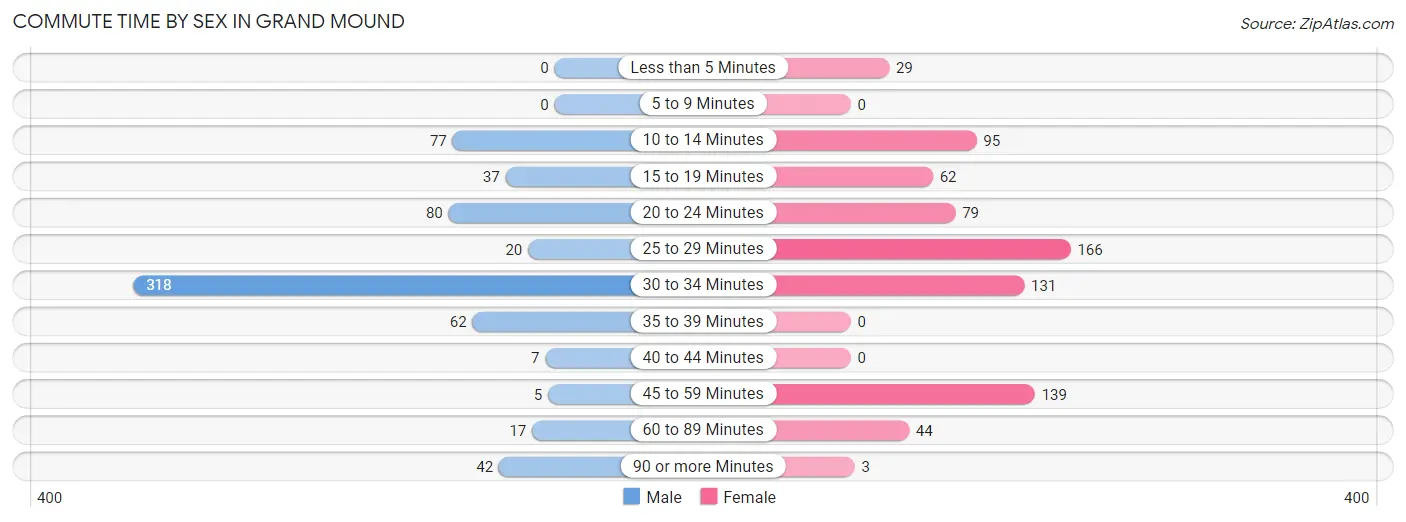
| Commute Time | Male | Female |
| Less than 5 Minutes | 0 (0.0%) | 29 (3.9%) |
| 5 to 9 Minutes | 0 (0.0%) | 0 (0.0%) |
| 10 to 14 Minutes | 77 (11.6%) | 95 (12.7%) |
| 15 to 19 Minutes | 37 (5.6%) | 62 (8.3%) |
| 20 to 24 Minutes | 80 (12.0%) | 79 (10.6%) |
| 25 to 29 Minutes | 20 (3.0%) | 166 (22.2%) |
| 30 to 34 Minutes | 318 (47.8%) | 131 (17.5%) |
| 35 to 39 Minutes | 62 (9.3%) | 0 (0.0%) |
| 40 to 44 Minutes | 7 (1.1%) | 0 (0.0%) |
| 45 to 59 Minutes | 5 (0.7%) | 139 (18.6%) |
| 60 to 89 Minutes | 17 (2.6%) | 44 (5.9%) |
| 90 or more Minutes | 42 (6.3%) | 3 (0.4%) |
Time of Departure to Work by Sex in Grand Mound
The most frequent times of departure to work in Grand Mound are 7:30 AM to 7:59 AM (171, 25.7%) for males and 7:00 AM to 7:29 AM (240, 32.1%) for females.
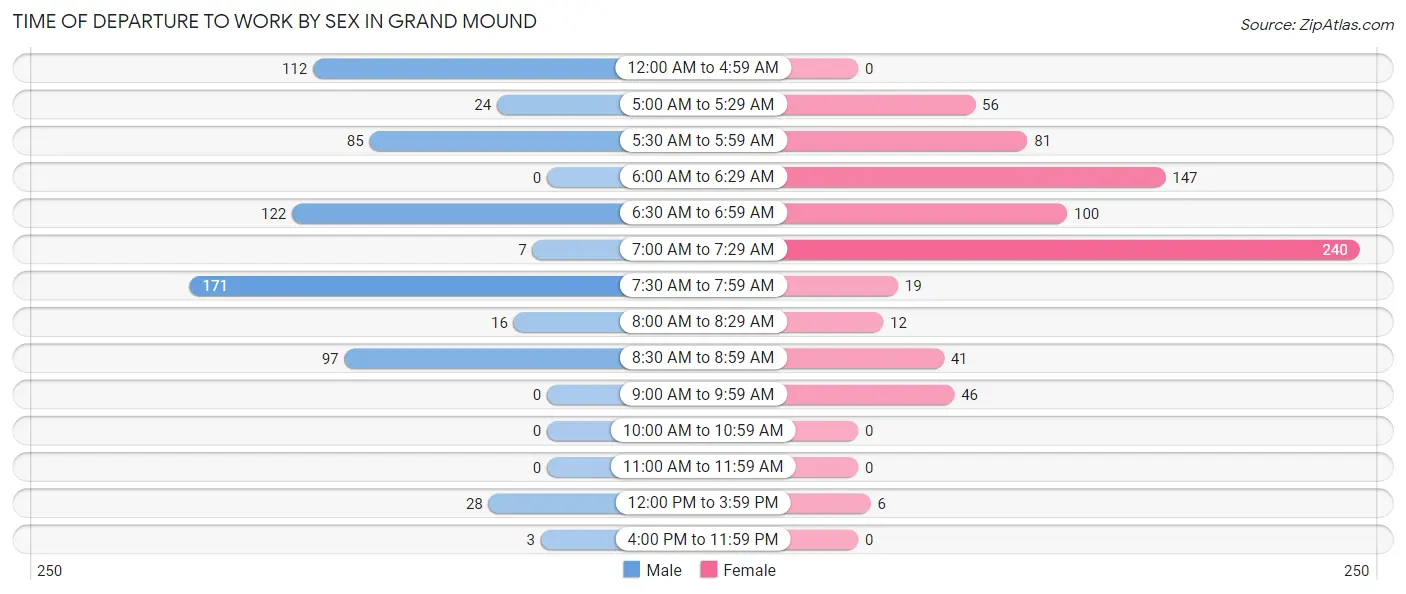
| Time of Departure | Male | Female |
| 12:00 AM to 4:59 AM | 112 (16.8%) | 0 (0.0%) |
| 5:00 AM to 5:29 AM | 24 (3.6%) | 56 (7.5%) |
| 5:30 AM to 5:59 AM | 85 (12.8%) | 81 (10.8%) |
| 6:00 AM to 6:29 AM | 0 (0.0%) | 147 (19.7%) |
| 6:30 AM to 6:59 AM | 122 (18.3%) | 100 (13.4%) |
| 7:00 AM to 7:29 AM | 7 (1.1%) | 240 (32.1%) |
| 7:30 AM to 7:59 AM | 171 (25.7%) | 19 (2.5%) |
| 8:00 AM to 8:29 AM | 16 (2.4%) | 12 (1.6%) |
| 8:30 AM to 8:59 AM | 97 (14.6%) | 41 (5.5%) |
| 9:00 AM to 9:59 AM | 0 (0.0%) | 46 (6.1%) |
| 10:00 AM to 10:59 AM | 0 (0.0%) | 0 (0.0%) |
| 11:00 AM to 11:59 AM | 0 (0.0%) | 0 (0.0%) |
| 12:00 PM to 3:59 PM | 28 (4.2%) | 6 (0.8%) |
| 4:00 PM to 11:59 PM | 3 (0.4%) | 0 (0.0%) |
| Total | 665 (100.0%) | 748 (100.0%) |
Housing Occupancy in Grand Mound
Occupancy by Ownership in Grand Mound
Of the total 1,313 dwellings in Grand Mound, owner-occupied units account for 839 (63.9%), while renter-occupied units make up 474 (36.1%).
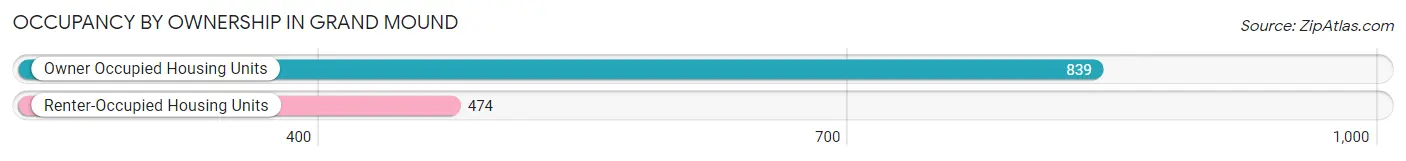
| Occupancy | # Housing Units | % Housing Units |
| Owner Occupied Housing Units | 839 | 63.9% |
| Renter-Occupied Housing Units | 474 | 36.1% |
| Total Occupied Housing Units | 1,313 | 100.0% |
Occupancy by Household Size in Grand Mound
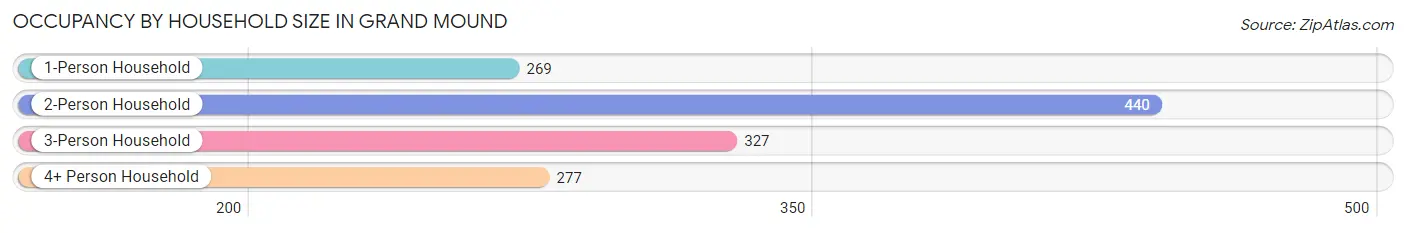
| Household Size | # Housing Units | % Housing Units |
| 1-Person Household | 269 | 20.5% |
| 2-Person Household | 440 | 33.5% |
| 3-Person Household | 327 | 24.9% |
| 4+ Person Household | 277 | 21.1% |
| Total Housing Units | 1,313 | 100.0% |
Occupancy by Ownership by Household Size in Grand Mound
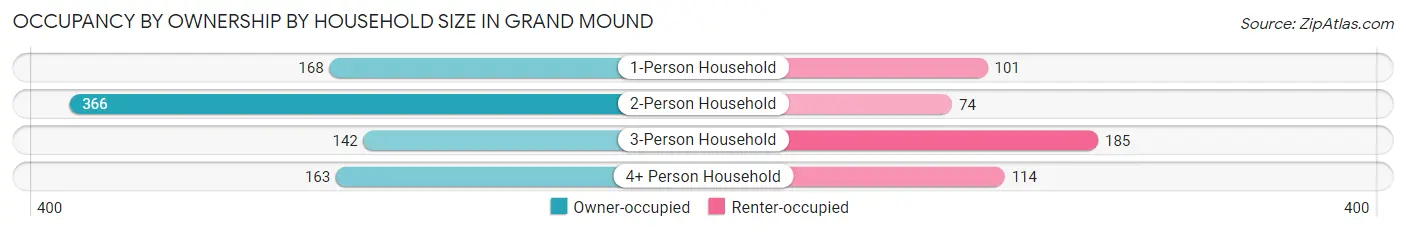
| Household Size | Owner-occupied | Renter-occupied |
| 1-Person Household | 168 (62.5%) | 101 (37.6%) |
| 2-Person Household | 366 (83.2%) | 74 (16.8%) |
| 3-Person Household | 142 (43.4%) | 185 (56.6%) |
| 4+ Person Household | 163 (58.8%) | 114 (41.2%) |
| Total Housing Units | 839 (63.9%) | 474 (36.1%) |
Occupancy by Educational Attainment in Grand Mound
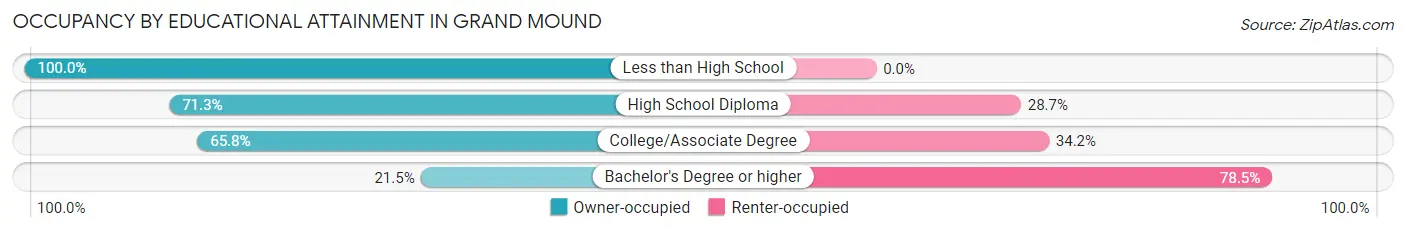
| Household Size | Owner-occupied | Renter-occupied |
| Less than High School | 105 (100.0%) | 0 (0.0%) |
| High School Diploma | 281 (71.3%) | 113 (28.7%) |
| College/Associate Degree | 413 (65.8%) | 215 (34.2%) |
| Bachelor's Degree or higher | 40 (21.5%) | 146 (78.5%) |
Occupancy by Age of Householder in Grand Mound
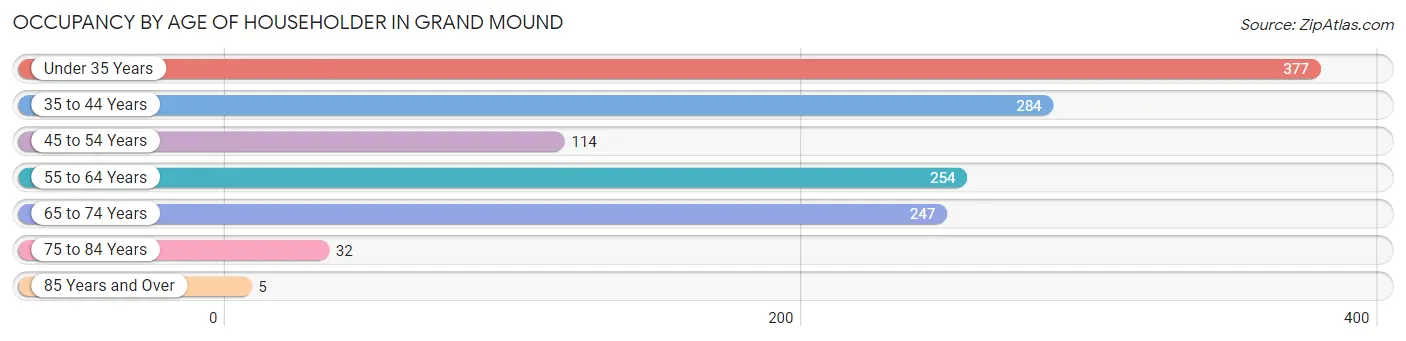
| Age Bracket | # Households | % Households |
| Under 35 Years | 377 | 28.7% |
| 35 to 44 Years | 284 | 21.6% |
| 45 to 54 Years | 114 | 8.7% |
| 55 to 64 Years | 254 | 19.4% |
| 65 to 74 Years | 247 | 18.8% |
| 75 to 84 Years | 32 | 2.4% |
| 85 Years and Over | 5 | 0.4% |
| Total | 1,313 | 100.0% |
Housing Finances in Grand Mound
Median Income by Occupancy in Grand Mound
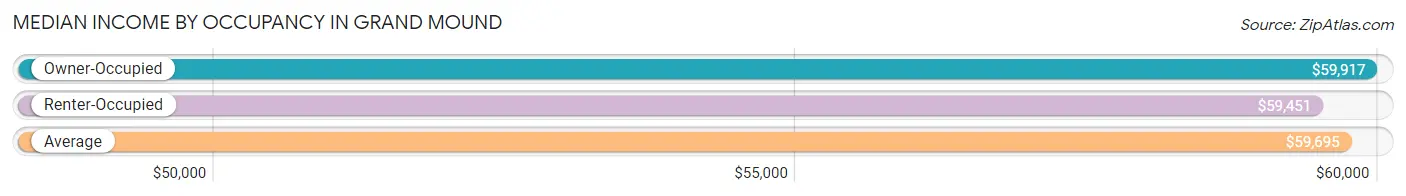
| Occupancy Type | # Households | Median Income |
| Owner-Occupied | 839 (63.9%) | $59,917 |
| Renter-Occupied | 474 (36.1%) | $59,451 |
| Average | 1,313 (100.0%) | $59,695 |
Occupancy by Householder Income Bracket in Grand Mound
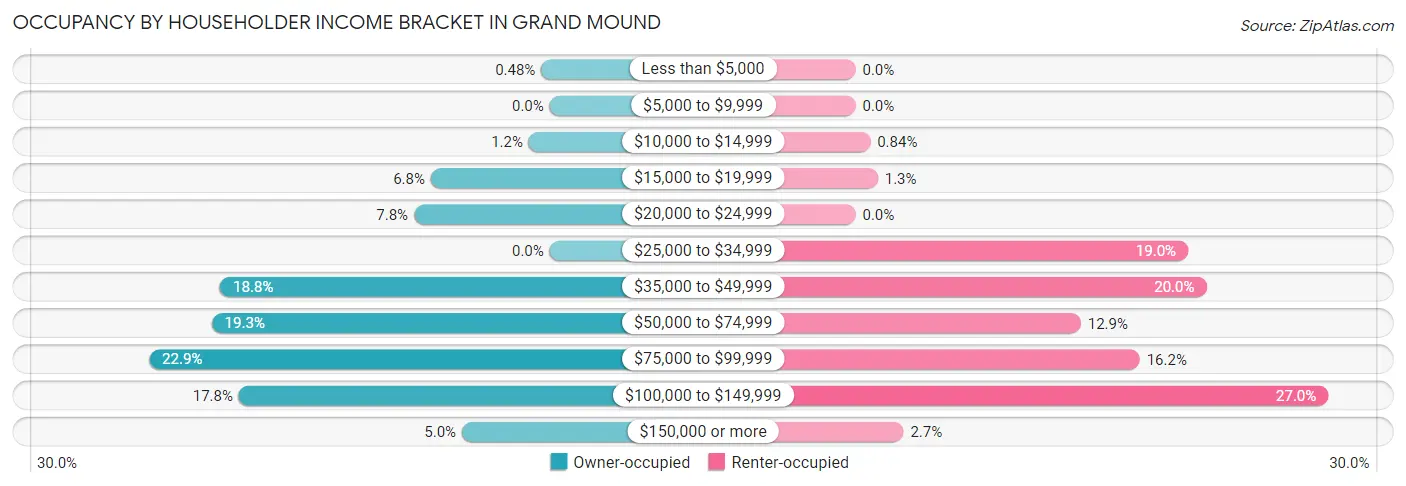
| Income Bracket | Owner-occupied | Renter-occupied |
| Less than $5,000 | 4 (0.5%) | 0 (0.0%) |
| $5,000 to $9,999 | 0 (0.0%) | 0 (0.0%) |
| $10,000 to $14,999 | 10 (1.2%) | 4 (0.8%) |
| $15,000 to $19,999 | 57 (6.8%) | 6 (1.3%) |
| $20,000 to $24,999 | 65 (7.7%) | 0 (0.0%) |
| $25,000 to $34,999 | 0 (0.0%) | 90 (19.0%) |
| $35,000 to $49,999 | 158 (18.8%) | 95 (20.0%) |
| $50,000 to $74,999 | 162 (19.3%) | 61 (12.9%) |
| $75,000 to $99,999 | 192 (22.9%) | 77 (16.2%) |
| $100,000 to $149,999 | 149 (17.8%) | 128 (27.0%) |
| $150,000 or more | 42 (5.0%) | 13 (2.7%) |
| Total | 839 (100.0%) | 474 (100.0%) |
Monthly Housing Cost Tiers in Grand Mound
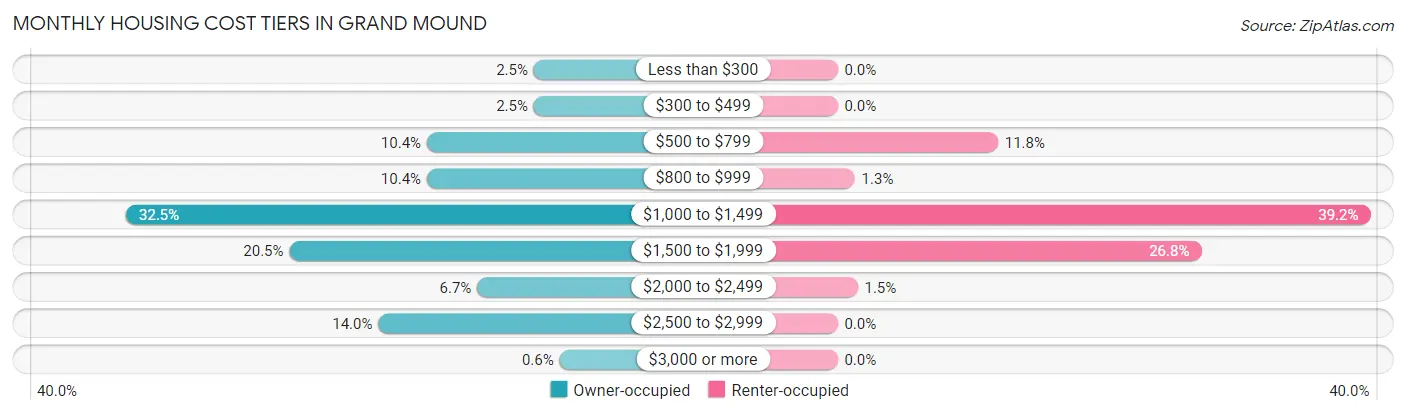
| Monthly Cost | Owner-occupied | Renter-occupied |
| Less than $300 | 21 (2.5%) | 0 (0.0%) |
| $300 to $499 | 21 (2.5%) | 0 (0.0%) |
| $500 to $799 | 87 (10.4%) | 56 (11.8%) |
| $800 to $999 | 87 (10.4%) | 6 (1.3%) |
| $1,000 to $1,499 | 273 (32.5%) | 186 (39.2%) |
| $1,500 to $1,999 | 172 (20.5%) | 127 (26.8%) |
| $2,000 to $2,499 | 56 (6.7%) | 7 (1.5%) |
| $2,500 to $2,999 | 117 (14.0%) | 0 (0.0%) |
| $3,000 or more | 5 (0.6%) | 0 (0.0%) |
| Total | 839 (100.0%) | 474 (100.0%) |
Physical Housing Characteristics in Grand Mound
Housing Structures in Grand Mound
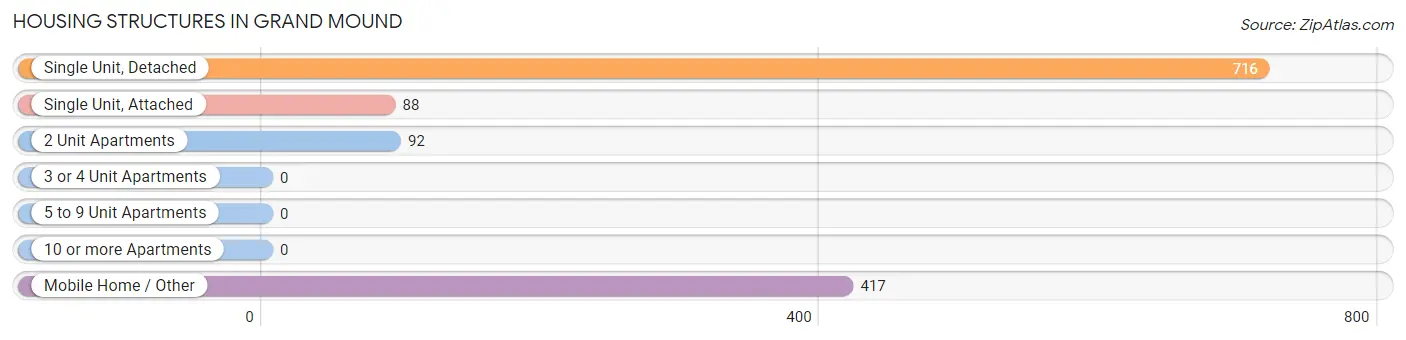
| Structure Type | # Housing Units | % Housing Units |
| Single Unit, Detached | 716 | 54.5% |
| Single Unit, Attached | 88 | 6.7% |
| 2 Unit Apartments | 92 | 7.0% |
| 3 or 4 Unit Apartments | 0 | 0.0% |
| 5 to 9 Unit Apartments | 0 | 0.0% |
| 10 or more Apartments | 0 | 0.0% |
| Mobile Home / Other | 417 | 31.8% |
| Total | 1,313 | 100.0% |
Housing Structures by Occupancy in Grand Mound
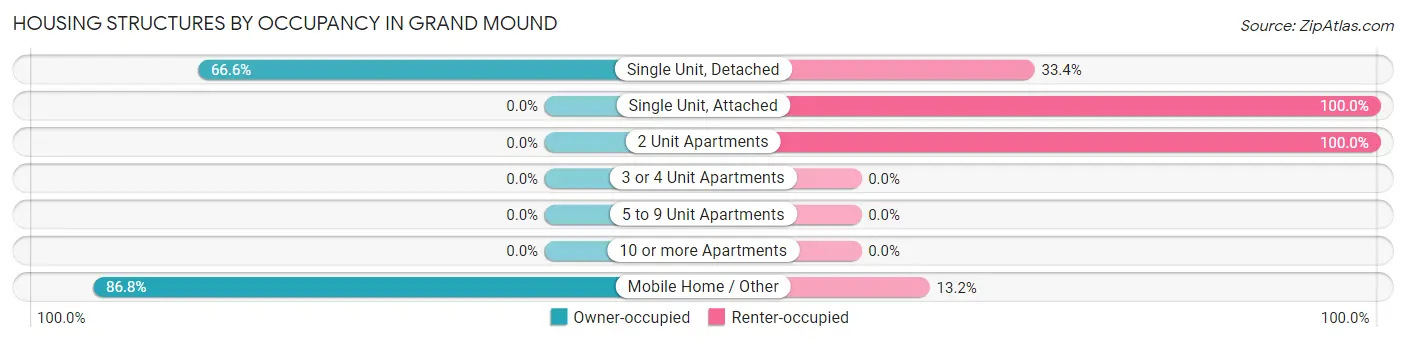
| Structure Type | Owner-occupied | Renter-occupied |
| Single Unit, Detached | 477 (66.6%) | 239 (33.4%) |
| Single Unit, Attached | 0 (0.0%) | 88 (100.0%) |
| 2 Unit Apartments | 0 (0.0%) | 92 (100.0%) |
| 3 or 4 Unit Apartments | 0 (0.0%) | 0 (0.0%) |
| 5 to 9 Unit Apartments | 0 (0.0%) | 0 (0.0%) |
| 10 or more Apartments | 0 (0.0%) | 0 (0.0%) |
| Mobile Home / Other | 362 (86.8%) | 55 (13.2%) |
| Total | 839 (63.9%) | 474 (36.1%) |
Housing Structures by Number of Rooms in Grand Mound
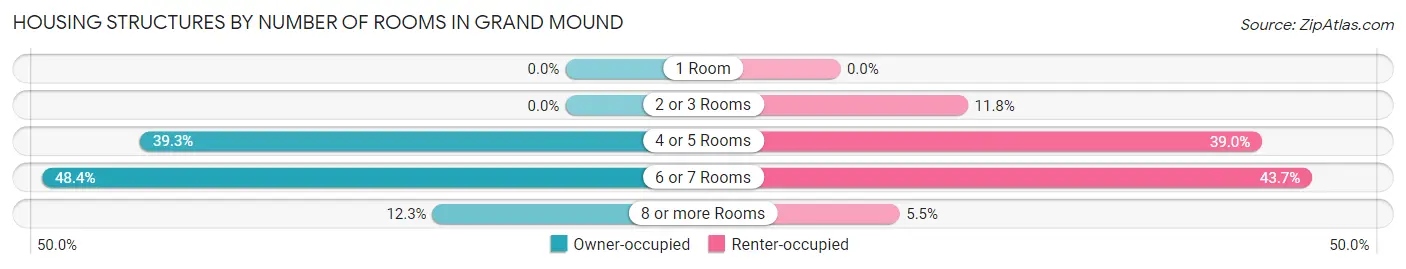
| Number of Rooms | Owner-occupied | Renter-occupied |
| 1 Room | 0 (0.0%) | 0 (0.0%) |
| 2 or 3 Rooms | 0 (0.0%) | 56 (11.8%) |
| 4 or 5 Rooms | 330 (39.3%) | 185 (39.0%) |
| 6 or 7 Rooms | 406 (48.4%) | 207 (43.7%) |
| 8 or more Rooms | 103 (12.3%) | 26 (5.5%) |
| Total | 839 (100.0%) | 474 (100.0%) |
Housing Structure by Heating Type in Grand Mound
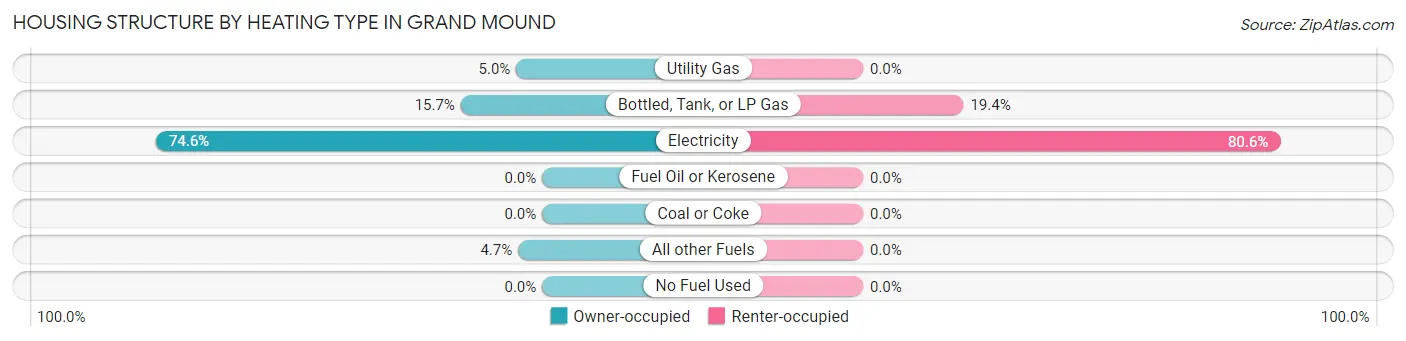
| Heating Type | Owner-occupied | Renter-occupied |
| Utility Gas | 42 (5.0%) | 0 (0.0%) |
| Bottled, Tank, or LP Gas | 132 (15.7%) | 92 (19.4%) |
| Electricity | 626 (74.6%) | 382 (80.6%) |
| Fuel Oil or Kerosene | 0 (0.0%) | 0 (0.0%) |
| Coal or Coke | 0 (0.0%) | 0 (0.0%) |
| All other Fuels | 39 (4.6%) | 0 (0.0%) |
| No Fuel Used | 0 (0.0%) | 0 (0.0%) |
| Total | 839 (100.0%) | 474 (100.0%) |
Household Vehicle Usage in Grand Mound
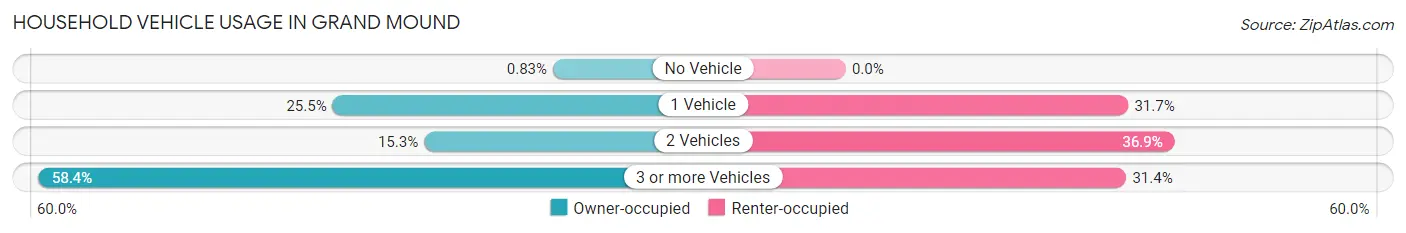
| Vehicles per Household | Owner-occupied | Renter-occupied |
| No Vehicle | 7 (0.8%) | 0 (0.0%) |
| 1 Vehicle | 214 (25.5%) | 150 (31.7%) |
| 2 Vehicles | 128 (15.3%) | 175 (36.9%) |
| 3 or more Vehicles | 490 (58.4%) | 149 (31.4%) |
| Total | 839 (100.0%) | 474 (100.0%) |
Real Estate & Mortgages in Grand Mound
Real Estate and Mortgage Overview in Grand Mound
| Characteristic | Without Mortgage | With Mortgage |
| Housing Units | 238 | 601 |
| Median Property Value | - | - |
| Median Household Income | $93,133 | $42 |
| Monthly Housing Costs | $755 | $5 |
| Real Estate Taxes | - | - |
Property Value by Mortgage Status in Grand Mound
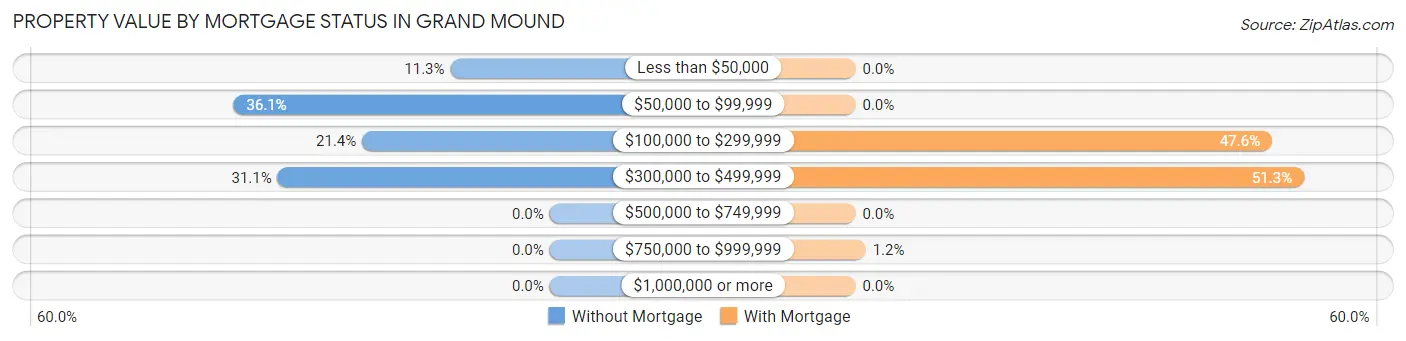
| Property Value | Without Mortgage | With Mortgage |
| Less than $50,000 | 27 (11.3%) | 0 (0.0%) |
| $50,000 to $99,999 | 86 (36.1%) | 0 (0.0%) |
| $100,000 to $299,999 | 51 (21.4%) | 286 (47.6%) |
| $300,000 to $499,999 | 74 (31.1%) | 308 (51.2%) |
| $500,000 to $749,999 | 0 (0.0%) | 0 (0.0%) |
| $750,000 to $999,999 | 0 (0.0%) | 7 (1.2%) |
| $1,000,000 or more | 0 (0.0%) | 0 (0.0%) |
| Total | 238 (100.0%) | 601 (100.0%) |
Household Income by Mortgage Status in Grand Mound
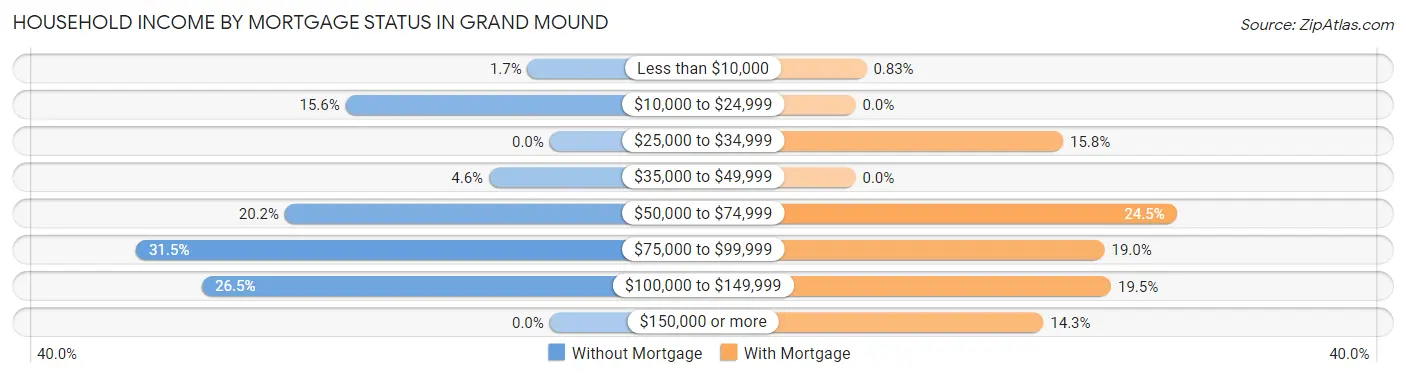
| Household Income | Without Mortgage | With Mortgage |
| Less than $10,000 | 4 (1.7%) | 5 (0.8%) |
| $10,000 to $24,999 | 37 (15.5%) | 0 (0.0%) |
| $25,000 to $34,999 | 0 (0.0%) | 95 (15.8%) |
| $35,000 to $49,999 | 11 (4.6%) | 0 (0.0%) |
| $50,000 to $74,999 | 48 (20.2%) | 147 (24.5%) |
| $75,000 to $99,999 | 75 (31.5%) | 114 (19.0%) |
| $100,000 to $149,999 | 63 (26.5%) | 117 (19.5%) |
| $150,000 or more | 0 (0.0%) | 86 (14.3%) |
| Total | 238 (100.0%) | 601 (100.0%) |
Property Value to Household Income Ratio in Grand Mound
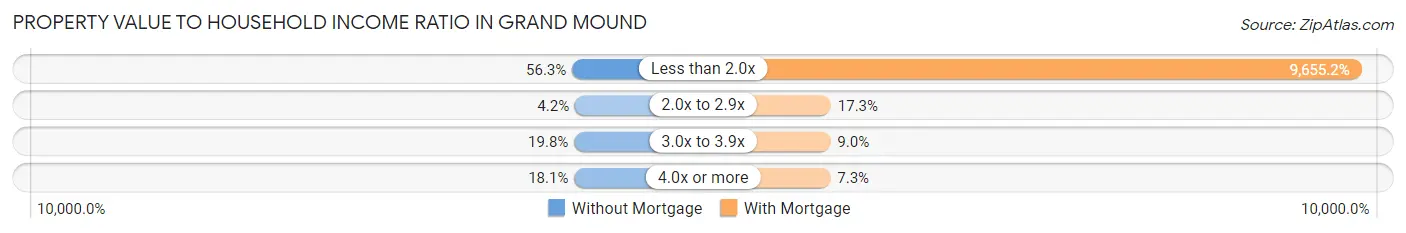
| Value-to-Income Ratio | Without Mortgage | With Mortgage |
| Less than 2.0x | 134 (56.3%) | 58,028 (9,655.2%) |
| 2.0x to 2.9x | 10 (4.2%) | 104 (17.3%) |
| 3.0x to 3.9x | 47 (19.8%) | 54 (9.0%) |
| 4.0x or more | 43 (18.1%) | 44 (7.3%) |
| Total | 238 (100.0%) | 601 (100.0%) |
Real Estate Taxes by Mortgage Status in Grand Mound
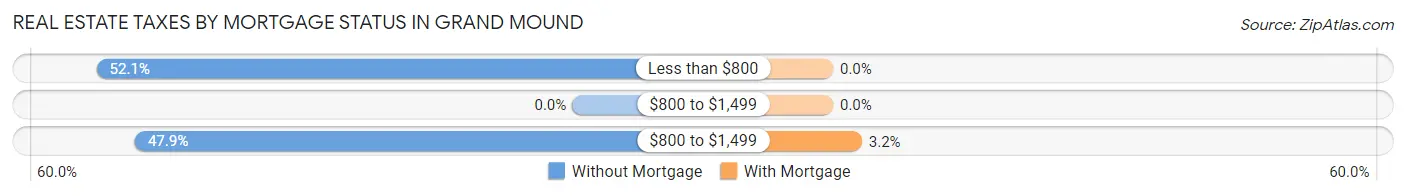
| Property Taxes | Without Mortgage | With Mortgage |
| Less than $800 | 124 (52.1%) | 0 (0.0%) |
| $800 to $1,499 | 0 (0.0%) | 0 (0.0%) |
| $800 to $1,499 | 114 (47.9%) | 19 (3.2%) |
| Total | 238 (100.0%) | 601 (100.0%) |
Health & Disability in Grand Mound
Health Insurance Coverage by Age in Grand Mound
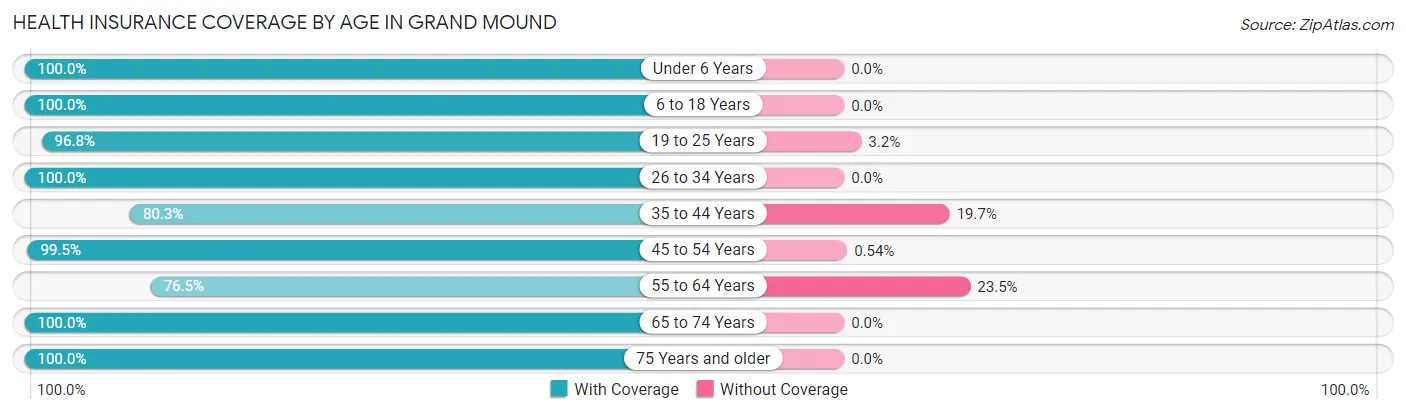
| Age Bracket | With Coverage | Without Coverage |
| Under 6 Years | 406 (100.0%) | 0 (0.0%) |
| 6 to 18 Years | 583 (100.0%) | 0 (0.0%) |
| 19 to 25 Years | 91 (96.8%) | 3 (3.2%) |
| 26 to 34 Years | 742 (100.0%) | 0 (0.0%) |
| 35 to 44 Years | 478 (80.3%) | 117 (19.7%) |
| 45 to 54 Years | 183 (99.5%) | 1 (0.5%) |
| 55 to 64 Years | 322 (76.5%) | 99 (23.5%) |
| 65 to 74 Years | 378 (100.0%) | 0 (0.0%) |
| 75 Years and older | 39 (100.0%) | 0 (0.0%) |
| Total | 3,222 (93.6%) | 220 (6.4%) |
Health Insurance Coverage by Citizenship Status in Grand Mound
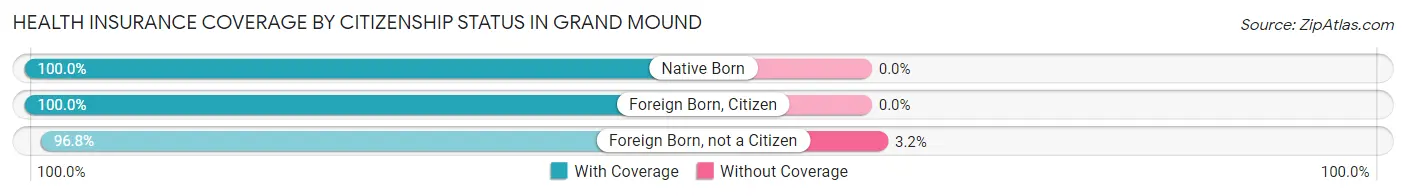
| Citizenship Status | With Coverage | Without Coverage |
| Native Born | 406 (100.0%) | 0 (0.0%) |
| Foreign Born, Citizen | 583 (100.0%) | 0 (0.0%) |
| Foreign Born, not a Citizen | 91 (96.8%) | 3 (3.2%) |
Health Insurance Coverage by Household Income in Grand Mound
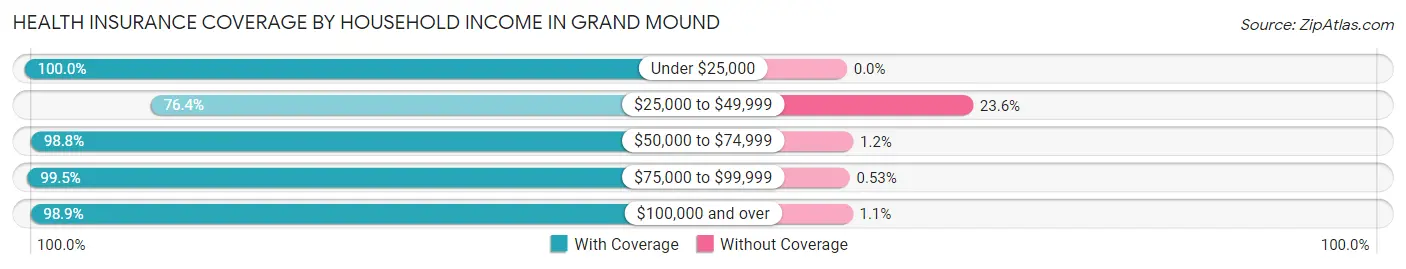
| Household Income | With Coverage | Without Coverage |
| Under $25,000 | 288 (100.0%) | 0 (0.0%) |
| $25,000 to $49,999 | 643 (76.4%) | 199 (23.6%) |
| $50,000 to $74,999 | 420 (98.8%) | 5 (1.2%) |
| $75,000 to $99,999 | 757 (99.5%) | 4 (0.5%) |
| $100,000 and over | 1,114 (98.9%) | 12 (1.1%) |
Public vs Private Health Insurance Coverage by Age in Grand Mound
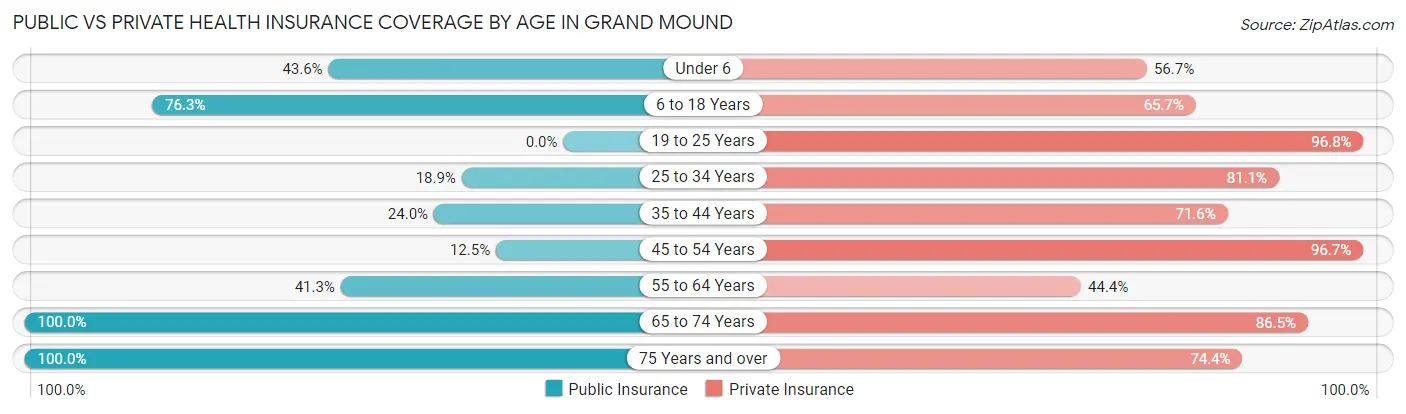
| Age Bracket | Public Insurance | Private Insurance |
| Under 6 | 177 (43.6%) | 230 (56.7%) |
| 6 to 18 Years | 445 (76.3%) | 383 (65.7%) |
| 19 to 25 Years | 0 (0.0%) | 91 (96.8%) |
| 25 to 34 Years | 140 (18.9%) | 602 (81.1%) |
| 35 to 44 Years | 143 (24.0%) | 426 (71.6%) |
| 45 to 54 Years | 23 (12.5%) | 178 (96.7%) |
| 55 to 64 Years | 174 (41.3%) | 187 (44.4%) |
| 65 to 74 Years | 378 (100.0%) | 327 (86.5%) |
| 75 Years and over | 39 (100.0%) | 29 (74.4%) |
| Total | 1,519 (44.1%) | 2,453 (71.3%) |
Disability Status by Sex by Age in Grand Mound
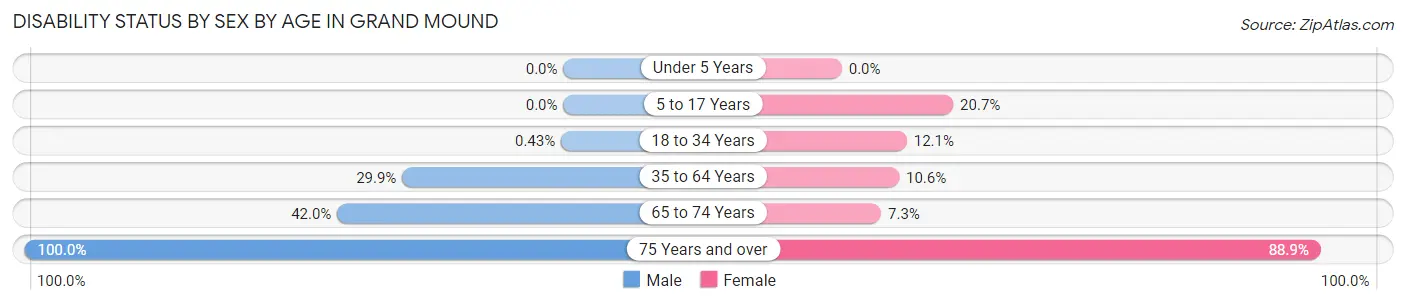
| Age Bracket | Male | Female |
| Under 5 Years | 0 (0.0%) | 0 (0.0%) |
| 5 to 17 Years | 0 (0.0%) | 74 (20.7%) |
| 18 to 34 Years | 2 (0.4%) | 45 (12.1%) |
| 35 to 64 Years | 128 (29.9%) | 82 (10.6%) |
| 65 to 74 Years | 55 (42.0%) | 18 (7.3%) |
| 75 Years and over | 21 (100.0%) | 16 (88.9%) |
Disability Class by Sex by Age in Grand Mound
Disability Class: Hearing Difficulty
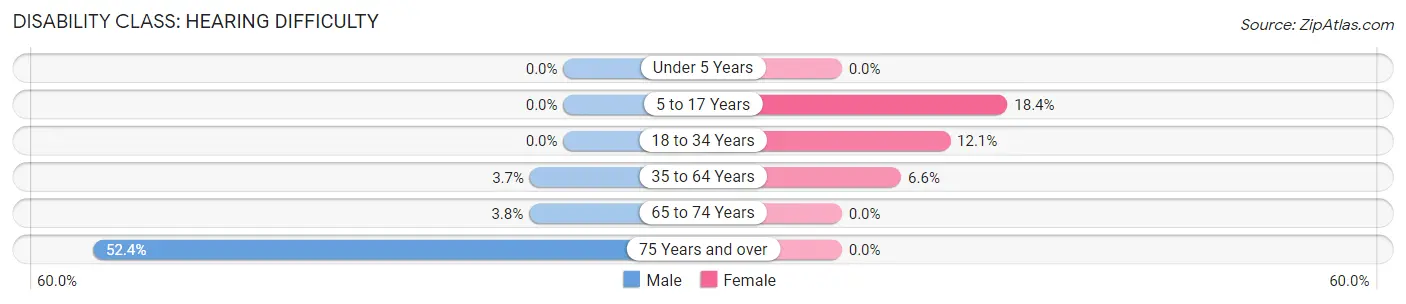
| Age Bracket | Male | Female |
| Under 5 Years | 0 (0.0%) | 0 (0.0%) |
| 5 to 17 Years | 0 (0.0%) | 66 (18.4%) |
| 18 to 34 Years | 0 (0.0%) | 45 (12.1%) |
| 35 to 64 Years | 16 (3.7%) | 51 (6.6%) |
| 65 to 74 Years | 5 (3.8%) | 0 (0.0%) |
| 75 Years and over | 11 (52.4%) | 0 (0.0%) |
Disability Class: Vision Difficulty
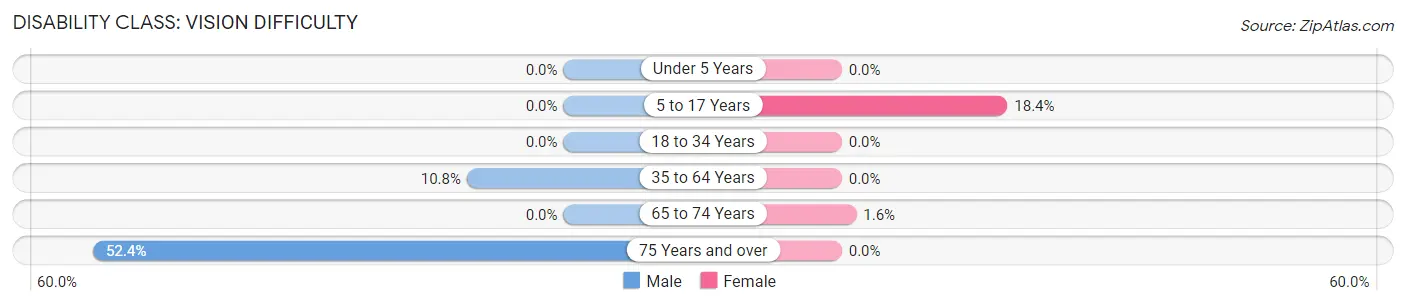
| Age Bracket | Male | Female |
| Under 5 Years | 0 (0.0%) | 0 (0.0%) |
| 5 to 17 Years | 0 (0.0%) | 66 (18.4%) |
| 18 to 34 Years | 0 (0.0%) | 0 (0.0%) |
| 35 to 64 Years | 46 (10.7%) | 0 (0.0%) |
| 65 to 74 Years | 0 (0.0%) | 4 (1.6%) |
| 75 Years and over | 11 (52.4%) | 0 (0.0%) |
Disability Class: Cognitive Difficulty
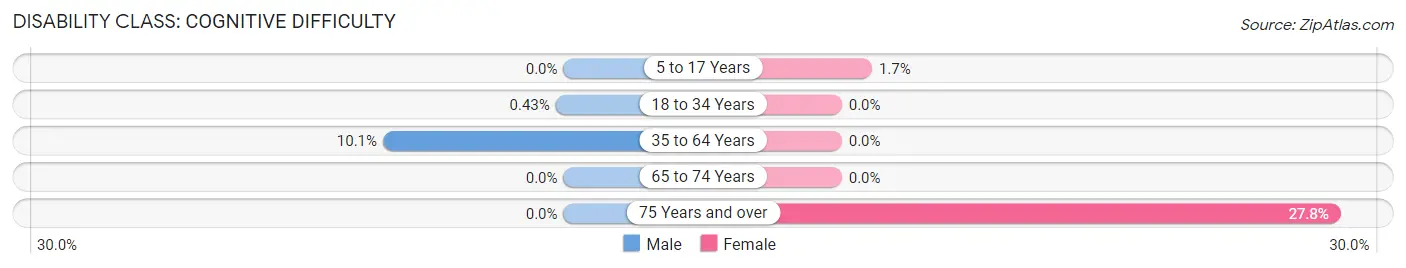
| Age Bracket | Male | Female |
| 5 to 17 Years | 0 (0.0%) | 6 (1.7%) |
| 18 to 34 Years | 2 (0.4%) | 0 (0.0%) |
| 35 to 64 Years | 43 (10.1%) | 0 (0.0%) |
| 65 to 74 Years | 0 (0.0%) | 0 (0.0%) |
| 75 Years and over | 0 (0.0%) | 5 (27.8%) |
Disability Class: Ambulatory Difficulty
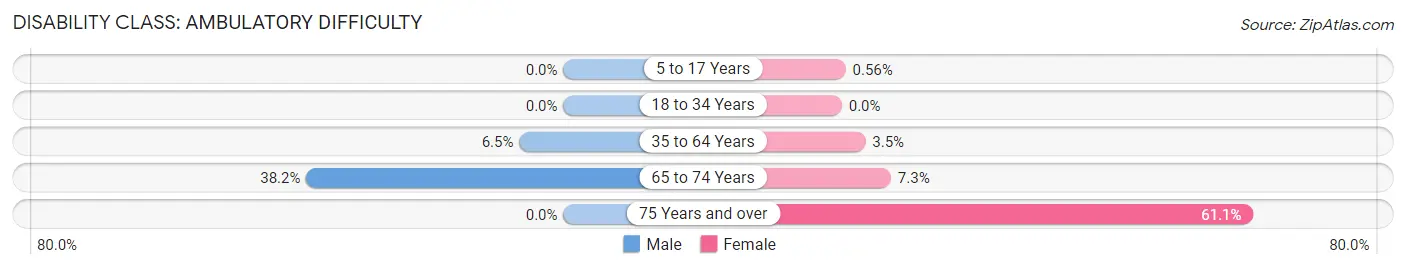
| Age Bracket | Male | Female |
| 5 to 17 Years | 0 (0.0%) | 2 (0.6%) |
| 18 to 34 Years | 0 (0.0%) | 0 (0.0%) |
| 35 to 64 Years | 28 (6.5%) | 27 (3.5%) |
| 65 to 74 Years | 50 (38.2%) | 18 (7.3%) |
| 75 Years and over | 0 (0.0%) | 11 (61.1%) |
Disability Class: Self-Care Difficulty
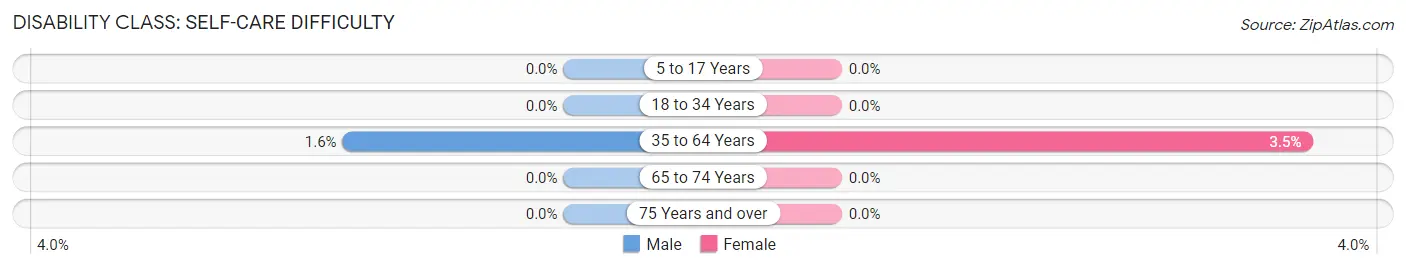
| Age Bracket | Male | Female |
| 5 to 17 Years | 0 (0.0%) | 0 (0.0%) |
| 18 to 34 Years | 0 (0.0%) | 0 (0.0%) |
| 35 to 64 Years | 7 (1.6%) | 27 (3.5%) |
| 65 to 74 Years | 0 (0.0%) | 0 (0.0%) |
| 75 Years and over | 0 (0.0%) | 0 (0.0%) |
Technology Access in Grand Mound
Computing Device Access in Grand Mound
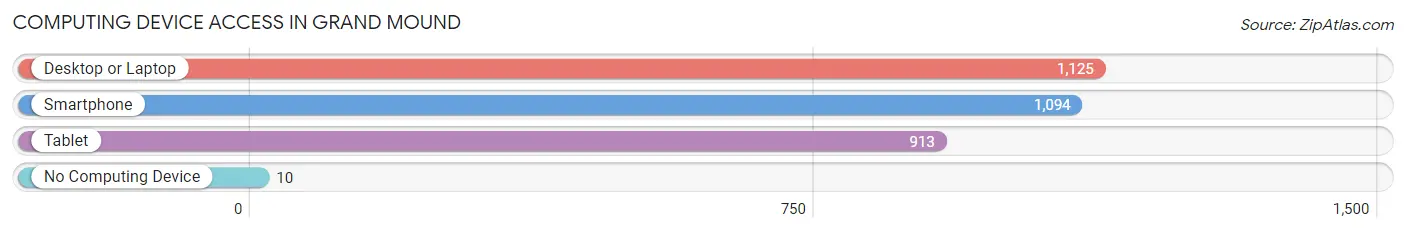
| Device Type | # Households | % Households |
| Desktop or Laptop | 1,125 | 85.7% |
| Smartphone | 1,094 | 83.3% |
| Tablet | 913 | 69.5% |
| No Computing Device | 10 | 0.8% |
| Total | 1,313 | 100.0% |
Internet Access in Grand Mound
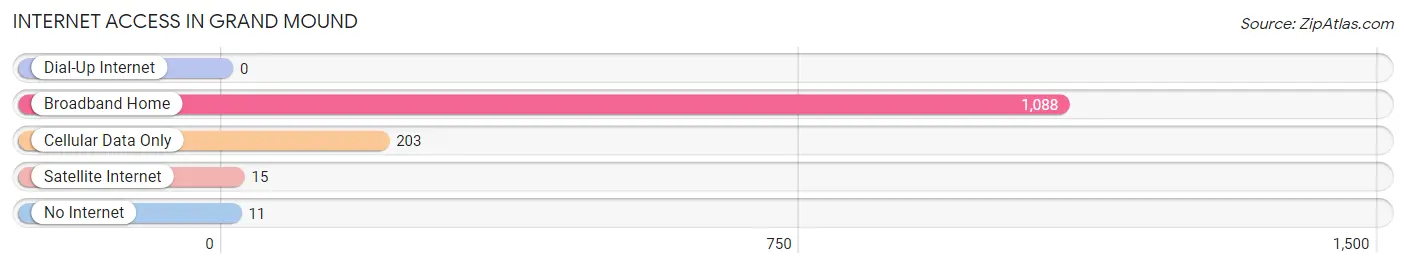
| Internet Type | # Households | % Households |
| Dial-Up Internet | 0 | 0.0% |
| Broadband Home | 1,088 | 82.9% |
| Cellular Data Only | 203 | 15.5% |
| Satellite Internet | 15 | 1.1% |
| No Internet | 11 | 0.8% |
| Total | 1,313 | 100.0% |
Grand Mound Summary
Grand Mound is a small unincorporated community located in Thurston County, Washington, United States. It is located approximately 10 miles south of Olympia, the state capital. Grand Mound is situated in the Nisqually River Valley, and is surrounded by the Black Hills to the east and the Cascade Mountains to the west. The population of Grand Mound was estimated to be 1,845 in 2019.
History
Grand Mound was first settled in the late 1850s by settlers from the Oregon Territory. The area was originally known as “Grand Mound Prairie” due to the large mound of earth that was located in the area. The mound was believed to have been created by Native Americans, and was used as a lookout point. The area was later renamed “Grand Mound” in 1871.
The area was primarily used for farming and logging until the early 1900s, when the area began to be developed for residential use. The first post office was established in Grand Mound in 1906. In the 1950s, the area began to experience rapid growth due to the construction of Interstate 5, which runs through the area.
Geography
Grand Mound is located in the Nisqually River Valley, which is surrounded by the Black Hills to the east and the Cascade Mountains to the west. The area is characterized by rolling hills and lush forests. The climate in Grand Mound is mild, with temperatures ranging from the mid-30s in the winter to the mid-70s in the summer.
Economy
Grand Mound’s economy is primarily based on tourism and retail. The area is home to several tourist attractions, including the Grand Mound Historic Site, which is a National Historic Landmark. The area is also home to several retail stores, including a Walmart Supercenter, a Safeway grocery store, and several restaurants.
Demographics
As of 2019, the population of Grand Mound was estimated to be 1,845. The population is primarily white (90.2%), with smaller percentages of Hispanic (3.2%), African American (2.2%), and Asian (1.7%) residents. The median household income in Grand Mound is $50,945, and the median age is 39.7 years.
Conclusion
Grand Mound is a small unincorporated community located in Thurston County, Washington. It is situated in the Nisqually River Valley, and is surrounded by the Black Hills to the east and the Cascade Mountains to the west. The area was first settled in the late 1850s, and has since become a popular tourist destination. The population of Grand Mound is primarily white, with a median household income of $50,945 and a median age of 39.7 years. The economy of Grand Mound is primarily based on tourism and retail.
Common Questions
What is Per Capita Income in Grand Mound?
Per Capita income in Grand Mound is $28,479.
What is the Median Family Income in Grand Mound?
Median Family Income in Grand Mound is $80,406.
What is the Median Household income in Grand Mound?
Median Household Income in Grand Mound is $59,695.
What is Income or Wage Gap in Grand Mound?
Income or Wage Gap in Grand Mound is 10.3%.
Women in Grand Mound earn 89.7 cents for every dollar earned by a man.
What is Inequality or Gini Index in Grand Mound?
Inequality or Gini Index in Grand Mound is 0.29.
What is the Total Population of Grand Mound?
Total Population of Grand Mound is 3,442.
What is the Total Male Population of Grand Mound?
Total Male Population of Grand Mound is 1,449.
What is the Total Female Population of Grand Mound?
Total Female Population of Grand Mound is 1,993.
What is the Ratio of Males per 100 Females in Grand Mound?
There are 72.70 Males per 100 Females in Grand Mound.
What is the Ratio of Females per 100 Males in Grand Mound?
There are 137.54 Females per 100 Males in Grand Mound.
What is the Median Population Age in Grand Mound?
Median Population Age in Grand Mound is 33.5 Years.
What is the Average Family Size in Grand Mound
Average Family Size in Grand Mound is 3.3 People.
What is the Average Household Size in Grand Mound
Average Household Size in Grand Mound is 2.6 People.
How Large is the Labor Force in Grand Mound?
There are 1,577 People in the Labor Forcein in Grand Mound.
What is the Percentage of People in the Labor Force in Grand Mound?
59.9% of People are in the Labor Force in Grand Mound.
What is the Unemployment Rate in Grand Mound?
Unemployment Rate in Grand Mound is 5.1%.