Liberty Lake, WA Map & Demographics
Liberty Lake Map
Liberty Lake Overview
$48,512
PER CAPITA INCOME
$122,787
AVG FAMILY INCOME
$101,936
AVG HOUSEHOLD INCOME
37.3%
WAGE / INCOME GAP [ % ]
62.7¢/ $1
WAGE / INCOME GAP [ $ ]
0.44
INEQUALITY / GINI INDEX
12,026
TOTAL POPULATION
5,659
MALE POPULATION
6,367
FEMALE POPULATION
88.88
MALES / 100 FEMALES
112.51
FEMALES / 100 MALES
36.9
MEDIAN AGE
3.3
AVG FAMILY SIZE
2.7
AVG HOUSEHOLD SIZE
5,559
LABOR FORCE [ PEOPLE ]
63.2%
PERCENT IN LABOR FORCE
4.7%
UNEMPLOYMENT RATE
Liberty Lake Zip Codes
Liberty Lake Area Codes
Income in Liberty Lake
Income Overview in Liberty Lake
Per Capita Income in Liberty Lake is $48,512, while median incomes of families and households are $122,787 and $101,936 respectively.
| Characteristic | Number | Measure |
| Per Capita Income | 12,026 | $48,512 |
| Median Family Income | 3,107 | $122,787 |
| Mean Family Income | 3,107 | $169,034 |
| Median Household Income | 4,401 | $101,936 |
| Mean Household Income | 4,401 | $139,037 |
| Income Deficit | 3,107 | $0 |
| Wage / Income Gap (%) | 12,026 | 37.35% |
| Wage / Income Gap ($) | 12,026 | 62.65¢ per $1 |
| Gini / Inequality Index | 12,026 | 0.44 |
Earnings by Sex in Liberty Lake
Average Earnings in Liberty Lake are $57,406, $67,479 for men and $42,278 for women, a difference of 37.3%.
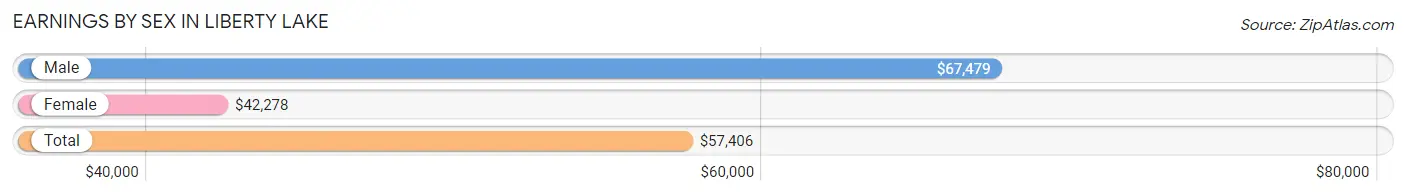
| Sex | Number | Average Earnings |
| Male | 2,779 (47.0%) | $67,479 |
| Female | 3,128 (52.9%) | $42,278 |
| Total | 5,907 (100.0%) | $57,406 |
Earnings by Sex by Income Bracket in Liberty Lake
The most common earnings brackets in Liberty Lake are $100,000+ for men (1,089 | 39.2%) and $100,000+ for women (553 | 17.7%).
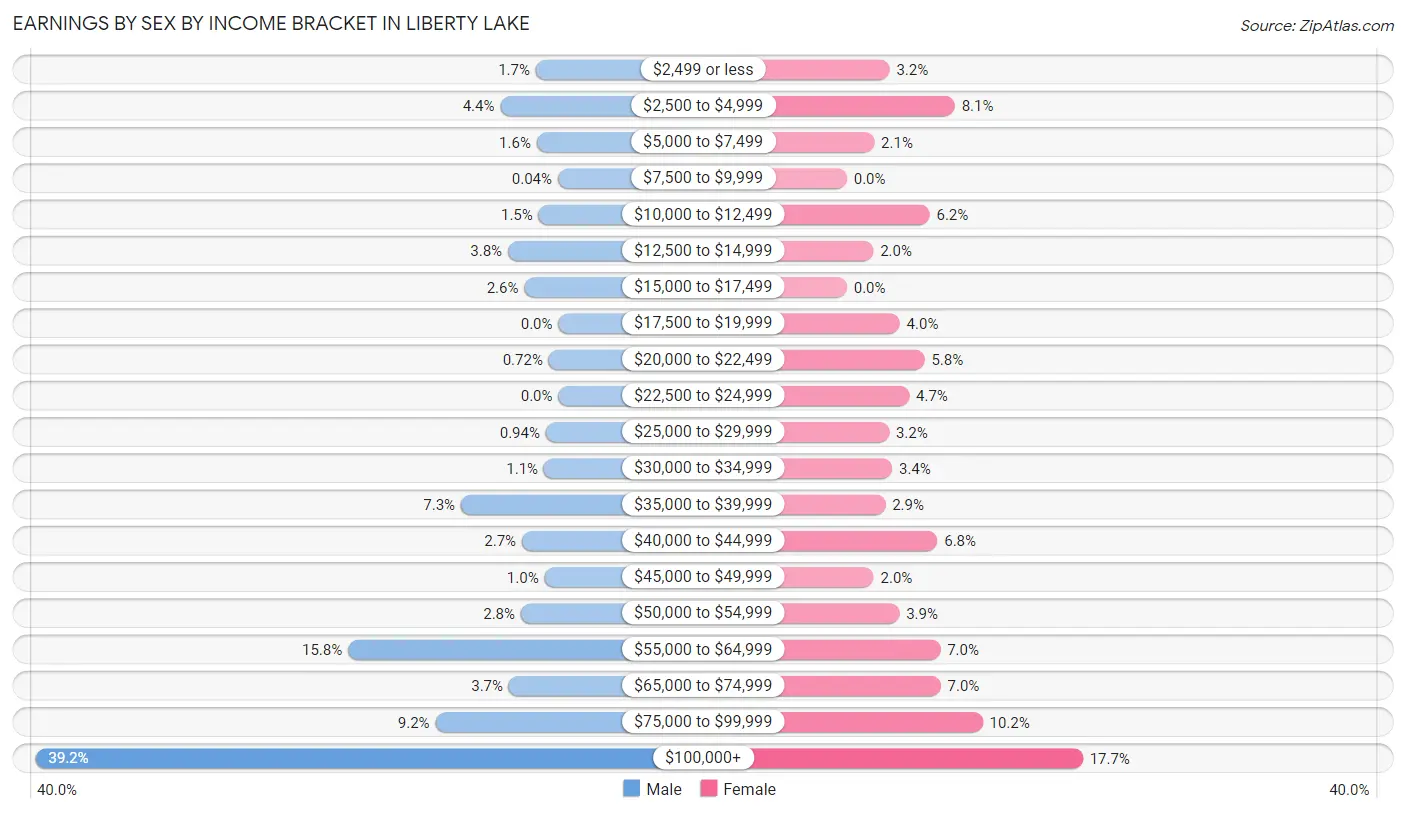
| Income | Male | Female |
| $2,499 or less | 47 (1.7%) | 100 (3.2%) |
| $2,500 to $4,999 | 121 (4.3%) | 253 (8.1%) |
| $5,000 to $7,499 | 45 (1.6%) | 64 (2.1%) |
| $7,500 to $9,999 | 1 (0.0%) | 0 (0.0%) |
| $10,000 to $12,499 | 41 (1.5%) | 194 (6.2%) |
| $12,500 to $14,999 | 105 (3.8%) | 62 (2.0%) |
| $15,000 to $17,499 | 71 (2.5%) | 0 (0.0%) |
| $17,500 to $19,999 | 0 (0.0%) | 124 (4.0%) |
| $20,000 to $22,499 | 20 (0.7%) | 182 (5.8%) |
| $22,500 to $24,999 | 0 (0.0%) | 146 (4.7%) |
| $25,000 to $29,999 | 26 (0.9%) | 99 (3.2%) |
| $30,000 to $34,999 | 30 (1.1%) | 106 (3.4%) |
| $35,000 to $39,999 | 203 (7.3%) | 90 (2.9%) |
| $40,000 to $44,999 | 76 (2.7%) | 212 (6.8%) |
| $45,000 to $49,999 | 29 (1.0%) | 63 (2.0%) |
| $50,000 to $54,999 | 78 (2.8%) | 123 (3.9%) |
| $55,000 to $64,999 | 438 (15.8%) | 219 (7.0%) |
| $65,000 to $74,999 | 103 (3.7%) | 220 (7.0%) |
| $75,000 to $99,999 | 256 (9.2%) | 318 (10.2%) |
| $100,000+ | 1,089 (39.2%) | 553 (17.7%) |
| Total | 2,779 (100.0%) | 3,128 (100.0%) |
Earnings by Sex by Educational Attainment in Liberty Lake
Average earnings in Liberty Lake are $82,971 for men and $51,032 for women, a difference of 38.5%. Men with an educational attainment of graduate degree enjoy the highest average annual earnings of $207,083, while those with college or associate's degree education earn the least with $59,495. Women with an educational attainment of bachelor's degree earn the most with the average annual earnings of $93,113, while those with high school diploma education have the smallest earnings of $18,800.
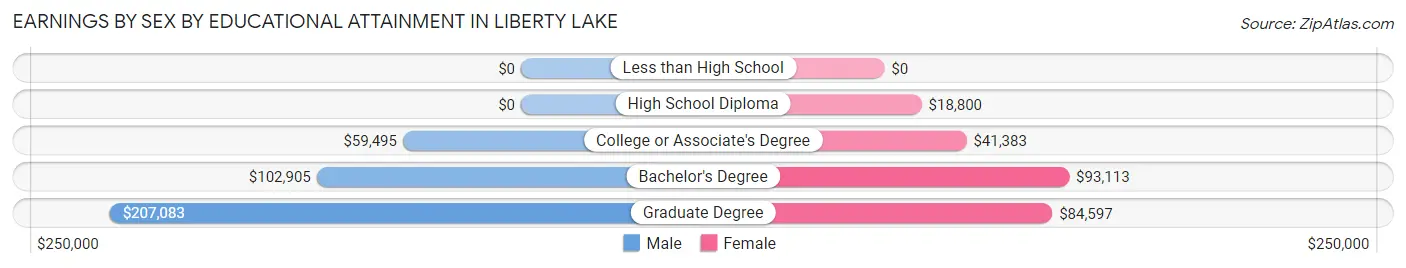
| Educational Attainment | Male Income | Female Income |
| Less than High School | - | - |
| High School Diploma | - | - |
| College or Associate's Degree | $59,495 | $41,383 |
| Bachelor's Degree | $102,905 | $93,113 |
| Graduate Degree | $207,083 | $84,597 |
| Total | $82,971 | $51,032 |
Family Income in Liberty Lake
Family Income Brackets in Liberty Lake
According to the Liberty Lake family income data, there are 923 families falling into the $200,000+ income range, which is the most common income bracket and makes up 29.7% of all families.
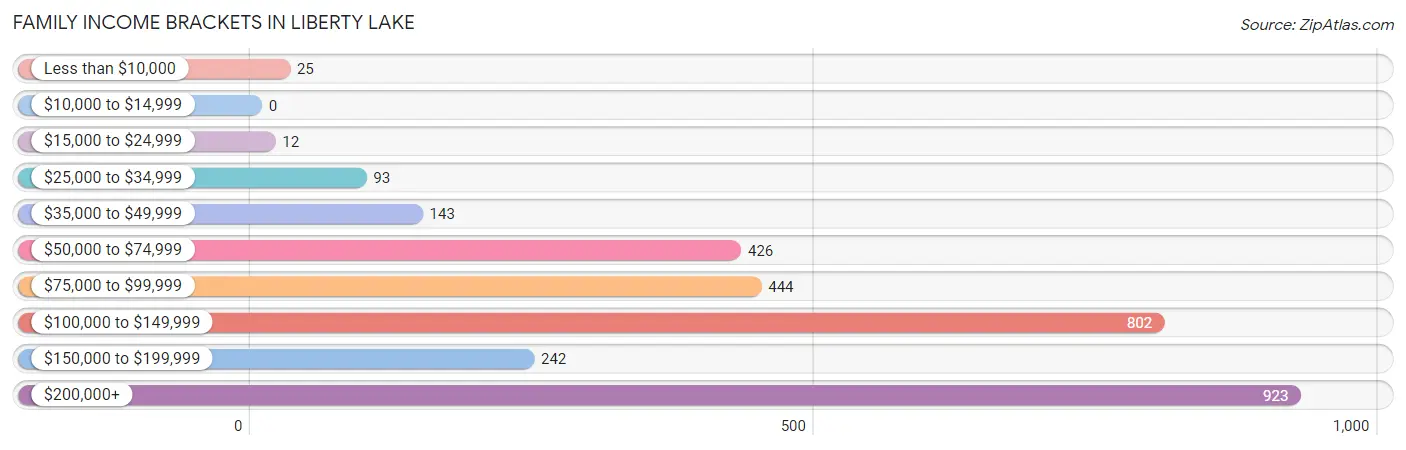
| Income Bracket | # Families | % Families |
| Less than $10,000 | 25 | 0.8% |
| $10,000 to $14,999 | 0 | 0.0% |
| $15,000 to $24,999 | 12 | 0.4% |
| $25,000 to $34,999 | 93 | 3.0% |
| $35,000 to $49,999 | 143 | 4.6% |
| $50,000 to $74,999 | 426 | 13.7% |
| $75,000 to $99,999 | 444 | 14.3% |
| $100,000 to $149,999 | 802 | 25.8% |
| $150,000 to $199,999 | 242 | 7.8% |
| $200,000+ | 923 | 29.7% |
Family Income by Famaliy Size in Liberty Lake
6-person families (370 | 11.9%) account for the highest median family income in Liberty Lake with $250,001 per family, while 2-person families (1,181 | 38.0%) have the highest median income of $51,075 per family member.
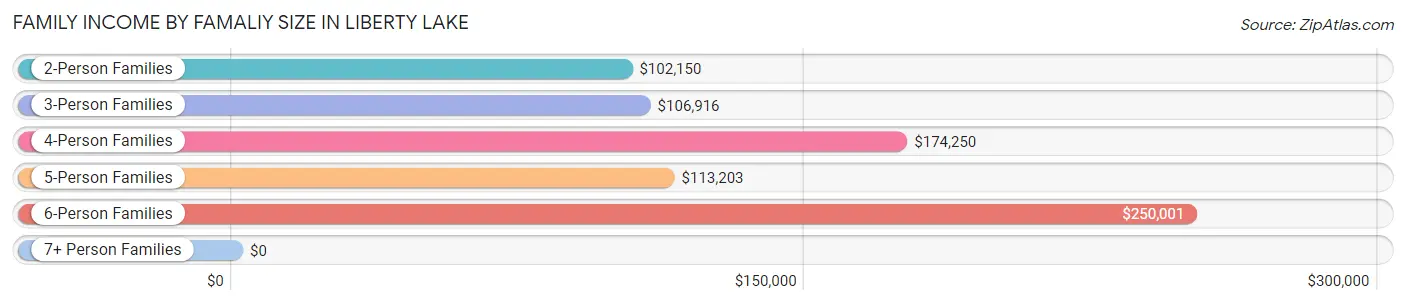
| Income Bracket | # Families | Median Income |
| 2-Person Families | 1,181 (38.0%) | $102,150 |
| 3-Person Families | 532 (17.1%) | $106,916 |
| 4-Person Families | 789 (25.4%) | $174,250 |
| 5-Person Families | 235 (7.6%) | $113,203 |
| 6-Person Families | 370 (11.9%) | $250,001 |
| 7+ Person Families | 0 (0.0%) | $0 |
| Total | 3,107 (100.0%) | $122,787 |
Family Income by Number of Earners in Liberty Lake
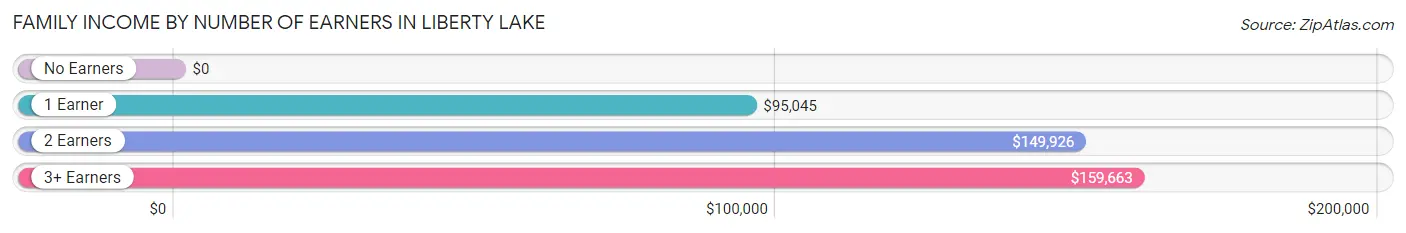
| Number of Earners | # Families | Median Income |
| No Earners | 328 (10.6%) | $0 |
| 1 Earner | 1,033 (33.3%) | $95,045 |
| 2 Earners | 1,411 (45.4%) | $149,926 |
| 3+ Earners | 335 (10.8%) | $159,663 |
| Total | 3,107 (100.0%) | $122,787 |
Household Income in Liberty Lake
Household Income Brackets in Liberty Lake
With 1,047 households falling in the category, the $100,000 to $149,999 income range is the most frequent in Liberty Lake, accounting for 23.8% of all households. In contrast, only 48 households (1.1%) fall into the $15,000 to $24,999 income bracket, making it the least populous group.
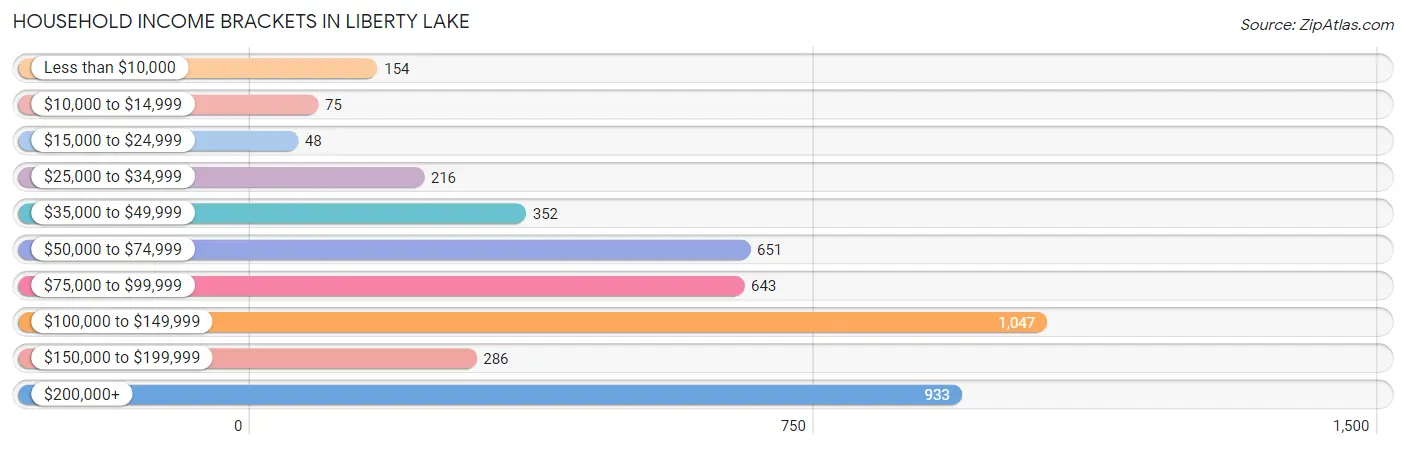
| Income Bracket | # Households | % Households |
| Less than $10,000 | 154 | 3.5% |
| $10,000 to $14,999 | 75 | 1.7% |
| $15,000 to $24,999 | 48 | 1.1% |
| $25,000 to $34,999 | 216 | 4.9% |
| $35,000 to $49,999 | 352 | 8.0% |
| $50,000 to $74,999 | 651 | 14.8% |
| $75,000 to $99,999 | 643 | 14.6% |
| $100,000 to $149,999 | 1,047 | 23.8% |
| $150,000 to $199,999 | 286 | 6.5% |
| $200,000+ | 933 | 21.2% |
Household Income by Householder Age in Liberty Lake
The median household income in Liberty Lake is $101,936, with the highest median household income of $126,875 found in the 45 to 64 years age bracket for the primary householder. A total of 1,440 households (32.7%) fall into this category. Meanwhile, the 15 to 24 years age bracket for the primary householder has the lowest median household income of $0, with 28 households (0.6%) in this group.
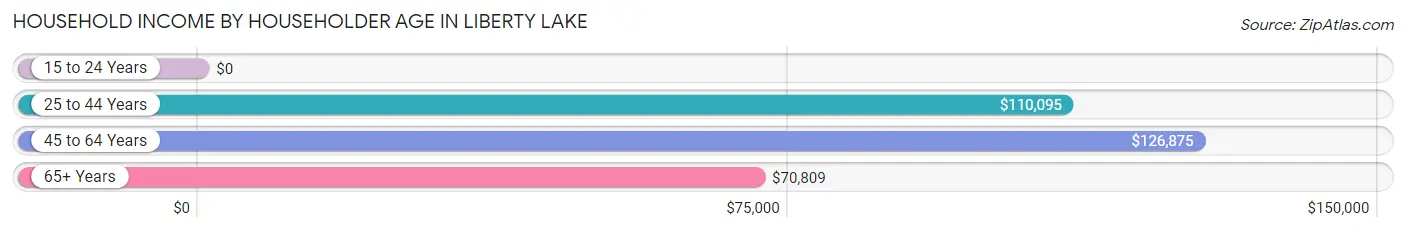
| Income Bracket | # Households | Median Income |
| 15 to 24 Years | 28 (0.6%) | $0 |
| 25 to 44 Years | 1,783 (40.5%) | $110,095 |
| 45 to 64 Years | 1,440 (32.7%) | $126,875 |
| 65+ Years | 1,150 (26.1%) | $70,809 |
| Total | 4,401 (100.0%) | $101,936 |
Poverty in Liberty Lake
Income Below Poverty by Sex and Age in Liberty Lake
With 1.8% poverty level for males and 7.3% for females among the residents of Liberty Lake, 25 to 34 year old males and 18 to 24 year old females are the most vulnerable to poverty, with 53 males (12.7%) and 77 females (20.0%) in their respective age groups living below the poverty level.
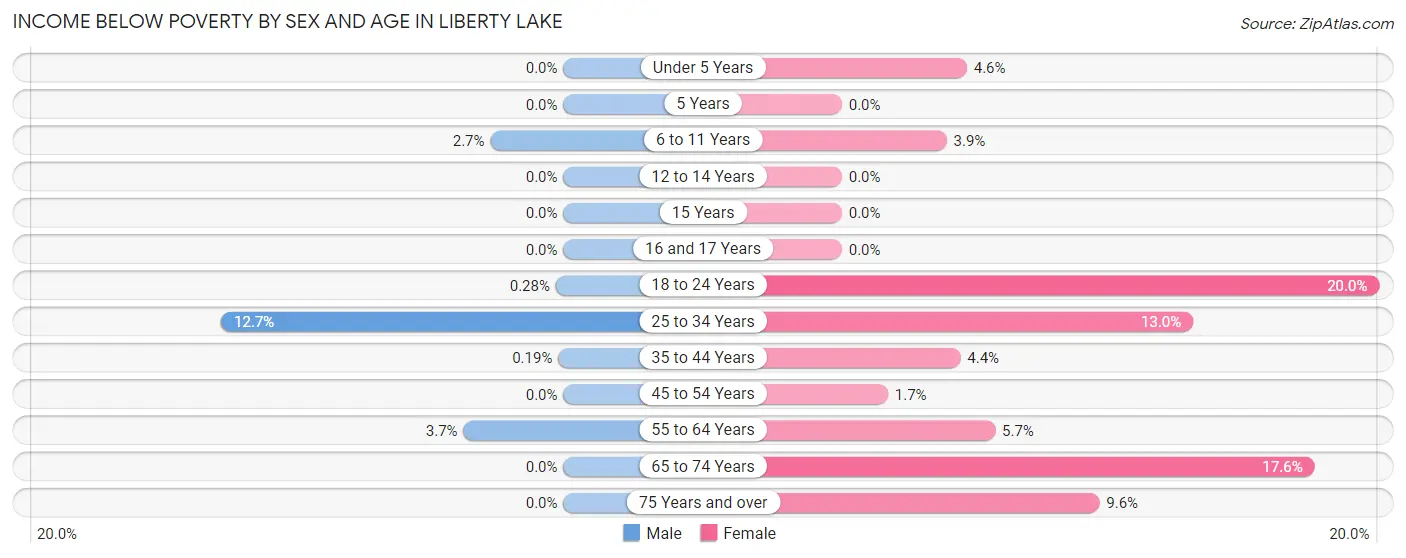
| Age Bracket | Male | Female |
| Under 5 Years | 0 (0.0%) | 27 (4.6%) |
| 5 Years | 0 (0.0%) | 0 (0.0%) |
| 6 to 11 Years | 23 (2.7%) | 23 (3.9%) |
| 12 to 14 Years | 0 (0.0%) | 0 (0.0%) |
| 15 Years | 0 (0.0%) | 0 (0.0%) |
| 16 and 17 Years | 0 (0.0%) | 0 (0.0%) |
| 18 to 24 Years | 1 (0.3%) | 77 (20.0%) |
| 25 to 34 Years | 53 (12.7%) | 99 (13.0%) |
| 35 to 44 Years | 2 (0.2%) | 42 (4.4%) |
| 45 to 54 Years | 0 (0.0%) | 14 (1.7%) |
| 55 to 64 Years | 23 (3.7%) | 38 (5.7%) |
| 65 to 74 Years | 0 (0.0%) | 109 (17.5%) |
| 75 Years and over | 0 (0.0%) | 39 (9.6%) |
| Total | 102 (1.8%) | 468 (7.3%) |
Income Above Poverty by Sex and Age in Liberty Lake
According to the poverty statistics in Liberty Lake, males aged under 5 years and females aged 5 years are the age groups that are most secure financially, with 100.0% of males and 100.0% of females in these age groups living above the poverty line.
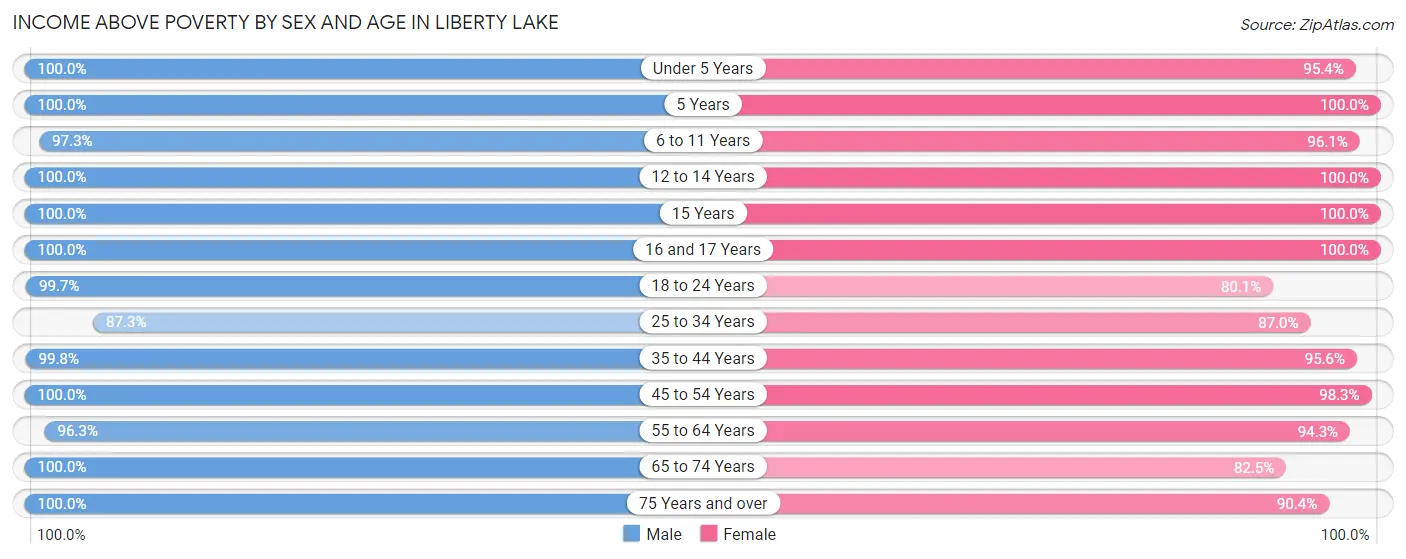
| Age Bracket | Male | Female |
| Under 5 Years | 407 (100.0%) | 555 (95.4%) |
| 5 Years | 104 (100.0%) | 83 (100.0%) |
| 6 to 11 Years | 827 (97.3%) | 569 (96.1%) |
| 12 to 14 Years | 125 (100.0%) | 268 (100.0%) |
| 15 Years | 120 (100.0%) | 99 (100.0%) |
| 16 and 17 Years | 259 (100.0%) | 129 (100.0%) |
| 18 to 24 Years | 354 (99.7%) | 309 (80.0%) |
| 25 to 34 Years | 364 (87.3%) | 660 (87.0%) |
| 35 to 44 Years | 1,071 (99.8%) | 912 (95.6%) |
| 45 to 54 Years | 456 (100.0%) | 804 (98.3%) |
| 55 to 64 Years | 597 (96.3%) | 630 (94.3%) |
| 65 to 74 Years | 496 (100.0%) | 512 (82.5%) |
| 75 Years and over | 367 (100.0%) | 369 (90.4%) |
| Total | 5,547 (98.2%) | 5,899 (92.6%) |
Income Below Poverty Among Married-Couple Families in Liberty Lake
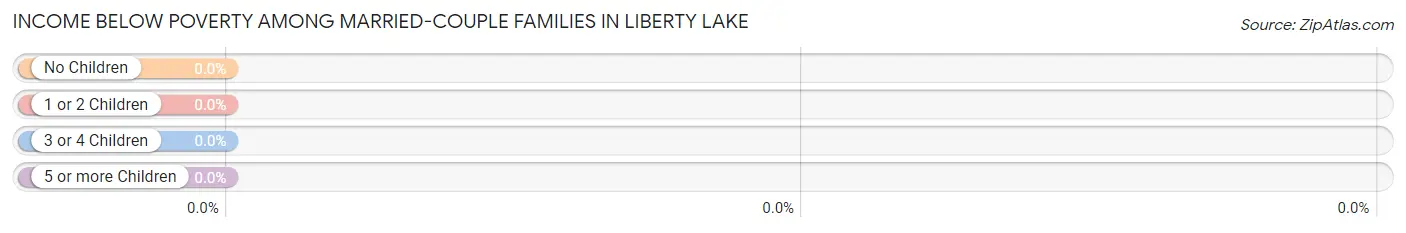
| Children | Above Poverty | Below Poverty |
| No Children | 1,361 (100.0%) | 0 (0.0%) |
| 1 or 2 Children | 1,010 (100.0%) | 0 (0.0%) |
| 3 or 4 Children | 389 (100.0%) | 0 (0.0%) |
| 5 or more Children | 0 (0.0%) | 0 (0.0%) |
| Total | 2,760 (100.0%) | 0 (0.0%) |
Income Below Poverty Among Single-Parent Households in Liberty Lake
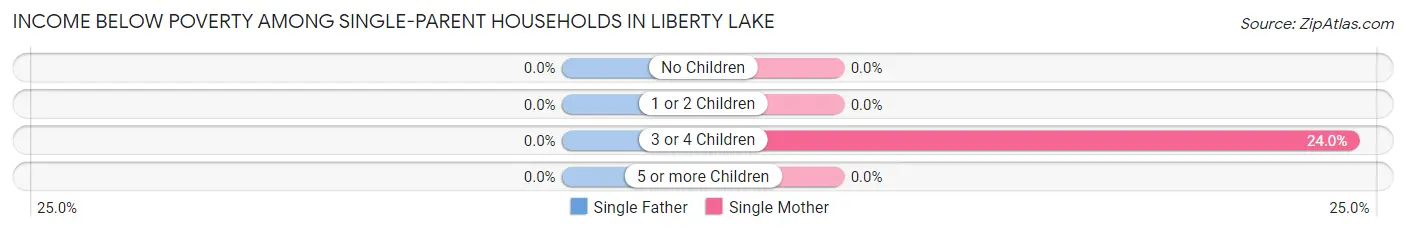
| Children | Single Father | Single Mother |
| No Children | 0 (0.0%) | 0 (0.0%) |
| 1 or 2 Children | 0 (0.0%) | 0 (0.0%) |
| 3 or 4 Children | 0 (0.0%) | 24 (24.0%) |
| 5 or more Children | 0 (0.0%) | 0 (0.0%) |
| Total | 0 (0.0%) | 24 (7.9%) |
Income Below Poverty Among Married-Couple vs Single-Parent Households in Liberty Lake
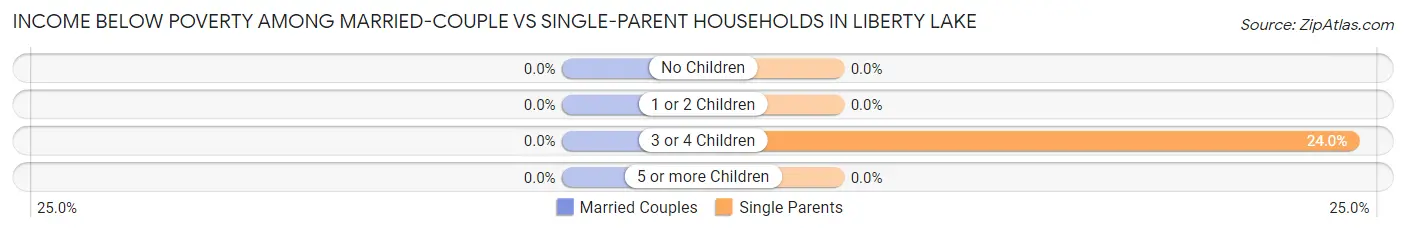
| Children | Married-Couple Families | Single-Parent Households |
| No Children | 0 (0.0%) | 0 (0.0%) |
| 1 or 2 Children | 0 (0.0%) | 0 (0.0%) |
| 3 or 4 Children | 0 (0.0%) | 24 (24.0%) |
| 5 or more Children | 0 (0.0%) | 0 (0.0%) |
| Total | 0 (0.0%) | 24 (6.9%) |
Race in Liberty Lake
The most populous races in Liberty Lake are White / Caucasian (11,130 | 92.5%), Two or more Races (561 | 4.7%), and Hispanic or Latino (433 | 3.6%).
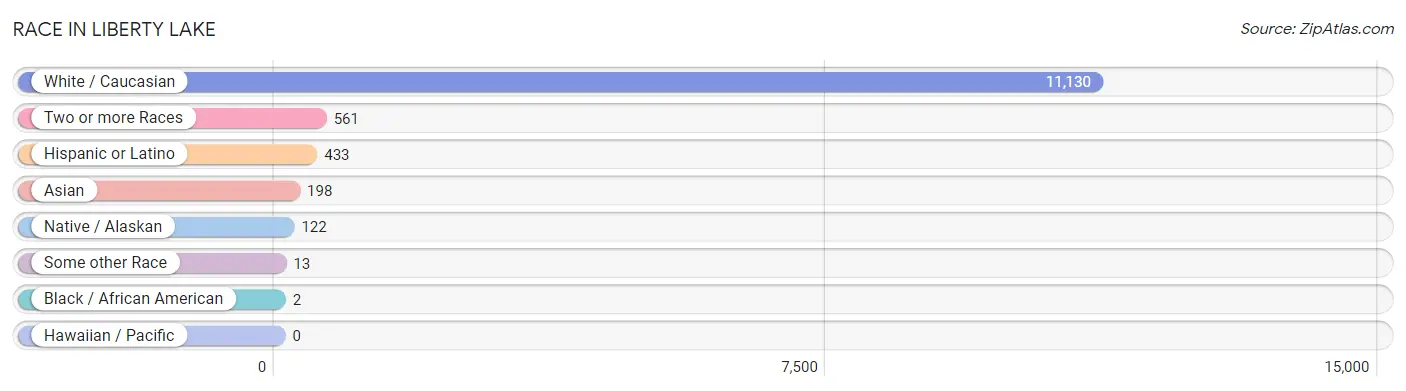
| Race | # Population | % Population |
| Asian | 198 | 1.7% |
| Black / African American | 2 | 0.0% |
| Hawaiian / Pacific | 0 | 0.0% |
| Hispanic or Latino | 433 | 3.6% |
| Native / Alaskan | 122 | 1.0% |
| White / Caucasian | 11,130 | 92.5% |
| Two or more Races | 561 | 4.7% |
| Some other Race | 13 | 0.1% |
| Total | 12,026 | 100.0% |
Ancestry in Liberty Lake
The most populous ancestries reported in Liberty Lake are Irish (2,600 | 21.6%), German (2,370 | 19.7%), English (2,360 | 19.6%), American (1,376 | 11.4%), and Norwegian (427 | 3.5%), together accounting for 75.9% of all Liberty Lake residents.
| Ancestry | # Population | % Population |
| American | 1,376 | 11.4% |
| Armenian | 42 | 0.4% |
| Austrian | 90 | 0.7% |
| Belgian | 84 | 0.7% |
| Bhutanese | 22 | 0.2% |
| British | 241 | 2.0% |
| Burmese | 104 | 0.9% |
| Central American | 28 | 0.2% |
| Costa Rican | 28 | 0.2% |
| Czech | 63 | 0.5% |
| Danish | 114 | 0.9% |
| Dutch | 118 | 1.0% |
| Eastern European | 24 | 0.2% |
| English | 2,360 | 19.6% |
| European | 13 | 0.1% |
| Finnish | 32 | 0.3% |
| French | 286 | 2.4% |
| French Canadian | 51 | 0.4% |
| German | 2,370 | 19.7% |
| Greek | 231 | 1.9% |
| Guamanian / Chamorro | 31 | 0.3% |
| Hungarian | 20 | 0.2% |
| Indian (Asian) | 32 | 0.3% |
| Irish | 2,600 | 21.6% |
| Italian | 411 | 3.4% |
| Jamaican | 104 | 0.9% |
| Korean | 20 | 0.2% |
| Lithuanian | 141 | 1.2% |
| Mexican | 204 | 1.7% |
| Native Hawaiian | 26 | 0.2% |
| Northern European | 24 | 0.2% |
| Norwegian | 427 | 3.5% |
| Paiute | 11 | 0.1% |
| Polish | 147 | 1.2% |
| Pueblo | 63 | 0.5% |
| Russian | 51 | 0.4% |
| Scandinavian | 294 | 2.4% |
| Scotch-Irish | 137 | 1.1% |
| Scottish | 350 | 2.9% |
| Serbian | 73 | 0.6% |
| Slovene | 24 | 0.2% |
| Spaniard | 95 | 0.8% |
| Spanish | 106 | 0.9% |
| Sri Lankan | 104 | 0.9% |
| Swedish | 299 | 2.5% |
| Swiss | 10 | 0.1% |
| Welsh | 189 | 1.6% | View All 47 Rows |
Immigrants in Liberty Lake
The most numerous immigrant groups reported in Liberty Lake came from Asia (68 | 0.6%), Europe (59 | 0.5%), South Eastern Asia (59 | 0.5%), Austria (50 | 0.4%), and Western Europe (50 | 0.4%), together accounting for 2.4% of all Liberty Lake residents.
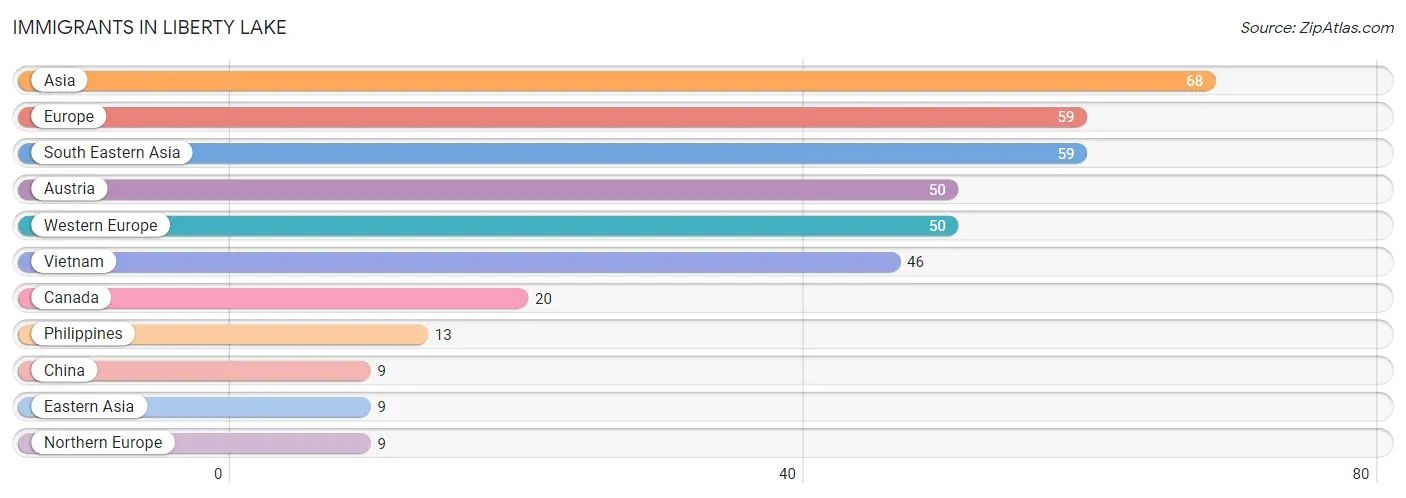
| Immigration Origin | # Population | % Population |
| Asia | 68 | 0.6% |
| Austria | 50 | 0.4% |
| Canada | 20 | 0.2% |
| China | 9 | 0.1% |
| Eastern Asia | 9 | 0.1% |
| Europe | 59 | 0.5% |
| Northern Europe | 9 | 0.1% |
| Philippines | 13 | 0.1% |
| South Eastern Asia | 59 | 0.5% |
| Vietnam | 46 | 0.4% |
| Western Europe | 50 | 0.4% | View All 11 Rows |
Sex and Age in Liberty Lake
Sex and Age in Liberty Lake
The most populous age groups in Liberty Lake are 5 to 9 Years (737 | 13.0%) for men and 35 to 39 Years (730 | 11.5%) for women.
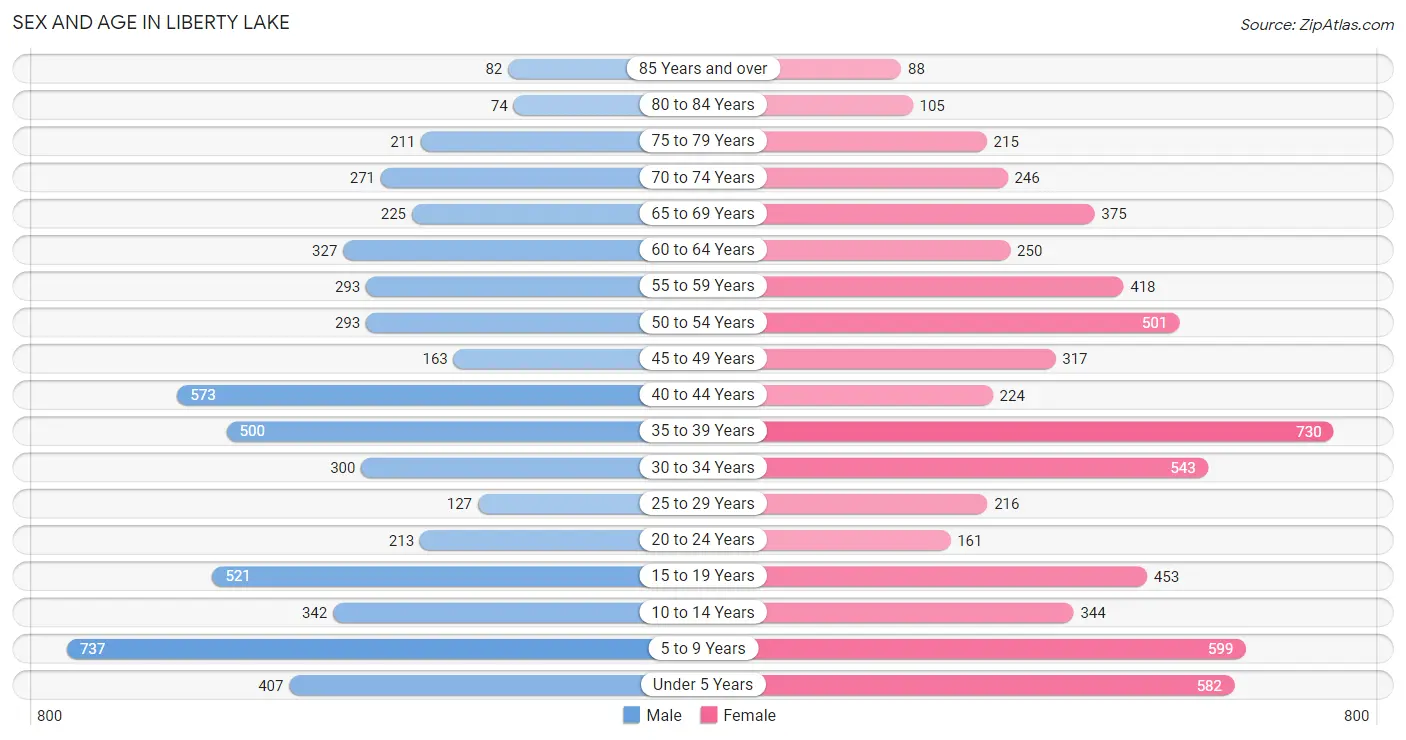
| Age Bracket | Male | Female |
| Under 5 Years | 407 (7.2%) | 582 (9.1%) |
| 5 to 9 Years | 737 (13.0%) | 599 (9.4%) |
| 10 to 14 Years | 342 (6.0%) | 344 (5.4%) |
| 15 to 19 Years | 521 (9.2%) | 453 (7.1%) |
| 20 to 24 Years | 213 (3.8%) | 161 (2.5%) |
| 25 to 29 Years | 127 (2.2%) | 216 (3.4%) |
| 30 to 34 Years | 300 (5.3%) | 543 (8.5%) |
| 35 to 39 Years | 500 (8.8%) | 730 (11.5%) |
| 40 to 44 Years | 573 (10.1%) | 224 (3.5%) |
| 45 to 49 Years | 163 (2.9%) | 317 (5.0%) |
| 50 to 54 Years | 293 (5.2%) | 501 (7.9%) |
| 55 to 59 Years | 293 (5.2%) | 418 (6.6%) |
| 60 to 64 Years | 327 (5.8%) | 250 (3.9%) |
| 65 to 69 Years | 225 (4.0%) | 375 (5.9%) |
| 70 to 74 Years | 271 (4.8%) | 246 (3.9%) |
| 75 to 79 Years | 211 (3.7%) | 215 (3.4%) |
| 80 to 84 Years | 74 (1.3%) | 105 (1.7%) |
| 85 Years and over | 82 (1.5%) | 88 (1.4%) |
| Total | 5,659 (100.0%) | 6,367 (100.0%) |
Families and Households in Liberty Lake
Median Family Size in Liberty Lake
The median family size in Liberty Lake is 3.32 persons per family, with married-couple families (2,760 | 88.8%) accounting for the largest median family size of 3.36 persons per family. On the other hand, single male/father families (42 | 1.3%) represent the smallest median family size with 2.14 persons per family.
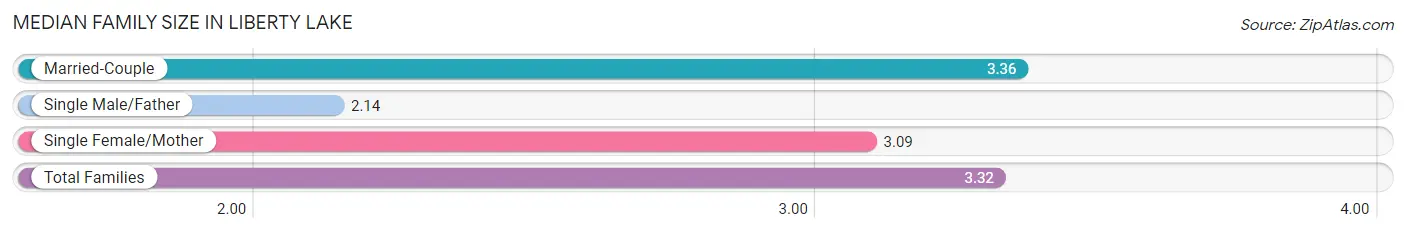
| Family Type | # Families | Family Size |
| Married-Couple | 2,760 (88.8%) | 3.36 |
| Single Male/Father | 42 (1.3%) | 2.14 |
| Single Female/Mother | 305 (9.8%) | 3.09 |
| Total Families | 3,107 (100.0%) | 3.32 |
Median Household Size in Liberty Lake
The median household size in Liberty Lake is 2.73 persons per household, with single female/mother households (305 | 6.9%) accounting for the largest median household size of 3.43 persons per household. non-family households (1,294 | 29.4%) represent the smallest median household size with 1.19 persons per household.
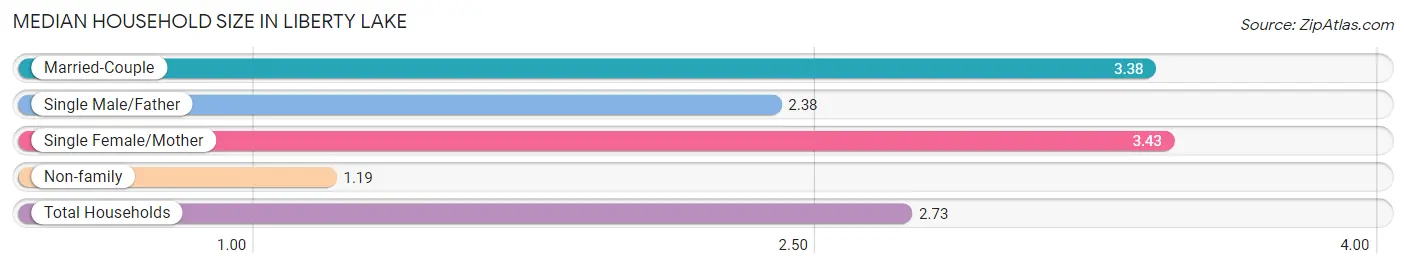
| Household Type | # Households | Household Size |
| Married-Couple | 2,760 (62.7%) | 3.38 |
| Single Male/Father | 42 (0.9%) | 2.38 |
| Single Female/Mother | 305 (6.9%) | 3.43 |
| Non-family | 1,294 (29.4%) | 1.19 |
| Total Households | 4,401 (100.0%) | 2.73 |
Household Size by Marriage Status in Liberty Lake
Out of a total of 4,401 households in Liberty Lake, 3,107 (70.6%) are family households, while 1,294 (29.4%) are nonfamily households. The most numerous type of family households are 2-person households, comprising 1,170, and the most common type of nonfamily households are 1-person households, comprising 1,064.
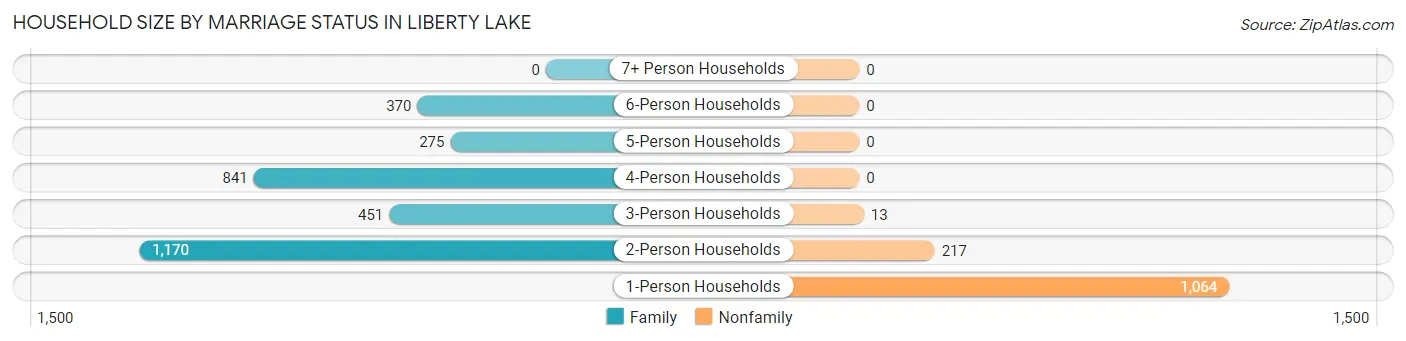
| Household Size | Family Households | Nonfamily Households |
| 1-Person Households | - | 1,064 (24.2%) |
| 2-Person Households | 1,170 (26.6%) | 217 (4.9%) |
| 3-Person Households | 451 (10.2%) | 13 (0.3%) |
| 4-Person Households | 841 (19.1%) | 0 (0.0%) |
| 5-Person Households | 275 (6.2%) | 0 (0.0%) |
| 6-Person Households | 370 (8.4%) | 0 (0.0%) |
| 7+ Person Households | 0 (0.0%) | 0 (0.0%) |
| Total | 3,107 (70.6%) | 1,294 (29.4%) |
Female Fertility in Liberty Lake
Fertility by Age in Liberty Lake
Average fertility rate in Liberty Lake is 60.0 births per 1,000 women. Women in the age bracket of 20 to 34 years have the highest fertility rate with 113.0 births per 1,000 women. Women in the age bracket of 20 to 34 years acount for 64.2% of all women with births.
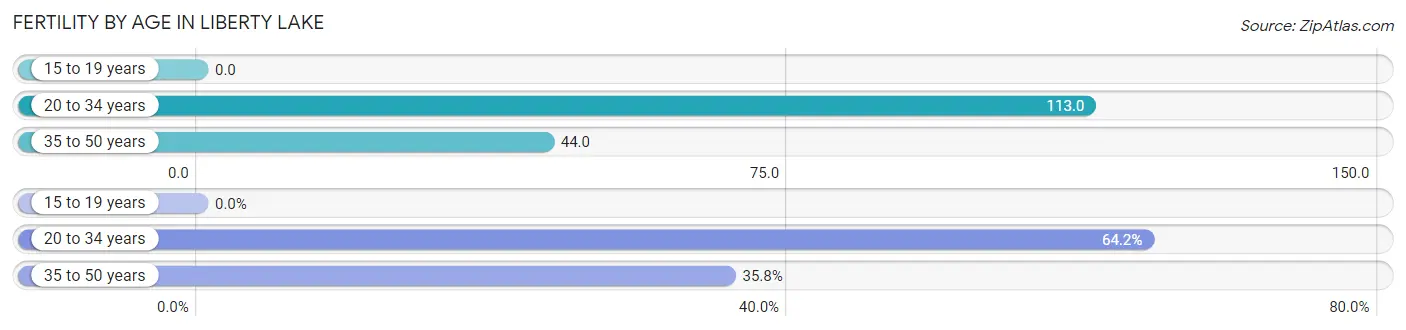
| Age Bracket | Women with Births | Births / 1,000 Women |
| 15 to 19 years | 0 (0.0%) | 0.0 |
| 20 to 34 years | 104 (64.2%) | 113.0 |
| 35 to 50 years | 58 (35.8%) | 44.0 |
| Total | 162 (100.0%) | 60.0 |
Fertility by Age by Marriage Status in Liberty Lake
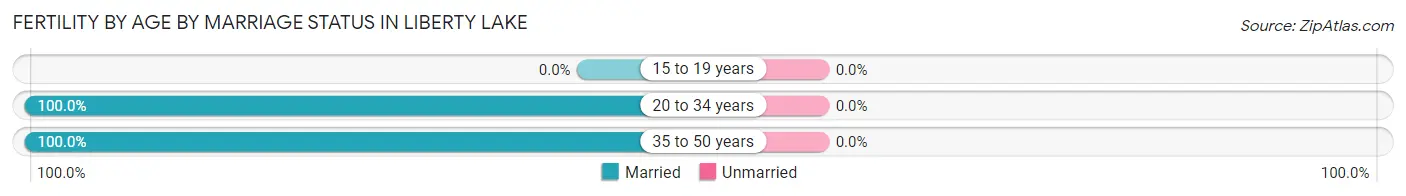
| Age Bracket | Married | Unmarried |
| 15 to 19 years | 0 (0.0%) | 0 (0.0%) |
| 20 to 34 years | 104 (100.0%) | 0 (0.0%) |
| 35 to 50 years | 58 (100.0%) | 0 (0.0%) |
| Total | 162 (100.0%) | 0 (0.0%) |
Fertility by Education in Liberty Lake
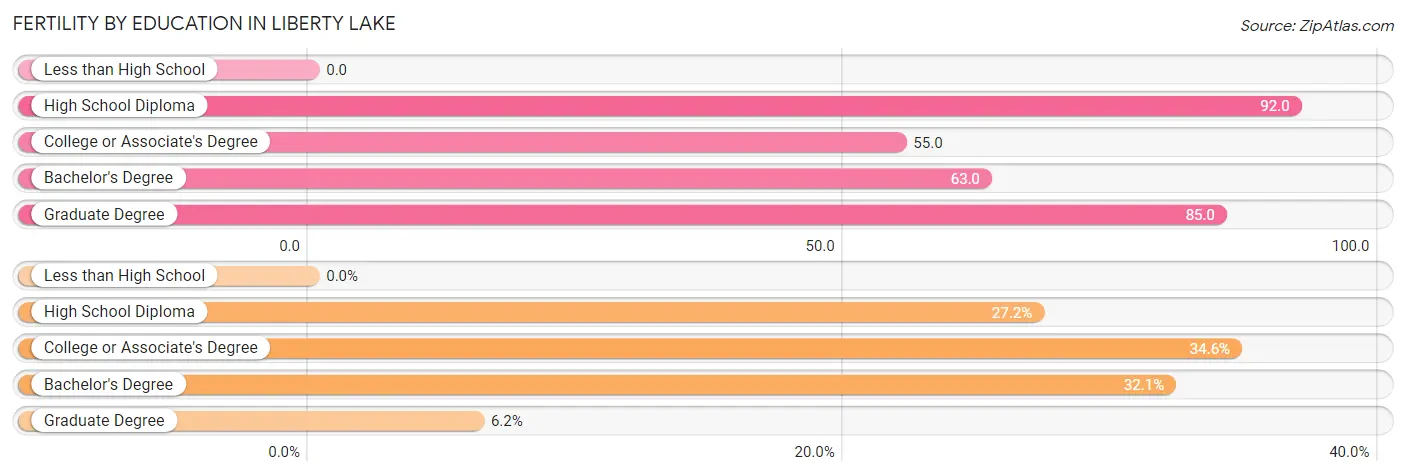
| Educational Attainment | Women with Births | Births / 1,000 Women |
| Less than High School | 0 (0.0%) | 0.0 |
| High School Diploma | 44 (27.2%) | 92.0 |
| College or Associate's Degree | 56 (34.6%) | 55.0 |
| Bachelor's Degree | 52 (32.1%) | 63.0 |
| Graduate Degree | 10 (6.2%) | 85.0 |
| Total | 162 (100.0%) | 60.0 |
Fertility by Education by Marriage Status in Liberty Lake
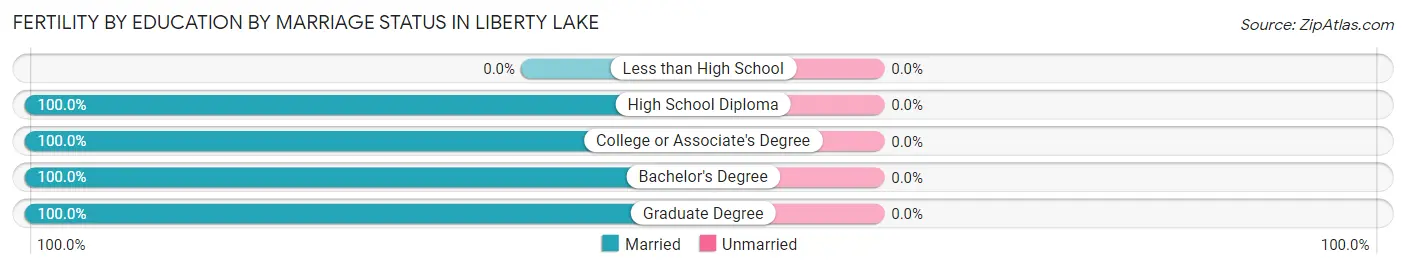
| Educational Attainment | Married | Unmarried |
| Less than High School | 0 (0.0%) | 0 (0.0%) |
| High School Diploma | 44 (100.0%) | 0 (0.0%) |
| College or Associate's Degree | 56 (100.0%) | 0 (0.0%) |
| Bachelor's Degree | 52 (100.0%) | 0 (0.0%) |
| Graduate Degree | 10 (100.0%) | 0 (0.0%) |
| Total | 162 (100.0%) | 0 (0.0%) |
Employment Characteristics in Liberty Lake
Employment by Class of Employer in Liberty Lake
Among the 5,180 employed individuals in Liberty Lake, private company employees (2,983 | 57.6%), not-for-profit organizations (560 | 10.8%), and local government employees (559 | 10.8%) make up the most common classes of employment.
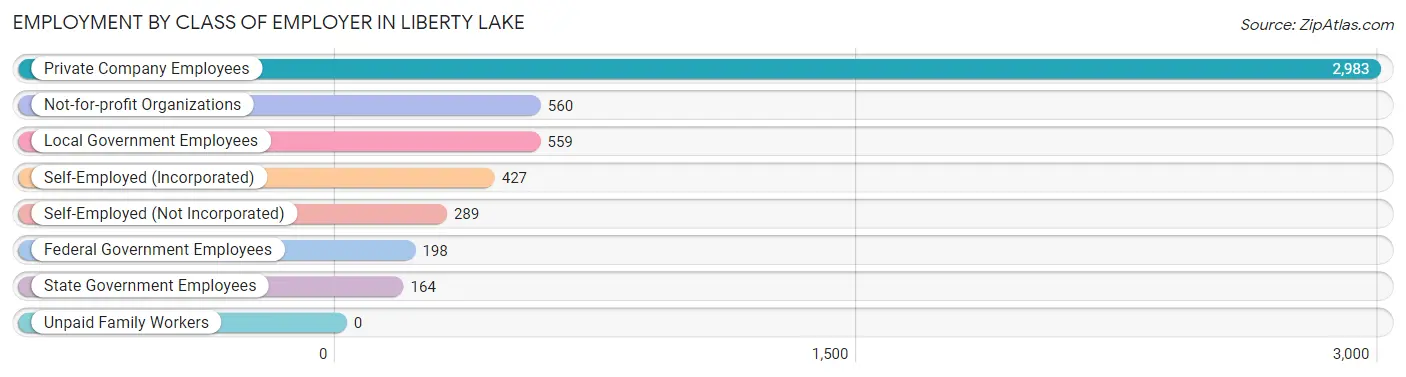
| Employer Class | # Employees | % Employees |
| Private Company Employees | 2,983 | 57.6% |
| Self-Employed (Incorporated) | 427 | 8.2% |
| Self-Employed (Not Incorporated) | 289 | 5.6% |
| Not-for-profit Organizations | 560 | 10.8% |
| Local Government Employees | 559 | 10.8% |
| State Government Employees | 164 | 3.2% |
| Federal Government Employees | 198 | 3.8% |
| Unpaid Family Workers | 0 | 0.0% |
| Total | 5,180 | 100.0% |
Employment Status by Age in Liberty Lake
According to the labor force statistics for Liberty Lake, out of the total population over 16 years of age (8,796), 63.2% or 5,559 individuals are in the labor force, with 4.7% or 261 of them unemployed. The age group with the highest labor force participation rate is 45 to 54 years, with 94.3% or 1,201 individuals in the labor force. Within the labor force, the 20 to 24 years age range has the highest percentage of unemployed individuals, with 23.1% or 61 of them being unemployed.
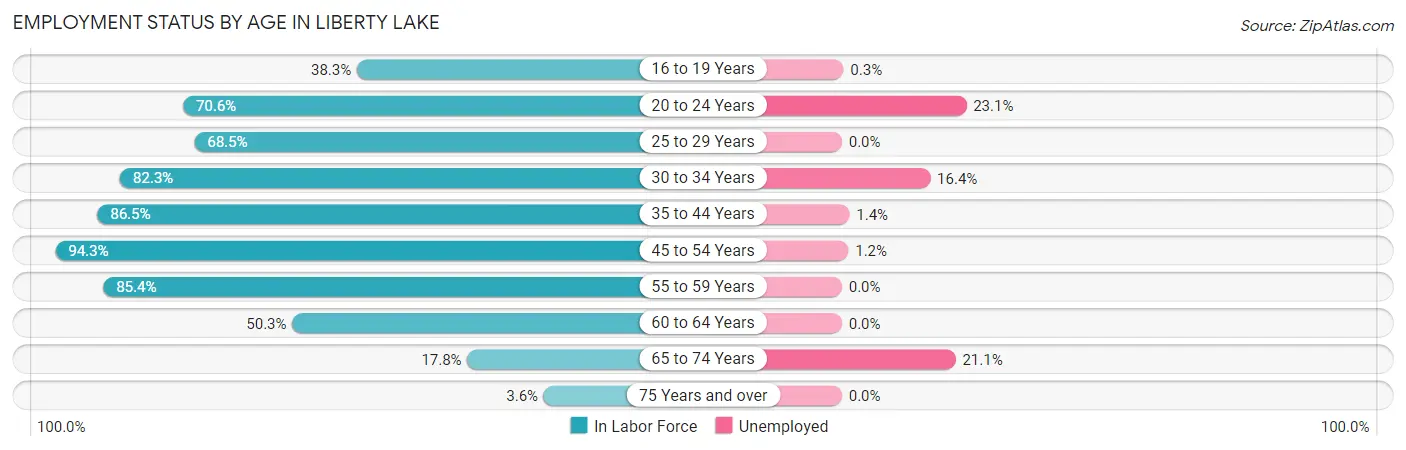
| Age Bracket | In Labor Force | Unemployed |
| 16 to 19 Years | 289 (38.3%) | 1 (0.3%) |
| 20 to 24 Years | 264 (70.6%) | 61 (23.1%) |
| 25 to 29 Years | 235 (68.5%) | 0 (0.0%) |
| 30 to 34 Years | 694 (82.3%) | 114 (16.4%) |
| 35 to 44 Years | 1,753 (86.5%) | 25 (1.4%) |
| 45 to 54 Years | 1,201 (94.3%) | 14 (1.2%) |
| 55 to 59 Years | 607 (85.4%) | 0 (0.0%) |
| 60 to 64 Years | 290 (50.3%) | 0 (0.0%) |
| 65 to 74 Years | 199 (17.8%) | 42 (21.1%) |
| 75 Years and over | 28 (3.6%) | 0 (0.0%) |
| Total | 5,559 (63.2%) | 261 (4.7%) |
Employment Status by Educational Attainment in Liberty Lake
According to labor force statistics for Liberty Lake, 82.8% of individuals (4,782) out of the total population between 25 and 64 years of age (5,775) are in the labor force, with 3.2% or 153 of them being unemployed. The group with the highest labor force participation rate are those with the educational attainment of bachelor's degree or higher, with 87.3% or 2,279 individuals in the labor force. Within the labor force, individuals with college / associate degree education have the highest percentage of unemployment, with 7.8% or 142 of them being unemployed.
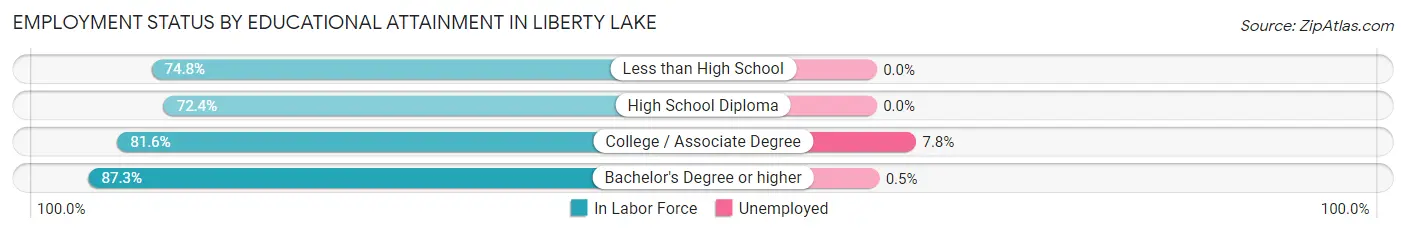
| Educational Attainment | In Labor Force | Unemployed |
| Less than High School | 89 (74.8%) | 0 (0.0%) |
| High School Diploma | 586 (72.4%) | 0 (0.0%) |
| College / Associate Degree | 1,825 (81.6%) | 174 (7.8%) |
| Bachelor's Degree or higher | 2,279 (87.3%) | 13 (0.5%) |
| Total | 4,782 (82.8%) | 185 (3.2%) |
Employment Occupations by Sex in Liberty Lake
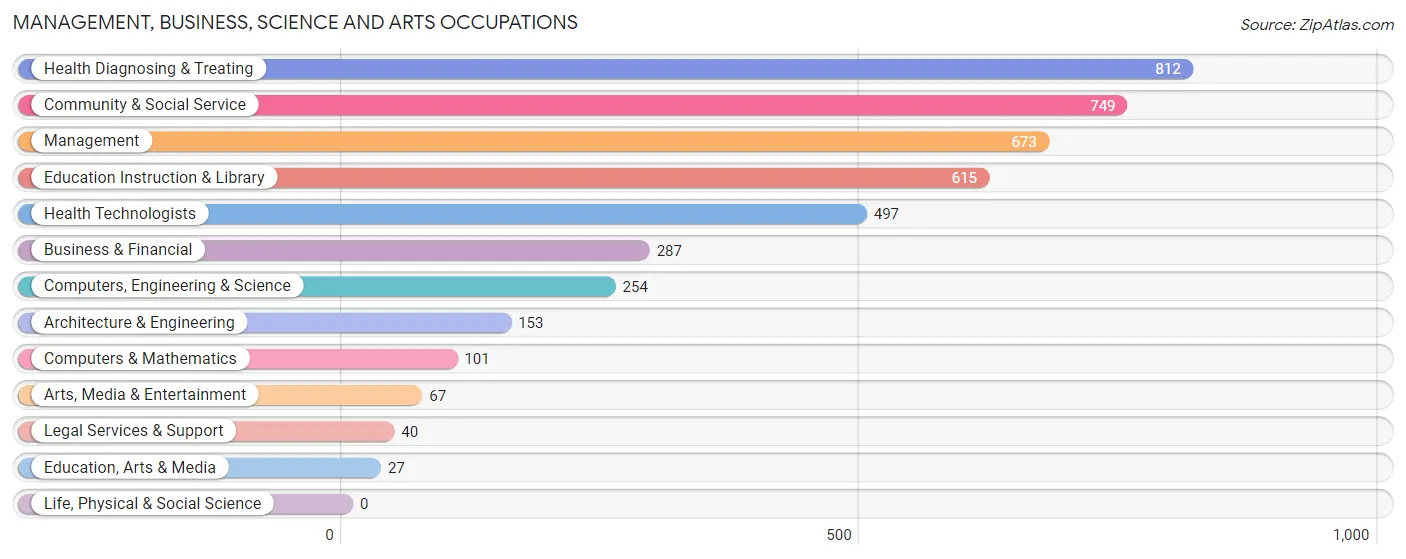
Management, Business, Science and Arts Occupations
The most common Management, Business, Science and Arts occupations in Liberty Lake are Health Diagnosing & Treating (812 | 15.5%), Community & Social Service (749 | 14.3%), Management (673 | 12.9%), Education Instruction & Library (615 | 11.8%), and Health Technologists (497 | 9.5%).
Management, Business, Science and Arts Occupations by Sex
Within the Management, Business, Science and Arts occupations in Liberty Lake, the most male-oriented occupations are Architecture & Engineering (85.0%), Legal Services & Support (75.0%), and Management (74.2%), while the most female-oriented occupations are Education, Arts & Media (100.0%), Education Instruction & Library (91.2%), and Community & Social Service (85.3%).
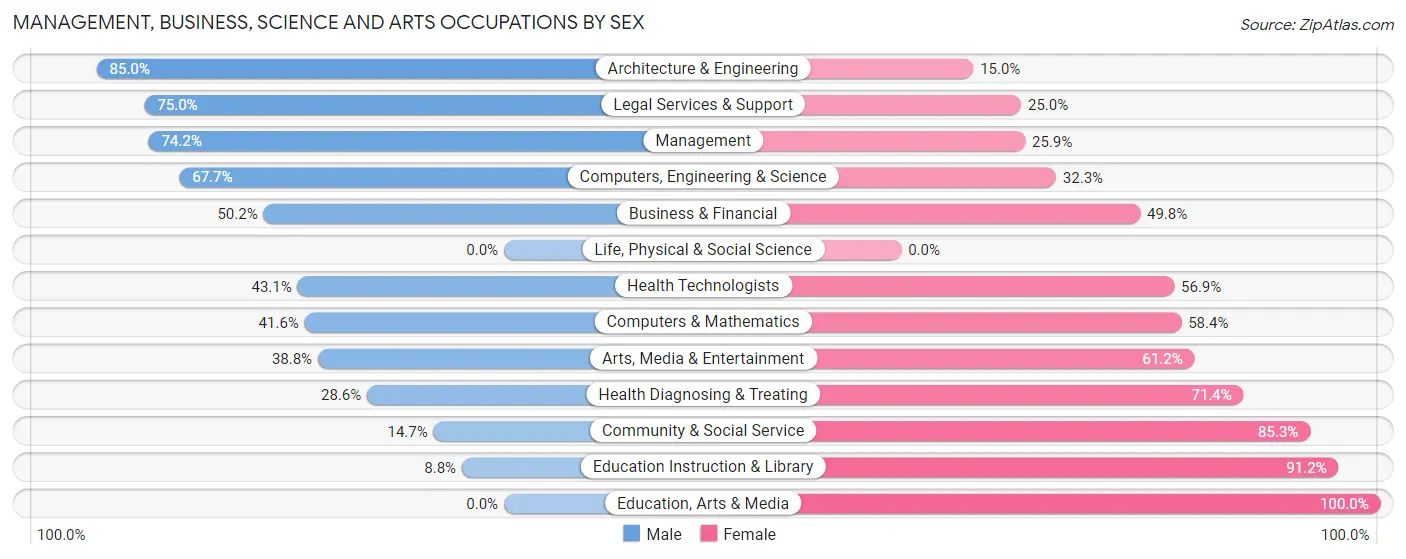
| Occupation | Male | Female |
| Management | 499 (74.2%) | 174 (25.9%) |
| Business & Financial | 144 (50.2%) | 143 (49.8%) |
| Computers, Engineering & Science | 172 (67.7%) | 82 (32.3%) |
| Computers & Mathematics | 42 (41.6%) | 59 (58.4%) |
| Architecture & Engineering | 130 (85.0%) | 23 (15.0%) |
| Life, Physical & Social Science | 0 (0.0%) | 0 (0.0%) |
| Community & Social Service | 110 (14.7%) | 639 (85.3%) |
| Education, Arts & Media | 0 (0.0%) | 27 (100.0%) |
| Legal Services & Support | 30 (75.0%) | 10 (25.0%) |
| Education Instruction & Library | 54 (8.8%) | 561 (91.2%) |
| Arts, Media & Entertainment | 26 (38.8%) | 41 (61.2%) |
| Health Diagnosing & Treating | 232 (28.6%) | 580 (71.4%) |
| Health Technologists | 214 (43.1%) | 283 (56.9%) |
| Total (Category) | 1,157 (41.7%) | 1,618 (58.3%) |
| Total (Overall) | 2,355 (45.0%) | 2,876 (55.0%) |
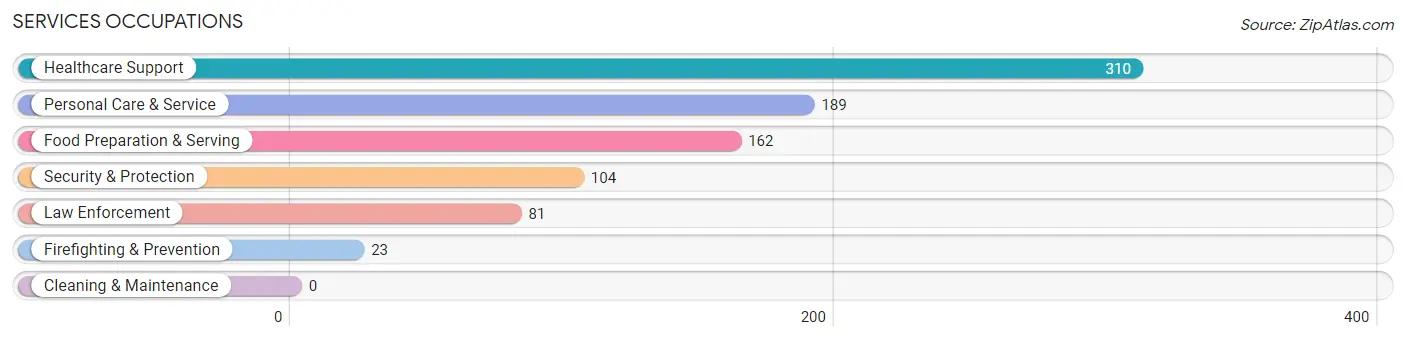
Services Occupations
The most common Services occupations in Liberty Lake are Healthcare Support (310 | 5.9%), Personal Care & Service (189 | 3.6%), Food Preparation & Serving (162 | 3.1%), Security & Protection (104 | 2.0%), and Law Enforcement (81 | 1.5%).
Services Occupations by Sex
Within the Services occupations in Liberty Lake, the most male-oriented occupations are Security & Protection (100.0%), Firefighting & Prevention (100.0%), and Law Enforcement (100.0%), while the most female-oriented occupations are Healthcare Support (100.0%), Personal Care & Service (100.0%), and Food Preparation & Serving (40.1%).
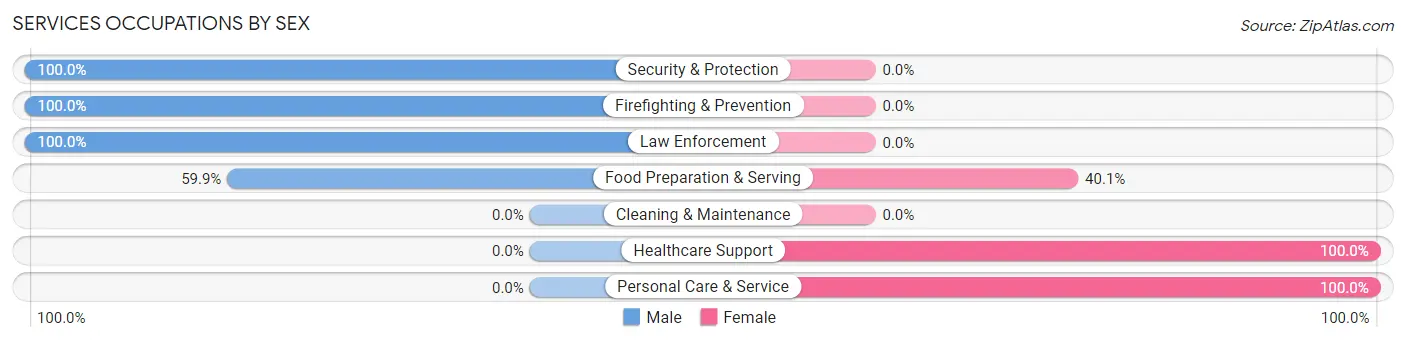
| Occupation | Male | Female |
| Healthcare Support | 0 (0.0%) | 310 (100.0%) |
| Security & Protection | 104 (100.0%) | 0 (0.0%) |
| Firefighting & Prevention | 23 (100.0%) | 0 (0.0%) |
| Law Enforcement | 81 (100.0%) | 0 (0.0%) |
| Food Preparation & Serving | 97 (59.9%) | 65 (40.1%) |
| Cleaning & Maintenance | 0 (0.0%) | 0 (0.0%) |
| Personal Care & Service | 0 (0.0%) | 189 (100.0%) |
| Total (Category) | 201 (26.3%) | 564 (73.7%) |
| Total (Overall) | 2,355 (45.0%) | 2,876 (55.0%) |
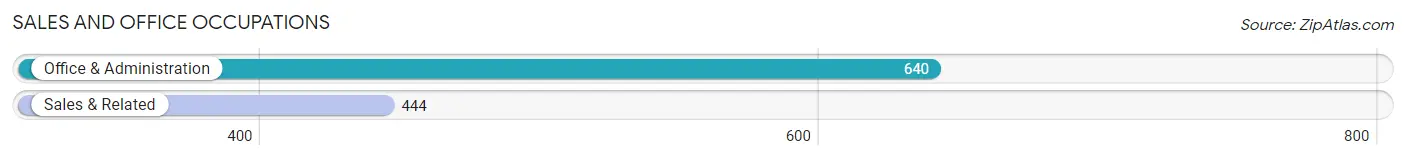
Sales and Office Occupations
The most common Sales and Office occupations in Liberty Lake are Office & Administration (640 | 12.2%), and Sales & Related (444 | 8.5%).
Sales and Office Occupations by Sex
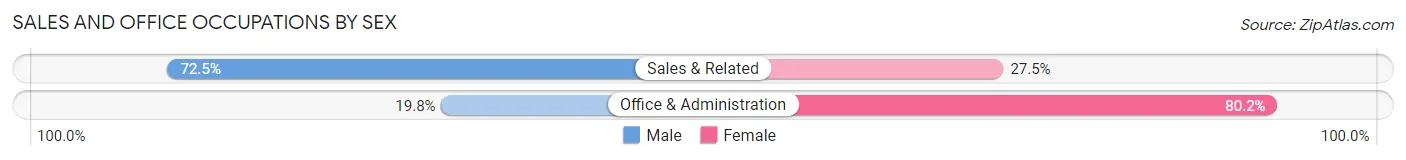
| Occupation | Male | Female |
| Sales & Related | 322 (72.5%) | 122 (27.5%) |
| Office & Administration | 127 (19.8%) | 513 (80.2%) |
| Total (Category) | 449 (41.4%) | 635 (58.6%) |
| Total (Overall) | 2,355 (45.0%) | 2,876 (55.0%) |
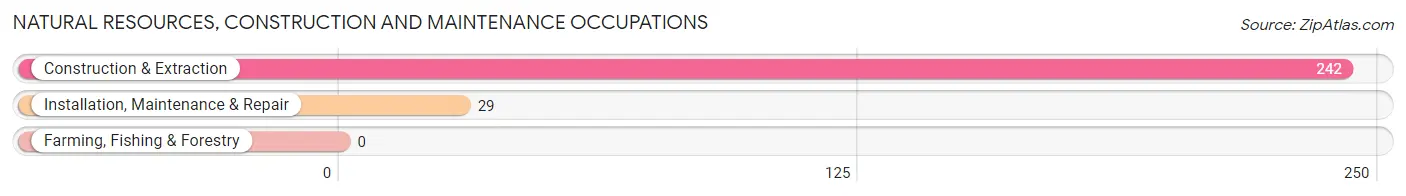
Natural Resources, Construction and Maintenance Occupations
The most common Natural Resources, Construction and Maintenance occupations in Liberty Lake are Construction & Extraction (242 | 4.6%), and Installation, Maintenance & Repair (29 | 0.5%).
Natural Resources, Construction and Maintenance Occupations by Sex
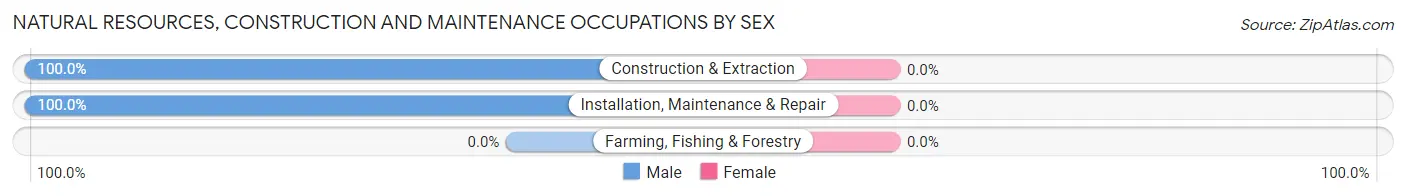
| Occupation | Male | Female |
| Farming, Fishing & Forestry | 0 (0.0%) | 0 (0.0%) |
| Construction & Extraction | 242 (100.0%) | 0 (0.0%) |
| Installation, Maintenance & Repair | 29 (100.0%) | 0 (0.0%) |
| Total (Category) | 271 (100.0%) | 0 (0.0%) |
| Total (Overall) | 2,355 (45.0%) | 2,876 (55.0%) |
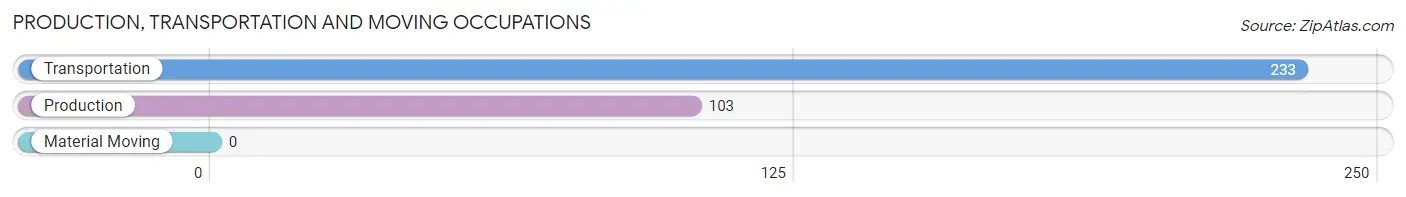
Production, Transportation and Moving Occupations
The most common Production, Transportation and Moving occupations in Liberty Lake are Transportation (233 | 4.4%), and Production (103 | 2.0%).
Production, Transportation and Moving Occupations by Sex
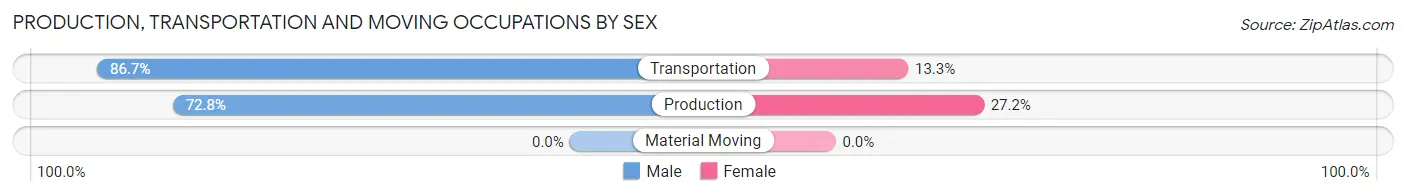
| Occupation | Male | Female |
| Production | 75 (72.8%) | 28 (27.2%) |
| Transportation | 202 (86.7%) | 31 (13.3%) |
| Material Moving | 0 (0.0%) | 0 (0.0%) |
| Total (Category) | 277 (82.4%) | 59 (17.6%) |
| Total (Overall) | 2,355 (45.0%) | 2,876 (55.0%) |
Employment Industries by Sex in Liberty Lake
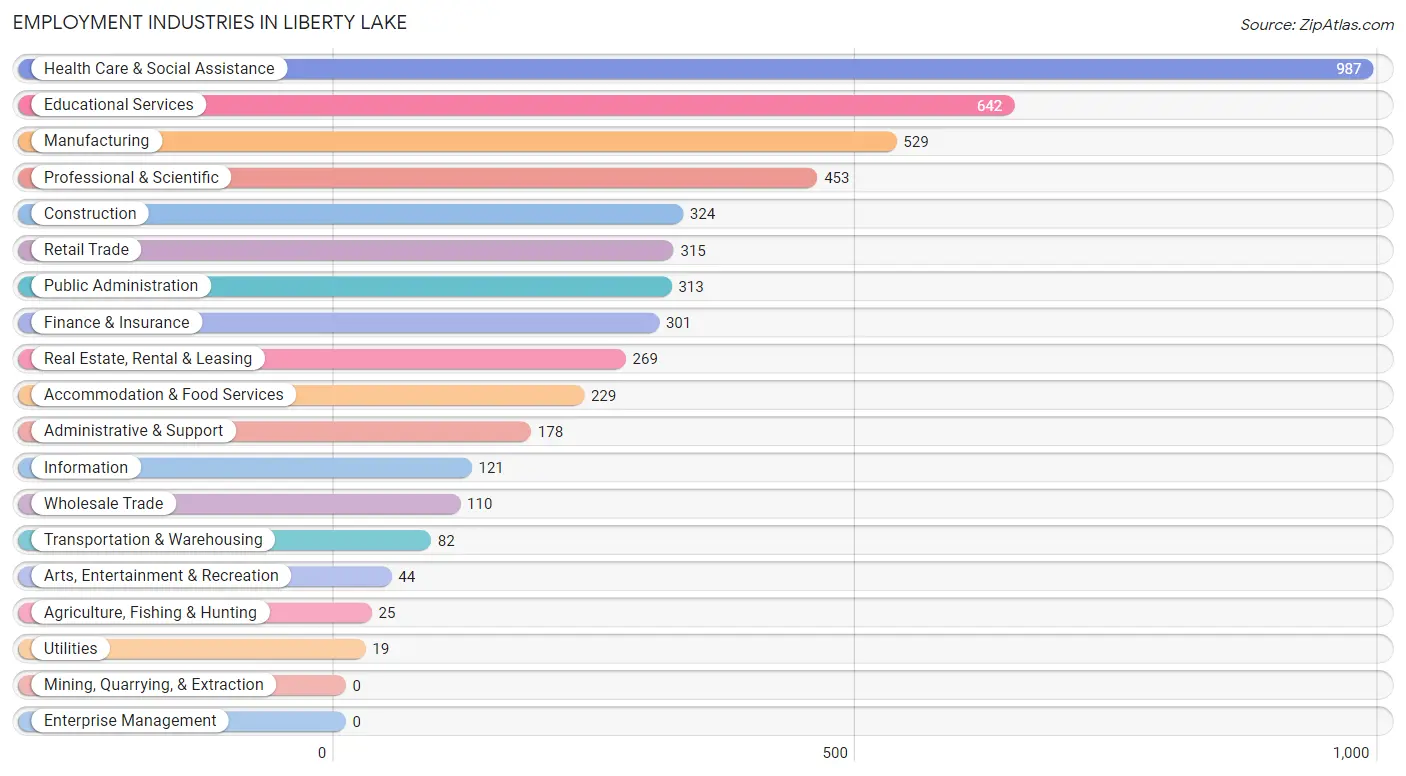
Employment Industries in Liberty Lake
The major employment industries in Liberty Lake include Health Care & Social Assistance (987 | 18.9%), Educational Services (642 | 12.3%), Manufacturing (529 | 10.1%), Professional & Scientific (453 | 8.7%), and Construction (324 | 6.2%).
Employment Industries by Sex in Liberty Lake
The Liberty Lake industries that see more men than women are Construction (87.4%), Information (77.7%), and Transportation & Warehousing (76.8%), whereas the industries that tend to have a higher number of women are Agriculture, Fishing & Hunting (100.0%), Utilities (100.0%), and Arts, Entertainment & Recreation (100.0%).
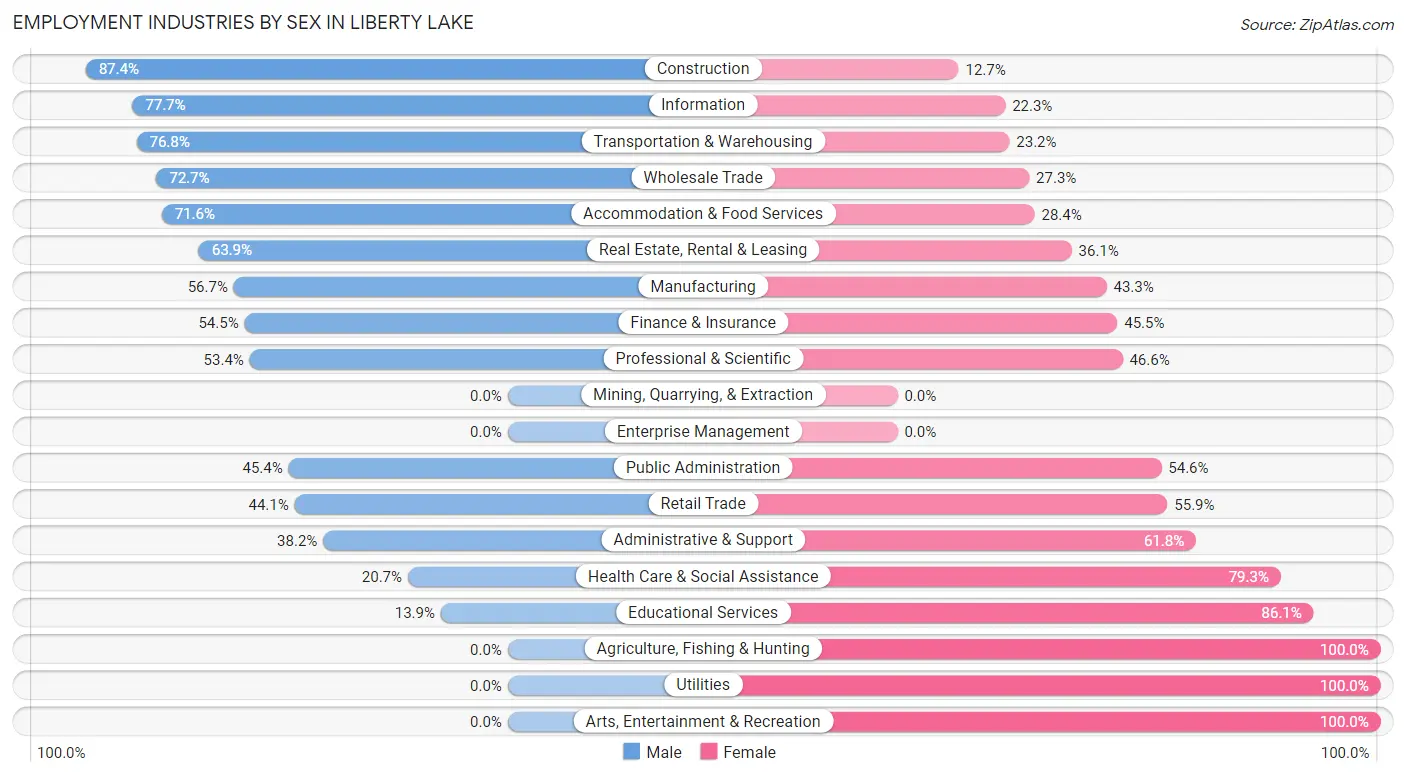
| Industry | Male | Female |
| Agriculture, Fishing & Hunting | 0 (0.0%) | 25 (100.0%) |
| Mining, Quarrying, & Extraction | 0 (0.0%) | 0 (0.0%) |
| Construction | 283 (87.4%) | 41 (12.7%) |
| Manufacturing | 300 (56.7%) | 229 (43.3%) |
| Wholesale Trade | 80 (72.7%) | 30 (27.3%) |
| Retail Trade | 139 (44.1%) | 176 (55.9%) |
| Transportation & Warehousing | 63 (76.8%) | 19 (23.2%) |
| Utilities | 0 (0.0%) | 19 (100.0%) |
| Information | 94 (77.7%) | 27 (22.3%) |
| Finance & Insurance | 164 (54.5%) | 137 (45.5%) |
| Real Estate, Rental & Leasing | 172 (63.9%) | 97 (36.1%) |
| Professional & Scientific | 242 (53.4%) | 211 (46.6%) |
| Enterprise Management | 0 (0.0%) | 0 (0.0%) |
| Administrative & Support | 68 (38.2%) | 110 (61.8%) |
| Educational Services | 89 (13.9%) | 553 (86.1%) |
| Health Care & Social Assistance | 204 (20.7%) | 783 (79.3%) |
| Arts, Entertainment & Recreation | 0 (0.0%) | 44 (100.0%) |
| Accommodation & Food Services | 164 (71.6%) | 65 (28.4%) |
| Public Administration | 142 (45.4%) | 171 (54.6%) |
| Total | 2,355 (45.0%) | 2,876 (55.0%) |
Education in Liberty Lake
School Enrollment in Liberty Lake
The most common levels of schooling among the 3,573 students in Liberty Lake are elementary school (1,132 | 31.7%), middle school (574 | 16.1%), and college / undergraduate (557 | 15.6%).
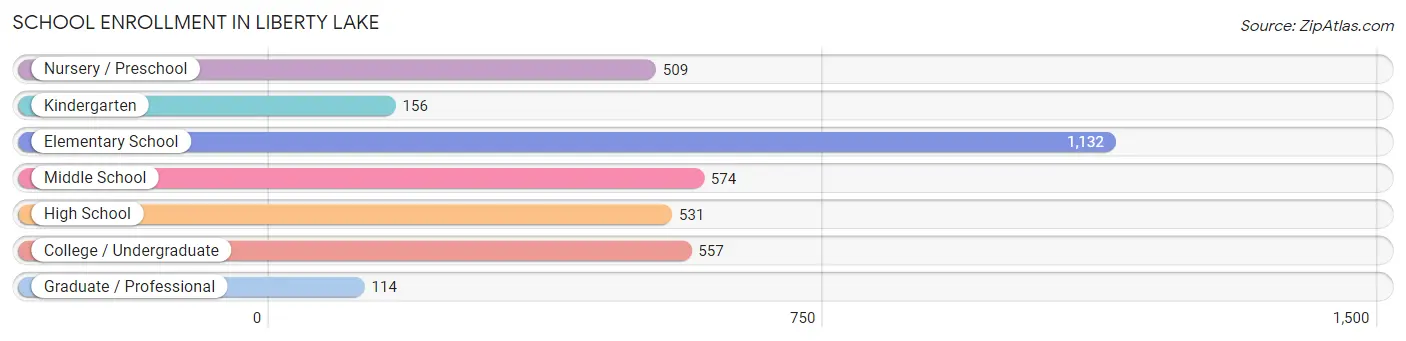
| School Level | # Students | % Students |
| Nursery / Preschool | 509 | 14.2% |
| Kindergarten | 156 | 4.4% |
| Elementary School | 1,132 | 31.7% |
| Middle School | 574 | 16.1% |
| High School | 531 | 14.9% |
| College / Undergraduate | 557 | 15.6% |
| Graduate / Professional | 114 | 3.2% |
| Total | 3,573 | 100.0% |
School Enrollment by Age by Funding Source in Liberty Lake
Out of a total of 3,573 students who are enrolled in schools in Liberty Lake, 940 (26.3%) attend a private institution, while the remaining 2,633 (73.7%) are enrolled in public schools. The age group of 3 to 4 year olds has the highest likelihood of being enrolled in private schools, with 195 (42.9% in the age bracket) enrolled. Conversely, the age group of 18 to 19 year olds has the lowest likelihood of being enrolled in a private school, with 220 (100.0% in the age bracket) attending a public institution.
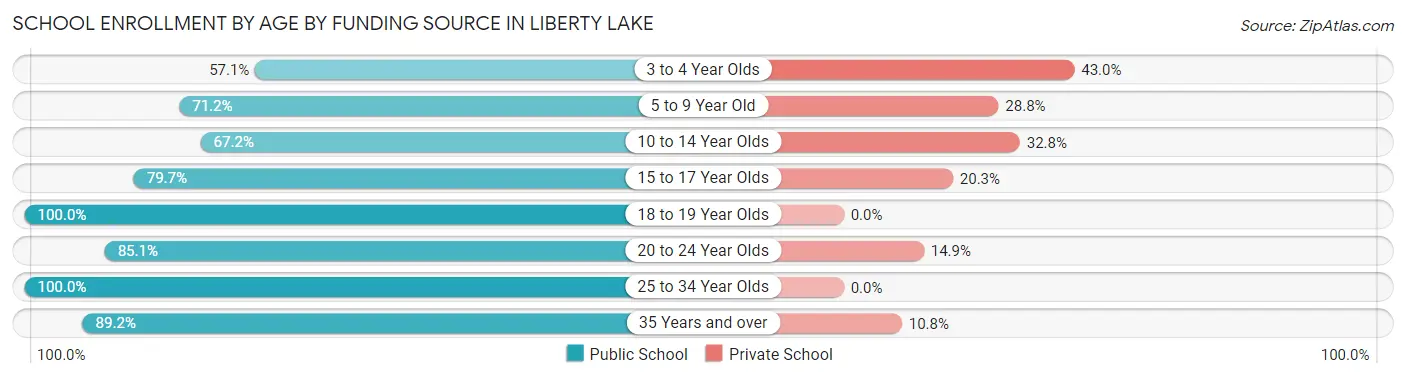
| Age Bracket | Public School | Private School |
| 3 to 4 Year Olds | 259 (57.1%) | 195 (42.9%) |
| 5 to 9 Year Old | 914 (71.2%) | 370 (28.8%) |
| 10 to 14 Year Olds | 461 (67.2%) | 225 (32.8%) |
| 15 to 17 Year Olds | 380 (79.7%) | 97 (20.3%) |
| 18 to 19 Year Olds | 220 (100.0%) | 0 (0.0%) |
| 20 to 24 Year Olds | 114 (85.1%) | 20 (14.9%) |
| 25 to 34 Year Olds | 13 (100.0%) | 0 (0.0%) |
| 35 Years and over | 272 (89.2%) | 33 (10.8%) |
| Total | 2,633 (73.7%) | 940 (26.3%) |
Educational Attainment by Field of Study in Liberty Lake
Science & technology (693 | 18.0%), business (587 | 15.3%), education (509 | 13.2%), communications (371 | 9.6%), and social sciences (356 | 9.2%) are the most common fields of study among 3,847 individuals in Liberty Lake who have obtained a bachelor's degree or higher.
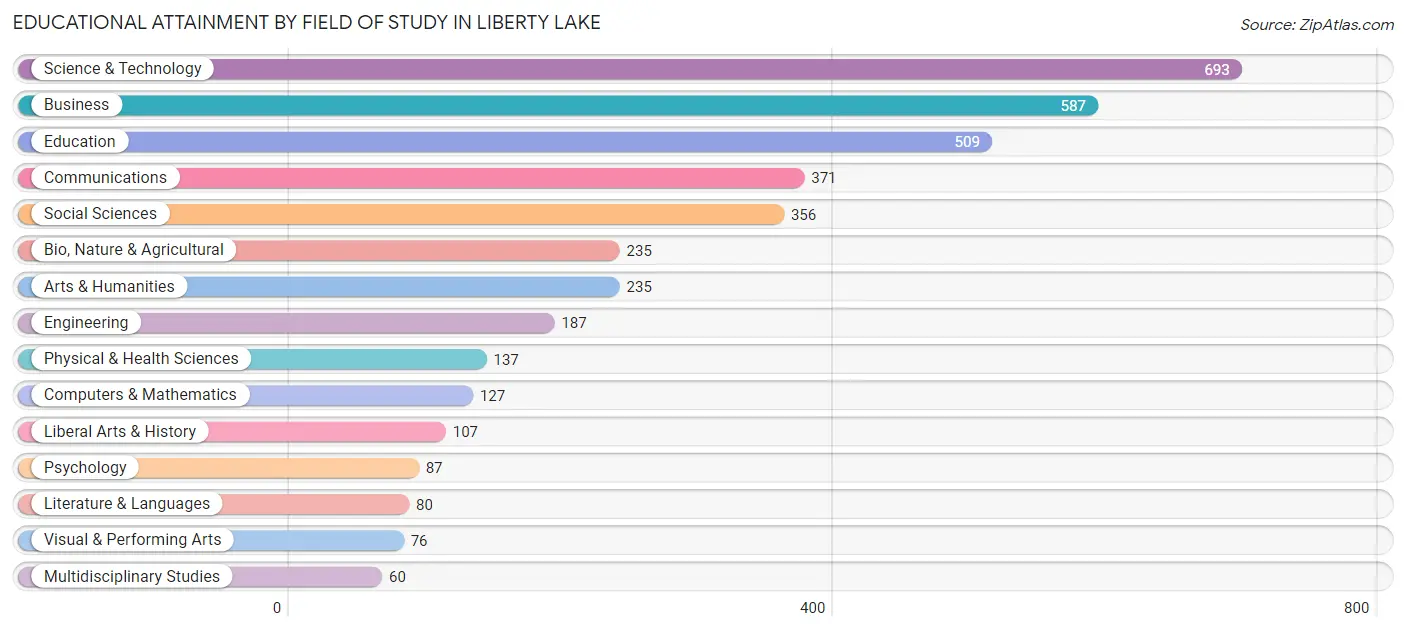
| Field of Study | # Graduates | % Graduates |
| Computers & Mathematics | 127 | 3.3% |
| Bio, Nature & Agricultural | 235 | 6.1% |
| Physical & Health Sciences | 137 | 3.6% |
| Psychology | 87 | 2.3% |
| Social Sciences | 356 | 9.2% |
| Engineering | 187 | 4.9% |
| Multidisciplinary Studies | 60 | 1.6% |
| Science & Technology | 693 | 18.0% |
| Business | 587 | 15.3% |
| Education | 509 | 13.2% |
| Literature & Languages | 80 | 2.1% |
| Liberal Arts & History | 107 | 2.8% |
| Visual & Performing Arts | 76 | 2.0% |
| Communications | 371 | 9.6% |
| Arts & Humanities | 235 | 6.1% |
| Total | 3,847 | 100.0% |
Transportation & Commute in Liberty Lake
Vehicle Availability by Sex in Liberty Lake
The most prevalent vehicle ownership categories in Liberty Lake are males with 2 vehicles (1,284, accounting for 54.4%) and females with 2 vehicles (1,495, making up 45.6%).
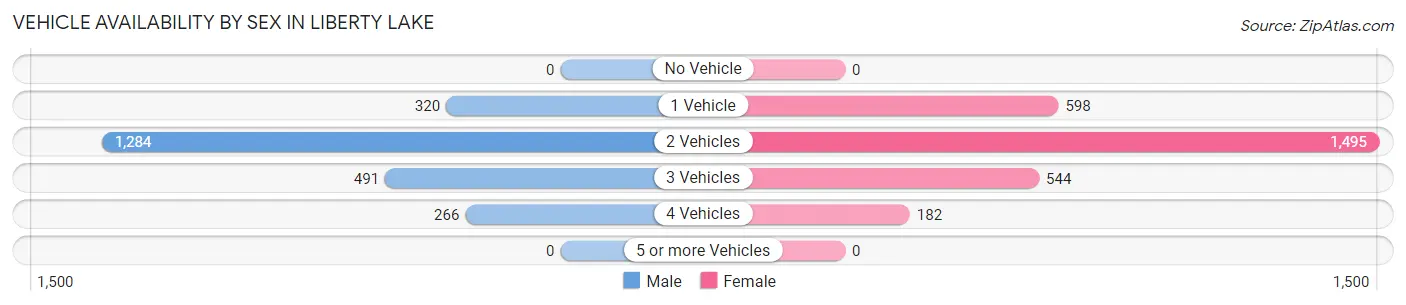
| Vehicles Available | Male | Female |
| No Vehicle | 0 (0.0%) | 0 (0.0%) |
| 1 Vehicle | 320 (13.6%) | 598 (21.2%) |
| 2 Vehicles | 1,284 (54.4%) | 1,495 (53.0%) |
| 3 Vehicles | 491 (20.8%) | 544 (19.3%) |
| 4 Vehicles | 266 (11.3%) | 182 (6.5%) |
| 5 or more Vehicles | 0 (0.0%) | 0 (0.0%) |
| Total | 2,361 (100.0%) | 2,819 (100.0%) |
Commute Time in Liberty Lake
The most frequently occuring commute durations in Liberty Lake are 20 to 24 minutes (814 commuters, 21.0%), 15 to 19 minutes (712 commuters, 18.4%), and 30 to 34 minutes (604 commuters, 15.6%).
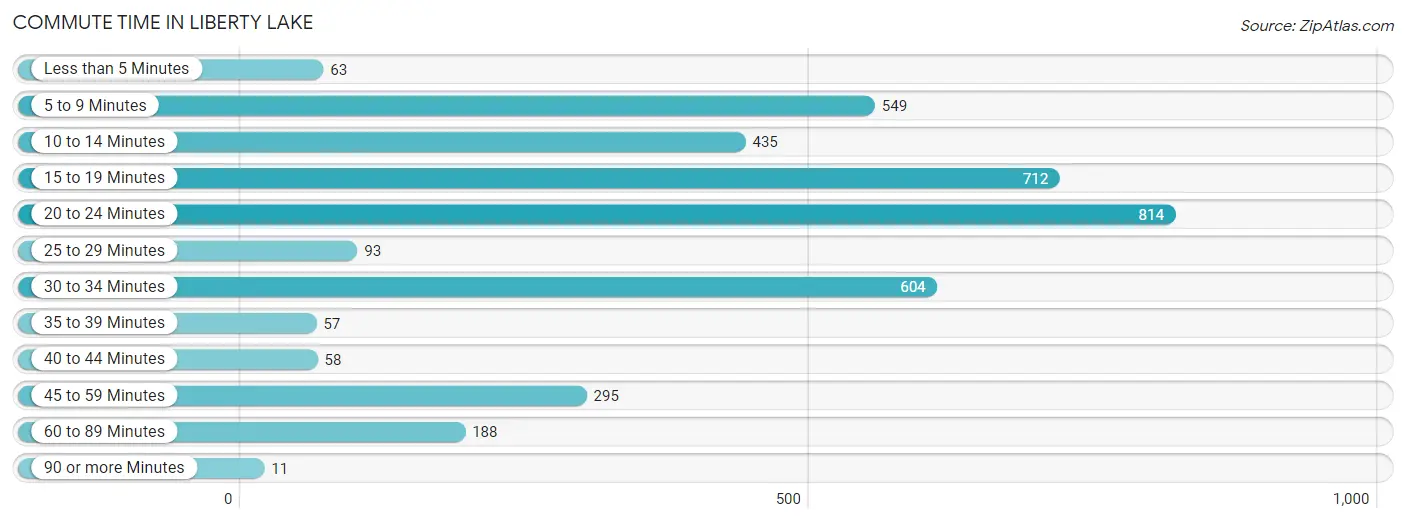
| Commute Time | # Commuters | % Commuters |
| Less than 5 Minutes | 63 | 1.6% |
| 5 to 9 Minutes | 549 | 14.1% |
| 10 to 14 Minutes | 435 | 11.2% |
| 15 to 19 Minutes | 712 | 18.4% |
| 20 to 24 Minutes | 814 | 21.0% |
| 25 to 29 Minutes | 93 | 2.4% |
| 30 to 34 Minutes | 604 | 15.6% |
| 35 to 39 Minutes | 57 | 1.5% |
| 40 to 44 Minutes | 58 | 1.5% |
| 45 to 59 Minutes | 295 | 7.6% |
| 60 to 89 Minutes | 188 | 4.9% |
| 90 or more Minutes | 11 | 0.3% |
Commute Time by Sex in Liberty Lake
The most common commute times in Liberty Lake are 20 to 24 minutes (445 commuters, 25.8%) for males and 15 to 19 minutes (519 commuters, 24.1%) for females.
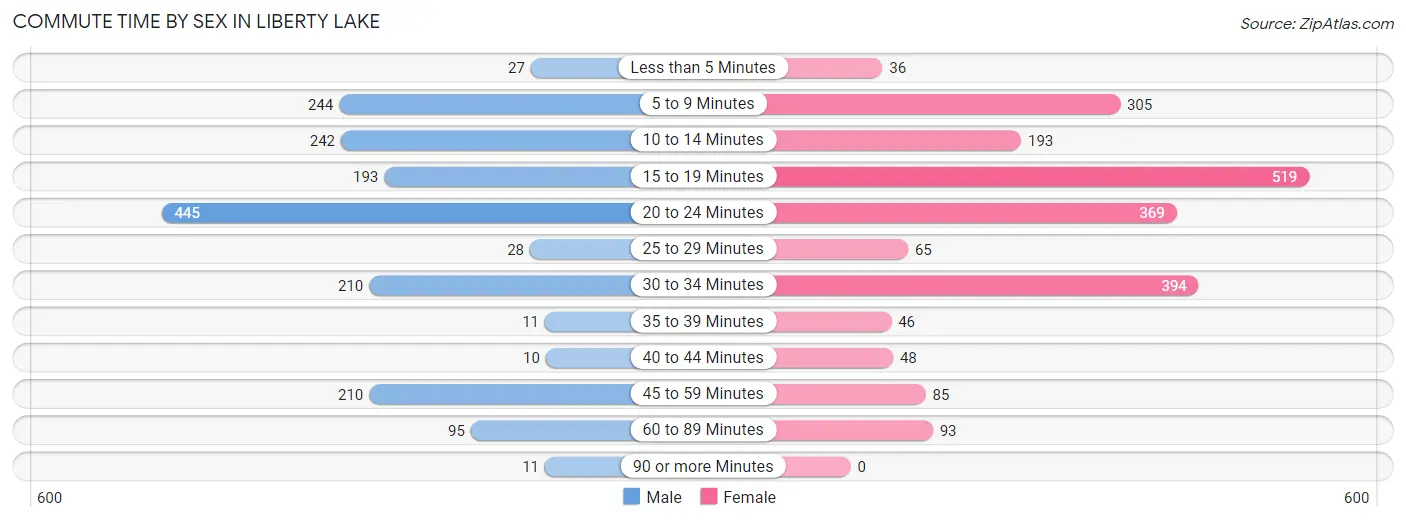
| Commute Time | Male | Female |
| Less than 5 Minutes | 27 (1.6%) | 36 (1.7%) |
| 5 to 9 Minutes | 244 (14.1%) | 305 (14.2%) |
| 10 to 14 Minutes | 242 (14.0%) | 193 (9.0%) |
| 15 to 19 Minutes | 193 (11.2%) | 519 (24.1%) |
| 20 to 24 Minutes | 445 (25.8%) | 369 (17.1%) |
| 25 to 29 Minutes | 28 (1.6%) | 65 (3.0%) |
| 30 to 34 Minutes | 210 (12.2%) | 394 (18.3%) |
| 35 to 39 Minutes | 11 (0.6%) | 46 (2.1%) |
| 40 to 44 Minutes | 10 (0.6%) | 48 (2.2%) |
| 45 to 59 Minutes | 210 (12.2%) | 85 (4.0%) |
| 60 to 89 Minutes | 95 (5.5%) | 93 (4.3%) |
| 90 or more Minutes | 11 (0.6%) | 0 (0.0%) |
Time of Departure to Work by Sex in Liberty Lake
The most frequent times of departure to work in Liberty Lake are 7:30 AM to 7:59 AM (300, 17.4%) for males and 4:00 PM to 11:59 PM (402, 18.7%) for females.
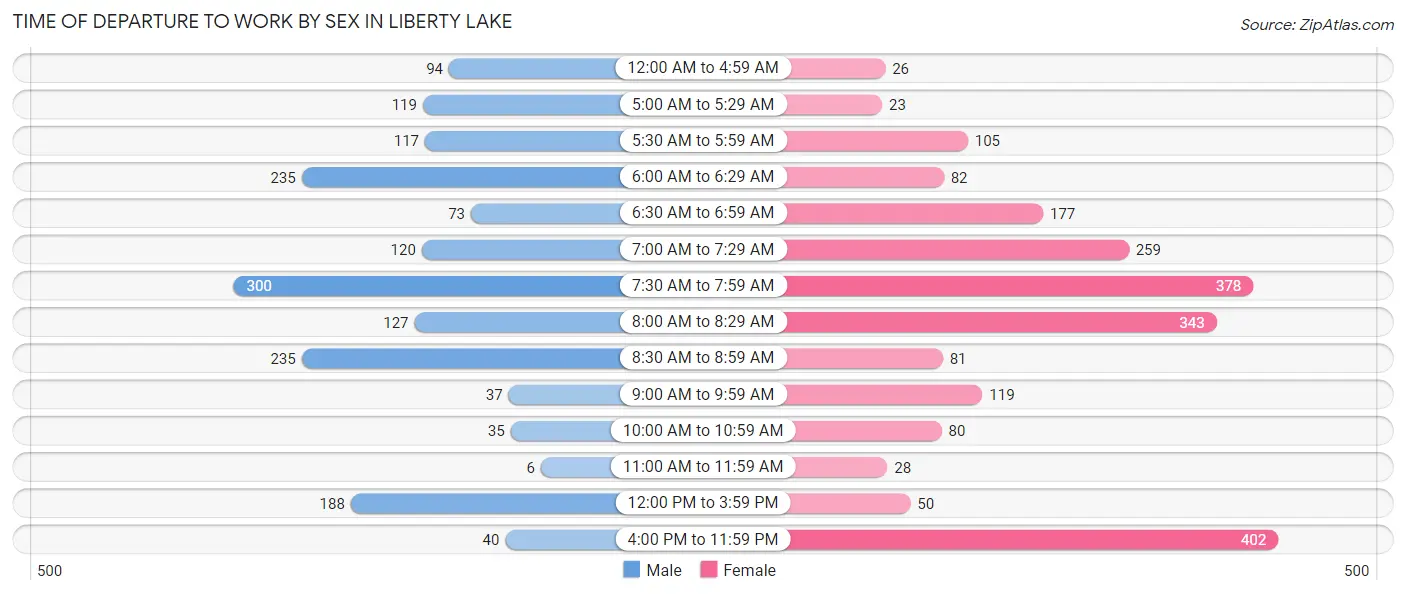
| Time of Departure | Male | Female |
| 12:00 AM to 4:59 AM | 94 (5.4%) | 26 (1.2%) |
| 5:00 AM to 5:29 AM | 119 (6.9%) | 23 (1.1%) |
| 5:30 AM to 5:59 AM | 117 (6.8%) | 105 (4.9%) |
| 6:00 AM to 6:29 AM | 235 (13.6%) | 82 (3.8%) |
| 6:30 AM to 6:59 AM | 73 (4.2%) | 177 (8.2%) |
| 7:00 AM to 7:29 AM | 120 (7.0%) | 259 (12.0%) |
| 7:30 AM to 7:59 AM | 300 (17.4%) | 378 (17.6%) |
| 8:00 AM to 8:29 AM | 127 (7.4%) | 343 (15.9%) |
| 8:30 AM to 8:59 AM | 235 (13.6%) | 81 (3.8%) |
| 9:00 AM to 9:59 AM | 37 (2.1%) | 119 (5.5%) |
| 10:00 AM to 10:59 AM | 35 (2.0%) | 80 (3.7%) |
| 11:00 AM to 11:59 AM | 6 (0.4%) | 28 (1.3%) |
| 12:00 PM to 3:59 PM | 188 (10.9%) | 50 (2.3%) |
| 4:00 PM to 11:59 PM | 40 (2.3%) | 402 (18.7%) |
| Total | 1,726 (100.0%) | 2,153 (100.0%) |
Housing Occupancy in Liberty Lake
Occupancy by Ownership in Liberty Lake
Of the total 4,401 dwellings in Liberty Lake, owner-occupied units account for 2,907 (66.0%), while renter-occupied units make up 1,494 (34.0%).
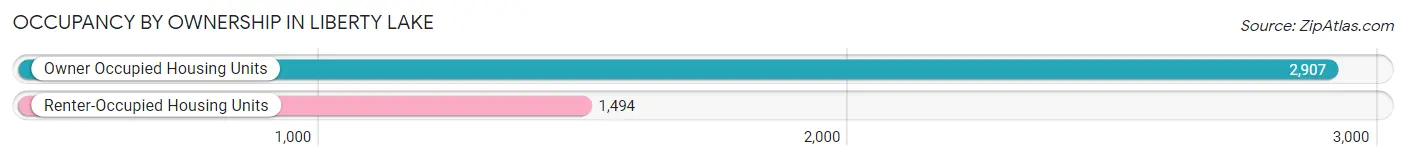
| Occupancy | # Housing Units | % Housing Units |
| Owner Occupied Housing Units | 2,907 | 66.0% |
| Renter-Occupied Housing Units | 1,494 | 34.0% |
| Total Occupied Housing Units | 4,401 | 100.0% |
Occupancy by Household Size in Liberty Lake
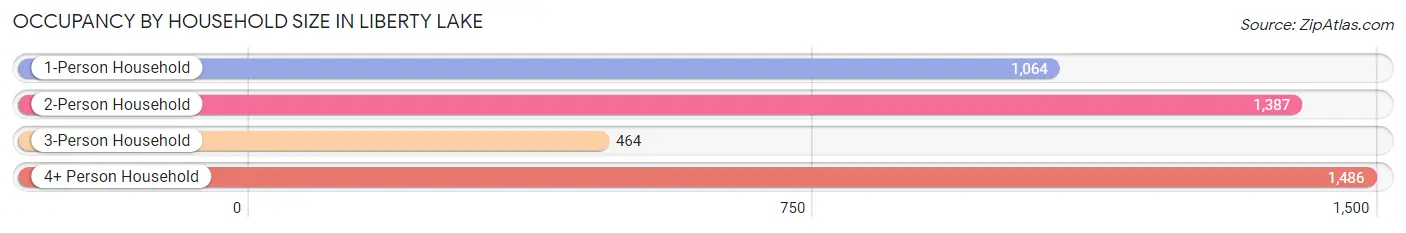
| Household Size | # Housing Units | % Housing Units |
| 1-Person Household | 1,064 | 24.2% |
| 2-Person Household | 1,387 | 31.5% |
| 3-Person Household | 464 | 10.5% |
| 4+ Person Household | 1,486 | 33.8% |
| Total Housing Units | 4,401 | 100.0% |
Occupancy by Ownership by Household Size in Liberty Lake
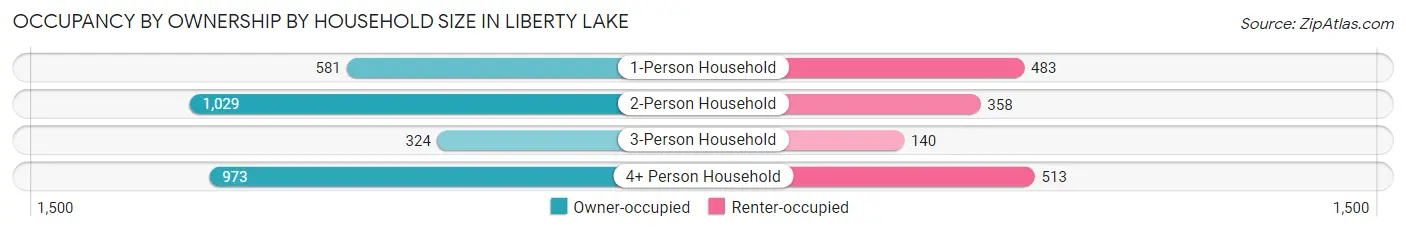
| Household Size | Owner-occupied | Renter-occupied |
| 1-Person Household | 581 (54.6%) | 483 (45.4%) |
| 2-Person Household | 1,029 (74.2%) | 358 (25.8%) |
| 3-Person Household | 324 (69.8%) | 140 (30.2%) |
| 4+ Person Household | 973 (65.5%) | 513 (34.5%) |
| Total Housing Units | 2,907 (66.0%) | 1,494 (34.0%) |
Occupancy by Educational Attainment in Liberty Lake
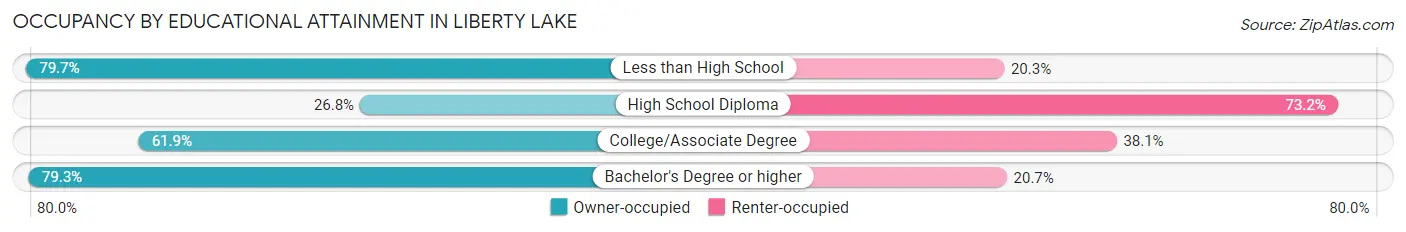
| Household Size | Owner-occupied | Renter-occupied |
| Less than High School | 59 (79.7%) | 15 (20.3%) |
| High School Diploma | 141 (26.8%) | 385 (73.2%) |
| College/Associate Degree | 1,093 (61.9%) | 673 (38.1%) |
| Bachelor's Degree or higher | 1,614 (79.3%) | 421 (20.7%) |
Occupancy by Age of Householder in Liberty Lake
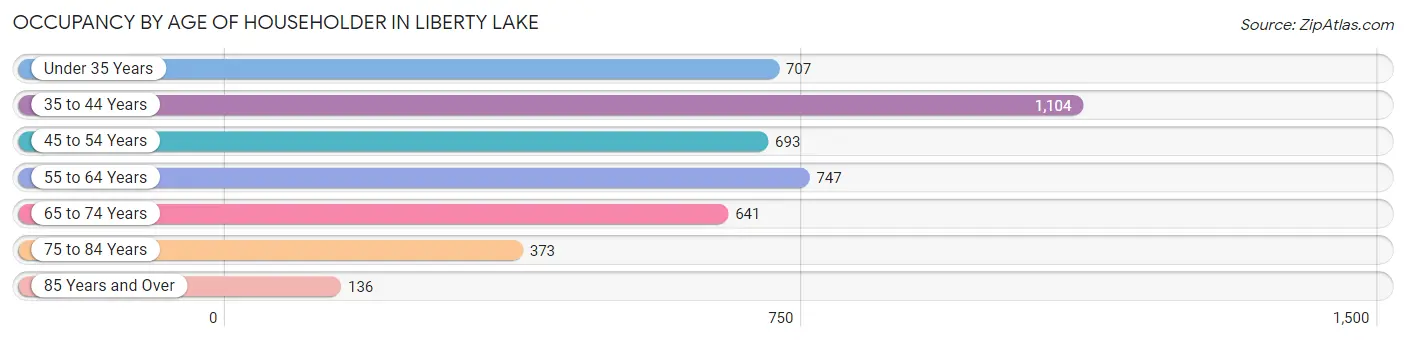
| Age Bracket | # Households | % Households |
| Under 35 Years | 707 | 16.1% |
| 35 to 44 Years | 1,104 | 25.1% |
| 45 to 54 Years | 693 | 15.8% |
| 55 to 64 Years | 747 | 17.0% |
| 65 to 74 Years | 641 | 14.6% |
| 75 to 84 Years | 373 | 8.5% |
| 85 Years and Over | 136 | 3.1% |
| Total | 4,401 | 100.0% |
Housing Finances in Liberty Lake
Median Income by Occupancy in Liberty Lake
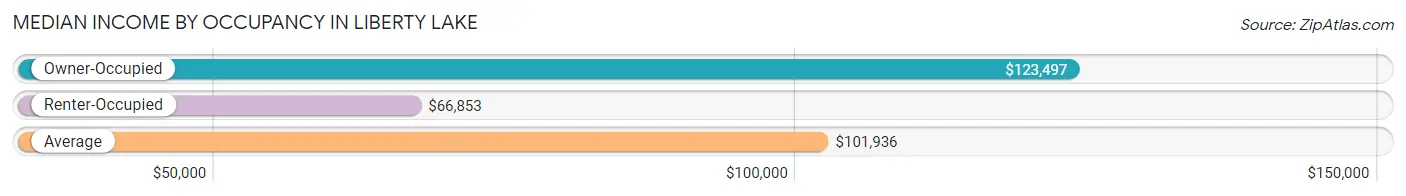
| Occupancy Type | # Households | Median Income |
| Owner-Occupied | 2,907 (66.0%) | $123,497 |
| Renter-Occupied | 1,494 (34.0%) | $66,853 |
| Average | 4,401 (100.0%) | $101,936 |
Occupancy by Householder Income Bracket in Liberty Lake
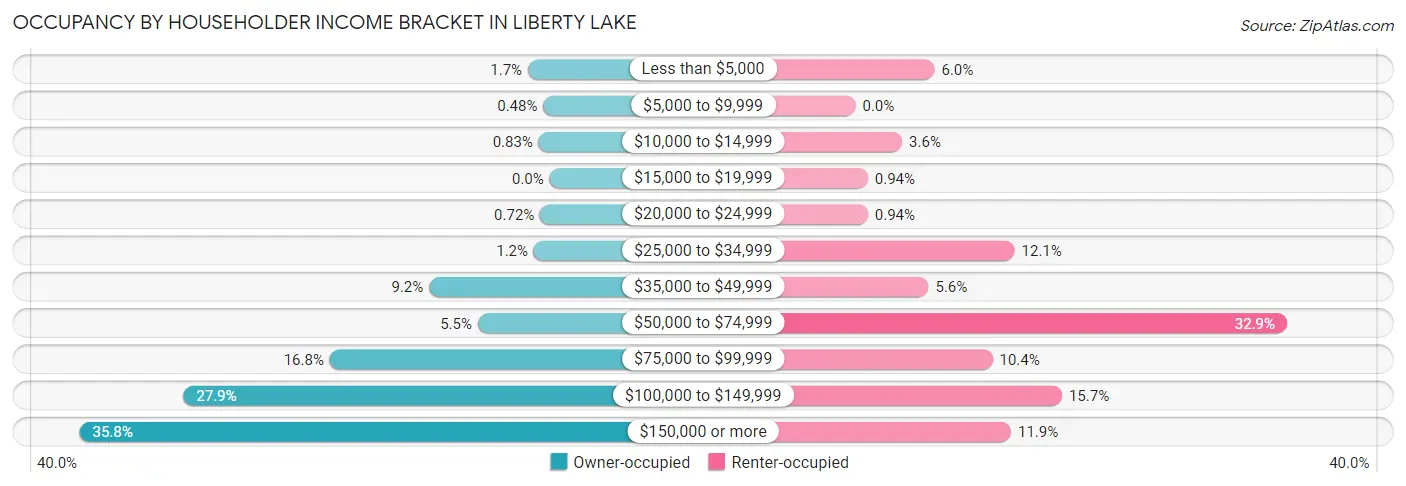
| Income Bracket | Owner-occupied | Renter-occupied |
| Less than $5,000 | 48 (1.7%) | 90 (6.0%) |
| $5,000 to $9,999 | 14 (0.5%) | 0 (0.0%) |
| $10,000 to $14,999 | 24 (0.8%) | 53 (3.5%) |
| $15,000 to $19,999 | 0 (0.0%) | 14 (0.9%) |
| $20,000 to $24,999 | 21 (0.7%) | 14 (0.9%) |
| $25,000 to $34,999 | 35 (1.2%) | 181 (12.1%) |
| $35,000 to $49,999 | 267 (9.2%) | 83 (5.6%) |
| $50,000 to $74,999 | 159 (5.5%) | 491 (32.9%) |
| $75,000 to $99,999 | 487 (16.8%) | 156 (10.4%) |
| $100,000 to $149,999 | 811 (27.9%) | 235 (15.7%) |
| $150,000 or more | 1,041 (35.8%) | 177 (11.8%) |
| Total | 2,907 (100.0%) | 1,494 (100.0%) |
Monthly Housing Cost Tiers in Liberty Lake
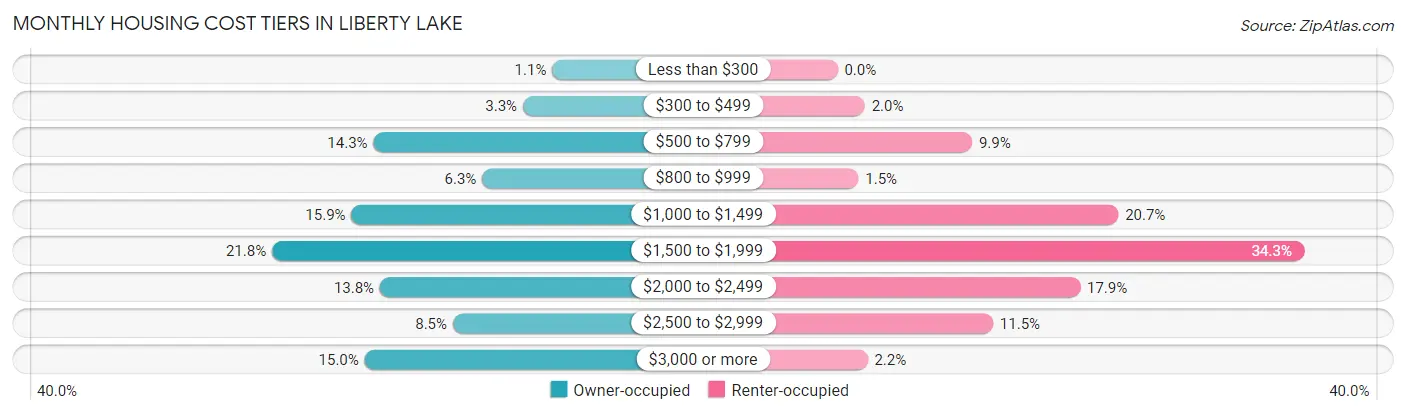
| Monthly Cost | Owner-occupied | Renter-occupied |
| Less than $300 | 33 (1.1%) | 0 (0.0%) |
| $300 to $499 | 96 (3.3%) | 30 (2.0%) |
| $500 to $799 | 416 (14.3%) | 148 (9.9%) |
| $800 to $999 | 183 (6.3%) | 23 (1.5%) |
| $1,000 to $1,499 | 463 (15.9%) | 309 (20.7%) |
| $1,500 to $1,999 | 633 (21.8%) | 513 (34.3%) |
| $2,000 to $2,499 | 402 (13.8%) | 267 (17.9%) |
| $2,500 to $2,999 | 246 (8.5%) | 171 (11.5%) |
| $3,000 or more | 435 (15.0%) | 33 (2.2%) |
| Total | 2,907 (100.0%) | 1,494 (100.0%) |
Physical Housing Characteristics in Liberty Lake
Housing Structures in Liberty Lake
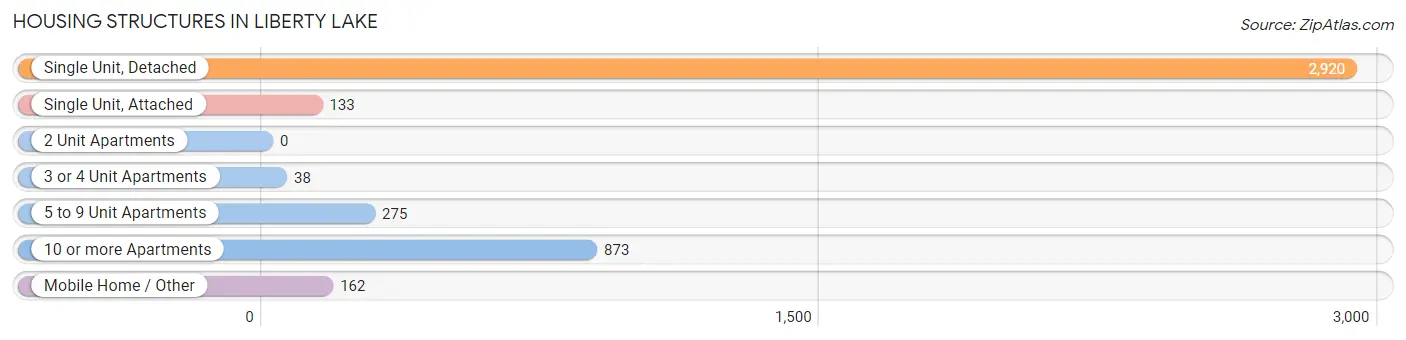
| Structure Type | # Housing Units | % Housing Units |
| Single Unit, Detached | 2,920 | 66.3% |
| Single Unit, Attached | 133 | 3.0% |
| 2 Unit Apartments | 0 | 0.0% |
| 3 or 4 Unit Apartments | 38 | 0.9% |
| 5 to 9 Unit Apartments | 275 | 6.2% |
| 10 or more Apartments | 873 | 19.8% |
| Mobile Home / Other | 162 | 3.7% |
| Total | 4,401 | 100.0% |
Housing Structures by Occupancy in Liberty Lake
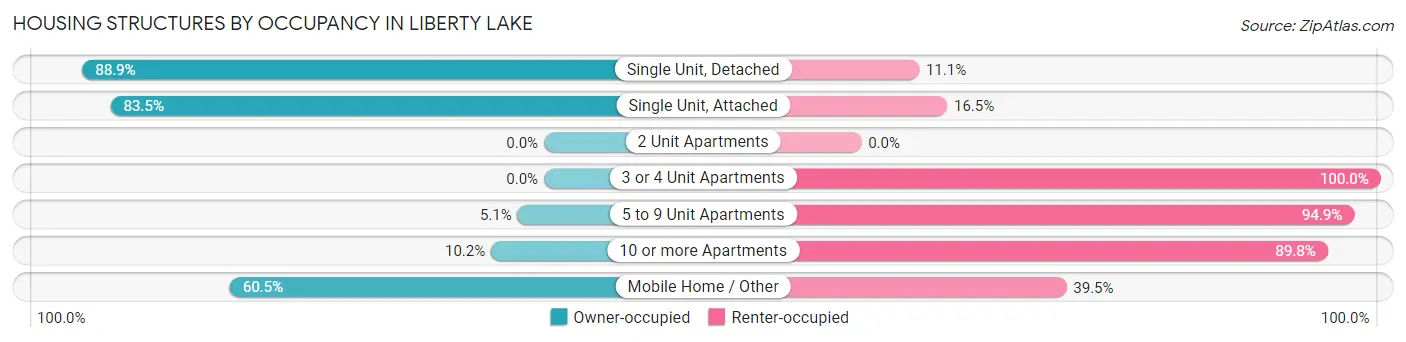
| Structure Type | Owner-occupied | Renter-occupied |
| Single Unit, Detached | 2,595 (88.9%) | 325 (11.1%) |
| Single Unit, Attached | 111 (83.5%) | 22 (16.5%) |
| 2 Unit Apartments | 0 (0.0%) | 0 (0.0%) |
| 3 or 4 Unit Apartments | 0 (0.0%) | 38 (100.0%) |
| 5 to 9 Unit Apartments | 14 (5.1%) | 261 (94.9%) |
| 10 or more Apartments | 89 (10.2%) | 784 (89.8%) |
| Mobile Home / Other | 98 (60.5%) | 64 (39.5%) |
| Total | 2,907 (66.0%) | 1,494 (34.0%) |
Housing Structures by Number of Rooms in Liberty Lake
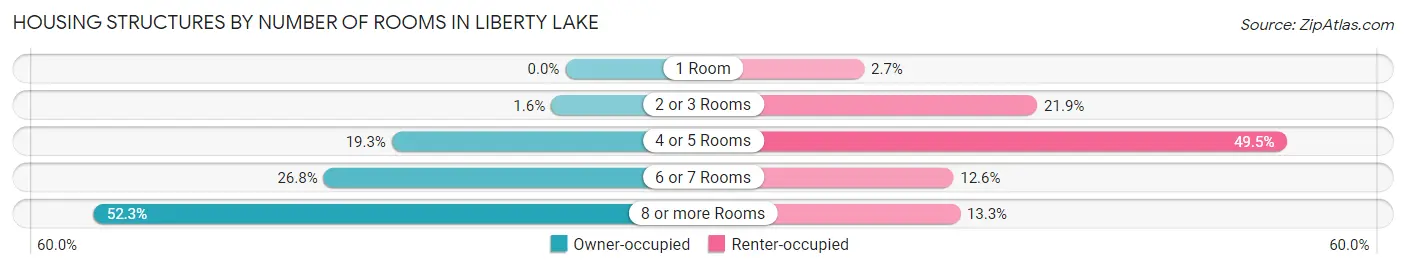
| Number of Rooms | Owner-occupied | Renter-occupied |
| 1 Room | 0 (0.0%) | 40 (2.7%) |
| 2 or 3 Rooms | 46 (1.6%) | 327 (21.9%) |
| 4 or 5 Rooms | 560 (19.3%) | 740 (49.5%) |
| 6 or 7 Rooms | 780 (26.8%) | 188 (12.6%) |
| 8 or more Rooms | 1,521 (52.3%) | 199 (13.3%) |
| Total | 2,907 (100.0%) | 1,494 (100.0%) |
Housing Structure by Heating Type in Liberty Lake
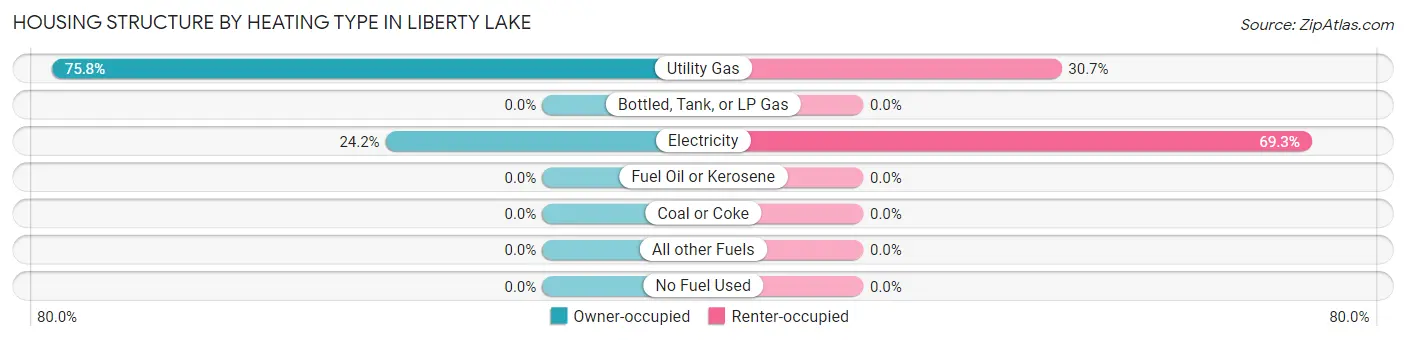
| Heating Type | Owner-occupied | Renter-occupied |
| Utility Gas | 2,203 (75.8%) | 458 (30.7%) |
| Bottled, Tank, or LP Gas | 0 (0.0%) | 0 (0.0%) |
| Electricity | 704 (24.2%) | 1,036 (69.3%) |
| Fuel Oil or Kerosene | 0 (0.0%) | 0 (0.0%) |
| Coal or Coke | 0 (0.0%) | 0 (0.0%) |
| All other Fuels | 0 (0.0%) | 0 (0.0%) |
| No Fuel Used | 0 (0.0%) | 0 (0.0%) |
| Total | 2,907 (100.0%) | 1,494 (100.0%) |
Household Vehicle Usage in Liberty Lake
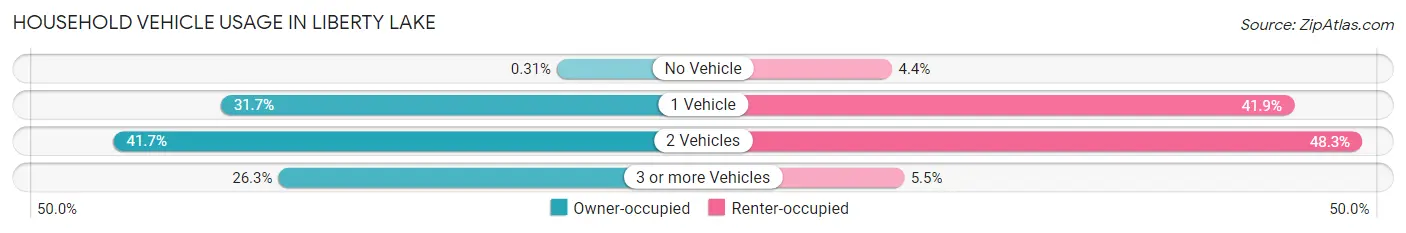
| Vehicles per Household | Owner-occupied | Renter-occupied |
| No Vehicle | 9 (0.3%) | 65 (4.3%) |
| 1 Vehicle | 921 (31.7%) | 626 (41.9%) |
| 2 Vehicles | 1,212 (41.7%) | 721 (48.3%) |
| 3 or more Vehicles | 765 (26.3%) | 82 (5.5%) |
| Total | 2,907 (100.0%) | 1,494 (100.0%) |
Real Estate & Mortgages in Liberty Lake
Real Estate and Mortgage Overview in Liberty Lake
| Characteristic | Without Mortgage | With Mortgage |
| Housing Units | 803 | 2,104 |
| Median Property Value | $446,500 | $435,200 |
| Median Household Income | $80,205 | $851 |
| Monthly Housing Costs | $702 | $435 |
| Real Estate Taxes | $4,686 | $25 |
Property Value by Mortgage Status in Liberty Lake
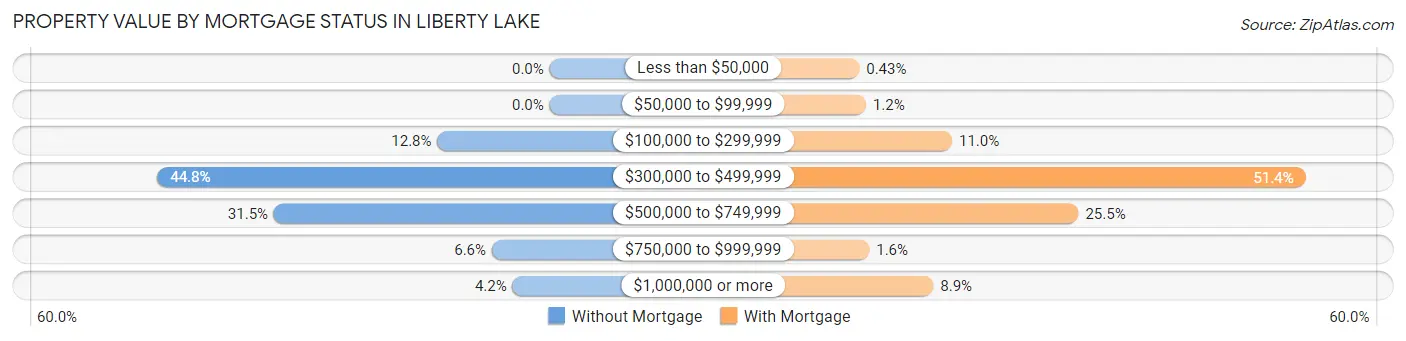
| Property Value | Without Mortgage | With Mortgage |
| Less than $50,000 | 0 (0.0%) | 9 (0.4%) |
| $50,000 to $99,999 | 0 (0.0%) | 25 (1.2%) |
| $100,000 to $299,999 | 103 (12.8%) | 232 (11.0%) |
| $300,000 to $499,999 | 360 (44.8%) | 1,082 (51.4%) |
| $500,000 to $749,999 | 253 (31.5%) | 536 (25.5%) |
| $750,000 to $999,999 | 53 (6.6%) | 33 (1.6%) |
| $1,000,000 or more | 34 (4.2%) | 187 (8.9%) |
| Total | 803 (100.0%) | 2,104 (100.0%) |
Household Income by Mortgage Status in Liberty Lake
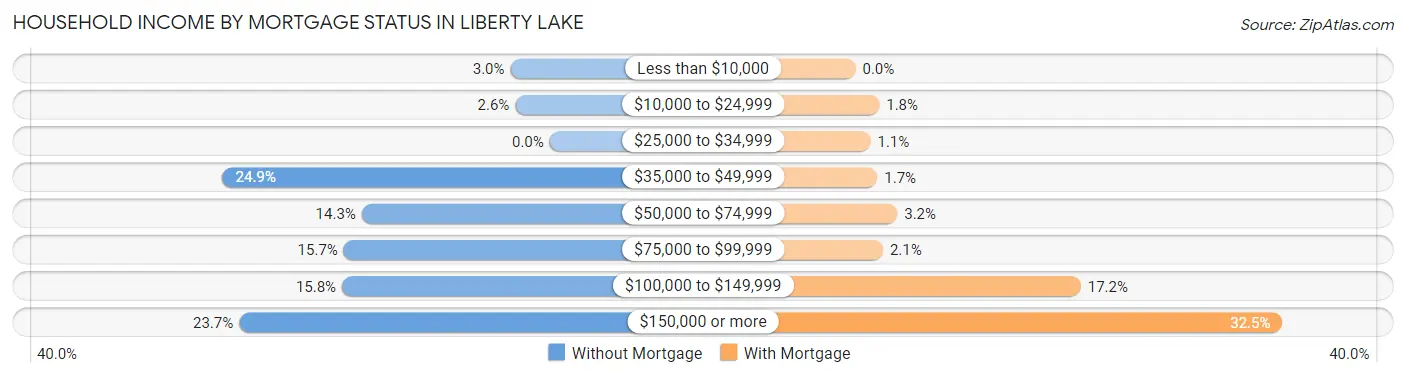
| Household Income | Without Mortgage | With Mortgage |
| Less than $10,000 | 24 (3.0%) | 0 (0.0%) |
| $10,000 to $24,999 | 21 (2.6%) | 38 (1.8%) |
| $25,000 to $34,999 | 0 (0.0%) | 24 (1.1%) |
| $35,000 to $49,999 | 200 (24.9%) | 35 (1.7%) |
| $50,000 to $74,999 | 115 (14.3%) | 67 (3.2%) |
| $75,000 to $99,999 | 126 (15.7%) | 44 (2.1%) |
| $100,000 to $149,999 | 127 (15.8%) | 361 (17.2%) |
| $150,000 or more | 190 (23.7%) | 684 (32.5%) |
| Total | 803 (100.0%) | 2,104 (100.0%) |
Property Value to Household Income Ratio in Liberty Lake
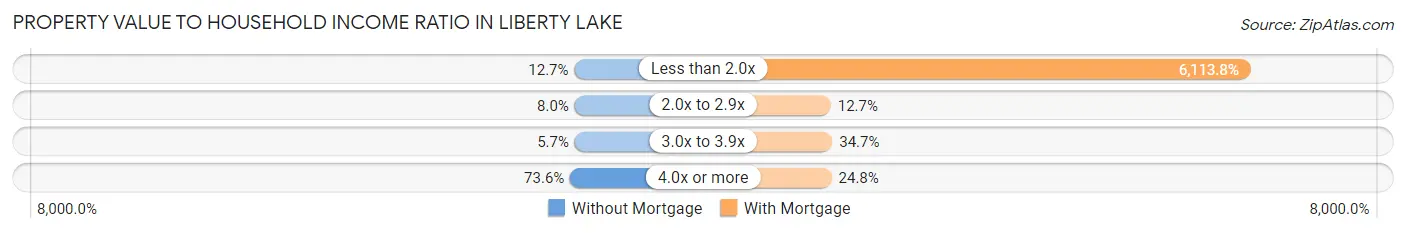
| Value-to-Income Ratio | Without Mortgage | With Mortgage |
| Less than 2.0x | 102 (12.7%) | 128,634 (6,113.8%) |
| 2.0x to 2.9x | 64 (8.0%) | 267 (12.7%) |
| 3.0x to 3.9x | 46 (5.7%) | 729 (34.6%) |
| 4.0x or more | 591 (73.6%) | 521 (24.8%) |
| Total | 803 (100.0%) | 2,104 (100.0%) |
Real Estate Taxes by Mortgage Status in Liberty Lake
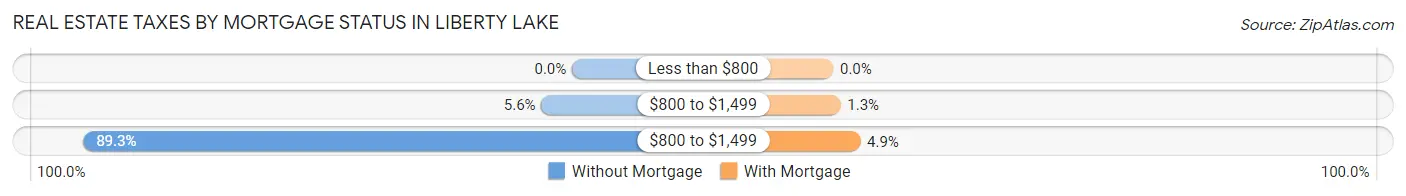
| Property Taxes | Without Mortgage | With Mortgage |
| Less than $800 | 0 (0.0%) | 0 (0.0%) |
| $800 to $1,499 | 45 (5.6%) | 28 (1.3%) |
| $800 to $1,499 | 717 (89.3%) | 104 (4.9%) |
| Total | 803 (100.0%) | 2,104 (100.0%) |
Health & Disability in Liberty Lake
Health Insurance Coverage by Age in Liberty Lake
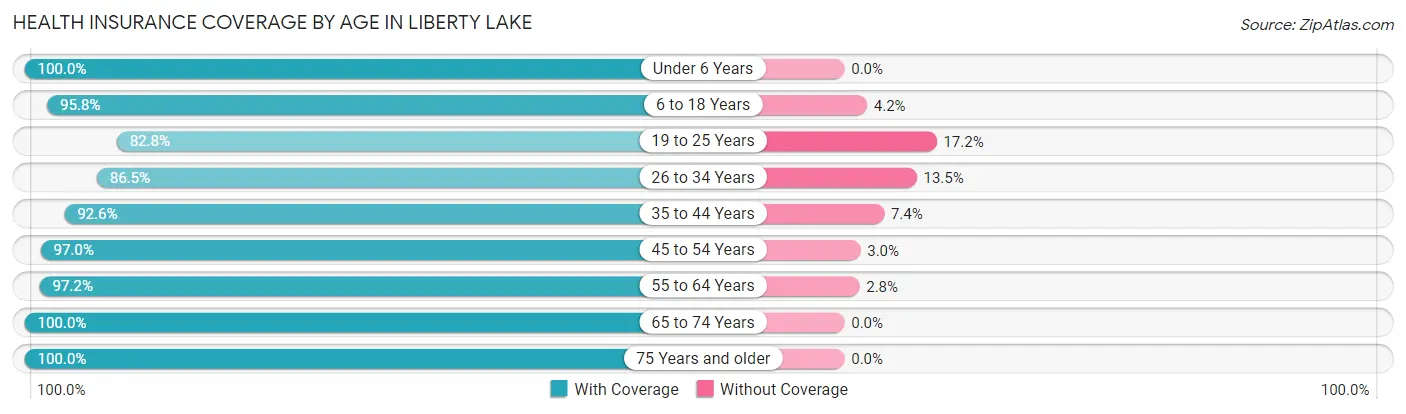
| Age Bracket | With Coverage | Without Coverage |
| Under 6 Years | 1,176 (100.0%) | 0 (0.0%) |
| 6 to 18 Years | 2,534 (95.8%) | 111 (4.2%) |
| 19 to 25 Years | 448 (82.8%) | 93 (17.2%) |
| 26 to 34 Years | 1,015 (86.5%) | 158 (13.5%) |
| 35 to 44 Years | 1,840 (92.6%) | 147 (7.4%) |
| 45 to 54 Years | 1,204 (97.0%) | 37 (3.0%) |
| 55 to 64 Years | 1,252 (97.2%) | 36 (2.8%) |
| 65 to 74 Years | 1,117 (100.0%) | 0 (0.0%) |
| 75 Years and older | 775 (100.0%) | 0 (0.0%) |
| Total | 11,361 (95.1%) | 582 (4.9%) |
Health Insurance Coverage by Citizenship Status in Liberty Lake
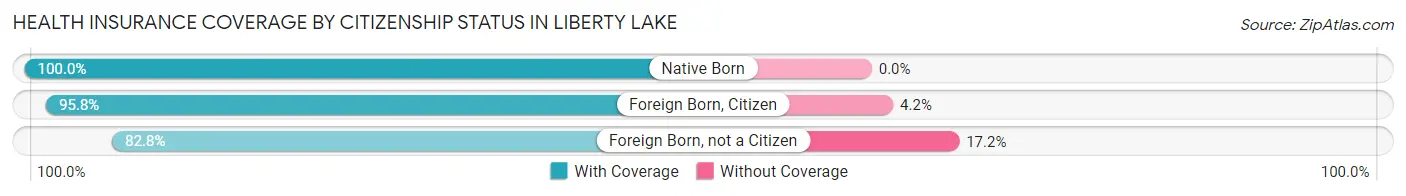
| Citizenship Status | With Coverage | Without Coverage |
| Native Born | 1,176 (100.0%) | 0 (0.0%) |
| Foreign Born, Citizen | 2,534 (95.8%) | 111 (4.2%) |
| Foreign Born, not a Citizen | 448 (82.8%) | 93 (17.2%) |
Health Insurance Coverage by Household Income in Liberty Lake
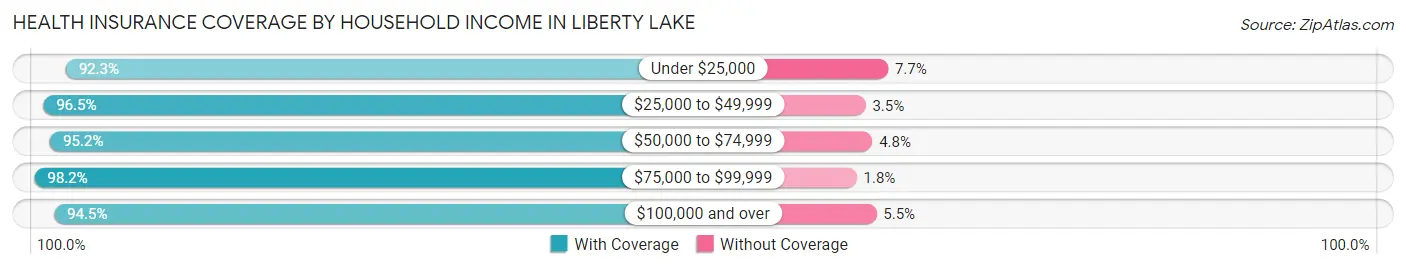
| Household Income | With Coverage | Without Coverage |
| Under $25,000 | 335 (92.3%) | 28 (7.7%) |
| $25,000 to $49,999 | 1,049 (96.5%) | 38 (3.5%) |
| $50,000 to $74,999 | 1,700 (95.2%) | 85 (4.8%) |
| $75,000 to $99,999 | 1,332 (98.2%) | 25 (1.8%) |
| $100,000 and over | 6,939 (94.5%) | 406 (5.5%) |
Public vs Private Health Insurance Coverage by Age in Liberty Lake
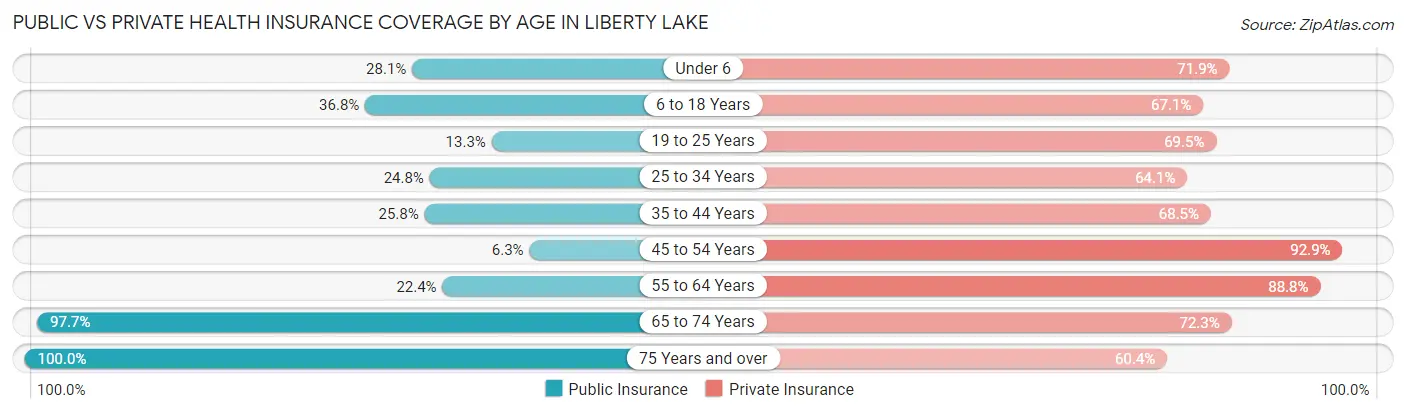
| Age Bracket | Public Insurance | Private Insurance |
| Under 6 | 330 (28.1%) | 846 (71.9%) |
| 6 to 18 Years | 973 (36.8%) | 1,774 (67.1%) |
| 19 to 25 Years | 72 (13.3%) | 376 (69.5%) |
| 25 to 34 Years | 291 (24.8%) | 752 (64.1%) |
| 35 to 44 Years | 512 (25.8%) | 1,361 (68.5%) |
| 45 to 54 Years | 78 (6.3%) | 1,153 (92.9%) |
| 55 to 64 Years | 289 (22.4%) | 1,144 (88.8%) |
| 65 to 74 Years | 1,091 (97.7%) | 808 (72.3%) |
| 75 Years and over | 775 (100.0%) | 468 (60.4%) |
| Total | 4,411 (36.9%) | 8,682 (72.7%) |
Disability Status by Sex by Age in Liberty Lake
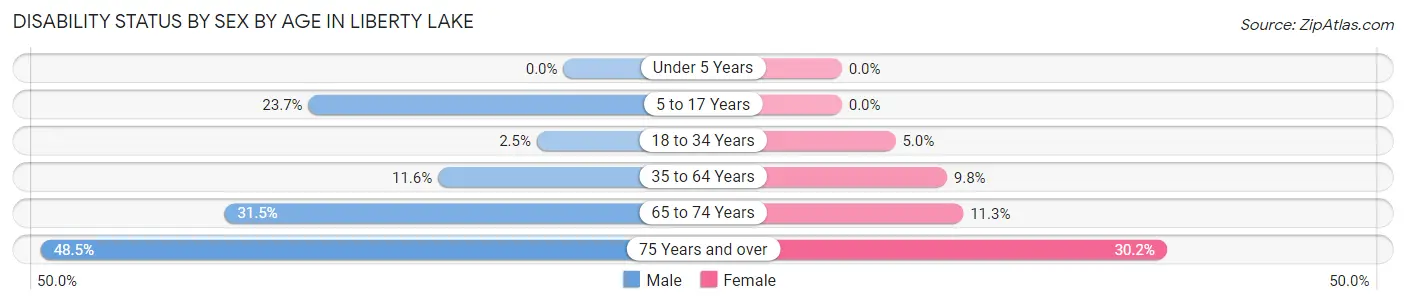
| Age Bracket | Male | Female |
| Under 5 Years | 0 (0.0%) | 0 (0.0%) |
| 5 to 17 Years | 345 (23.7%) | 0 (0.0%) |
| 18 to 34 Years | 19 (2.5%) | 57 (5.0%) |
| 35 to 64 Years | 246 (11.6%) | 234 (9.8%) |
| 65 to 74 Years | 156 (31.5%) | 70 (11.3%) |
| 75 Years and over | 178 (48.5%) | 123 (30.1%) |
Disability Class by Sex by Age in Liberty Lake
Disability Class: Hearing Difficulty
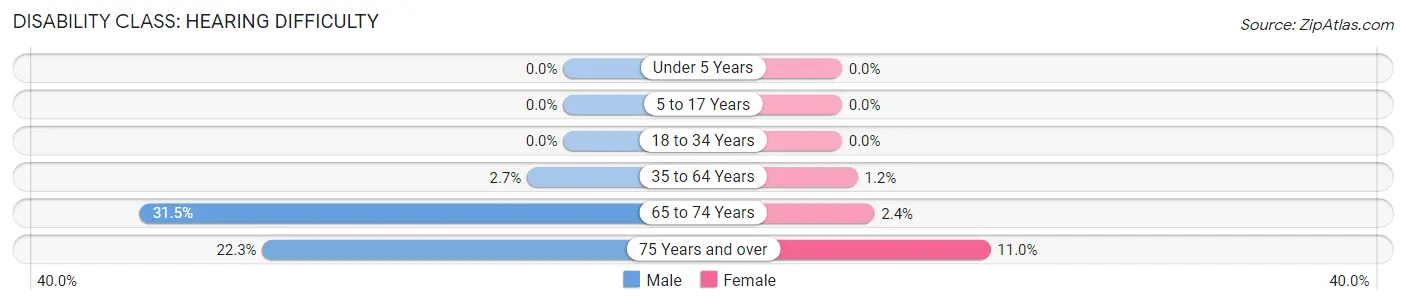
| Age Bracket | Male | Female |
| Under 5 Years | 0 (0.0%) | 0 (0.0%) |
| 5 to 17 Years | 0 (0.0%) | 0 (0.0%) |
| 18 to 34 Years | 0 (0.0%) | 0 (0.0%) |
| 35 to 64 Years | 57 (2.7%) | 28 (1.2%) |
| 65 to 74 Years | 156 (31.5%) | 15 (2.4%) |
| 75 Years and over | 82 (22.3%) | 45 (11.0%) |
Disability Class: Vision Difficulty
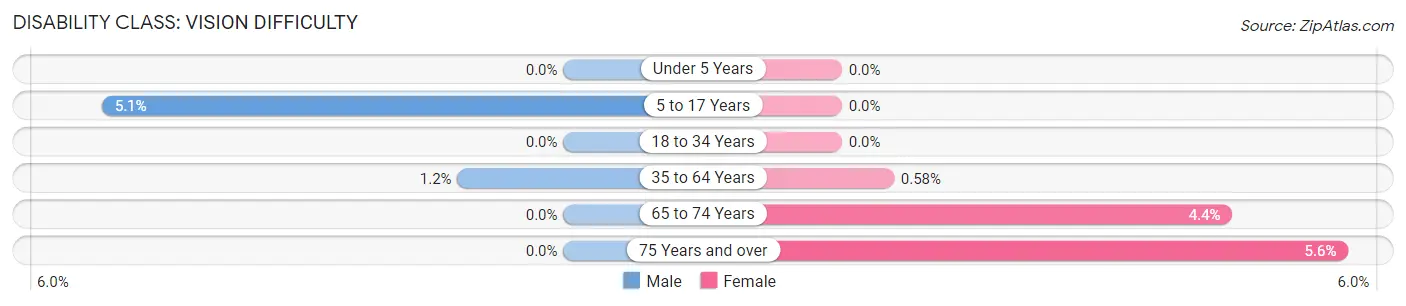
| Age Bracket | Male | Female |
| Under 5 Years | 0 (0.0%) | 0 (0.0%) |
| 5 to 17 Years | 75 (5.1%) | 0 (0.0%) |
| 18 to 34 Years | 0 (0.0%) | 0 (0.0%) |
| 35 to 64 Years | 25 (1.2%) | 14 (0.6%) |
| 65 to 74 Years | 0 (0.0%) | 27 (4.3%) |
| 75 Years and over | 0 (0.0%) | 23 (5.6%) |
Disability Class: Cognitive Difficulty
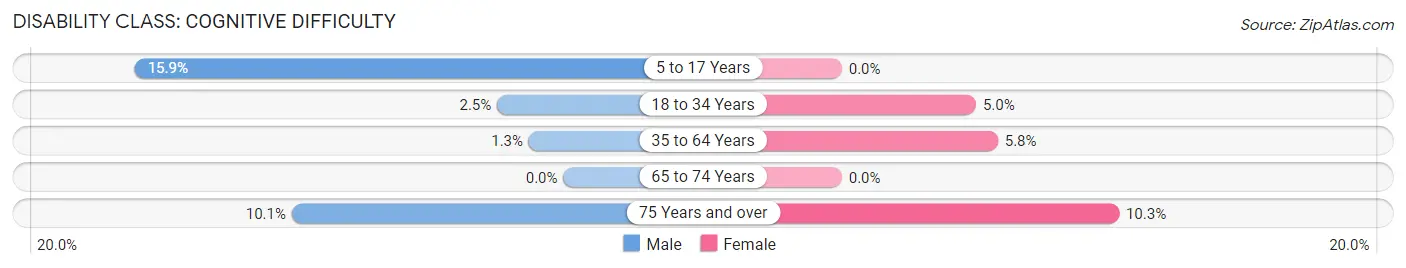
| Age Bracket | Male | Female |
| 5 to 17 Years | 232 (15.9%) | 0 (0.0%) |
| 18 to 34 Years | 19 (2.5%) | 57 (5.0%) |
| 35 to 64 Years | 27 (1.3%) | 139 (5.8%) |
| 65 to 74 Years | 0 (0.0%) | 0 (0.0%) |
| 75 Years and over | 37 (10.1%) | 42 (10.3%) |
Disability Class: Ambulatory Difficulty
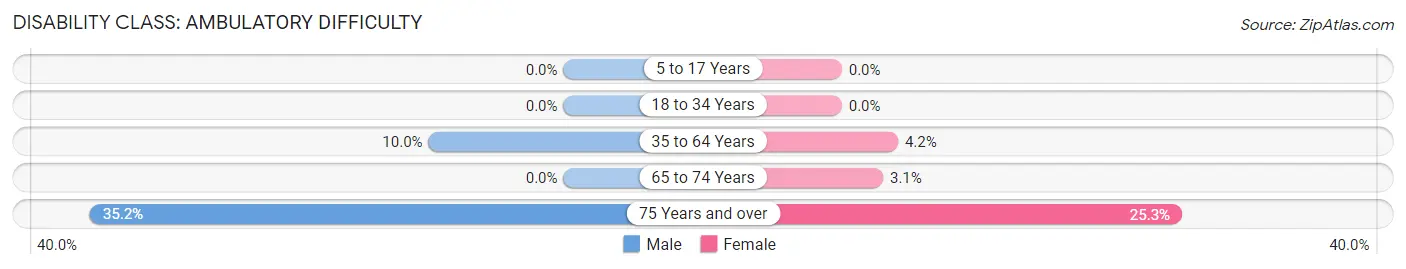
| Age Bracket | Male | Female |
| 5 to 17 Years | 0 (0.0%) | 0 (0.0%) |
| 18 to 34 Years | 0 (0.0%) | 0 (0.0%) |
| 35 to 64 Years | 212 (10.0%) | 100 (4.2%) |
| 65 to 74 Years | 0 (0.0%) | 19 (3.1%) |
| 75 Years and over | 129 (35.1%) | 103 (25.3%) |
Disability Class: Self-Care Difficulty
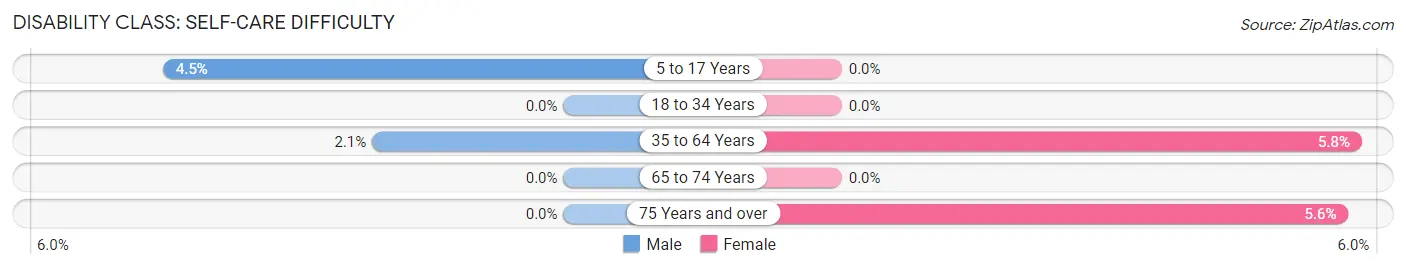
| Age Bracket | Male | Female |
| 5 to 17 Years | 65 (4.5%) | 0 (0.0%) |
| 18 to 34 Years | 0 (0.0%) | 0 (0.0%) |
| 35 to 64 Years | 45 (2.1%) | 139 (5.8%) |
| 65 to 74 Years | 0 (0.0%) | 0 (0.0%) |
| 75 Years and over | 0 (0.0%) | 23 (5.6%) |
Technology Access in Liberty Lake
Computing Device Access in Liberty Lake
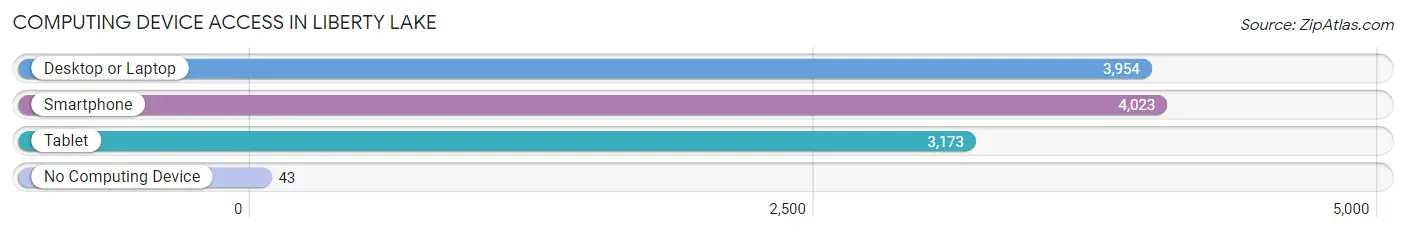
| Device Type | # Households | % Households |
| Desktop or Laptop | 3,954 | 89.8% |
| Smartphone | 4,023 | 91.4% |
| Tablet | 3,173 | 72.1% |
| No Computing Device | 43 | 1.0% |
| Total | 4,401 | 100.0% |
Internet Access in Liberty Lake
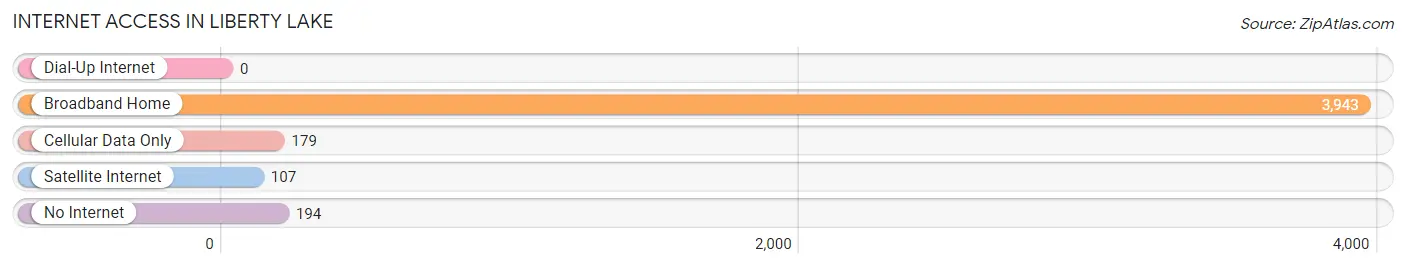
| Internet Type | # Households | % Households |
| Dial-Up Internet | 0 | 0.0% |
| Broadband Home | 3,943 | 89.6% |
| Cellular Data Only | 179 | 4.1% |
| Satellite Internet | 107 | 2.4% |
| No Internet | 194 | 4.4% |
| Total | 4,401 | 100.0% |
Liberty Lake Summary
Liberty Lake is a city located in Spokane County, Washington, United States. The population was 7,591 at the 2010 census. It is bordered by the cities of Spokane Valley to the north, Millwood to the east, and the Idaho state line to the south and west.
History
The area that is now Liberty Lake was originally inhabited by the Spokane Tribe of Native Americans. The first non-native settlers arrived in the area in the late 1800s, and the area was officially incorporated as a city in 2001.
The city was named after Liberty Lake, a natural lake located in the center of the city. The lake was named by early settlers who were inspired by the lake's beauty and the freedom they felt living in the area.
Geography
Liberty Lake is located in the Spokane Valley, a region of the Inland Northwest. The city is situated on the eastern edge of the Spokane Valley, near the Idaho state line. The city is bordered by the cities of Spokane Valley to the north, Millwood to the east, and the Idaho state line to the south and west.
The city is located at an elevation of 2,072 feet (631 m) above sea level. The city covers an area of 8.3 square miles (21.5 km2), of which 8.2 square miles (21.3 km2) is land and 0.1 square miles (0.2 km2) is water.
Economy
The economy of Liberty Lake is largely based on retail, services, and light manufacturing. The city is home to several large employers, including the Liberty Lake Sewer and Water District, the Liberty Lake Municipal Library, and the Liberty Lake Police Department.
The city is also home to several large retail stores, including Walmart, Home Depot, and Lowe's. The city is also home to several restaurants, including the Liberty Lake Diner, the Liberty Lake Tap House, and the Liberty Lake Pizza Company.
Demographics
As of the 2010 census, there were 7,591 people, 2,845 households, and 2,072 families residing in the city. The population density was 919.3 people per square mile (354.2/km2). There were 3,039 housing units at an average density of 369.3 per square mile (142.7/km2). The racial makeup of the city was 92.2% White, 0.7% African American, 0.7% Native American, 2.2% Asian, 0.1% Pacific Islander, 1.7% from other races, and 2.4% from two or more races. Hispanic or Latino of any race were 4.7% of the population.
There were 2,845 households, out of which 37.2% had children under the age of 18 living with them, 58.2% were married couples living together, 9.2% had a female householder with no husband present, and 28.7% were non-families. 22.2% of all households were made up of individuals, and 6.2% had someone living alone who was 65 years of age or older. The average household size was 2.67 and the average family size was 3.14.
In the city, the population was spread out, with 28.2% under the age of 18, 7.2% from 18 to 24, 30.2% from 25 to 44, 25.2% from 45 to 64, and 9.2% who were 65 years of age or older. The median age was 36 years. For every 100 females, there were 97.2 males. For every 100 females age 18 and over, there were 94.2 males.
The median income for a household in the city was $54,917, and the median income for a family was $62,917. Males had a median income of $45,000 versus $30,000 for females. The per capita income for the city was $25,917. About 4.2% of families and 5.7% of the population were below the poverty line, including 6.7% of those under age 18 and 4.2% of those age 65 or over.
Common Questions
What is Per Capita Income in Liberty Lake?
Per Capita income in Liberty Lake is $48,512.
What is the Median Family Income in Liberty Lake?
Median Family Income in Liberty Lake is $122,787.
What is the Median Household income in Liberty Lake?
Median Household Income in Liberty Lake is $101,936.
What is Income or Wage Gap in Liberty Lake?
Income or Wage Gap in Liberty Lake is 37.3%.
Women in Liberty Lake earn 62.7 cents for every dollar earned by a man.
What is Inequality or Gini Index in Liberty Lake?
Inequality or Gini Index in Liberty Lake is 0.44.
What is the Total Population of Liberty Lake?
Total Population of Liberty Lake is 12,026.
What is the Total Male Population of Liberty Lake?
Total Male Population of Liberty Lake is 5,659.
What is the Total Female Population of Liberty Lake?
Total Female Population of Liberty Lake is 6,367.
What is the Ratio of Males per 100 Females in Liberty Lake?
There are 88.88 Males per 100 Females in Liberty Lake.
What is the Ratio of Females per 100 Males in Liberty Lake?
There are 112.51 Females per 100 Males in Liberty Lake.
What is the Median Population Age in Liberty Lake?
Median Population Age in Liberty Lake is 36.9 Years.
What is the Average Family Size in Liberty Lake
Average Family Size in Liberty Lake is 3.3 People.
What is the Average Household Size in Liberty Lake
Average Household Size in Liberty Lake is 2.7 People.
How Large is the Labor Force in Liberty Lake?
There are 5,559 People in the Labor Forcein in Liberty Lake.
What is the Percentage of People in the Labor Force in Liberty Lake?
63.2% of People are in the Labor Force in Liberty Lake.
What is the Unemployment Rate in Liberty Lake?
Unemployment Rate in Liberty Lake is 4.7%.