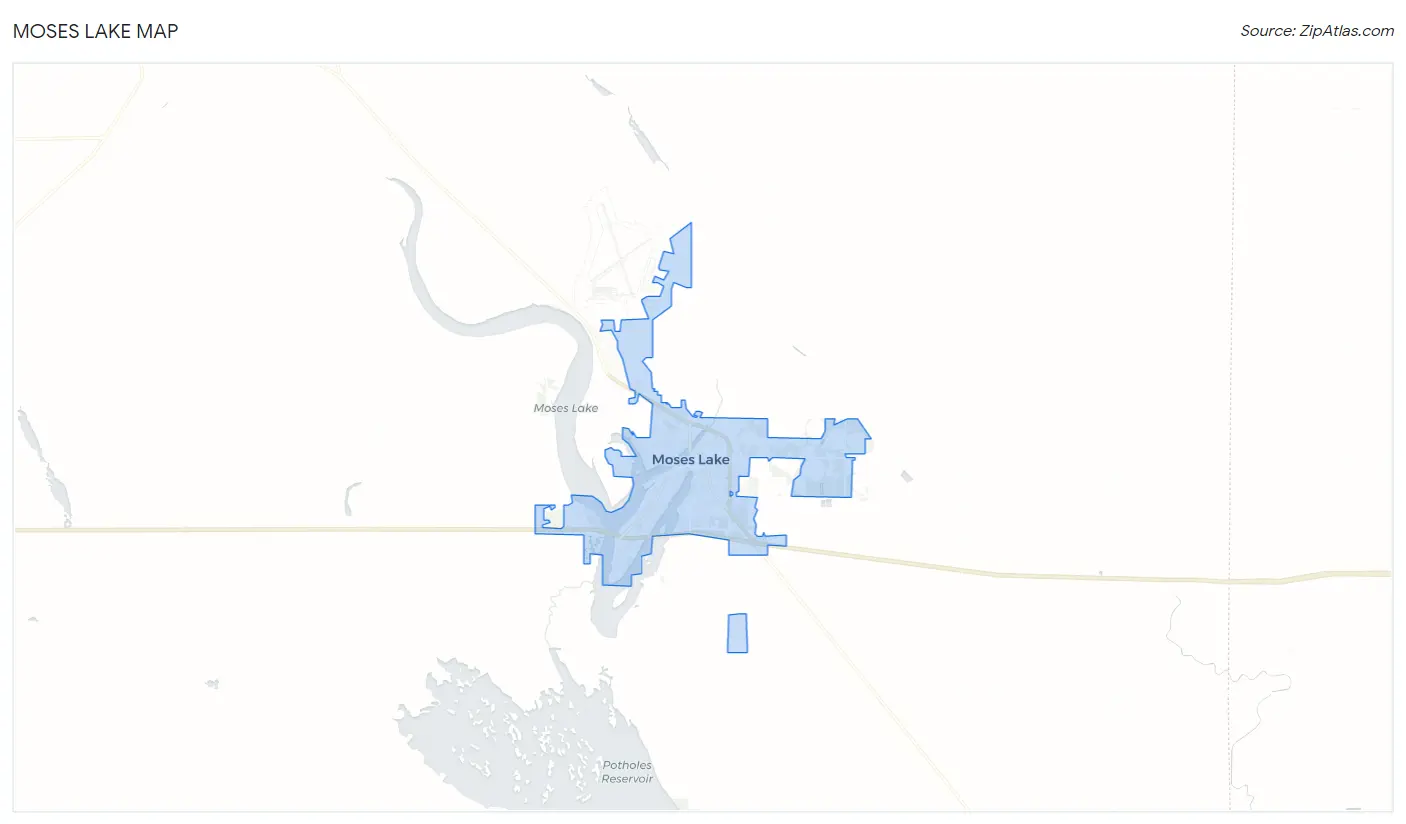
Moses Lake, WA Map & Demographics
Moses Lake Map
Moses Lake Overview
$30,269
PER CAPITA INCOME
$74,959
AVG FAMILY INCOME
$66,218
AVG HOUSEHOLD INCOME
33.4%
WAGE / INCOME GAP [ % ]
66.6¢/ $1
WAGE / INCOME GAP [ $ ]
$12,068
FAMILY INCOME DEFICIT
0.41
INEQUALITY / GINI INDEX
25,155
TOTAL POPULATION
11,977
MALE POPULATION
13,178
FEMALE POPULATION
90.89
MALES / 100 FEMALES
110.03
FEMALES / 100 MALES
31.1
MEDIAN AGE
3.5
AVG FAMILY SIZE
2.7
AVG HOUSEHOLD SIZE
12,307
LABOR FORCE [ PEOPLE ]
64.4%
PERCENT IN LABOR FORCE
5.1%
UNEMPLOYMENT RATE
Moses Lake Zip Codes
Moses Lake Area Codes
Income in Moses Lake
Income Overview in Moses Lake
Per Capita Income in Moses Lake is $30,269, while median incomes of families and households are $74,959 and $66,218 respectively.
| Characteristic | Number | Measure |
| Per Capita Income | 25,155 | $30,269 |
| Median Family Income | 5,501 | $74,959 |
| Mean Family Income | 5,501 | $85,689 |
| Median Household Income | 9,223 | $66,218 |
| Mean Household Income | 9,223 | $79,204 |
| Income Deficit | 5,501 | $12,068 |
| Wage / Income Gap (%) | 25,155 | 33.40% |
| Wage / Income Gap ($) | 25,155 | 66.60¢ per $1 |
| Gini / Inequality Index | 25,155 | 0.41 |
Earnings by Sex in Moses Lake
Average Earnings in Moses Lake are $40,996, $49,046 for men and $32,667 for women, a difference of 33.4%.
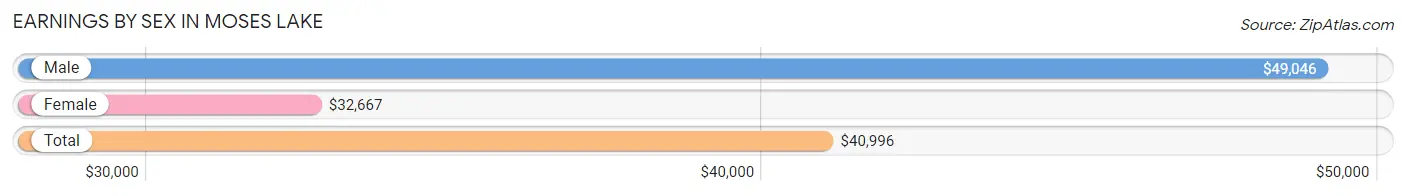
| Sex | Number | Average Earnings |
| Male | 6,311 (50.1%) | $49,046 |
| Female | 6,285 (49.9%) | $32,667 |
| Total | 12,596 (100.0%) | $40,996 |
Earnings by Sex by Income Bracket in Moses Lake
The most common earnings brackets in Moses Lake are $55,000 to $64,999 for men (849 | 13.5%) and $25,000 to $29,999 for women (838 | 13.3%).
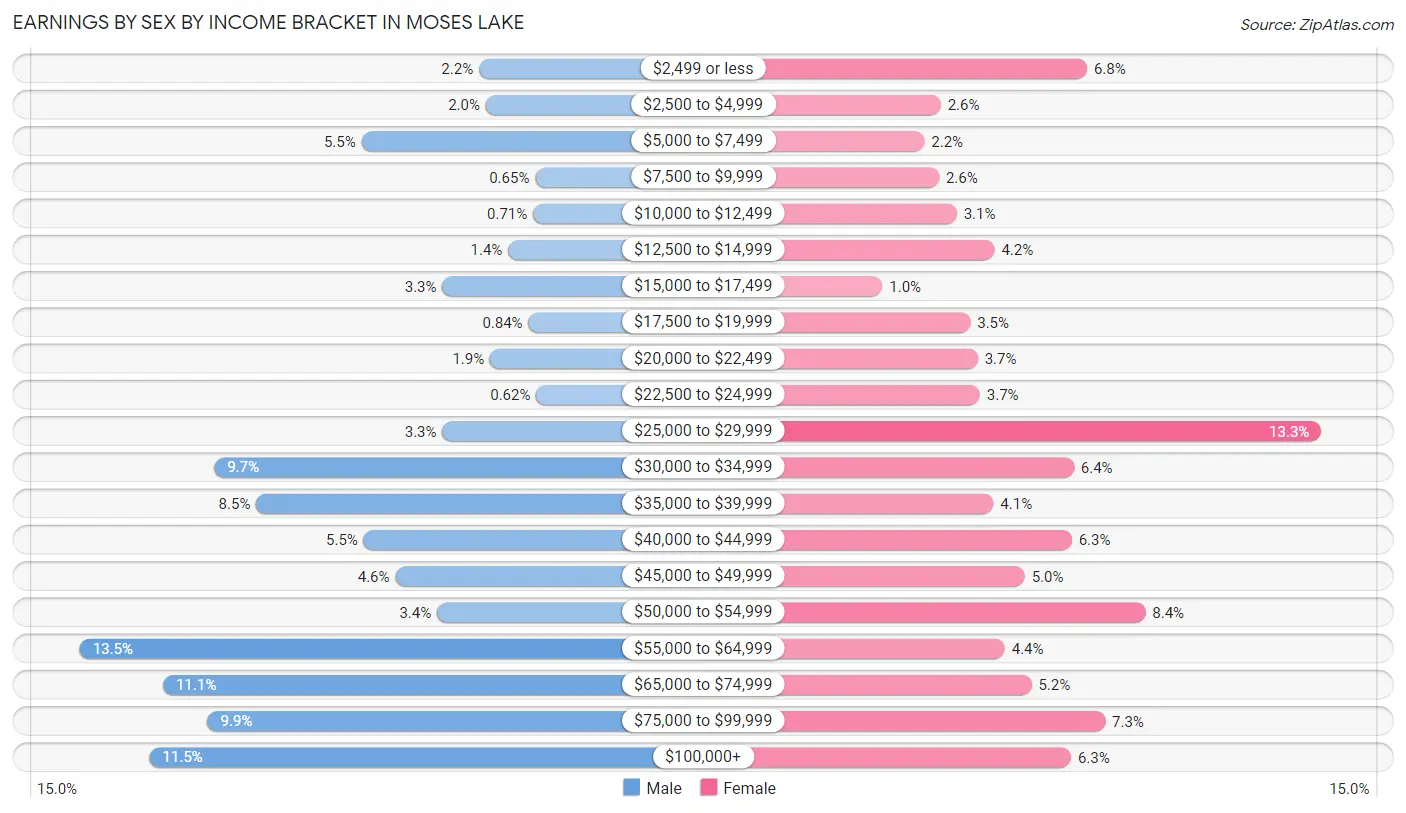
| Income | Male | Female |
| $2,499 or less | 141 (2.2%) | 424 (6.8%) |
| $2,500 to $4,999 | 129 (2.0%) | 166 (2.6%) |
| $5,000 to $7,499 | 349 (5.5%) | 137 (2.2%) |
| $7,500 to $9,999 | 41 (0.6%) | 163 (2.6%) |
| $10,000 to $12,499 | 45 (0.7%) | 194 (3.1%) |
| $12,500 to $14,999 | 89 (1.4%) | 261 (4.2%) |
| $15,000 to $17,499 | 206 (3.3%) | 63 (1.0%) |
| $17,500 to $19,999 | 53 (0.8%) | 218 (3.5%) |
| $20,000 to $22,499 | 121 (1.9%) | 231 (3.7%) |
| $22,500 to $24,999 | 39 (0.6%) | 235 (3.7%) |
| $25,000 to $29,999 | 206 (3.3%) | 838 (13.3%) |
| $30,000 to $34,999 | 610 (9.7%) | 401 (6.4%) |
| $35,000 to $39,999 | 536 (8.5%) | 259 (4.1%) |
| $40,000 to $44,999 | 345 (5.5%) | 397 (6.3%) |
| $45,000 to $49,999 | 289 (4.6%) | 314 (5.0%) |
| $50,000 to $54,999 | 215 (3.4%) | 527 (8.4%) |
| $55,000 to $64,999 | 849 (13.5%) | 279 (4.4%) |
| $65,000 to $74,999 | 701 (11.1%) | 326 (5.2%) |
| $75,000 to $99,999 | 622 (9.9%) | 456 (7.3%) |
| $100,000+ | 725 (11.5%) | 396 (6.3%) |
| Total | 6,311 (100.0%) | 6,285 (100.0%) |
Earnings by Sex by Educational Attainment in Moses Lake
Average earnings in Moses Lake are $56,486 for men and $43,241 for women, a difference of 23.4%. Men with an educational attainment of bachelor's degree enjoy the highest average annual earnings of $93,229, while those with less than high school education earn the least with $37,102. Women with an educational attainment of graduate degree earn the most with the average annual earnings of $68,482, while those with high school diploma education have the smallest earnings of $29,106.
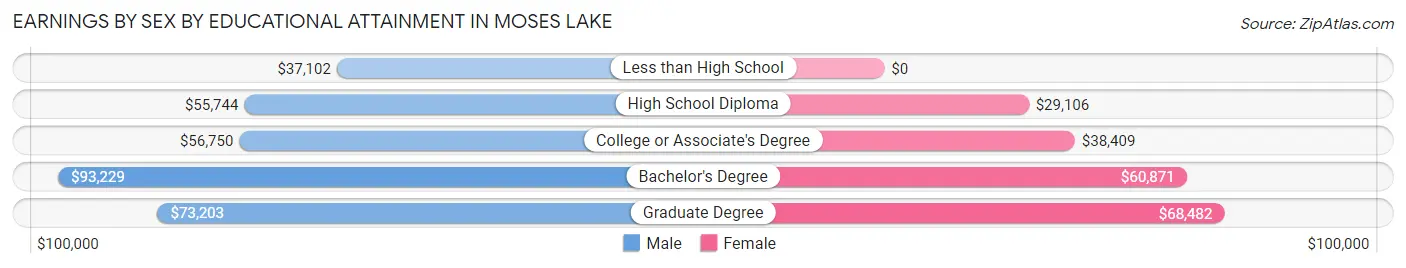
| Educational Attainment | Male Income | Female Income |
| Less than High School | $37,102 | $0 |
| High School Diploma | $55,744 | $29,106 |
| College or Associate's Degree | $56,750 | $38,409 |
| Bachelor's Degree | $93,229 | $60,871 |
| Graduate Degree | $73,203 | $68,482 |
| Total | $56,486 | $43,241 |
Family Income in Moses Lake
Family Income Brackets in Moses Lake
According to the Moses Lake family income data, there are 1,271 families falling into the $100,000 to $149,999 income range, which is the most common income bracket and makes up 23.1% of all families. Conversely, the $10,000 to $14,999 income bracket is the least frequent group with only 99 families (1.8%) belonging to this category.
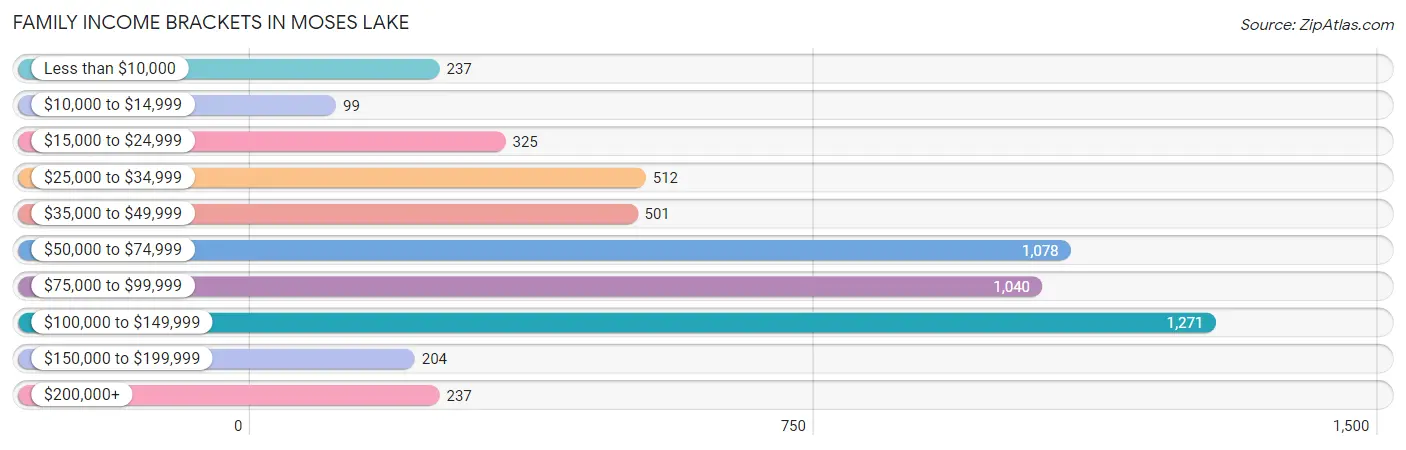
| Income Bracket | # Families | % Families |
| Less than $10,000 | 237 | 4.3% |
| $10,000 to $14,999 | 99 | 1.8% |
| $15,000 to $24,999 | 325 | 5.9% |
| $25,000 to $34,999 | 512 | 9.3% |
| $35,000 to $49,999 | 501 | 9.1% |
| $50,000 to $74,999 | 1,078 | 19.6% |
| $75,000 to $99,999 | 1,040 | 18.9% |
| $100,000 to $149,999 | 1,271 | 23.1% |
| $150,000 to $199,999 | 204 | 3.7% |
| $200,000+ | 237 | 4.3% |
Family Income by Famaliy Size in Moses Lake
6-person families (199 | 3.6%) account for the highest median family income in Moses Lake with $122,545 per family, while 2-person families (1,975 | 35.9%) have the highest median income of $33,272 per family member.
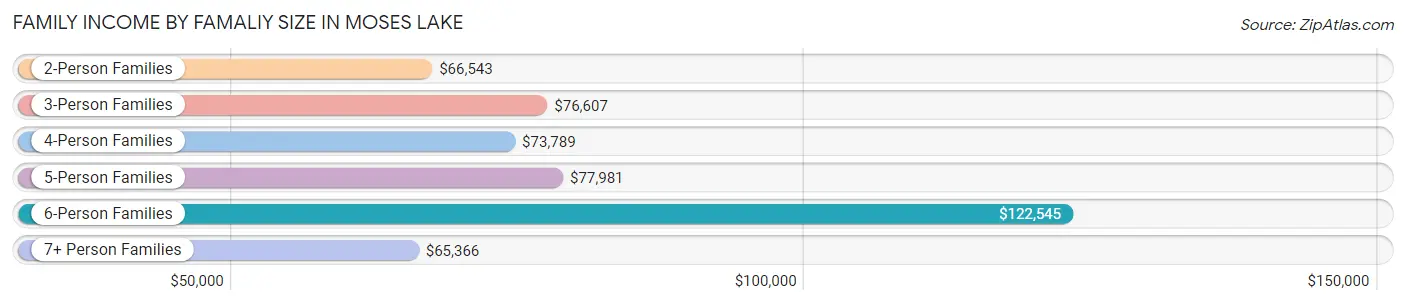
| Income Bracket | # Families | Median Income |
| 2-Person Families | 1,975 (35.9%) | $66,543 |
| 3-Person Families | 1,646 (29.9%) | $76,607 |
| 4-Person Families | 991 (18.0%) | $73,789 |
| 5-Person Families | 466 (8.5%) | $77,981 |
| 6-Person Families | 199 (3.6%) | $122,545 |
| 7+ Person Families | 224 (4.1%) | $65,366 |
| Total | 5,501 (100.0%) | $74,959 |
Family Income by Number of Earners in Moses Lake
The median family income in Moses Lake is $74,959, with families comprising 3+ earners (708) having the highest median family income of $125,761, while families with no earners (626) have the lowest median family income of $47,667, accounting for 12.9% and 11.4% of families, respectively.
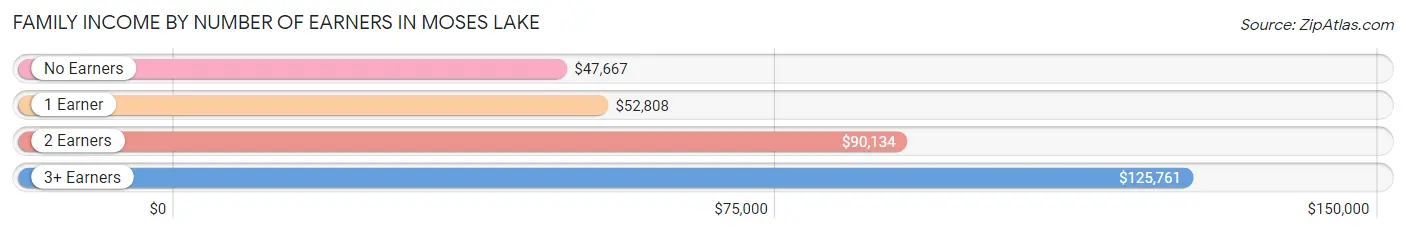
| Number of Earners | # Families | Median Income |
| No Earners | 626 (11.4%) | $47,667 |
| 1 Earner | 2,160 (39.3%) | $52,808 |
| 2 Earners | 2,007 (36.5%) | $90,134 |
| 3+ Earners | 708 (12.9%) | $125,761 |
| Total | 5,501 (100.0%) | $74,959 |
Household Income in Moses Lake
Household Income Brackets in Moses Lake
With 1,771 households falling in the category, the $100,000 to $149,999 income range is the most frequent in Moses Lake, accounting for 19.2% of all households. In contrast, only 350 households (3.8%) fall into the $150,000 to $199,999 income bracket, making it the least populous group.
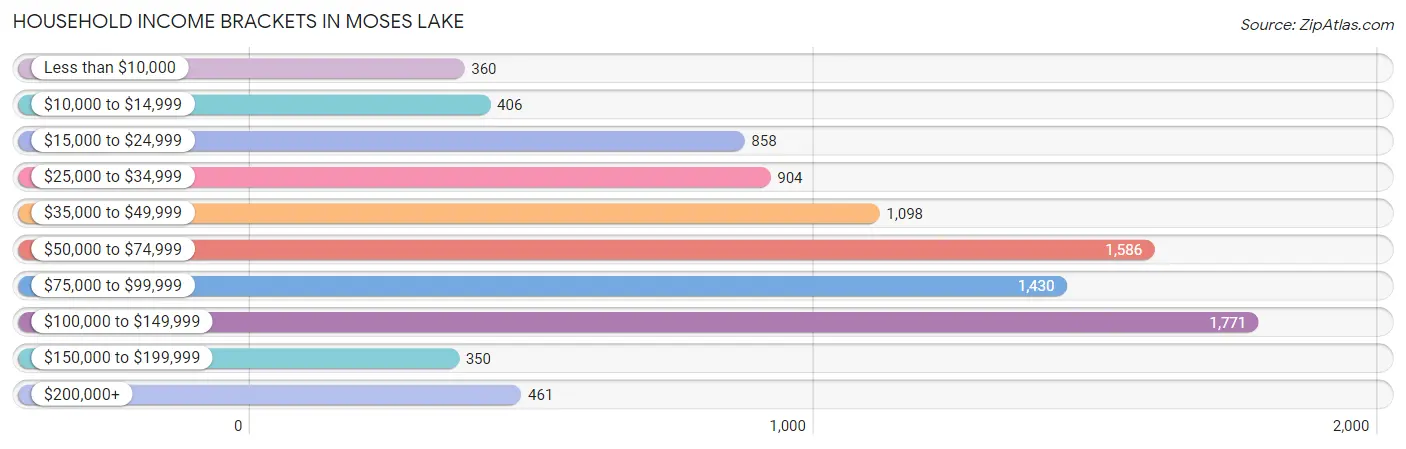
| Income Bracket | # Households | % Households |
| Less than $10,000 | 360 | 3.9% |
| $10,000 to $14,999 | 406 | 4.4% |
| $15,000 to $24,999 | 858 | 9.3% |
| $25,000 to $34,999 | 904 | 9.8% |
| $35,000 to $49,999 | 1,098 | 11.9% |
| $50,000 to $74,999 | 1,586 | 17.2% |
| $75,000 to $99,999 | 1,430 | 15.5% |
| $100,000 to $149,999 | 1,771 | 19.2% |
| $150,000 to $199,999 | 350 | 3.8% |
| $200,000+ | 461 | 5.0% |
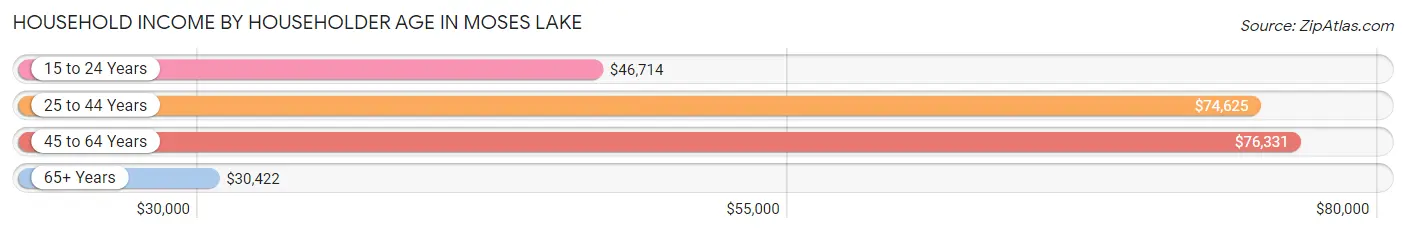
Household Income by Householder Age in Moses Lake
The median household income in Moses Lake is $66,218, with the highest median household income of $76,331 found in the 45 to 64 years age bracket for the primary householder. A total of 3,262 households (35.4%) fall into this category. Meanwhile, the 65+ years age bracket for the primary householder has the lowest median household income of $30,422, with 1,983 households (21.5%) in this group.
| Income Bracket | # Households | Median Income |
| 15 to 24 Years | 674 (7.3%) | $46,714 |
| 25 to 44 Years | 3,304 (35.8%) | $74,625 |
| 45 to 64 Years | 3,262 (35.4%) | $76,331 |
| 65+ Years | 1,983 (21.5%) | $30,422 |
| Total | 9,223 (100.0%) | $66,218 |
Poverty in Moses Lake
Income Below Poverty by Sex and Age in Moses Lake
With 10.2% poverty level for males and 13.9% for females among the residents of Moses Lake, 5 year old males and 5 year old females are the most vulnerable to poverty, with 30 males (46.2%) and 48 females (65.7%) in their respective age groups living below the poverty level.
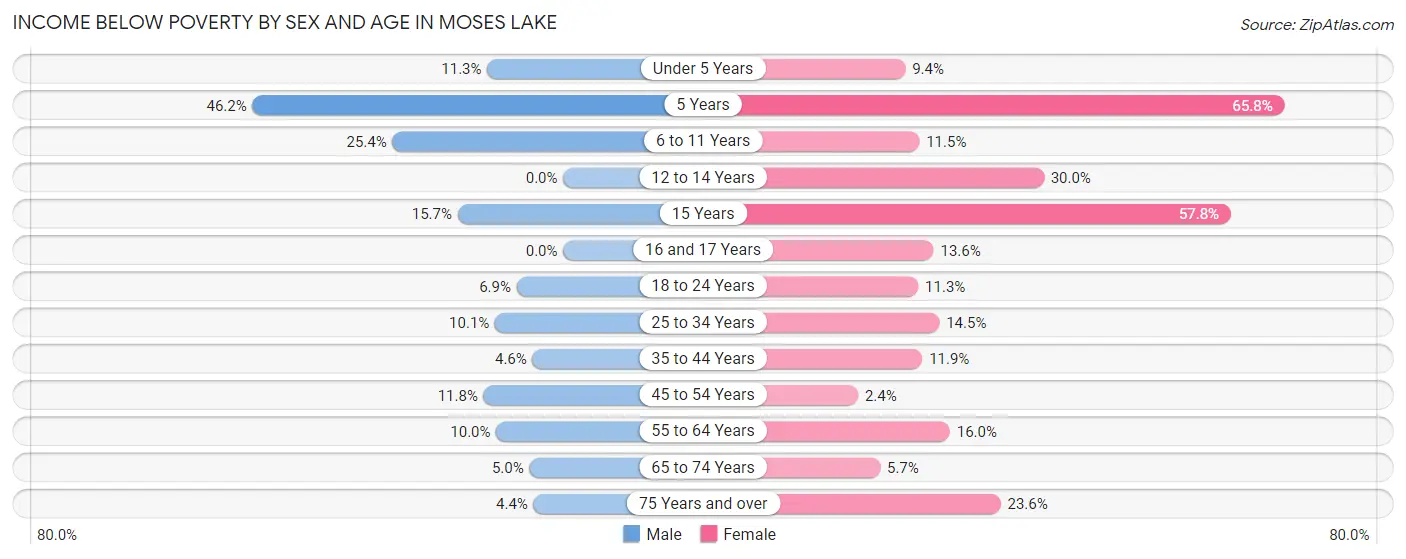
| Age Bracket | Male | Female |
| Under 5 Years | 104 (11.3%) | 78 (9.4%) |
| 5 Years | 30 (46.2%) | 48 (65.7%) |
| 6 to 11 Years | 339 (25.4%) | 131 (11.5%) |
| 12 to 14 Years | 0 (0.0%) | 197 (30.0%) |
| 15 Years | 47 (15.7%) | 130 (57.8%) |
| 16 and 17 Years | 0 (0.0%) | 115 (13.6%) |
| 18 to 24 Years | 93 (6.9%) | 180 (11.3%) |
| 25 to 34 Years | 207 (10.1%) | 268 (14.5%) |
| 35 to 44 Years | 67 (4.6%) | 185 (11.9%) |
| 45 to 54 Years | 174 (11.8%) | 37 (2.4%) |
| 55 to 64 Years | 109 (10.0%) | 153 (16.0%) |
| 65 to 74 Years | 21 (5.0%) | 45 (5.7%) |
| 75 Years and over | 26 (4.4%) | 247 (23.6%) |
| Total | 1,217 (10.2%) | 1,814 (13.9%) |
Income Above Poverty by Sex and Age in Moses Lake
According to the poverty statistics in Moses Lake, males aged 12 to 14 years and females aged 45 to 54 years are the age groups that are most secure financially, with 100.0% of males and 97.6% of females in these age groups living above the poverty line.
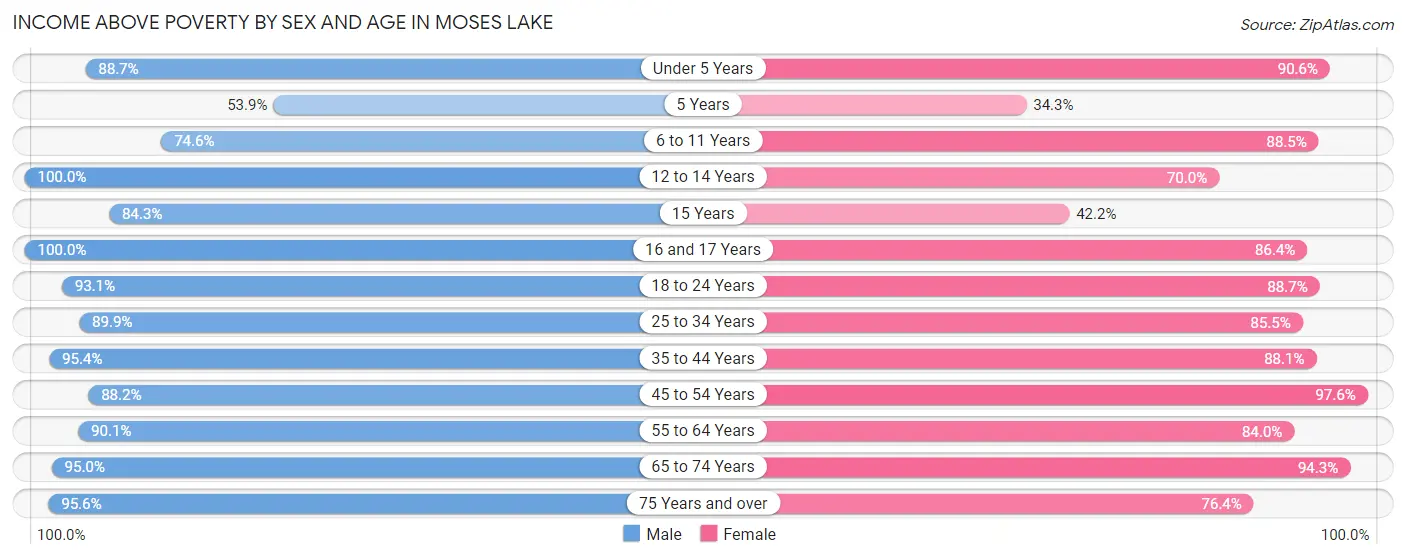
| Age Bracket | Male | Female |
| Under 5 Years | 818 (88.7%) | 750 (90.6%) |
| 5 Years | 35 (53.8%) | 25 (34.3%) |
| 6 to 11 Years | 998 (74.6%) | 1,008 (88.5%) |
| 12 to 14 Years | 499 (100.0%) | 460 (70.0%) |
| 15 Years | 253 (84.3%) | 95 (42.2%) |
| 16 and 17 Years | 332 (100.0%) | 729 (86.4%) |
| 18 to 24 Years | 1,252 (93.1%) | 1,407 (88.7%) |
| 25 to 34 Years | 1,837 (89.9%) | 1,584 (85.5%) |
| 35 to 44 Years | 1,402 (95.4%) | 1,365 (88.1%) |
| 45 to 54 Years | 1,298 (88.2%) | 1,505 (97.6%) |
| 55 to 64 Years | 987 (90.0%) | 801 (84.0%) |
| 65 to 74 Years | 397 (95.0%) | 747 (94.3%) |
| 75 Years and over | 563 (95.6%) | 801 (76.4%) |
| Total | 10,671 (89.8%) | 11,277 (86.1%) |
Income Below Poverty Among Married-Couple Families in Moses Lake
The poverty statistics for married-couple families in Moses Lake show that 6.1% or 209 of the total 3,405 families live below the poverty line. Families with 5 or more children have the highest poverty rate of 41.9%, comprising of 88 families. On the other hand, families with 1 or 2 children have the lowest poverty rate of 0.0%, which includes 0 families.
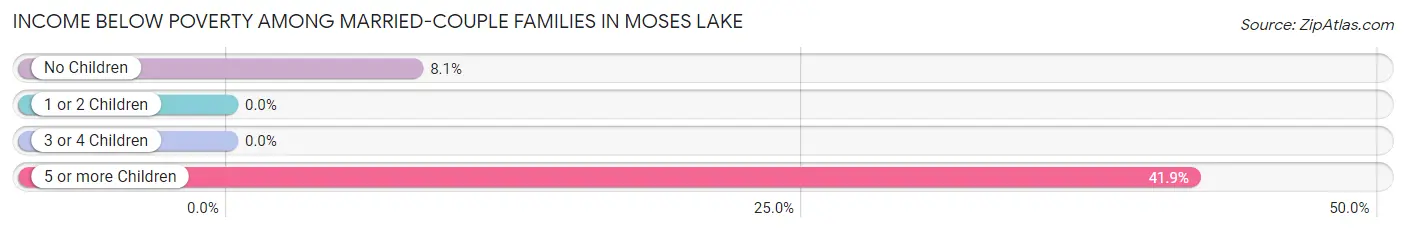
| Children | Above Poverty | Below Poverty |
| No Children | 1,380 (91.9%) | 121 (8.1%) |
| 1 or 2 Children | 1,438 (100.0%) | 0 (0.0%) |
| 3 or 4 Children | 256 (100.0%) | 0 (0.0%) |
| 5 or more Children | 122 (58.1%) | 88 (41.9%) |
| Total | 3,196 (93.9%) | 209 (6.1%) |
Income Below Poverty Among Single-Parent Households in Moses Lake
According to the poverty data in Moses Lake, 15.5% or 81 single-father households and 16.9% or 266 single-mother households are living below the poverty line. Among single-father households, those with 3 or 4 children have the highest poverty rate, with 21 households (100.0%) experiencing poverty. Likewise, among single-mother households, those with 3 or 4 children have the highest poverty rate, with 72 households (31.4%) falling below the poverty line.
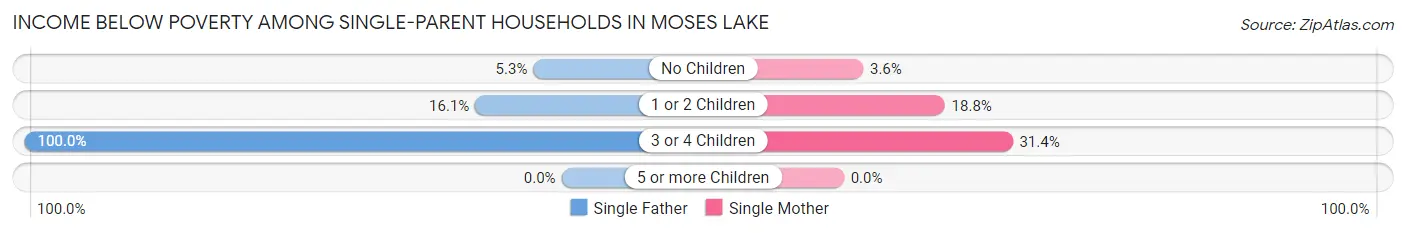
| Children | Single Father | Single Mother |
| No Children | 10 (5.3%) | 14 (3.6%) |
| 1 or 2 Children | 50 (16.1%) | 180 (18.8%) |
| 3 or 4 Children | 21 (100.0%) | 72 (31.4%) |
| 5 or more Children | 0 (0.0%) | 0 (0.0%) |
| Total | 81 (15.5%) | 266 (16.9%) |
Income Below Poverty Among Married-Couple vs Single-Parent Households in Moses Lake
The poverty data for Moses Lake shows that 209 of the married-couple family households (6.1%) and 347 of the single-parent households (16.6%) are living below the poverty level. Within the married-couple family households, those with 5 or more children have the highest poverty rate, with 88 households (41.9%) falling below the poverty line. Among the single-parent households, those with 3 or 4 children have the highest poverty rate, with 93 household (37.2%) living below poverty.
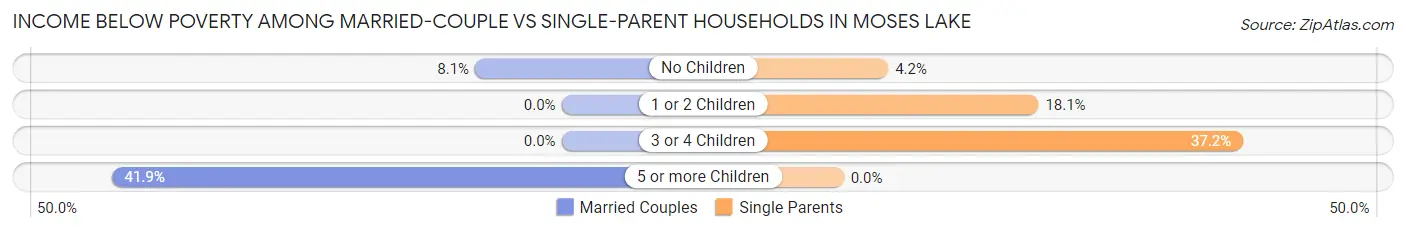
| Children | Married-Couple Families | Single-Parent Households |
| No Children | 121 (8.1%) | 24 (4.2%) |
| 1 or 2 Children | 0 (0.0%) | 230 (18.1%) |
| 3 or 4 Children | 0 (0.0%) | 93 (37.2%) |
| 5 or more Children | 88 (41.9%) | 0 (0.0%) |
| Total | 209 (6.1%) | 347 (16.6%) |
Race in Moses Lake
The most populous races in Moses Lake are White / Caucasian (16,136 | 64.1%), Hispanic or Latino (9,850 | 39.2%), and Some other Race (3,975 | 15.8%).
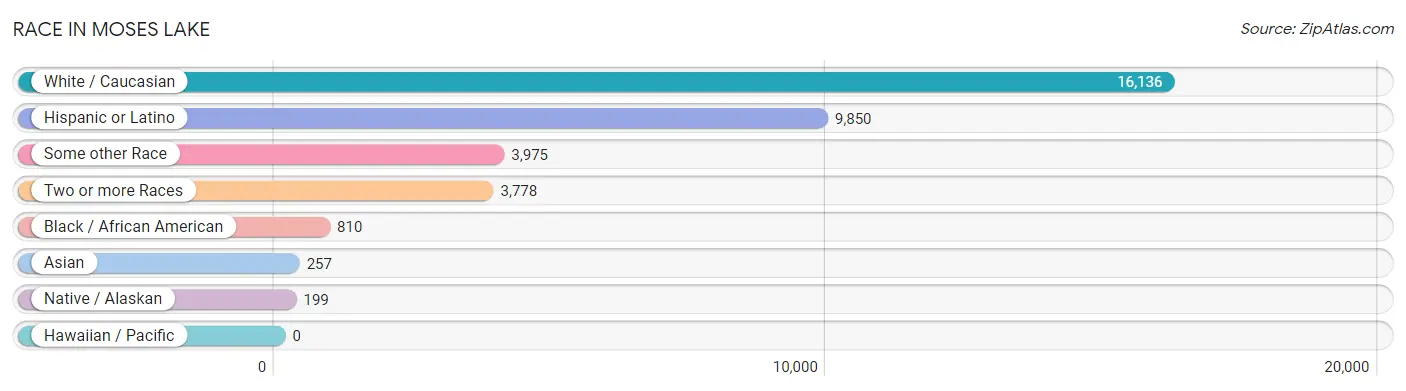
| Race | # Population | % Population |
| Asian | 257 | 1.0% |
| Black / African American | 810 | 3.2% |
| Hawaiian / Pacific | 0 | 0.0% |
| Hispanic or Latino | 9,850 | 39.2% |
| Native / Alaskan | 199 | 0.8% |
| White / Caucasian | 16,136 | 64.1% |
| Two or more Races | 3,778 | 15.0% |
| Some other Race | 3,975 | 15.8% |
| Total | 25,155 | 100.0% |
Ancestry in Moses Lake
The most populous ancestries reported in Moses Lake are Mexican (9,017 | 35.8%), German (2,547 | 10.1%), English (2,125 | 8.5%), American (1,130 | 4.5%), and Irish (1,054 | 4.2%), together accounting for 63.1% of all Moses Lake residents.
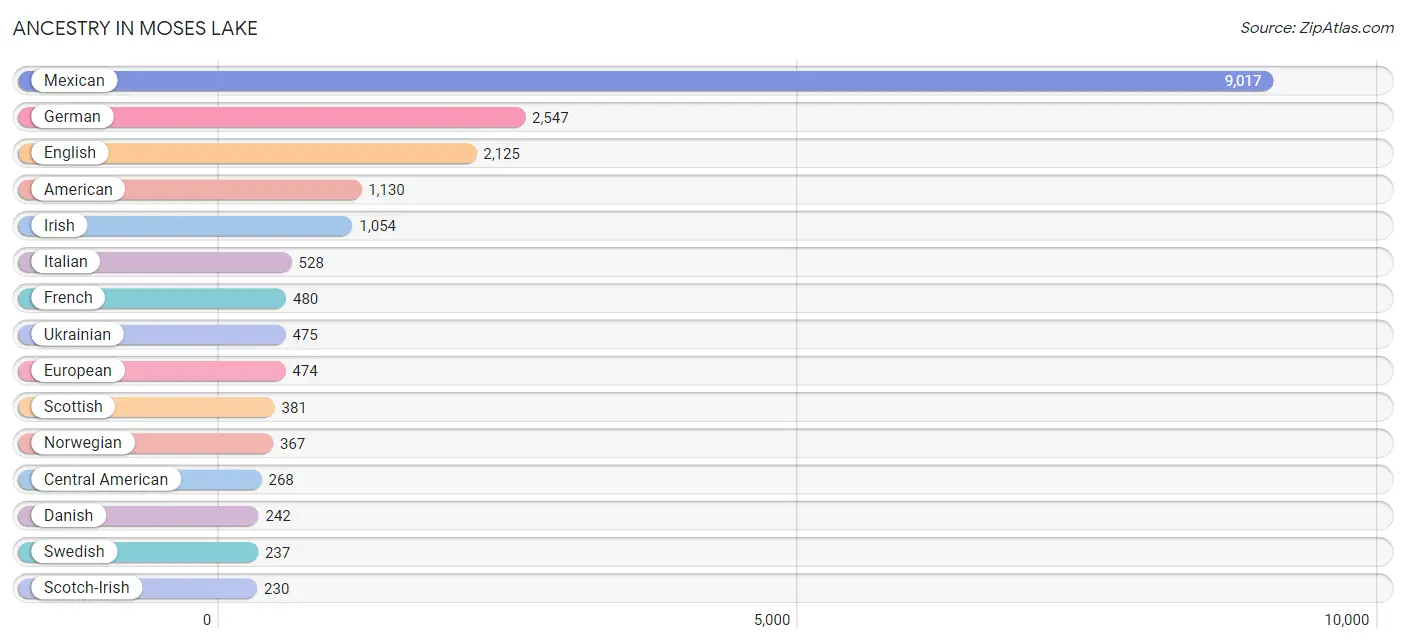
| Ancestry | # Population | % Population |
| American | 1,130 | 4.5% |
| Arab | 24 | 0.1% |
| Australian | 86 | 0.3% |
| Austrian | 67 | 0.3% |
| Bhutanese | 190 | 0.8% |
| Blackfeet | 138 | 0.5% |
| British | 136 | 0.5% |
| Burmese | 19 | 0.1% |
| Canadian | 52 | 0.2% |
| Central American | 268 | 1.1% |
| Cherokee | 83 | 0.3% |
| Chilean | 21 | 0.1% |
| Chippewa | 11 | 0.0% |
| Colville | 23 | 0.1% |
| Croatian | 67 | 0.3% |
| Czech | 13 | 0.1% |
| Danish | 242 | 1.0% |
| Dominican | 51 | 0.2% |
| Dutch | 181 | 0.7% |
| Eastern European | 10 | 0.0% |
| English | 2,125 | 8.5% |
| European | 474 | 1.9% |
| Finnish | 37 | 0.2% |
| French | 480 | 1.9% |
| French American Indian | 35 | 0.1% |
| French Canadian | 189 | 0.7% |
| German | 2,547 | 10.1% |
| Guatemalan | 92 | 0.4% |
| Hungarian | 26 | 0.1% |
| Indian (Asian) | 96 | 0.4% |
| Inupiat | 45 | 0.2% |
| Irish | 1,054 | 4.2% |
| Italian | 528 | 2.1% |
| Jamaican | 201 | 0.8% |
| Japanese | 53 | 0.2% |
| Korean | 102 | 0.4% |
| Mexican | 9,017 | 35.8% |
| Mexican American Indian | 99 | 0.4% |
| Northern European | 101 | 0.4% |
| Norwegian | 367 | 1.5% |
| Pakistani | 17 | 0.1% |
| Palestinian | 24 | 0.1% |
| Pennsylvania German | 31 | 0.1% |
| Peruvian | 34 | 0.1% |
| Polish | 201 | 0.8% |
| Portuguese | 26 | 0.1% |
| Puerto Rican | 45 | 0.2% |
| Romanian | 54 | 0.2% |
| Salvadoran | 176 | 0.7% |
| Scandinavian | 105 | 0.4% |
| Scotch-Irish | 230 | 0.9% |
| Scottish | 381 | 1.5% |
| Shoshone | 41 | 0.2% |
| Sioux | 60 | 0.2% |
| South American | 85 | 0.3% |
| South American Indian | 66 | 0.3% |
| Spaniard | 48 | 0.2% |
| Spanish | 98 | 0.4% |
| Sri Lankan | 37 | 0.2% |
| Swedish | 237 | 0.9% |
| Swiss | 155 | 0.6% |
| Ukrainian | 475 | 1.9% |
| Venezuelan | 30 | 0.1% |
| Welsh | 172 | 0.7% | View All 64 Rows |
Immigrants in Moses Lake
The most numerous immigrant groups reported in Moses Lake came from Latin America (2,068 | 8.2%), Central America (1,790 | 7.1%), Mexico (1,665 | 6.6%), Caribbean (227 | 0.9%), and Jamaica (201 | 0.8%), together accounting for 23.7% of all Moses Lake residents.
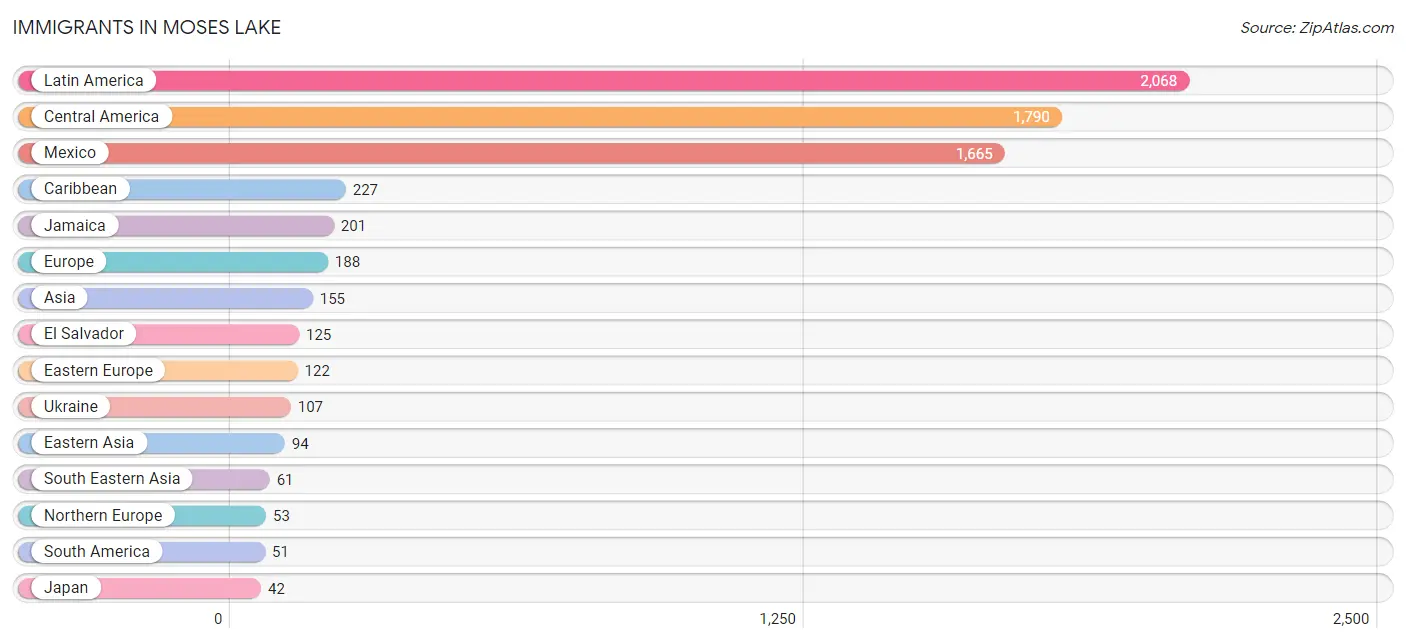
| Immigration Origin | # Population | % Population |
| Africa | 41 | 0.2% |
| Asia | 155 | 0.6% |
| Caribbean | 227 | 0.9% |
| Central America | 1,790 | 7.1% |
| Chile | 21 | 0.1% |
| China | 33 | 0.1% |
| Dominican Republic | 26 | 0.1% |
| Eastern Asia | 94 | 0.4% |
| Eastern Europe | 122 | 0.5% |
| El Salvador | 125 | 0.5% |
| England | 5 | 0.0% |
| Europe | 188 | 0.7% |
| Jamaica | 201 | 0.8% |
| Japan | 42 | 0.2% |
| Korea | 19 | 0.1% |
| Latin America | 2,068 | 8.2% |
| Mexico | 1,665 | 6.6% |
| Netherlands | 13 | 0.1% |
| Northern Europe | 53 | 0.2% |
| Philippines | 24 | 0.1% |
| Poland | 15 | 0.1% |
| South Africa | 41 | 0.2% |
| South America | 51 | 0.2% |
| South Eastern Asia | 61 | 0.2% |
| Sweden | 34 | 0.1% |
| Ukraine | 107 | 0.4% |
| Venezuela | 30 | 0.1% |
| Vietnam | 37 | 0.2% |
| Western Europe | 13 | 0.1% | View All 29 Rows |
Sex and Age in Moses Lake
Sex and Age in Moses Lake
The most populous age groups in Moses Lake are 10 to 14 Years (1,150 | 9.6%) for men and 15 to 19 Years (1,581 | 12.0%) for women.
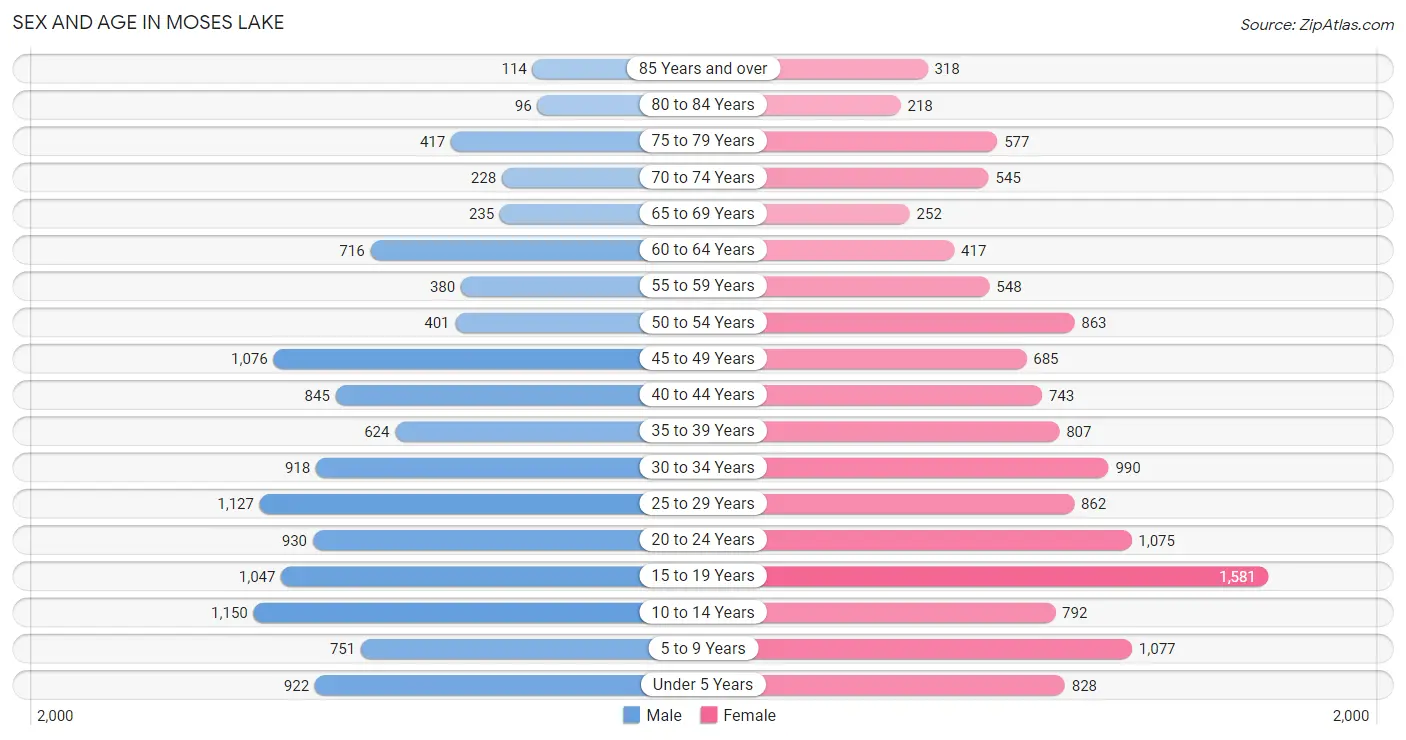
| Age Bracket | Male | Female |
| Under 5 Years | 922 (7.7%) | 828 (6.3%) |
| 5 to 9 Years | 751 (6.3%) | 1,077 (8.2%) |
| 10 to 14 Years | 1,150 (9.6%) | 792 (6.0%) |
| 15 to 19 Years | 1,047 (8.7%) | 1,581 (12.0%) |
| 20 to 24 Years | 930 (7.8%) | 1,075 (8.2%) |
| 25 to 29 Years | 1,127 (9.4%) | 862 (6.5%) |
| 30 to 34 Years | 918 (7.7%) | 990 (7.5%) |
| 35 to 39 Years | 624 (5.2%) | 807 (6.1%) |
| 40 to 44 Years | 845 (7.1%) | 743 (5.6%) |
| 45 to 49 Years | 1,076 (9.0%) | 685 (5.2%) |
| 50 to 54 Years | 401 (3.4%) | 863 (6.6%) |
| 55 to 59 Years | 380 (3.2%) | 548 (4.2%) |
| 60 to 64 Years | 716 (6.0%) | 417 (3.2%) |
| 65 to 69 Years | 235 (2.0%) | 252 (1.9%) |
| 70 to 74 Years | 228 (1.9%) | 545 (4.1%) |
| 75 to 79 Years | 417 (3.5%) | 577 (4.4%) |
| 80 to 84 Years | 96 (0.8%) | 218 (1.7%) |
| 85 Years and over | 114 (0.9%) | 318 (2.4%) |
| Total | 11,977 (100.0%) | 13,178 (100.0%) |
Families and Households in Moses Lake
Median Family Size in Moses Lake
The median family size in Moses Lake is 3.54 persons per family, with married-couple families (3,405 | 61.9%) accounting for the largest median family size of 3.94 persons per family. On the other hand, single male/father families (522 | 9.5%) represent the smallest median family size with 2.47 persons per family.
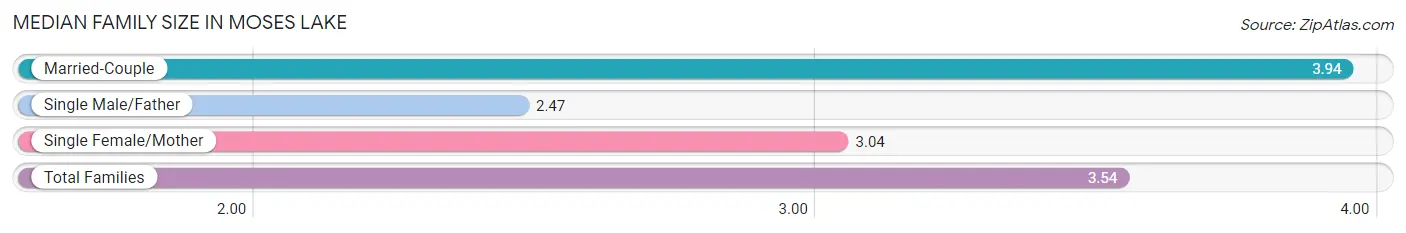
| Family Type | # Families | Family Size |
| Married-Couple | 3,405 (61.9%) | 3.94 |
| Single Male/Father | 522 (9.5%) | 2.47 |
| Single Female/Mother | 1,574 (28.6%) | 3.04 |
| Total Families | 5,501 (100.0%) | 3.54 |
Median Household Size in Moses Lake
The median household size in Moses Lake is 2.70 persons per household, with married-couple households (3,405 | 36.9%) accounting for the largest median household size of 3.95 persons per household. non-family households (3,722 | 40.4%) represent the smallest median household size with 1.24 persons per household.
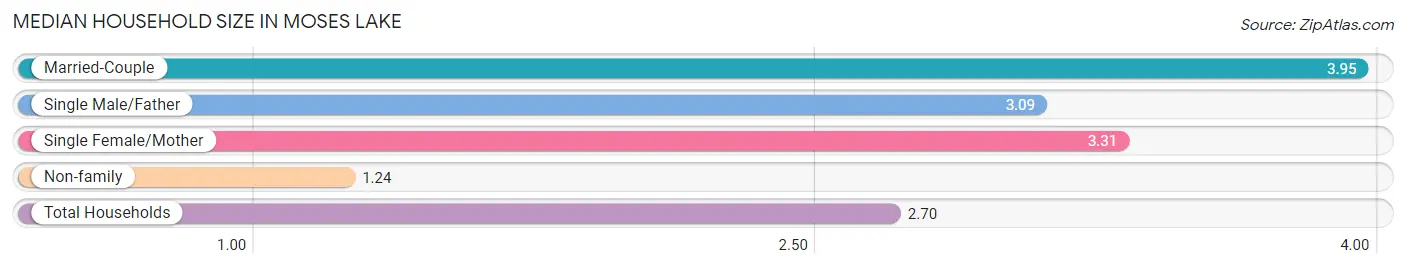
| Household Type | # Households | Household Size |
| Married-Couple | 3,405 (36.9%) | 3.95 |
| Single Male/Father | 522 (5.7%) | 3.09 |
| Single Female/Mother | 1,574 (17.1%) | 3.31 |
| Non-family | 3,722 (40.4%) | 1.24 |
| Total Households | 9,223 (100.0%) | 2.70 |
Household Size by Marriage Status in Moses Lake
Out of a total of 9,223 households in Moses Lake, 5,501 (59.6%) are family households, while 3,722 (40.4%) are nonfamily households. The most numerous type of family households are 2-person households, comprising 1,707, and the most common type of nonfamily households are 1-person households, comprising 2,939.
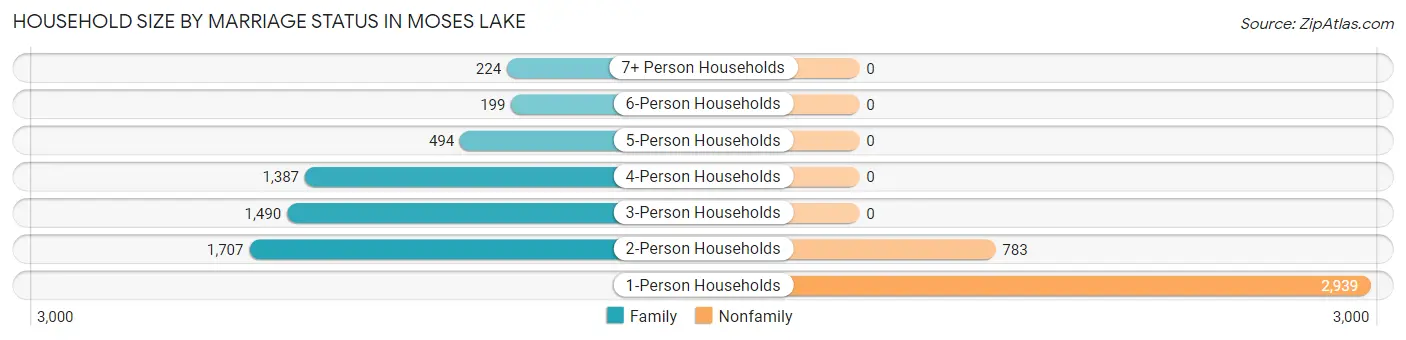
| Household Size | Family Households | Nonfamily Households |
| 1-Person Households | - | 2,939 (31.9%) |
| 2-Person Households | 1,707 (18.5%) | 783 (8.5%) |
| 3-Person Households | 1,490 (16.2%) | 0 (0.0%) |
| 4-Person Households | 1,387 (15.0%) | 0 (0.0%) |
| 5-Person Households | 494 (5.4%) | 0 (0.0%) |
| 6-Person Households | 199 (2.2%) | 0 (0.0%) |
| 7+ Person Households | 224 (2.4%) | 0 (0.0%) |
| Total | 5,501 (59.6%) | 3,722 (40.4%) |
Female Fertility in Moses Lake
Fertility by Age in Moses Lake
Average fertility rate in Moses Lake is 56.0 births per 1,000 women. Women in the age bracket of 20 to 34 years have the highest fertility rate with 84.0 births per 1,000 women. Women in the age bracket of 20 to 34 years acount for 63.4% of all women with births.
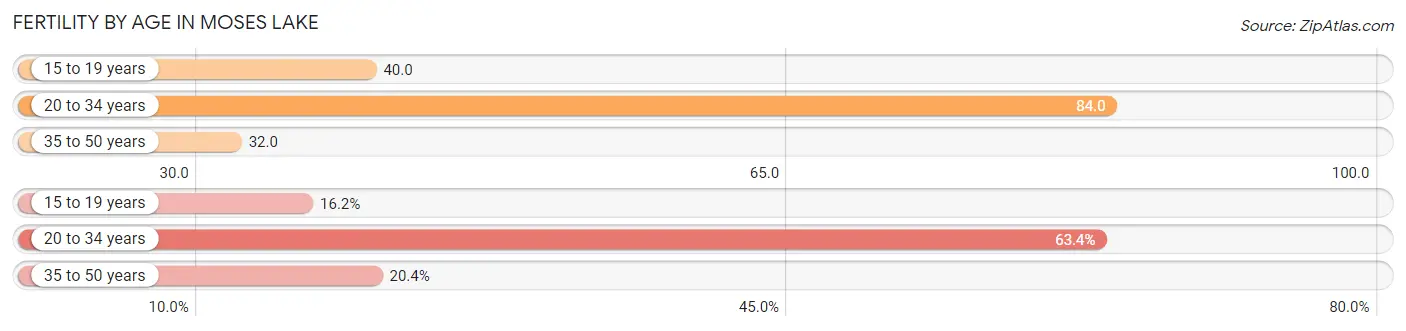
| Age Bracket | Women with Births | Births / 1,000 Women |
| 15 to 19 years | 63 (16.2%) | 40.0 |
| 20 to 34 years | 246 (63.4%) | 84.0 |
| 35 to 50 years | 79 (20.4%) | 32.0 |
| Total | 388 (100.0%) | 56.0 |
Fertility by Age by Marriage Status in Moses Lake
31.2% of women with births (388) in Moses Lake are married. The highest percentage of unmarried women with births falls into 15 to 19 years age bracket with 100.0% of them unmarried at the time of birth, while the lowest percentage of unmarried women with births belong to 35 to 50 years age bracket with 0.0% of them unmarried.
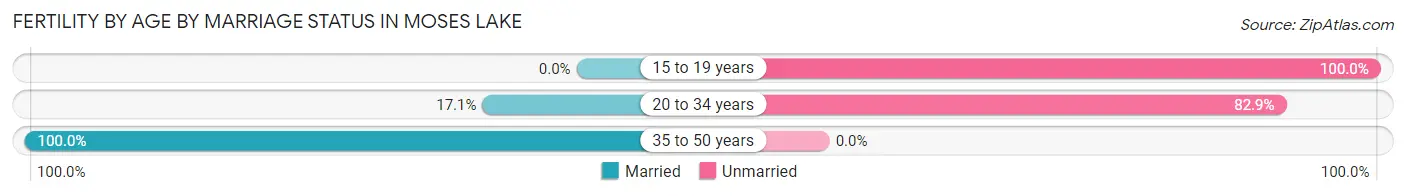
| Age Bracket | Married | Unmarried |
| 15 to 19 years | 0 (0.0%) | 63 (100.0%) |
| 20 to 34 years | 42 (17.1%) | 204 (82.9%) |
| 35 to 50 years | 79 (100.0%) | 0 (0.0%) |
| Total | 121 (31.2%) | 267 (68.8%) |
Fertility by Education in Moses Lake
Average fertility rate in Moses Lake is 56.0 births per 1,000 women. Women with the education attainment of college or associate's degree have the highest fertility rate of 95.0 births per 1,000 women, while women with the education attainment of bachelor's degree have the lowest fertility at 28.0 births per 1,000 women. Women with the education attainment of college or associate's degree represent 47.7% of all women with births.
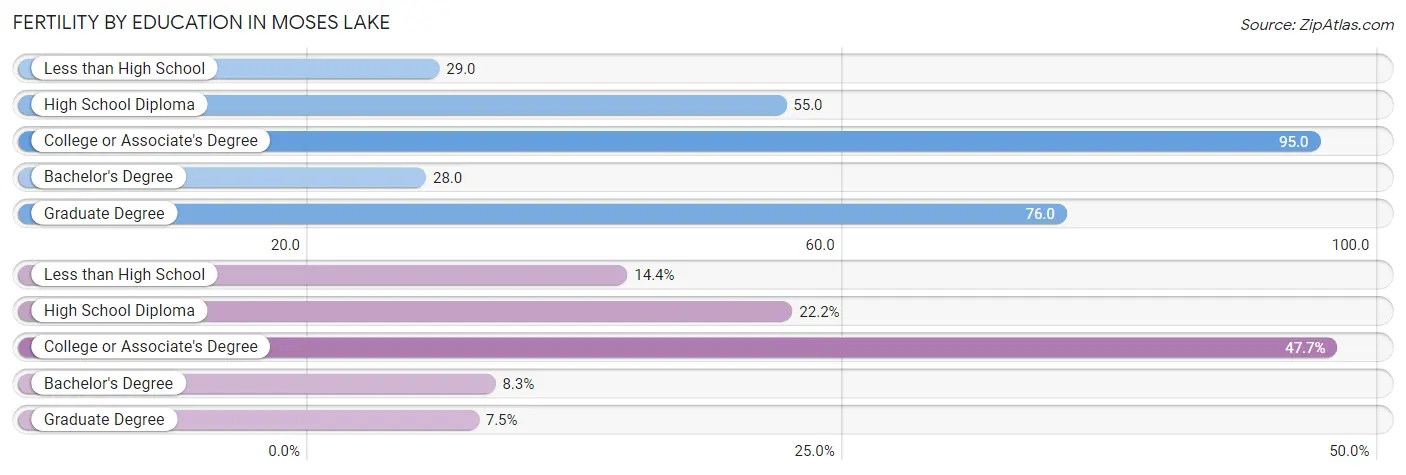
| Educational Attainment | Women with Births | Births / 1,000 Women |
| Less than High School | 56 (14.4%) | 29.0 |
| High School Diploma | 86 (22.2%) | 55.0 |
| College or Associate's Degree | 185 (47.7%) | 95.0 |
| Bachelor's Degree | 32 (8.3%) | 28.0 |
| Graduate Degree | 29 (7.5%) | 76.0 |
| Total | 388 (100.0%) | 56.0 |
Fertility by Education by Marriage Status in Moses Lake
68.8% of women with births in Moses Lake are unmarried. Women with the educational attainment of bachelor's degree are most likely to be married with 100.0% of them married at childbirth, while women with the educational attainment of high school diploma are least likely to be married with 93.0% of them unmarried at childbirth.
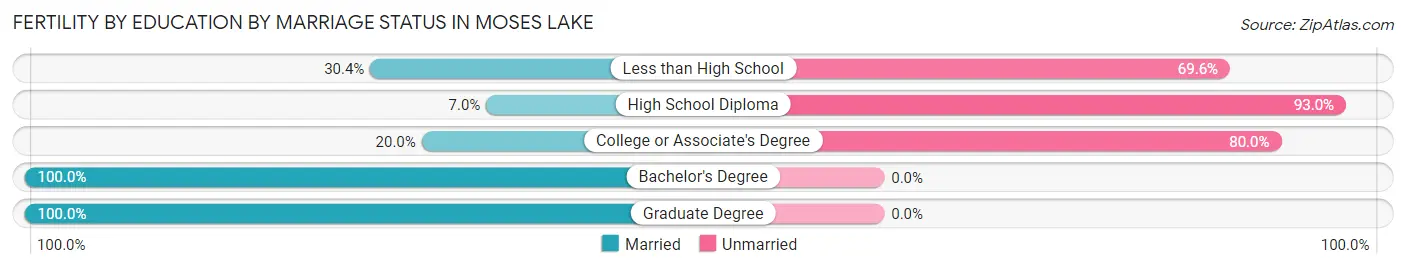
| Educational Attainment | Married | Unmarried |
| Less than High School | 17 (30.4%) | 39 (69.6%) |
| High School Diploma | 6 (7.0%) | 80 (93.0%) |
| College or Associate's Degree | 37 (20.0%) | 148 (80.0%) |
| Bachelor's Degree | 32 (100.0%) | 0 (0.0%) |
| Graduate Degree | 29 (100.0%) | 0 (0.0%) |
| Total | 121 (31.2%) | 267 (68.8%) |
Employment Characteristics in Moses Lake
Employment by Class of Employer in Moses Lake
Among the 11,548 employed individuals in Moses Lake, private company employees (7,213 | 62.5%), local government employees (1,776 | 15.4%), and not-for-profit organizations (770 | 6.7%) make up the most common classes of employment.
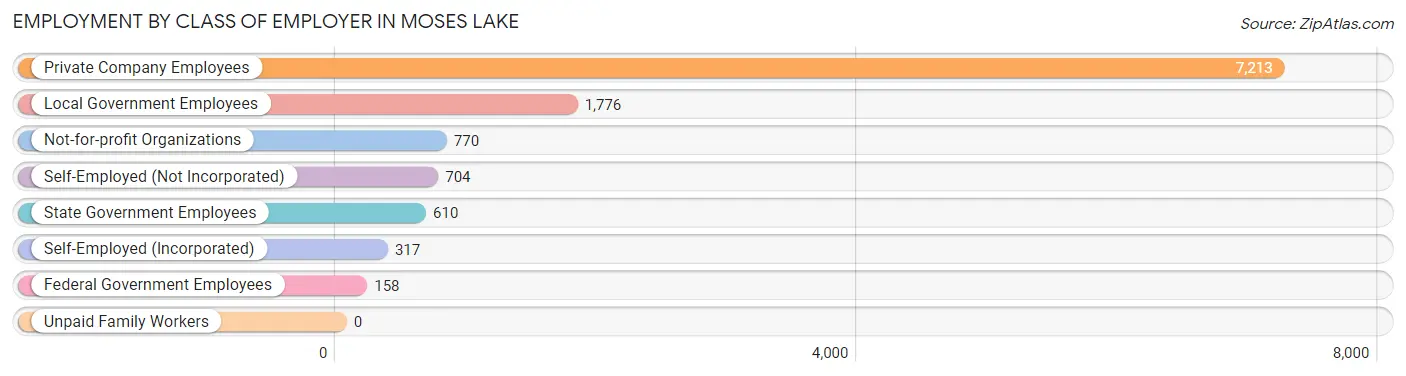
| Employer Class | # Employees | % Employees |
| Private Company Employees | 7,213 | 62.5% |
| Self-Employed (Incorporated) | 317 | 2.8% |
| Self-Employed (Not Incorporated) | 704 | 6.1% |
| Not-for-profit Organizations | 770 | 6.7% |
| Local Government Employees | 1,776 | 15.4% |
| State Government Employees | 610 | 5.3% |
| Federal Government Employees | 158 | 1.4% |
| Unpaid Family Workers | 0 | 0.0% |
| Total | 11,548 | 100.0% |
Employment Status by Age in Moses Lake
According to the labor force statistics for Moses Lake, out of the total population over 16 years of age (19,110), 64.4% or 12,307 individuals are in the labor force, with 5.1% or 628 of them unemployed. The age group with the highest labor force participation rate is 30 to 34 years, with 86.7% or 1,654 individuals in the labor force. Within the labor force, the 60 to 64 years age range has the highest percentage of unemployed individuals, with 11.4% or 72 of them being unemployed.
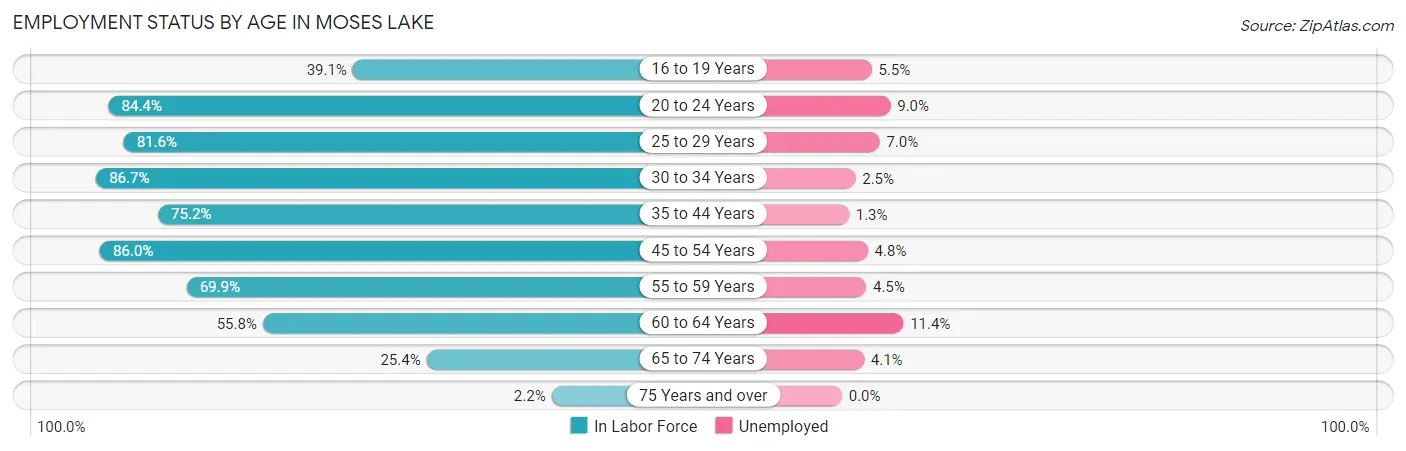
| Age Bracket | In Labor Force | Unemployed |
| 16 to 19 Years | 822 (39.1%) | 45 (5.5%) |
| 20 to 24 Years | 1,692 (84.4%) | 152 (9.0%) |
| 25 to 29 Years | 1,623 (81.6%) | 114 (7.0%) |
| 30 to 34 Years | 1,654 (86.7%) | 41 (2.5%) |
| 35 to 44 Years | 2,270 (75.2%) | 30 (1.3%) |
| 45 to 54 Years | 2,602 (86.0%) | 125 (4.8%) |
| 55 to 59 Years | 649 (69.9%) | 29 (4.5%) |
| 60 to 64 Years | 632 (55.8%) | 72 (11.4%) |
| 65 to 74 Years | 320 (25.4%) | 13 (4.1%) |
| 75 Years and over | 38 (2.2%) | 0 (0.0%) |
| Total | 12,307 (64.4%) | 628 (5.1%) |
Employment Status by Educational Attainment in Moses Lake
According to labor force statistics for Moses Lake, 78.6% of individuals (9,434) out of the total population between 25 and 64 years of age (12,002) are in the labor force, with 4.4% or 415 of them being unemployed. The group with the highest labor force participation rate are those with the educational attainment of bachelor's degree or higher, with 85.7% or 2,345 individuals in the labor force. Within the labor force, individuals with bachelor's degree or higher education have the highest percentage of unemployment, with 8.5% or 199 of them being unemployed.
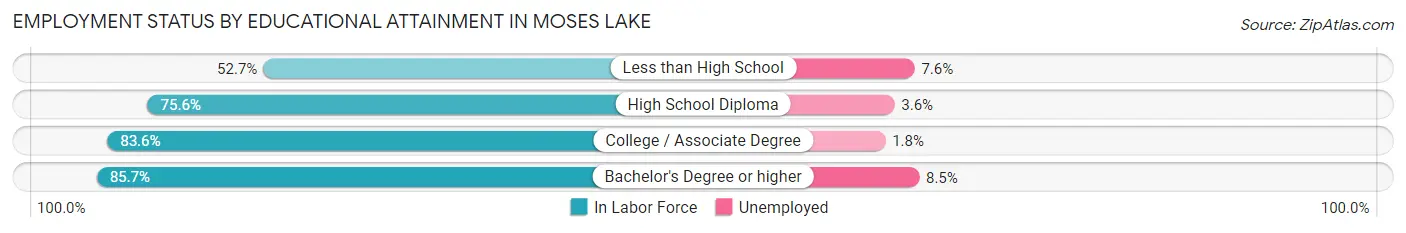
| Educational Attainment | In Labor Force | Unemployed |
| Less than High School | 687 (52.7%) | 99 (7.6%) |
| High School Diploma | 2,440 (75.6%) | 116 (3.6%) |
| College / Associate Degree | 3,958 (83.6%) | 85 (1.8%) |
| Bachelor's Degree or higher | 2,345 (85.7%) | 233 (8.5%) |
| Total | 9,434 (78.6%) | 528 (4.4%) |
Employment Occupations by Sex in Moses Lake
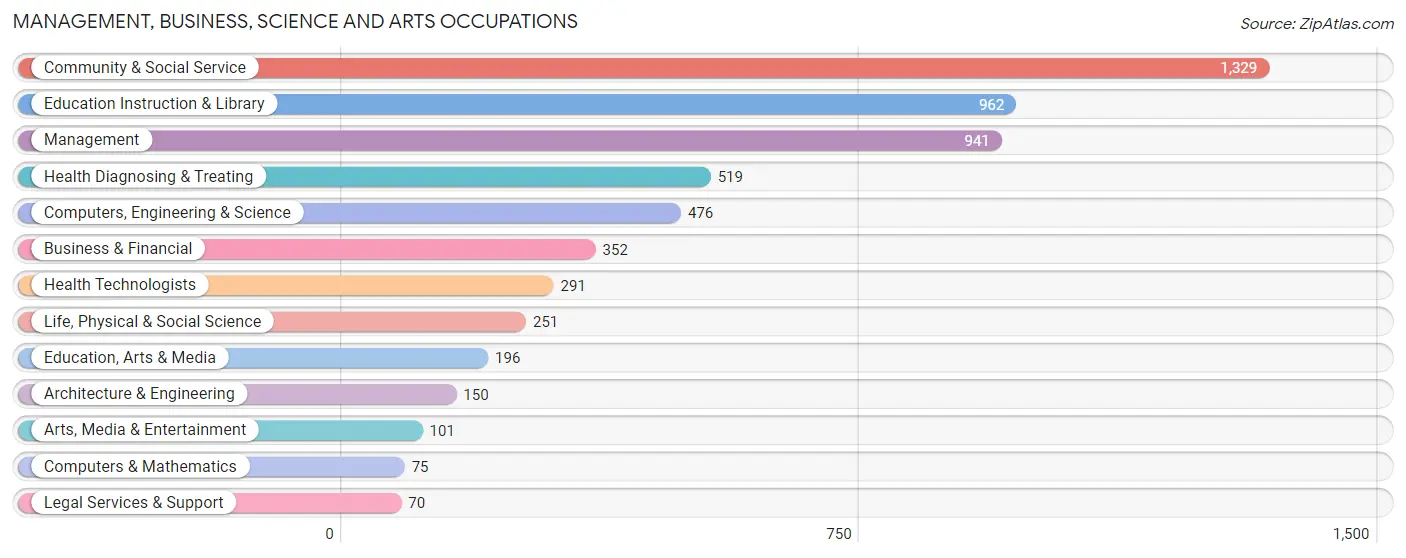
Management, Business, Science and Arts Occupations
The most common Management, Business, Science and Arts occupations in Moses Lake are Community & Social Service (1,329 | 11.4%), Education Instruction & Library (962 | 8.2%), Management (941 | 8.1%), Health Diagnosing & Treating (519 | 4.4%), and Computers, Engineering & Science (476 | 4.1%).
Management, Business, Science and Arts Occupations by Sex
Within the Management, Business, Science and Arts occupations in Moses Lake, the most male-oriented occupations are Legal Services & Support (68.6%), Management (65.6%), and Business & Financial (54.8%), while the most female-oriented occupations are Arts, Media & Entertainment (100.0%), Architecture & Engineering (90.0%), and Health Technologists (86.6%).
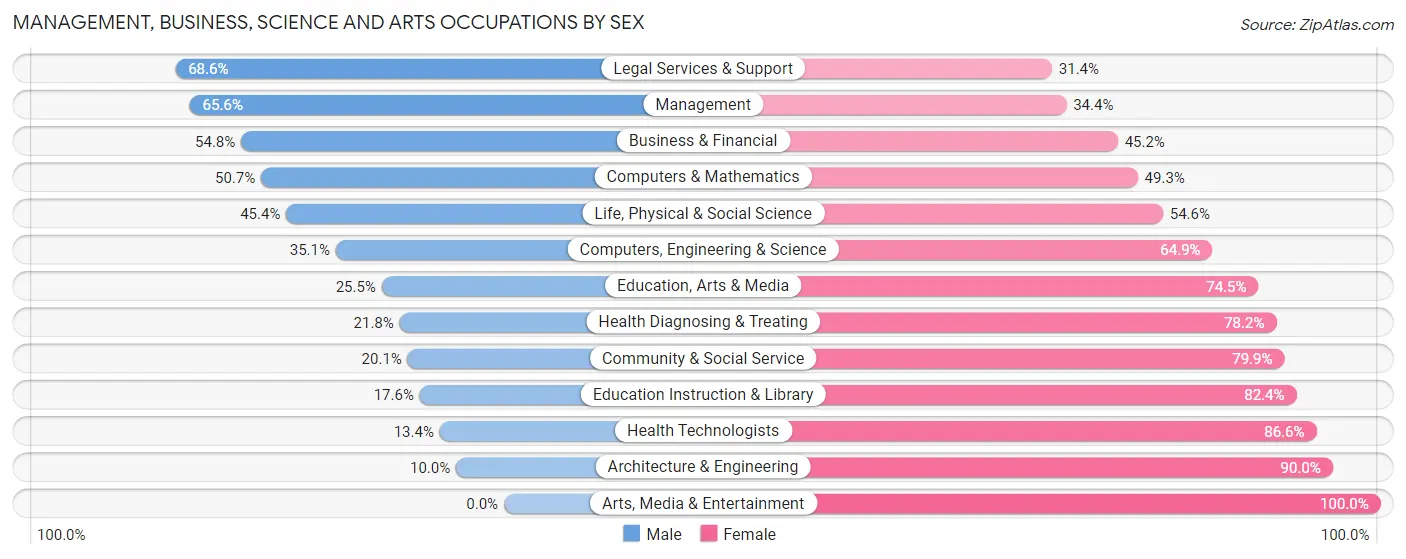
| Occupation | Male | Female |
| Management | 617 (65.6%) | 324 (34.4%) |
| Business & Financial | 193 (54.8%) | 159 (45.2%) |
| Computers, Engineering & Science | 167 (35.1%) | 309 (64.9%) |
| Computers & Mathematics | 38 (50.7%) | 37 (49.3%) |
| Architecture & Engineering | 15 (10.0%) | 135 (90.0%) |
| Life, Physical & Social Science | 114 (45.4%) | 137 (54.6%) |
| Community & Social Service | 267 (20.1%) | 1,062 (79.9%) |
| Education, Arts & Media | 50 (25.5%) | 146 (74.5%) |
| Legal Services & Support | 48 (68.6%) | 22 (31.4%) |
| Education Instruction & Library | 169 (17.6%) | 793 (82.4%) |
| Arts, Media & Entertainment | 0 (0.0%) | 101 (100.0%) |
| Health Diagnosing & Treating | 113 (21.8%) | 406 (78.2%) |
| Health Technologists | 39 (13.4%) | 252 (86.6%) |
| Total (Category) | 1,357 (37.5%) | 2,260 (62.5%) |
| Total (Overall) | 5,857 (50.1%) | 5,826 (49.9%) |
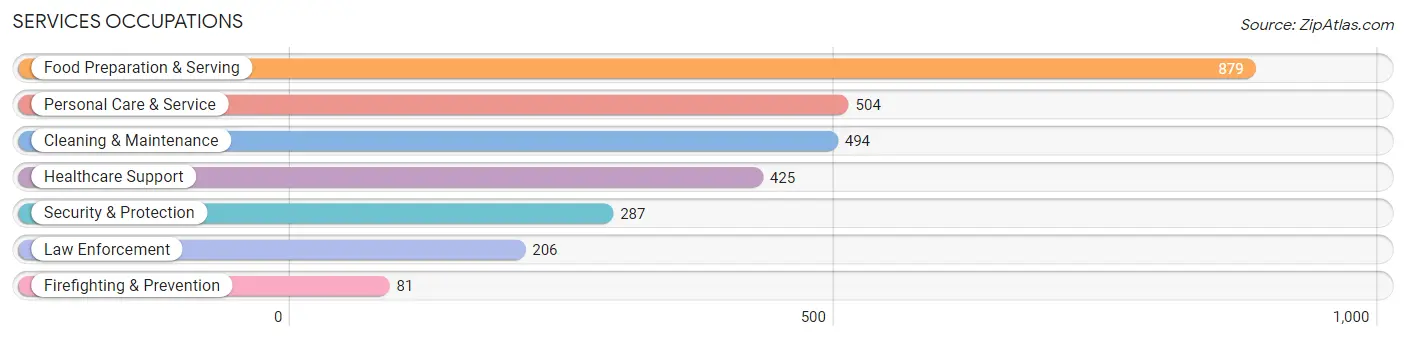
Services Occupations
The most common Services occupations in Moses Lake are Food Preparation & Serving (879 | 7.5%), Personal Care & Service (504 | 4.3%), Cleaning & Maintenance (494 | 4.2%), Healthcare Support (425 | 3.6%), and Security & Protection (287 | 2.5%).
Services Occupations by Sex
Within the Services occupations in Moses Lake, the most male-oriented occupations are Security & Protection (100.0%), Firefighting & Prevention (100.0%), and Law Enforcement (100.0%), while the most female-oriented occupations are Healthcare Support (100.0%), Personal Care & Service (76.8%), and Food Preparation & Serving (73.2%).
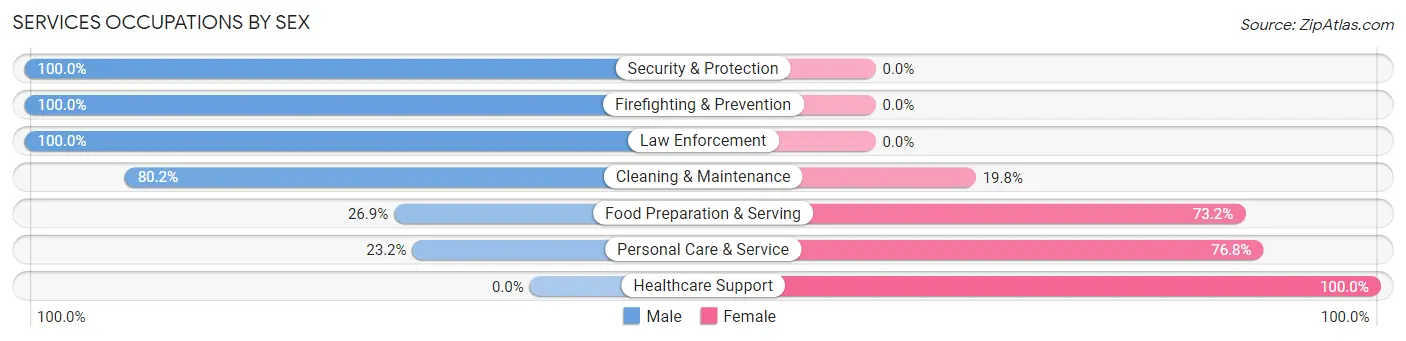
| Occupation | Male | Female |
| Healthcare Support | 0 (0.0%) | 425 (100.0%) |
| Security & Protection | 287 (100.0%) | 0 (0.0%) |
| Firefighting & Prevention | 81 (100.0%) | 0 (0.0%) |
| Law Enforcement | 206 (100.0%) | 0 (0.0%) |
| Food Preparation & Serving | 236 (26.9%) | 643 (73.2%) |
| Cleaning & Maintenance | 396 (80.2%) | 98 (19.8%) |
| Personal Care & Service | 117 (23.2%) | 387 (76.8%) |
| Total (Category) | 1,036 (40.0%) | 1,553 (60.0%) |
| Total (Overall) | 5,857 (50.1%) | 5,826 (49.9%) |
Sales and Office Occupations
The most common Sales and Office occupations in Moses Lake are Office & Administration (1,111 | 9.5%), and Sales & Related (771 | 6.6%).
Sales and Office Occupations by Sex
| Occupation | Male | Female |
| Sales & Related | 326 (42.3%) | 445 (57.7%) |
| Office & Administration | 129 (11.6%) | 982 (88.4%) |
| Total (Category) | 455 (24.2%) | 1,427 (75.8%) |
| Total (Overall) | 5,857 (50.1%) | 5,826 (49.9%) |
Natural Resources, Construction and Maintenance Occupations
The most common Natural Resources, Construction and Maintenance occupations in Moses Lake are Farming, Fishing & Forestry (658 | 5.6%), Installation, Maintenance & Repair (567 | 4.9%), and Construction & Extraction (326 | 2.8%).
Natural Resources, Construction and Maintenance Occupations by Sex
| Occupation | Male | Female |
| Farming, Fishing & Forestry | 625 (95.0%) | 33 (5.0%) |
| Construction & Extraction | 326 (100.0%) | 0 (0.0%) |
| Installation, Maintenance & Repair | 567 (100.0%) | 0 (0.0%) |
| Total (Category) | 1,518 (97.9%) | 33 (2.1%) |
| Total (Overall) | 5,857 (50.1%) | 5,826 (49.9%) |
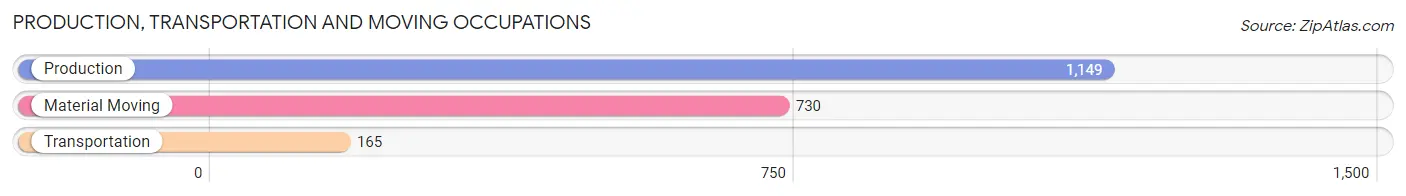
Production, Transportation and Moving Occupations
The most common Production, Transportation and Moving occupations in Moses Lake are Production (1,149 | 9.8%), Material Moving (730 | 6.2%), and Transportation (165 | 1.4%).
Production, Transportation and Moving Occupations by Sex
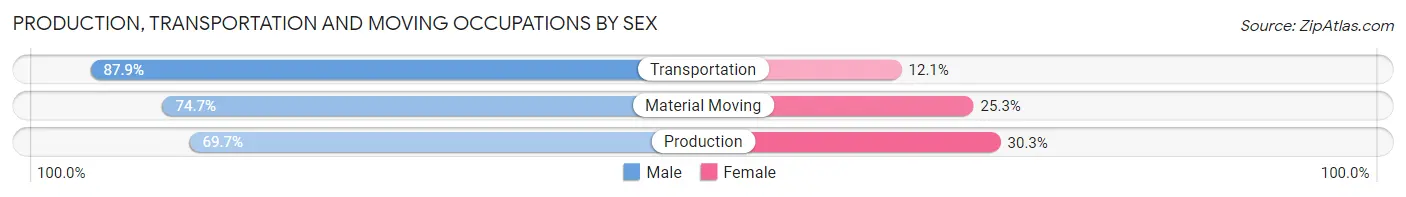
| Occupation | Male | Female |
| Production | 801 (69.7%) | 348 (30.3%) |
| Transportation | 145 (87.9%) | 20 (12.1%) |
| Material Moving | 545 (74.7%) | 185 (25.3%) |
| Total (Category) | 1,491 (73.0%) | 553 (27.1%) |
| Total (Overall) | 5,857 (50.1%) | 5,826 (49.9%) |
Employment Industries by Sex in Moses Lake
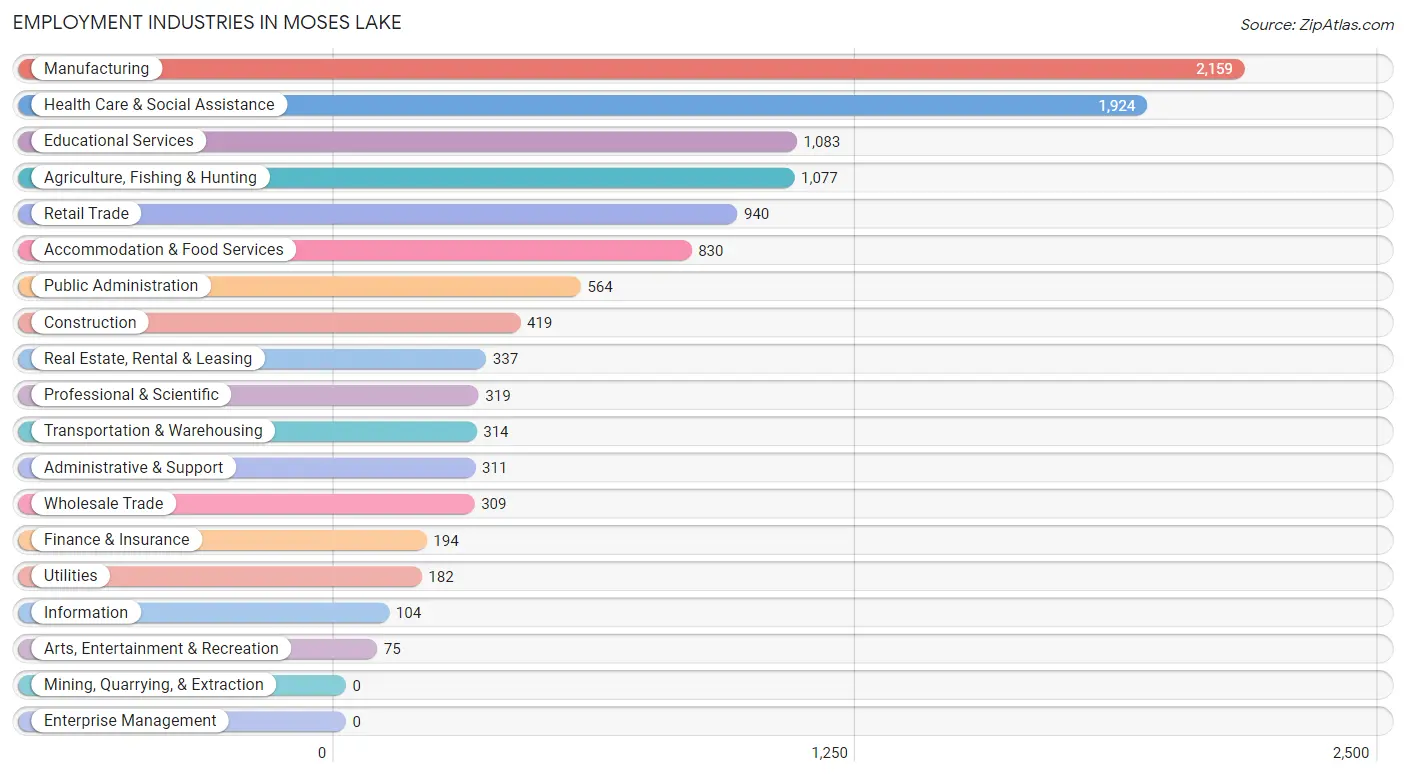
Employment Industries in Moses Lake
The major employment industries in Moses Lake include Manufacturing (2,159 | 18.5%), Health Care & Social Assistance (1,924 | 16.5%), Educational Services (1,083 | 9.3%), Agriculture, Fishing & Hunting (1,077 | 9.2%), and Retail Trade (940 | 8.1%).
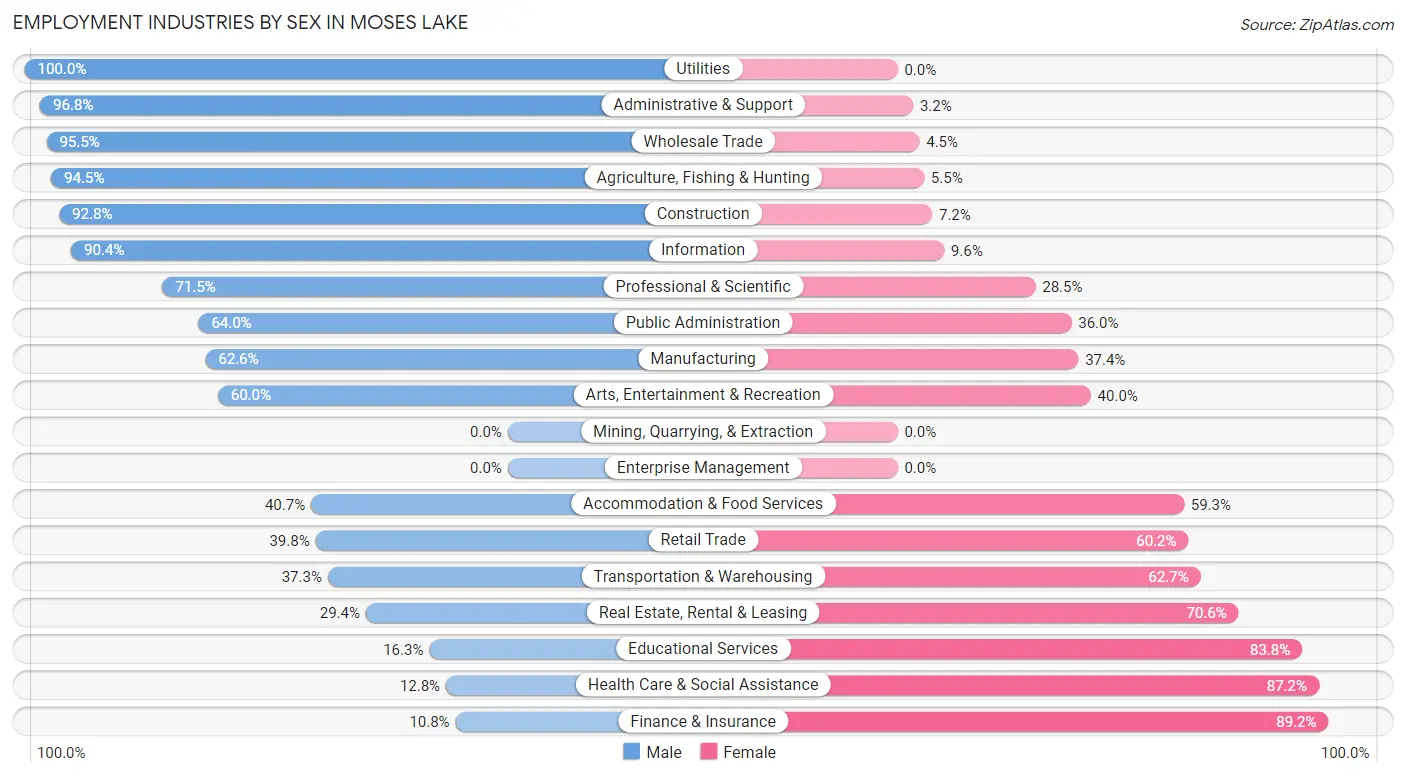
Employment Industries by Sex in Moses Lake
The Moses Lake industries that see more men than women are Utilities (100.0%), Administrative & Support (96.8%), and Wholesale Trade (95.5%), whereas the industries that tend to have a higher number of women are Finance & Insurance (89.2%), Health Care & Social Assistance (87.2%), and Educational Services (83.8%).
| Industry | Male | Female |
| Agriculture, Fishing & Hunting | 1,018 (94.5%) | 59 (5.5%) |
| Mining, Quarrying, & Extraction | 0 (0.0%) | 0 (0.0%) |
| Construction | 389 (92.8%) | 30 (7.2%) |
| Manufacturing | 1,351 (62.6%) | 808 (37.4%) |
| Wholesale Trade | 295 (95.5%) | 14 (4.5%) |
| Retail Trade | 374 (39.8%) | 566 (60.2%) |
| Transportation & Warehousing | 117 (37.3%) | 197 (62.7%) |
| Utilities | 182 (100.0%) | 0 (0.0%) |
| Information | 94 (90.4%) | 10 (9.6%) |
| Finance & Insurance | 21 (10.8%) | 173 (89.2%) |
| Real Estate, Rental & Leasing | 99 (29.4%) | 238 (70.6%) |
| Professional & Scientific | 228 (71.5%) | 91 (28.5%) |
| Enterprise Management | 0 (0.0%) | 0 (0.0%) |
| Administrative & Support | 301 (96.8%) | 10 (3.2%) |
| Educational Services | 176 (16.3%) | 907 (83.8%) |
| Health Care & Social Assistance | 246 (12.8%) | 1,678 (87.2%) |
| Arts, Entertainment & Recreation | 45 (60.0%) | 30 (40.0%) |
| Accommodation & Food Services | 338 (40.7%) | 492 (59.3%) |
| Public Administration | 361 (64.0%) | 203 (36.0%) |
| Total | 5,857 (50.1%) | 5,826 (49.9%) |
Education in Moses Lake
School Enrollment in Moses Lake
The most common levels of schooling among the 7,583 students in Moses Lake are high school (2,259 | 29.8%), elementary school (1,573 | 20.7%), and middle school (1,418 | 18.7%).
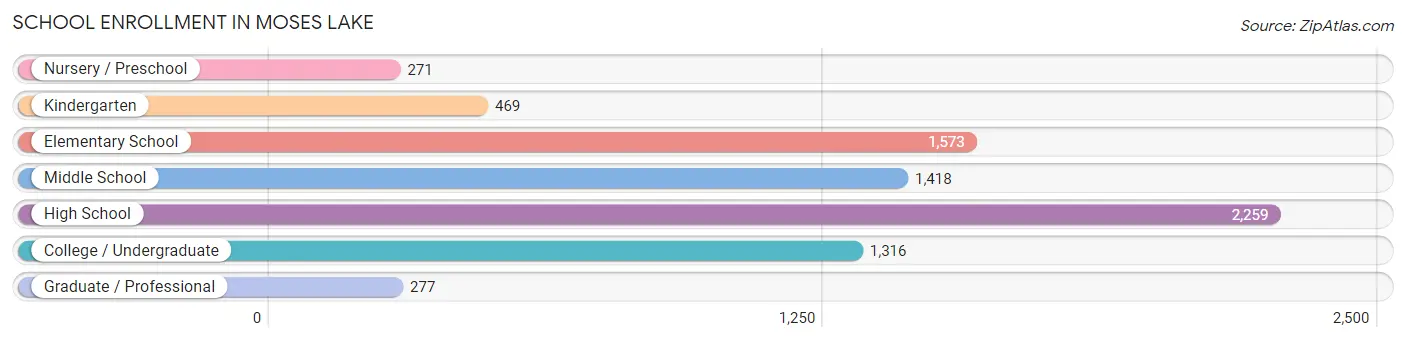
| School Level | # Students | % Students |
| Nursery / Preschool | 271 | 3.6% |
| Kindergarten | 469 | 6.2% |
| Elementary School | 1,573 | 20.7% |
| Middle School | 1,418 | 18.7% |
| High School | 2,259 | 29.8% |
| College / Undergraduate | 1,316 | 17.3% |
| Graduate / Professional | 277 | 3.6% |
| Total | 7,583 | 100.0% |
School Enrollment by Age by Funding Source in Moses Lake
Out of a total of 7,583 students who are enrolled in schools in Moses Lake, 500 (6.6%) attend a private institution, while the remaining 7,083 (93.4%) are enrolled in public schools. The age group of 25 to 34 year olds has the highest likelihood of being enrolled in private schools, with 140 (34.9% in the age bracket) enrolled. Conversely, the age group of 18 to 19 year olds has the lowest likelihood of being enrolled in a private school, with 586 (100.0% in the age bracket) attending a public institution.
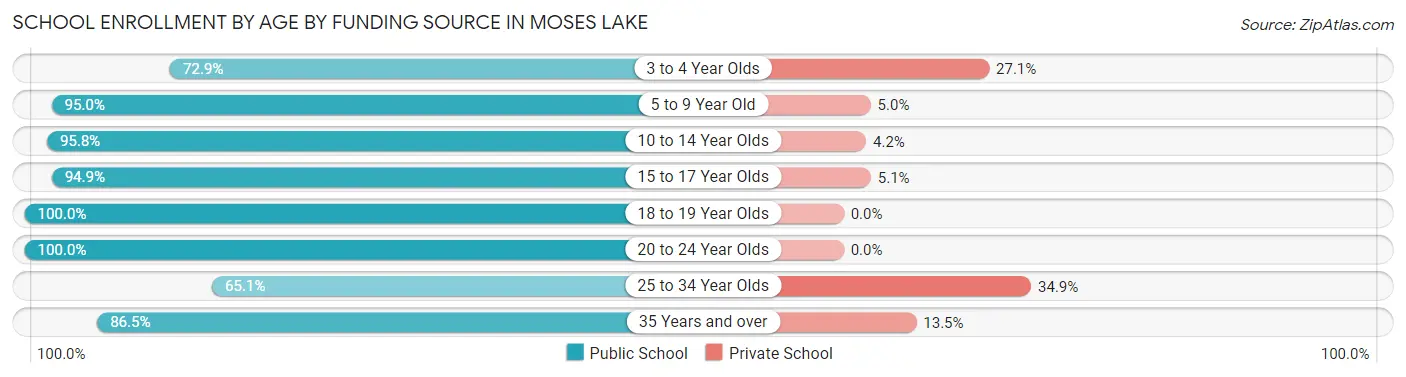
| Age Bracket | Public School | Private School |
| 3 to 4 Year Olds | 183 (72.9%) | 68 (27.1%) |
| 5 to 9 Year Old | 1,698 (95.0%) | 90 (5.0%) |
| 10 to 14 Year Olds | 1,861 (95.8%) | 81 (4.2%) |
| 15 to 17 Year Olds | 1,615 (94.9%) | 86 (5.1%) |
| 18 to 19 Year Olds | 586 (100.0%) | 0 (0.0%) |
| 20 to 24 Year Olds | 626 (100.0%) | 0 (0.0%) |
| 25 to 34 Year Olds | 261 (65.1%) | 140 (34.9%) |
| 35 Years and over | 249 (86.5%) | 39 (13.5%) |
| Total | 7,083 (93.4%) | 500 (6.6%) |
Educational Attainment by Field of Study in Moses Lake
Education (649 | 18.2%), business (401 | 11.3%), science & technology (378 | 10.6%), social sciences (355 | 10.0%), and arts & humanities (340 | 9.6%) are the most common fields of study among 3,559 individuals in Moses Lake who have obtained a bachelor's degree or higher.
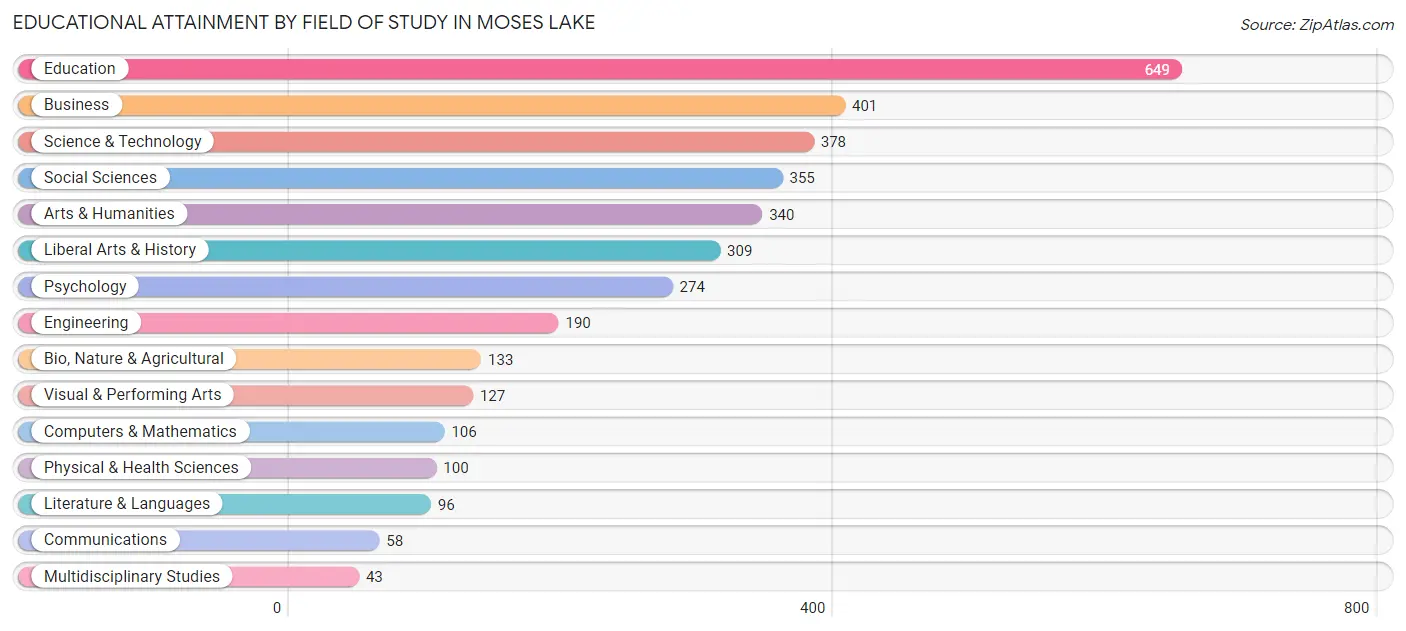
| Field of Study | # Graduates | % Graduates |
| Computers & Mathematics | 106 | 3.0% |
| Bio, Nature & Agricultural | 133 | 3.7% |
| Physical & Health Sciences | 100 | 2.8% |
| Psychology | 274 | 7.7% |
| Social Sciences | 355 | 10.0% |
| Engineering | 190 | 5.3% |
| Multidisciplinary Studies | 43 | 1.2% |
| Science & Technology | 378 | 10.6% |
| Business | 401 | 11.3% |
| Education | 649 | 18.2% |
| Literature & Languages | 96 | 2.7% |
| Liberal Arts & History | 309 | 8.7% |
| Visual & Performing Arts | 127 | 3.6% |
| Communications | 58 | 1.6% |
| Arts & Humanities | 340 | 9.6% |
| Total | 3,559 | 100.0% |
Transportation & Commute in Moses Lake
Vehicle Availability by Sex in Moses Lake
The most prevalent vehicle ownership categories in Moses Lake are males with 2 vehicles (2,255, accounting for 38.7%) and females with 2 vehicles (2,141, making up 39.5%).
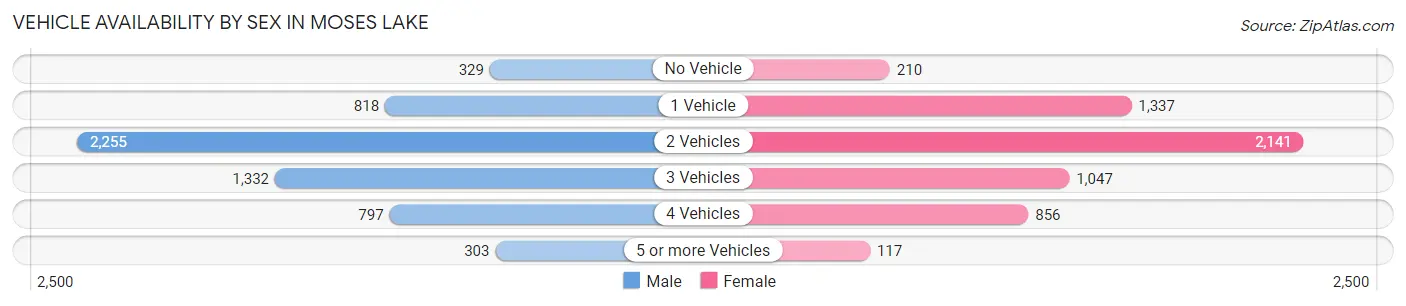
| Vehicles Available | Male | Female |
| No Vehicle | 329 (5.6%) | 210 (3.7%) |
| 1 Vehicle | 818 (14.0%) | 1,337 (23.4%) |
| 2 Vehicles | 2,255 (38.7%) | 2,141 (37.5%) |
| 3 Vehicles | 1,332 (22.8%) | 1,047 (18.3%) |
| 4 Vehicles | 797 (13.7%) | 856 (15.0%) |
| 5 or more Vehicles | 303 (5.2%) | 117 (2.1%) |
| Total | 5,834 (100.0%) | 5,708 (100.0%) |
Commute Time in Moses Lake
The most frequently occuring commute durations in Moses Lake are 5 to 9 minutes (2,754 commuters, 25.3%), 15 to 19 minutes (2,166 commuters, 19.9%), and 10 to 14 minutes (1,809 commuters, 16.6%).
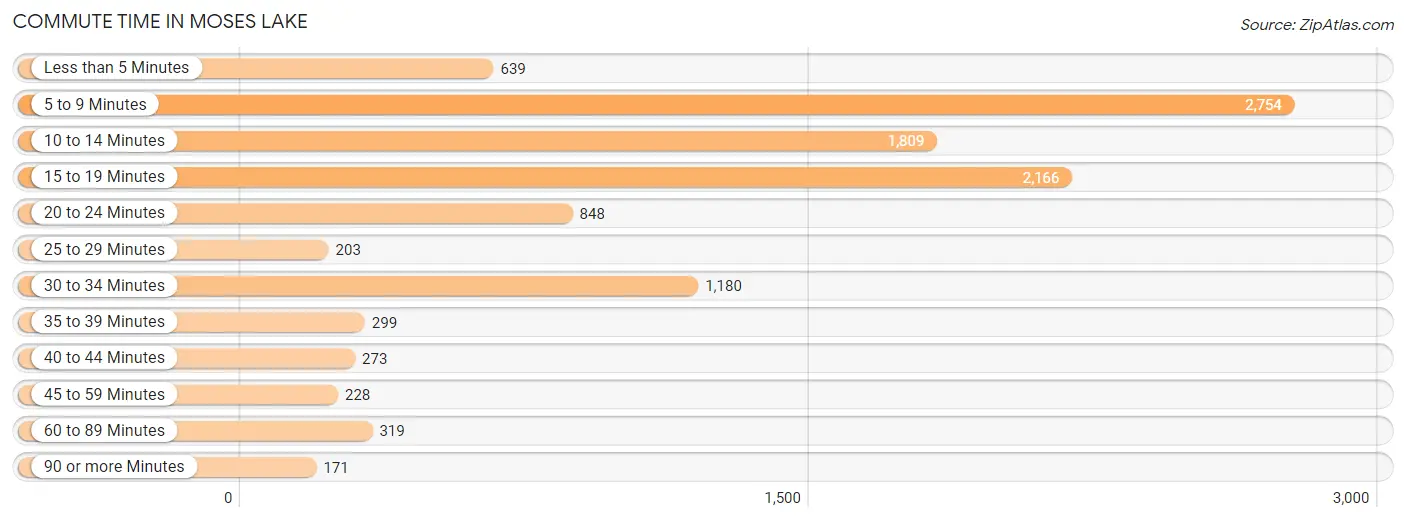
| Commute Time | # Commuters | % Commuters |
| Less than 5 Minutes | 639 | 5.9% |
| 5 to 9 Minutes | 2,754 | 25.3% |
| 10 to 14 Minutes | 1,809 | 16.6% |
| 15 to 19 Minutes | 2,166 | 19.9% |
| 20 to 24 Minutes | 848 | 7.8% |
| 25 to 29 Minutes | 203 | 1.9% |
| 30 to 34 Minutes | 1,180 | 10.8% |
| 35 to 39 Minutes | 299 | 2.8% |
| 40 to 44 Minutes | 273 | 2.5% |
| 45 to 59 Minutes | 228 | 2.1% |
| 60 to 89 Minutes | 319 | 2.9% |
| 90 or more Minutes | 171 | 1.6% |
Commute Time by Sex in Moses Lake
The most common commute times in Moses Lake are 15 to 19 minutes (1,178 commuters, 20.7%) for males and 5 to 9 minutes (1,596 commuters, 30.6%) for females.
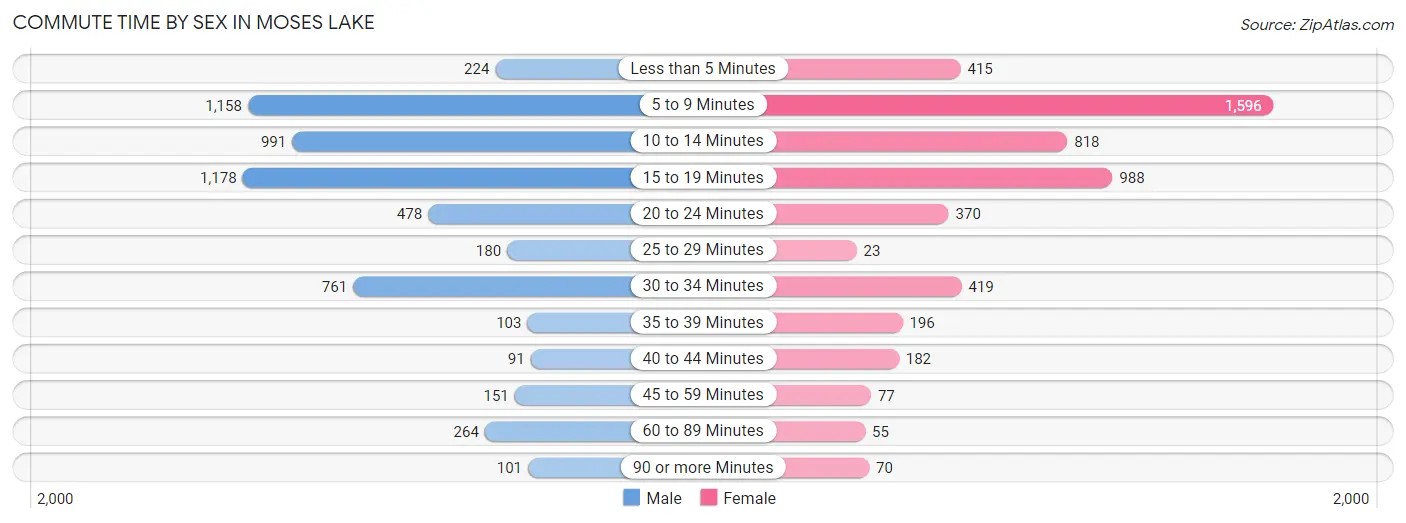
| Commute Time | Male | Female |
| Less than 5 Minutes | 224 (3.9%) | 415 (8.0%) |
| 5 to 9 Minutes | 1,158 (20.4%) | 1,596 (30.6%) |
| 10 to 14 Minutes | 991 (17.4%) | 818 (15.7%) |
| 15 to 19 Minutes | 1,178 (20.7%) | 988 (19.0%) |
| 20 to 24 Minutes | 478 (8.4%) | 370 (7.1%) |
| 25 to 29 Minutes | 180 (3.2%) | 23 (0.4%) |
| 30 to 34 Minutes | 761 (13.4%) | 419 (8.0%) |
| 35 to 39 Minutes | 103 (1.8%) | 196 (3.8%) |
| 40 to 44 Minutes | 91 (1.6%) | 182 (3.5%) |
| 45 to 59 Minutes | 151 (2.7%) | 77 (1.5%) |
| 60 to 89 Minutes | 264 (4.6%) | 55 (1.1%) |
| 90 or more Minutes | 101 (1.8%) | 70 (1.3%) |
Time of Departure to Work by Sex in Moses Lake
The most frequent times of departure to work in Moses Lake are 7:30 AM to 7:59 AM (911, 16.0%) for males and 12:00 PM to 3:59 PM (725, 13.9%) for females.
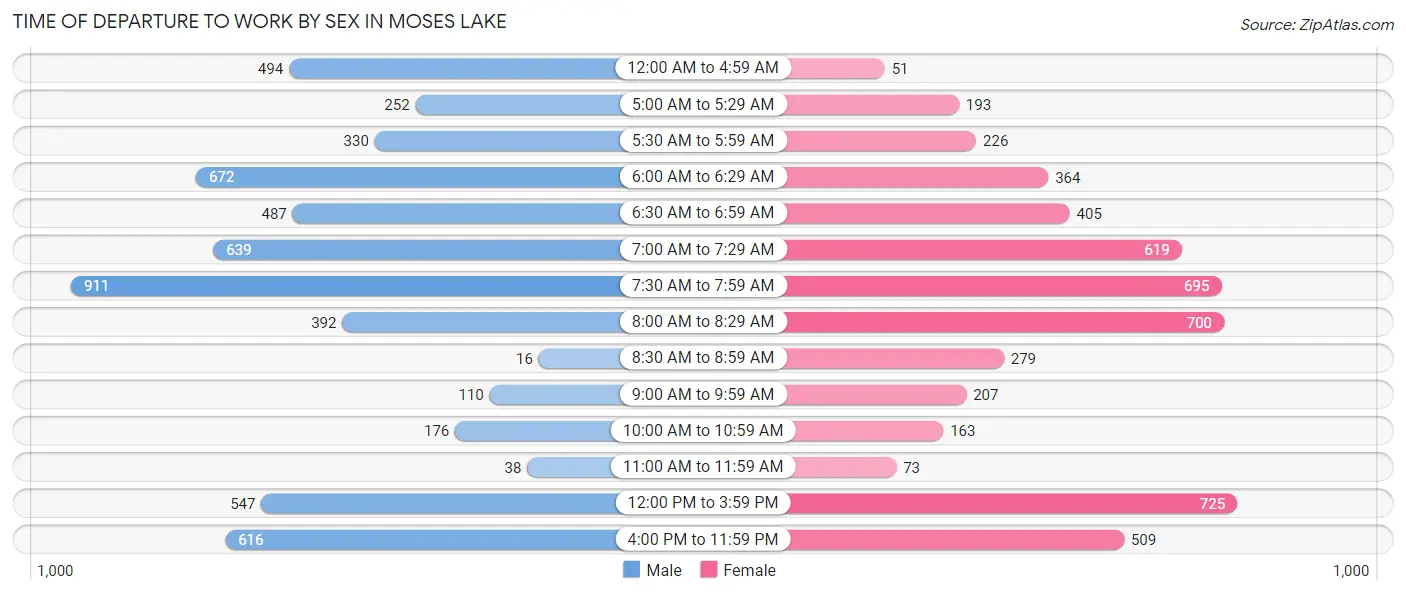
| Time of Departure | Male | Female |
| 12:00 AM to 4:59 AM | 494 (8.7%) | 51 (1.0%) |
| 5:00 AM to 5:29 AM | 252 (4.4%) | 193 (3.7%) |
| 5:30 AM to 5:59 AM | 330 (5.8%) | 226 (4.3%) |
| 6:00 AM to 6:29 AM | 672 (11.8%) | 364 (7.0%) |
| 6:30 AM to 6:59 AM | 487 (8.6%) | 405 (7.8%) |
| 7:00 AM to 7:29 AM | 639 (11.3%) | 619 (11.9%) |
| 7:30 AM to 7:59 AM | 911 (16.0%) | 695 (13.3%) |
| 8:00 AM to 8:29 AM | 392 (6.9%) | 700 (13.4%) |
| 8:30 AM to 8:59 AM | 16 (0.3%) | 279 (5.4%) |
| 9:00 AM to 9:59 AM | 110 (1.9%) | 207 (4.0%) |
| 10:00 AM to 10:59 AM | 176 (3.1%) | 163 (3.1%) |
| 11:00 AM to 11:59 AM | 38 (0.7%) | 73 (1.4%) |
| 12:00 PM to 3:59 PM | 547 (9.6%) | 725 (13.9%) |
| 4:00 PM to 11:59 PM | 616 (10.8%) | 509 (9.8%) |
| Total | 5,680 (100.0%) | 5,209 (100.0%) |
Housing Occupancy in Moses Lake
Occupancy by Ownership in Moses Lake
Of the total 9,223 dwellings in Moses Lake, owner-occupied units account for 5,324 (57.7%), while renter-occupied units make up 3,899 (42.3%).
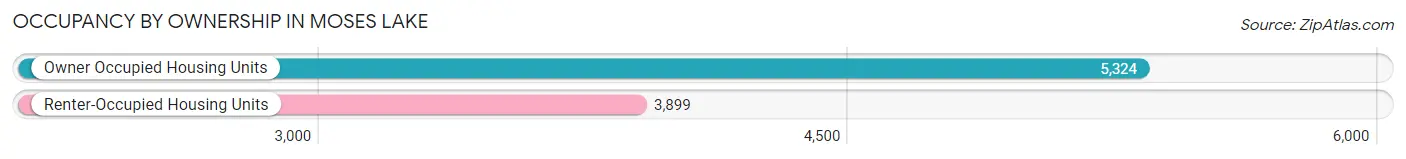
| Occupancy | # Housing Units | % Housing Units |
| Owner Occupied Housing Units | 5,324 | 57.7% |
| Renter-Occupied Housing Units | 3,899 | 42.3% |
| Total Occupied Housing Units | 9,223 | 100.0% |
Occupancy by Household Size in Moses Lake
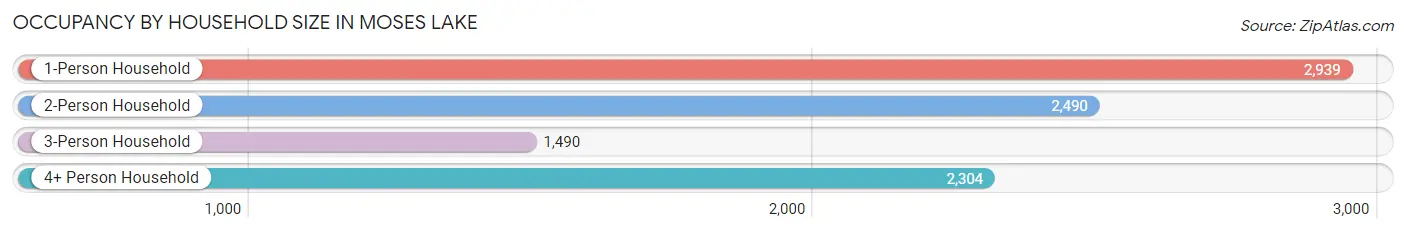
| Household Size | # Housing Units | % Housing Units |
| 1-Person Household | 2,939 | 31.9% |
| 2-Person Household | 2,490 | 27.0% |
| 3-Person Household | 1,490 | 16.2% |
| 4+ Person Household | 2,304 | 25.0% |
| Total Housing Units | 9,223 | 100.0% |
Occupancy by Ownership by Household Size in Moses Lake
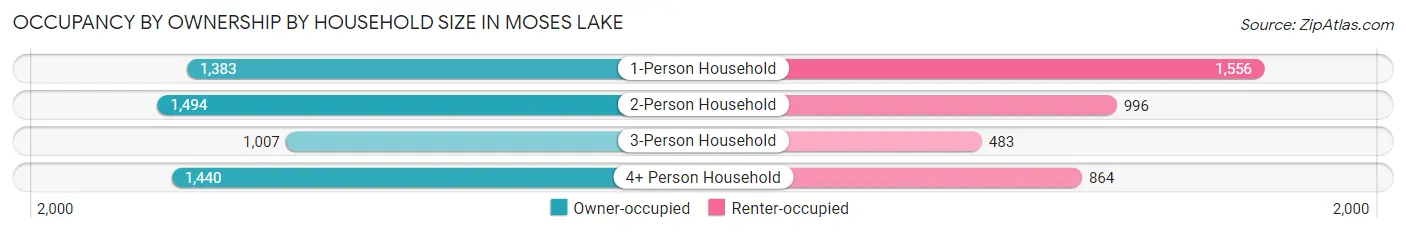
| Household Size | Owner-occupied | Renter-occupied |
| 1-Person Household | 1,383 (47.1%) | 1,556 (52.9%) |
| 2-Person Household | 1,494 (60.0%) | 996 (40.0%) |
| 3-Person Household | 1,007 (67.6%) | 483 (32.4%) |
| 4+ Person Household | 1,440 (62.5%) | 864 (37.5%) |
| Total Housing Units | 5,324 (57.7%) | 3,899 (42.3%) |
Occupancy by Educational Attainment in Moses Lake
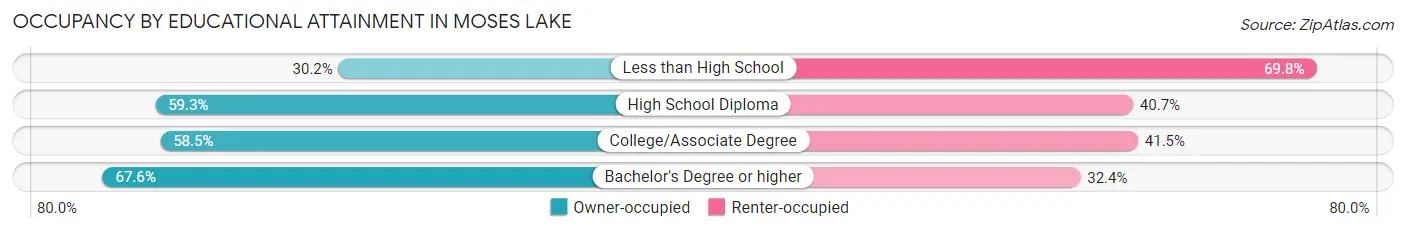
| Household Size | Owner-occupied | Renter-occupied |
| Less than High School | 297 (30.2%) | 686 (69.8%) |
| High School Diploma | 1,373 (59.3%) | 943 (40.7%) |
| College/Associate Degree | 2,256 (58.5%) | 1,601 (41.5%) |
| Bachelor's Degree or higher | 1,398 (67.6%) | 669 (32.4%) |
Occupancy by Age of Householder in Moses Lake
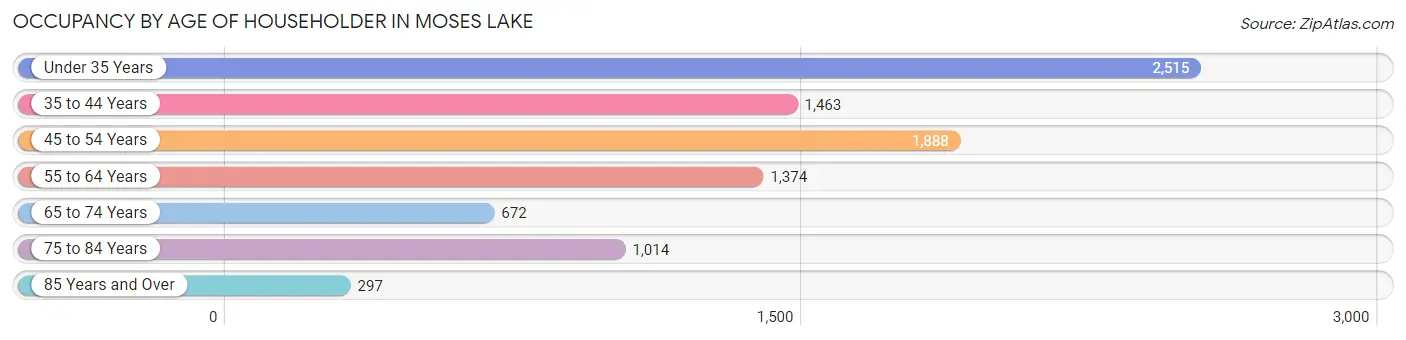
| Age Bracket | # Households | % Households |
| Under 35 Years | 2,515 | 27.3% |
| 35 to 44 Years | 1,463 | 15.9% |
| 45 to 54 Years | 1,888 | 20.5% |
| 55 to 64 Years | 1,374 | 14.9% |
| 65 to 74 Years | 672 | 7.3% |
| 75 to 84 Years | 1,014 | 11.0% |
| 85 Years and Over | 297 | 3.2% |
| Total | 9,223 | 100.0% |
Housing Finances in Moses Lake
Median Income by Occupancy in Moses Lake
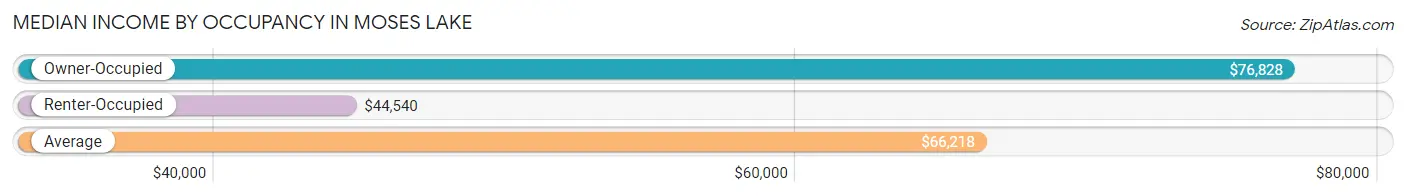
| Occupancy Type | # Households | Median Income |
| Owner-Occupied | 5,324 (57.7%) | $76,828 |
| Renter-Occupied | 3,899 (42.3%) | $44,540 |
| Average | 9,223 (100.0%) | $66,218 |
Occupancy by Householder Income Bracket in Moses Lake
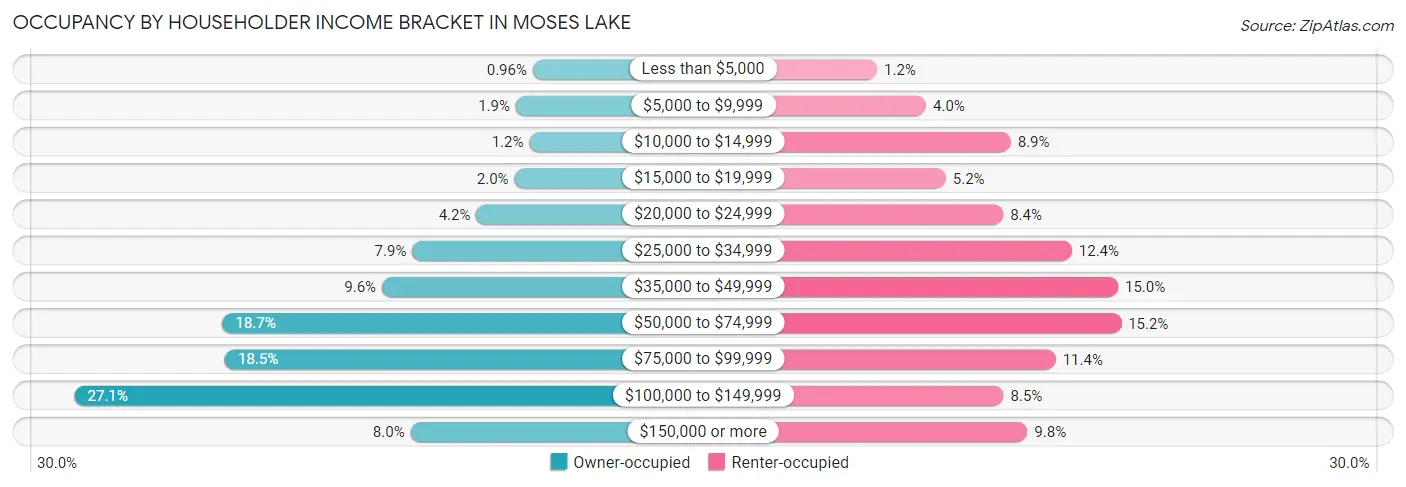
| Income Bracket | Owner-occupied | Renter-occupied |
| Less than $5,000 | 51 (1.0%) | 48 (1.2%) |
| $5,000 to $9,999 | 103 (1.9%) | 157 (4.0%) |
| $10,000 to $14,999 | 62 (1.2%) | 346 (8.9%) |
| $15,000 to $19,999 | 107 (2.0%) | 201 (5.2%) |
| $20,000 to $24,999 | 223 (4.2%) | 329 (8.4%) |
| $25,000 to $34,999 | 418 (7.9%) | 482 (12.4%) |
| $35,000 to $49,999 | 510 (9.6%) | 585 (15.0%) |
| $50,000 to $74,999 | 995 (18.7%) | 592 (15.2%) |
| $75,000 to $99,999 | 987 (18.5%) | 446 (11.4%) |
| $100,000 to $149,999 | 1,445 (27.1%) | 330 (8.5%) |
| $150,000 or more | 423 (8.0%) | 383 (9.8%) |
| Total | 5,324 (100.0%) | 3,899 (100.0%) |
Monthly Housing Cost Tiers in Moses Lake
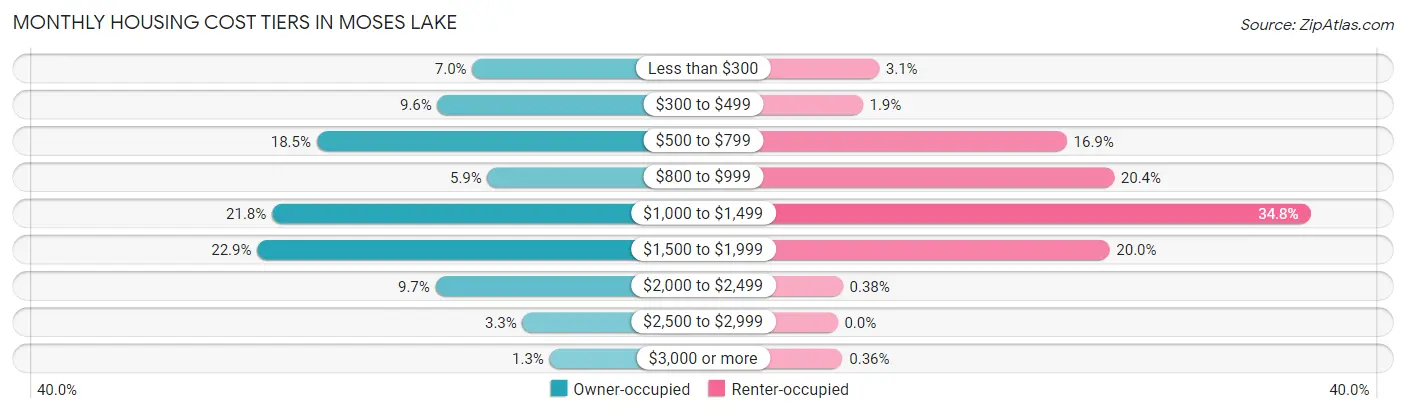
| Monthly Cost | Owner-occupied | Renter-occupied |
| Less than $300 | 374 (7.0%) | 119 (3.0%) |
| $300 to $499 | 510 (9.6%) | 72 (1.8%) |
| $500 to $799 | 984 (18.5%) | 658 (16.9%) |
| $800 to $999 | 314 (5.9%) | 794 (20.4%) |
| $1,000 to $1,499 | 1,159 (21.8%) | 1,358 (34.8%) |
| $1,500 to $1,999 | 1,217 (22.9%) | 781 (20.0%) |
| $2,000 to $2,499 | 518 (9.7%) | 15 (0.4%) |
| $2,500 to $2,999 | 177 (3.3%) | 0 (0.0%) |
| $3,000 or more | 71 (1.3%) | 14 (0.4%) |
| Total | 5,324 (100.0%) | 3,899 (100.0%) |
Physical Housing Characteristics in Moses Lake
Housing Structures in Moses Lake
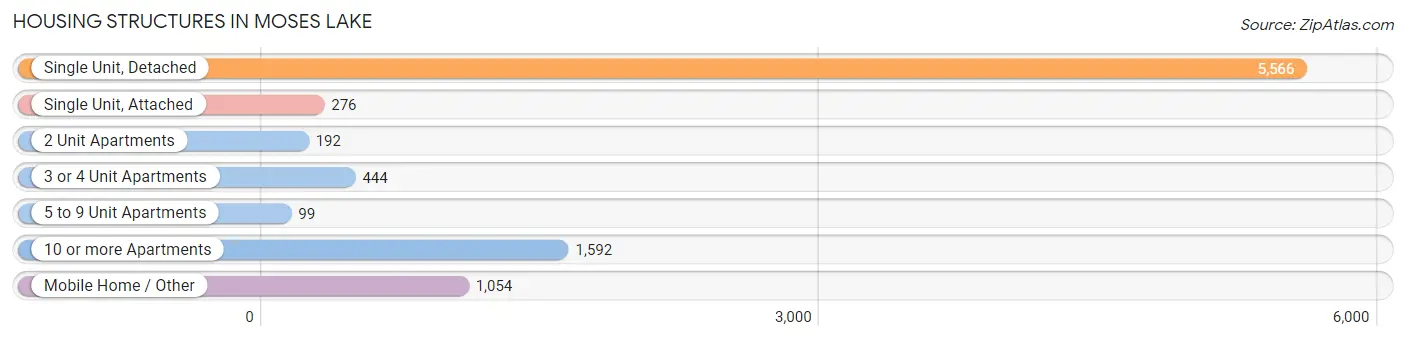
| Structure Type | # Housing Units | % Housing Units |
| Single Unit, Detached | 5,566 | 60.4% |
| Single Unit, Attached | 276 | 3.0% |
| 2 Unit Apartments | 192 | 2.1% |
| 3 or 4 Unit Apartments | 444 | 4.8% |
| 5 to 9 Unit Apartments | 99 | 1.1% |
| 10 or more Apartments | 1,592 | 17.3% |
| Mobile Home / Other | 1,054 | 11.4% |
| Total | 9,223 | 100.0% |
Housing Structures by Occupancy in Moses Lake
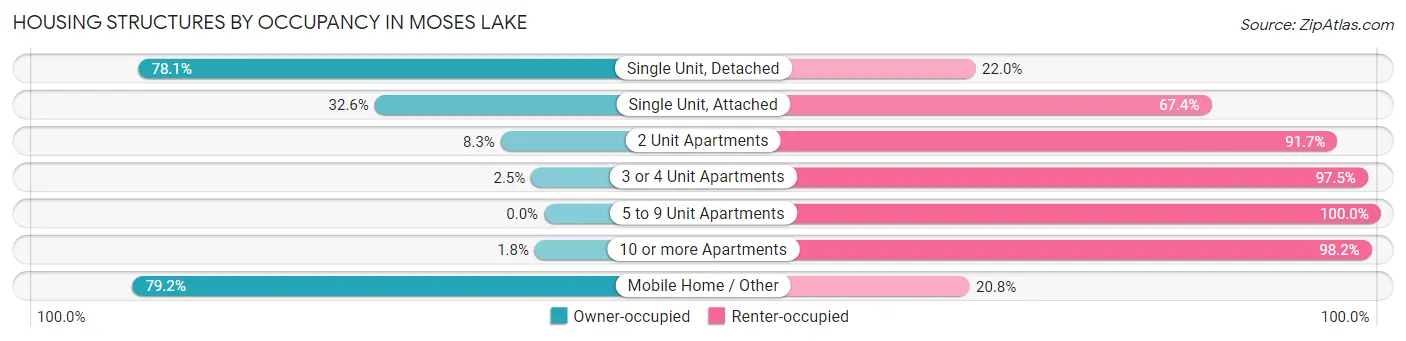
| Structure Type | Owner-occupied | Renter-occupied |
| Single Unit, Detached | 4,344 (78.0%) | 1,222 (22.0%) |
| Single Unit, Attached | 90 (32.6%) | 186 (67.4%) |
| 2 Unit Apartments | 16 (8.3%) | 176 (91.7%) |
| 3 or 4 Unit Apartments | 11 (2.5%) | 433 (97.5%) |
| 5 to 9 Unit Apartments | 0 (0.0%) | 99 (100.0%) |
| 10 or more Apartments | 28 (1.8%) | 1,564 (98.2%) |
| Mobile Home / Other | 835 (79.2%) | 219 (20.8%) |
| Total | 5,324 (57.7%) | 3,899 (42.3%) |
Housing Structures by Number of Rooms in Moses Lake
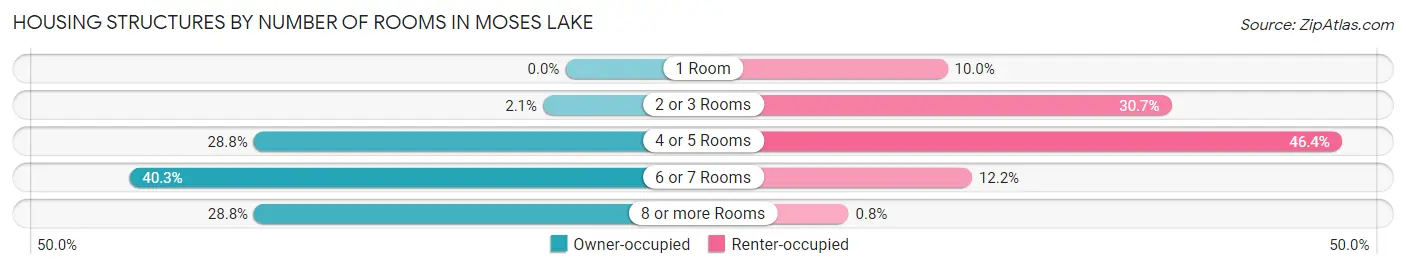
| Number of Rooms | Owner-occupied | Renter-occupied |
| 1 Room | 0 (0.0%) | 388 (10.0%) |
| 2 or 3 Rooms | 110 (2.1%) | 1,195 (30.6%) |
| 4 or 5 Rooms | 1,535 (28.8%) | 1,809 (46.4%) |
| 6 or 7 Rooms | 2,146 (40.3%) | 476 (12.2%) |
| 8 or more Rooms | 1,533 (28.8%) | 31 (0.8%) |
| Total | 5,324 (100.0%) | 3,899 (100.0%) |
Housing Structure by Heating Type in Moses Lake
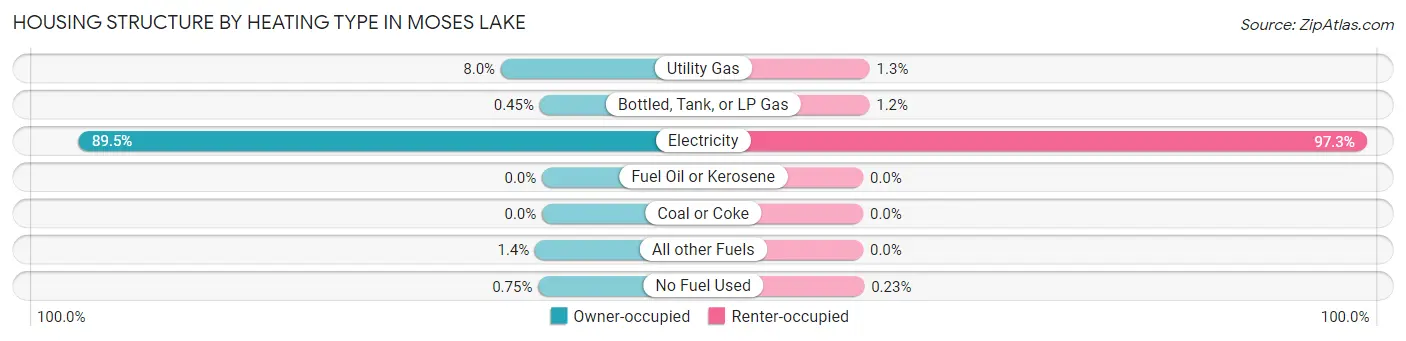
| Heating Type | Owner-occupied | Renter-occupied |
| Utility Gas | 423 (8.0%) | 50 (1.3%) |
| Bottled, Tank, or LP Gas | 24 (0.4%) | 47 (1.2%) |
| Electricity | 4,765 (89.5%) | 3,793 (97.3%) |
| Fuel Oil or Kerosene | 0 (0.0%) | 0 (0.0%) |
| Coal or Coke | 0 (0.0%) | 0 (0.0%) |
| All other Fuels | 72 (1.3%) | 0 (0.0%) |
| No Fuel Used | 40 (0.7%) | 9 (0.2%) |
| Total | 5,324 (100.0%) | 3,899 (100.0%) |
Household Vehicle Usage in Moses Lake
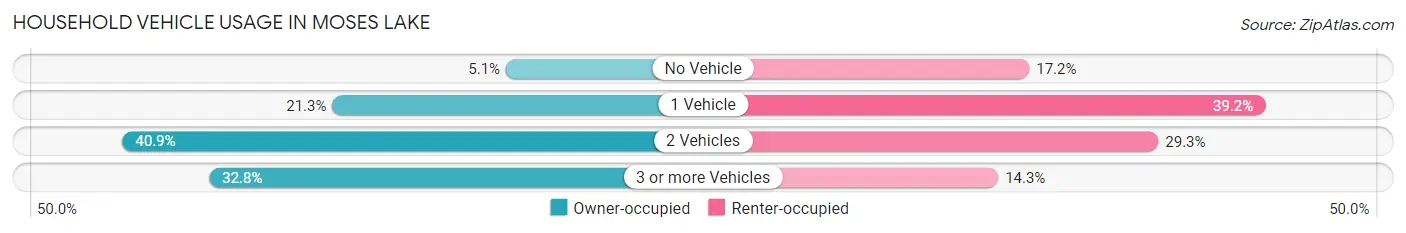
| Vehicles per Household | Owner-occupied | Renter-occupied |
| No Vehicle | 270 (5.1%) | 671 (17.2%) |
| 1 Vehicle | 1,133 (21.3%) | 1,529 (39.2%) |
| 2 Vehicles | 2,176 (40.9%) | 1,141 (29.3%) |
| 3 or more Vehicles | 1,745 (32.8%) | 558 (14.3%) |
| Total | 5,324 (100.0%) | 3,899 (100.0%) |
Real Estate & Mortgages in Moses Lake
Real Estate and Mortgage Overview in Moses Lake
| Characteristic | Without Mortgage | With Mortgage |
| Housing Units | 1,818 | 3,506 |
| Median Property Value | $206,300 | $262,800 |
| Median Household Income | $51,514 | $293 |
| Monthly Housing Costs | $506 | $71 |
| Real Estate Taxes | $2,059 | $425 |
Property Value by Mortgage Status in Moses Lake
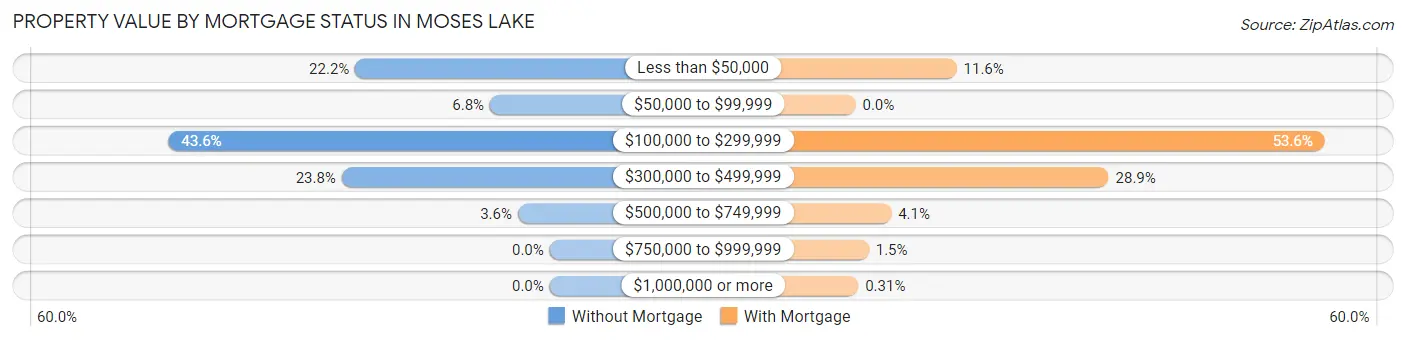
| Property Value | Without Mortgage | With Mortgage |
| Less than $50,000 | 404 (22.2%) | 405 (11.6%) |
| $50,000 to $99,999 | 124 (6.8%) | 0 (0.0%) |
| $100,000 to $299,999 | 792 (43.6%) | 1,880 (53.6%) |
| $300,000 to $499,999 | 432 (23.8%) | 1,014 (28.9%) |
| $500,000 to $749,999 | 66 (3.6%) | 143 (4.1%) |
| $750,000 to $999,999 | 0 (0.0%) | 53 (1.5%) |
| $1,000,000 or more | 0 (0.0%) | 11 (0.3%) |
| Total | 1,818 (100.0%) | 3,506 (100.0%) |
Household Income by Mortgage Status in Moses Lake
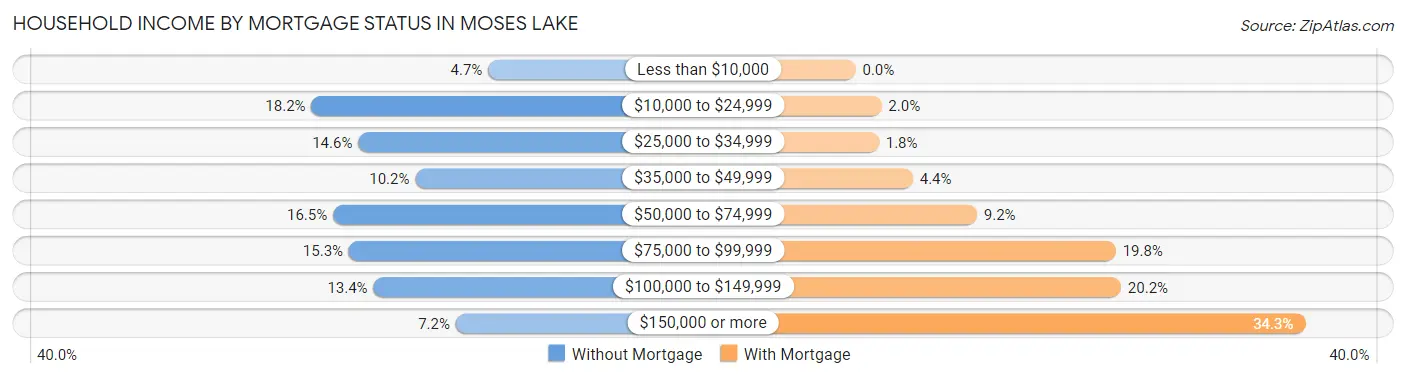
| Household Income | Without Mortgage | With Mortgage |
| Less than $10,000 | 85 (4.7%) | 0 (0.0%) |
| $10,000 to $24,999 | 330 (18.1%) | 69 (2.0%) |
| $25,000 to $34,999 | 265 (14.6%) | 62 (1.8%) |
| $35,000 to $49,999 | 186 (10.2%) | 153 (4.4%) |
| $50,000 to $74,999 | 300 (16.5%) | 324 (9.2%) |
| $75,000 to $99,999 | 278 (15.3%) | 695 (19.8%) |
| $100,000 to $149,999 | 244 (13.4%) | 709 (20.2%) |
| $150,000 or more | 130 (7.1%) | 1,201 (34.3%) |
| Total | 1,818 (100.0%) | 3,506 (100.0%) |
Property Value to Household Income Ratio in Moses Lake
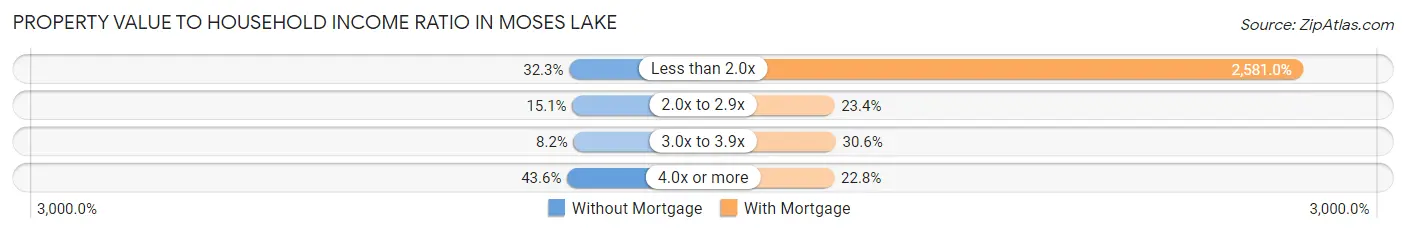
| Value-to-Income Ratio | Without Mortgage | With Mortgage |
| Less than 2.0x | 587 (32.3%) | 90,490 (2,581.0%) |
| 2.0x to 2.9x | 275 (15.1%) | 821 (23.4%) |
| 3.0x to 3.9x | 149 (8.2%) | 1,073 (30.6%) |
| 4.0x or more | 792 (43.6%) | 799 (22.8%) |
| Total | 1,818 (100.0%) | 3,506 (100.0%) |
Real Estate Taxes by Mortgage Status in Moses Lake
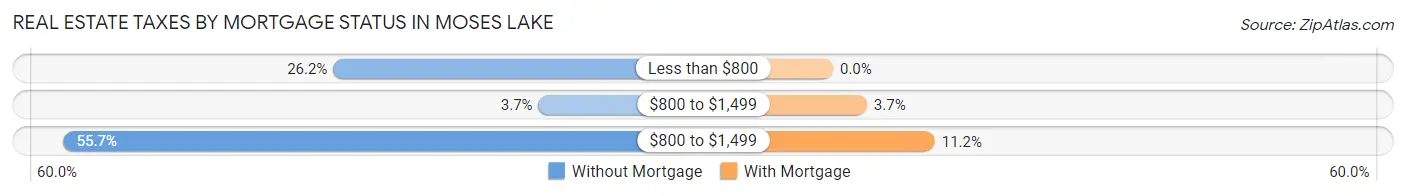
| Property Taxes | Without Mortgage | With Mortgage |
| Less than $800 | 476 (26.2%) | 0 (0.0%) |
| $800 to $1,499 | 67 (3.7%) | 130 (3.7%) |
| $800 to $1,499 | 1,013 (55.7%) | 391 (11.2%) |
| Total | 1,818 (100.0%) | 3,506 (100.0%) |
Health & Disability in Moses Lake
Health Insurance Coverage by Age in Moses Lake
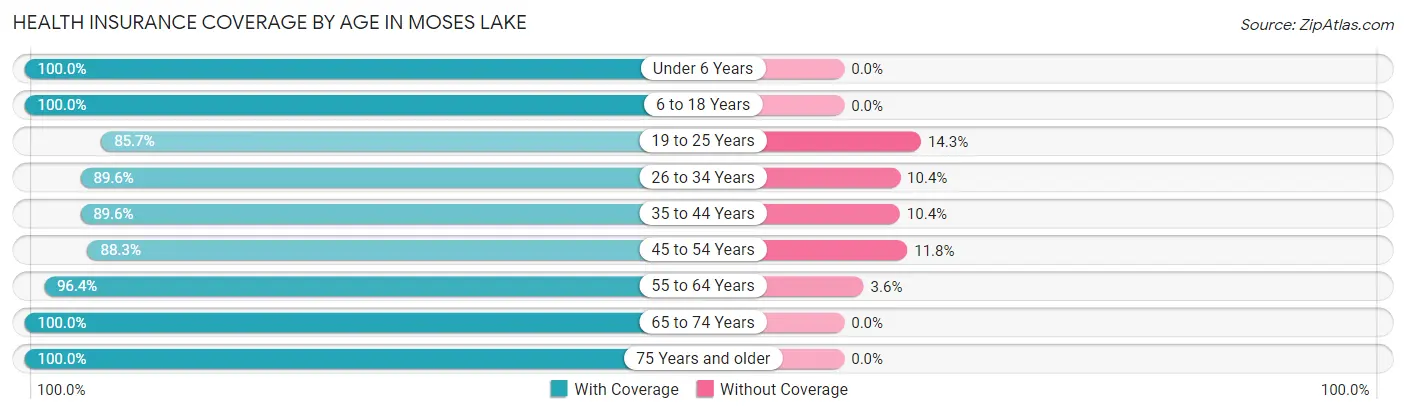
| Age Bracket | With Coverage | Without Coverage |
| Under 6 Years | 1,888 (100.0%) | 0 (0.0%) |
| 6 to 18 Years | 5,680 (100.0%) | 0 (0.0%) |
| 19 to 25 Years | 2,823 (85.7%) | 471 (14.3%) |
| 26 to 34 Years | 2,855 (89.6%) | 332 (10.4%) |
| 35 to 44 Years | 2,706 (89.6%) | 313 (10.4%) |
| 45 to 54 Years | 2,660 (88.2%) | 354 (11.7%) |
| 55 to 64 Years | 1,976 (96.4%) | 74 (3.6%) |
| 65 to 74 Years | 1,210 (100.0%) | 0 (0.0%) |
| 75 Years and older | 1,637 (100.0%) | 0 (0.0%) |
| Total | 23,435 (93.8%) | 1,544 (6.2%) |
Health Insurance Coverage by Citizenship Status in Moses Lake
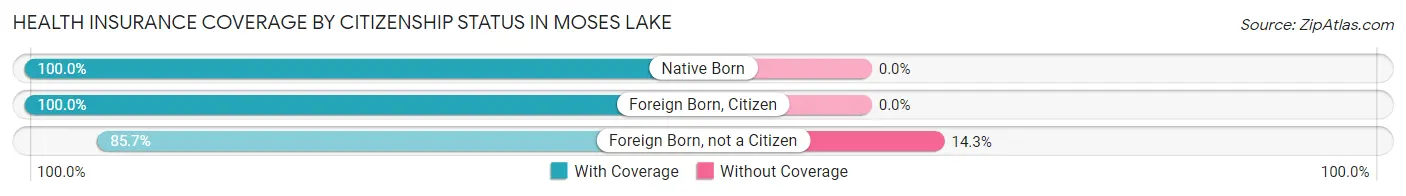
| Citizenship Status | With Coverage | Without Coverage |
| Native Born | 1,888 (100.0%) | 0 (0.0%) |
| Foreign Born, Citizen | 5,680 (100.0%) | 0 (0.0%) |
| Foreign Born, not a Citizen | 2,823 (85.7%) | 471 (14.3%) |
Health Insurance Coverage by Household Income in Moses Lake
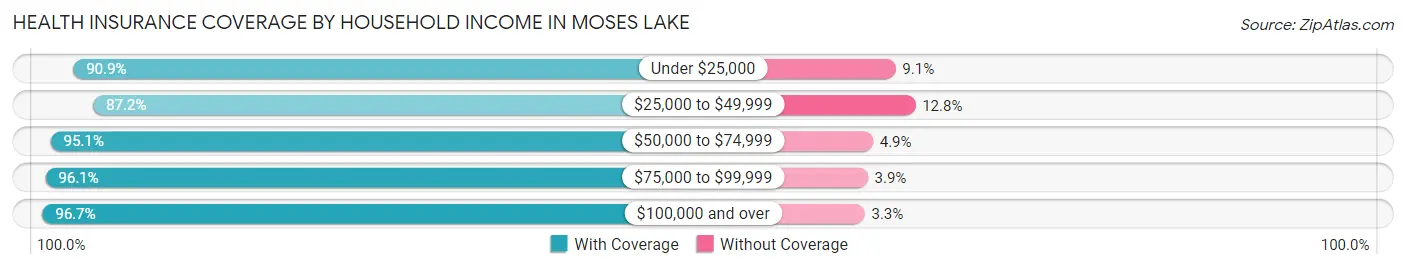
| Household Income | With Coverage | Without Coverage |
| Under $25,000 | 2,553 (90.9%) | 256 (9.1%) |
| $25,000 to $49,999 | 4,163 (87.2%) | 612 (12.8%) |
| $50,000 to $74,999 | 4,293 (95.1%) | 220 (4.9%) |
| $75,000 to $99,999 | 4,275 (96.1%) | 173 (3.9%) |
| $100,000 and over | 8,057 (96.7%) | 277 (3.3%) |
Public vs Private Health Insurance Coverage by Age in Moses Lake
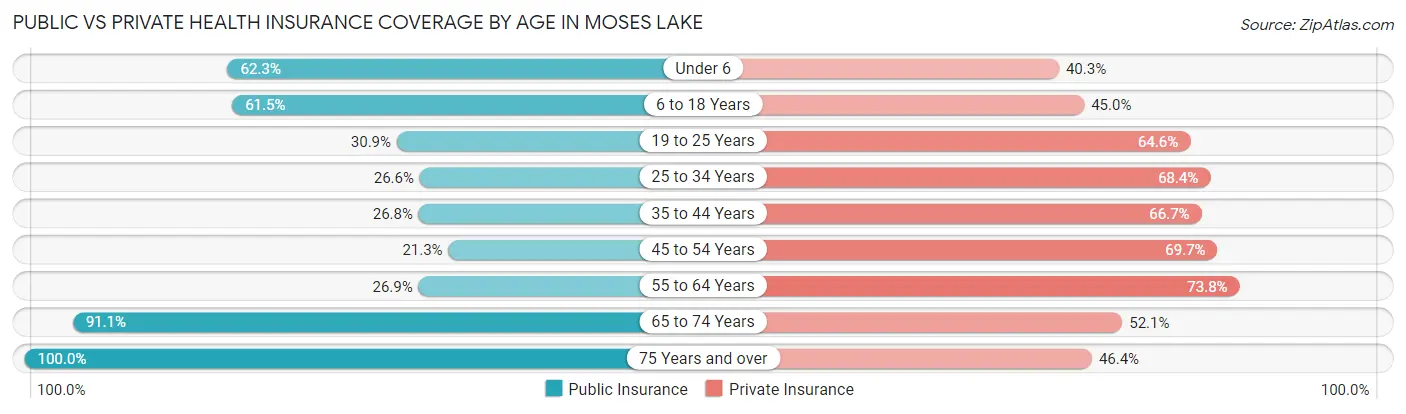
| Age Bracket | Public Insurance | Private Insurance |
| Under 6 | 1,177 (62.3%) | 761 (40.3%) |
| 6 to 18 Years | 3,491 (61.5%) | 2,556 (45.0%) |
| 19 to 25 Years | 1,018 (30.9%) | 2,129 (64.6%) |
| 25 to 34 Years | 849 (26.6%) | 2,179 (68.4%) |
| 35 to 44 Years | 810 (26.8%) | 2,015 (66.7%) |
| 45 to 54 Years | 643 (21.3%) | 2,101 (69.7%) |
| 55 to 64 Years | 551 (26.9%) | 1,513 (73.8%) |
| 65 to 74 Years | 1,102 (91.1%) | 630 (52.1%) |
| 75 Years and over | 1,637 (100.0%) | 760 (46.4%) |
| Total | 11,278 (45.2%) | 14,644 (58.6%) |
Disability Status by Sex by Age in Moses Lake
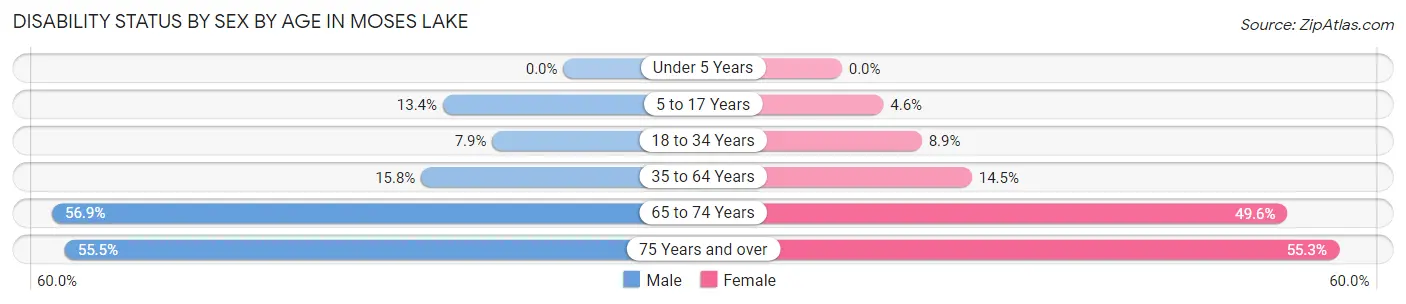
| Age Bracket | Male | Female |
| Under 5 Years | 0 (0.0%) | 0 (0.0%) |
| 5 to 17 Years | 340 (13.4%) | 136 (4.6%) |
| 18 to 34 Years | 268 (7.9%) | 306 (8.9%) |
| 35 to 64 Years | 639 (15.8%) | 586 (14.5%) |
| 65 to 74 Years | 238 (56.9%) | 393 (49.6%) |
| 75 Years and over | 327 (55.5%) | 580 (55.3%) |
Disability Class by Sex by Age in Moses Lake
Disability Class: Hearing Difficulty
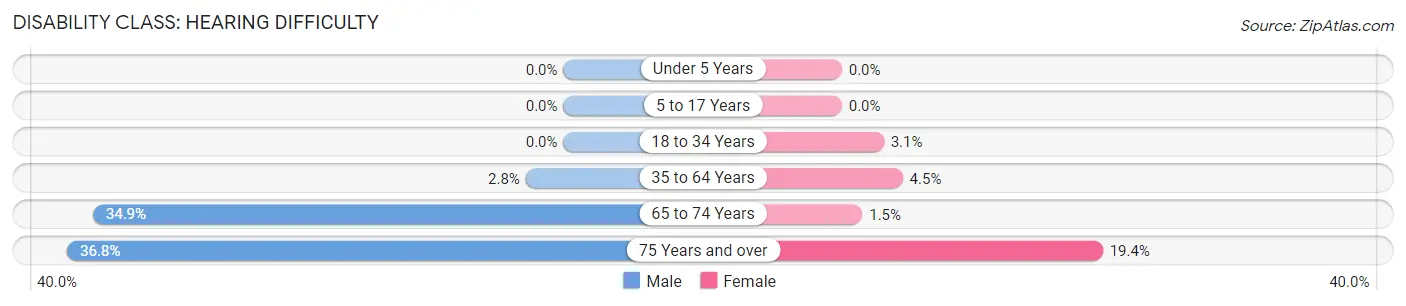
| Age Bracket | Male | Female |
| Under 5 Years | 0 (0.0%) | 0 (0.0%) |
| 5 to 17 Years | 0 (0.0%) | 0 (0.0%) |
| 18 to 34 Years | 0 (0.0%) | 107 (3.1%) |
| 35 to 64 Years | 113 (2.8%) | 183 (4.5%) |
| 65 to 74 Years | 146 (34.9%) | 12 (1.5%) |
| 75 Years and over | 217 (36.8%) | 203 (19.4%) |
Disability Class: Vision Difficulty
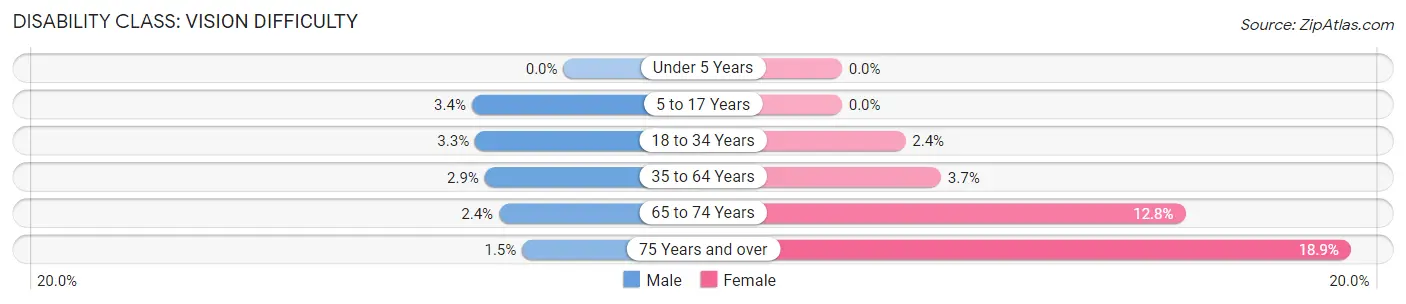
| Age Bracket | Male | Female |
| Under 5 Years | 0 (0.0%) | 0 (0.0%) |
| 5 to 17 Years | 86 (3.4%) | 0 (0.0%) |
| 18 to 34 Years | 111 (3.3%) | 81 (2.4%) |
| 35 to 64 Years | 118 (2.9%) | 149 (3.7%) |
| 65 to 74 Years | 10 (2.4%) | 101 (12.8%) |
| 75 Years and over | 9 (1.5%) | 198 (18.9%) |
Disability Class: Cognitive Difficulty
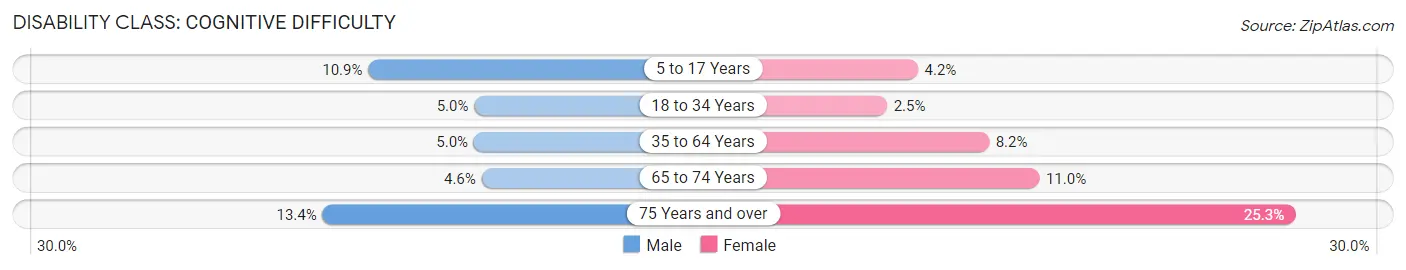
| Age Bracket | Male | Female |
| 5 to 17 Years | 275 (10.9%) | 124 (4.2%) |
| 18 to 34 Years | 168 (5.0%) | 86 (2.5%) |
| 35 to 64 Years | 201 (5.0%) | 331 (8.2%) |
| 65 to 74 Years | 19 (4.5%) | 87 (11.0%) |
| 75 Years and over | 79 (13.4%) | 265 (25.3%) |
Disability Class: Ambulatory Difficulty
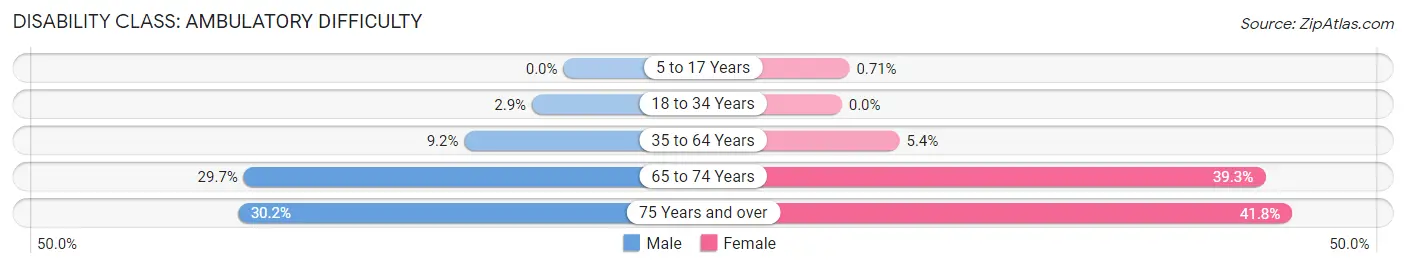
| Age Bracket | Male | Female |
| 5 to 17 Years | 0 (0.0%) | 21 (0.7%) |
| 18 to 34 Years | 99 (2.9%) | 0 (0.0%) |
| 35 to 64 Years | 371 (9.2%) | 217 (5.4%) |
| 65 to 74 Years | 124 (29.7%) | 311 (39.3%) |
| 75 Years and over | 178 (30.2%) | 438 (41.8%) |
Disability Class: Self-Care Difficulty
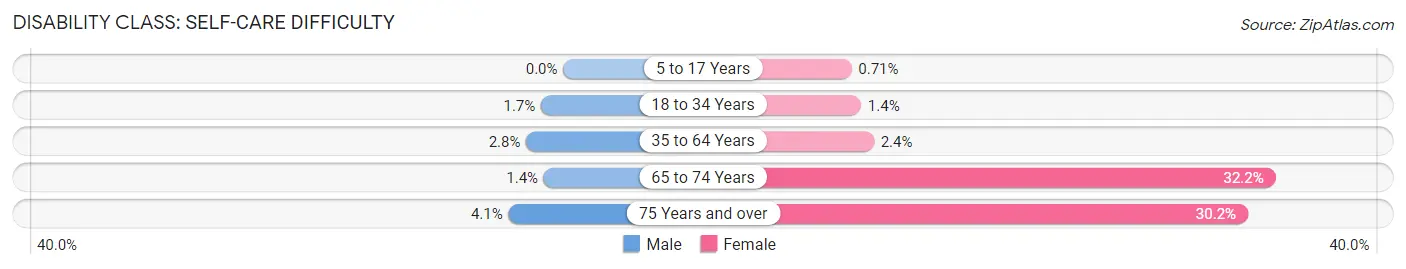
| Age Bracket | Male | Female |
| 5 to 17 Years | 0 (0.0%) | 21 (0.7%) |
| 18 to 34 Years | 56 (1.7%) | 49 (1.4%) |
| 35 to 64 Years | 111 (2.8%) | 96 (2.4%) |
| 65 to 74 Years | 6 (1.4%) | 255 (32.2%) |
| 75 Years and over | 24 (4.1%) | 316 (30.1%) |
Technology Access in Moses Lake
Computing Device Access in Moses Lake
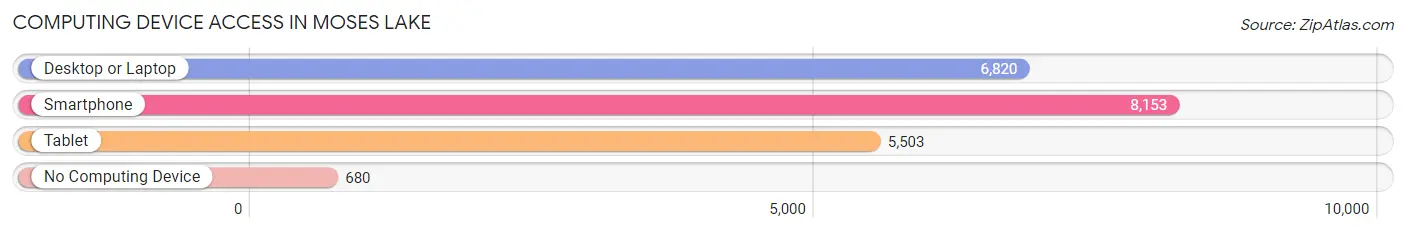
| Device Type | # Households | % Households |
| Desktop or Laptop | 6,820 | 74.0% |
| Smartphone | 8,153 | 88.4% |
| Tablet | 5,503 | 59.7% |
| No Computing Device | 680 | 7.4% |
| Total | 9,223 | 100.0% |
Internet Access in Moses Lake
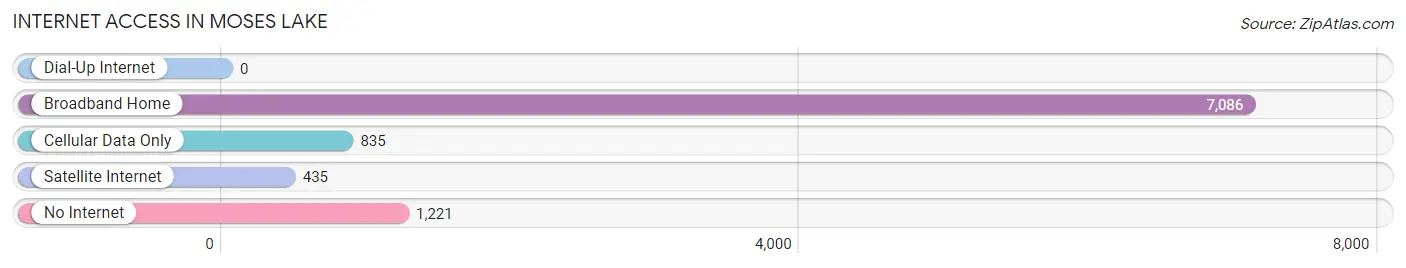
| Internet Type | # Households | % Households |
| Dial-Up Internet | 0 | 0.0% |
| Broadband Home | 7,086 | 76.8% |
| Cellular Data Only | 835 | 9.0% |
| Satellite Internet | 435 | 4.7% |
| No Internet | 1,221 | 13.2% |
| Total | 9,223 | 100.0% |
Moses Lake Summary
Moses Lake is a city located in Grant County, Washington, United States. The population was 20,366 at the 2010 census. It is the largest city in Grant County and the largest city in Central Washington. The city is named after the nearby Moses Lake, which was named in 1843 by the explorer and missionary Samuel Parker.
History
Moses Lake was originally inhabited by the Columbia-Moses band of the Yakama Nation. The first non-native settlers arrived in the area in the late 1800s, and the town was officially incorporated in 1910. The area was originally used for farming and ranching, and the town grew slowly until the 1940s, when the U.S. Army Corps of Engineers began construction of the Grand Coulee Dam. The dam created a large lake, which was named after the nearby Moses Lake.
The dam and lake provided irrigation water for the area, and the town began to grow rapidly. In the 1950s, the town was chosen as the site of Larson Air Force Base, which provided a major economic boost to the area. The base was closed in 1966, but the town continued to grow, and by the 2000 census, the population had reached 20,366.
Geography
Moses Lake is located in Grant County, Washington, at 47°10'N 119°17'W (47.17, -119.28). The city is situated on the eastern shore of Moses Lake, a large lake created by the Grand Coulee Dam. The city is located in the Columbia Basin, a large area of flat, arid land in Central Washington. The city is surrounded by agricultural land, and the nearby Cascade Mountains provide a scenic backdrop.
The city has a total area of 11.2 square miles, of which 10.9 square miles is land and 0.3 square miles is water.
Economy
Moses Lake is a major agricultural center, and the city's economy is heavily dependent on farming and ranching. The city is also home to several large industries, including a Boeing plant, a Tyson Foods plant, and a Nestle plant. The city is also home to several large retail stores, including Walmart, Home Depot, and Lowe's.
Demographics
As of the 2010 census, there were 20,366 people, 7,845 households, and 5,072 families residing in the city. The population density was 1,867.2 people per square mile. The racial makeup of the city was 77.2% White, 1.2% African American, 1.3% Native American, 1.7% Asian, 0.2% Pacific Islander, 15.3% from other races, and 3.3% from two or more races. Hispanic or Latino of any race were 24.2% of the population.
The median income for a household in the city was $41,945, and the median income for a family was $50,945. Males had a median income of $41,945 versus $30,945 for females. The per capita income for the city was $20,945. About 11.2% of families and 15.3% of the population were below the poverty line, including 22.2% of those under age 18 and 8.3% of those age 65 or over.
Common Questions
What is Per Capita Income in Moses Lake?
Per Capita income in Moses Lake is $30,269.
What is the Median Family Income in Moses Lake?
Median Family Income in Moses Lake is $74,959.
What is the Median Household income in Moses Lake?
Median Household Income in Moses Lake is $66,218.
What is Income or Wage Gap in Moses Lake?
Income or Wage Gap in Moses Lake is 33.4%.
Women in Moses Lake earn 66.6 cents for every dollar earned by a man.
What is Family Income Deficit in Moses Lake?
Family Income Deficit in Moses Lake is $12,068.
Families that are below poverty line in Moses Lake earn $12,068 less on average than the poverty threshold level.
What is Inequality or Gini Index in Moses Lake?
Inequality or Gini Index in Moses Lake is 0.41.
What is the Total Population of Moses Lake?
Total Population of Moses Lake is 25,155.
What is the Total Male Population of Moses Lake?
Total Male Population of Moses Lake is 11,977.
What is the Total Female Population of Moses Lake?
Total Female Population of Moses Lake is 13,178.
What is the Ratio of Males per 100 Females in Moses Lake?
There are 90.89 Males per 100 Females in Moses Lake.
What is the Ratio of Females per 100 Males in Moses Lake?
There are 110.03 Females per 100 Males in Moses Lake.
What is the Median Population Age in Moses Lake?
Median Population Age in Moses Lake is 31.1 Years.
What is the Average Family Size in Moses Lake
Average Family Size in Moses Lake is 3.5 People.
What is the Average Household Size in Moses Lake
Average Household Size in Moses Lake is 2.7 People.
How Large is the Labor Force in Moses Lake?
There are 12,307 People in the Labor Forcein in Moses Lake.
What is the Percentage of People in the Labor Force in Moses Lake?
64.4% of People are in the Labor Force in Moses Lake.
What is the Unemployment Rate in Moses Lake?
Unemployment Rate in Moses Lake is 5.1%.