Cities with the Lowest Poverty Level Among Children Under the Age of 5 in Oklahoma
RELATED REPORTS & OPTIONS
Lowest Poverty | Child 0-5
Oklahoma
Compare Cities
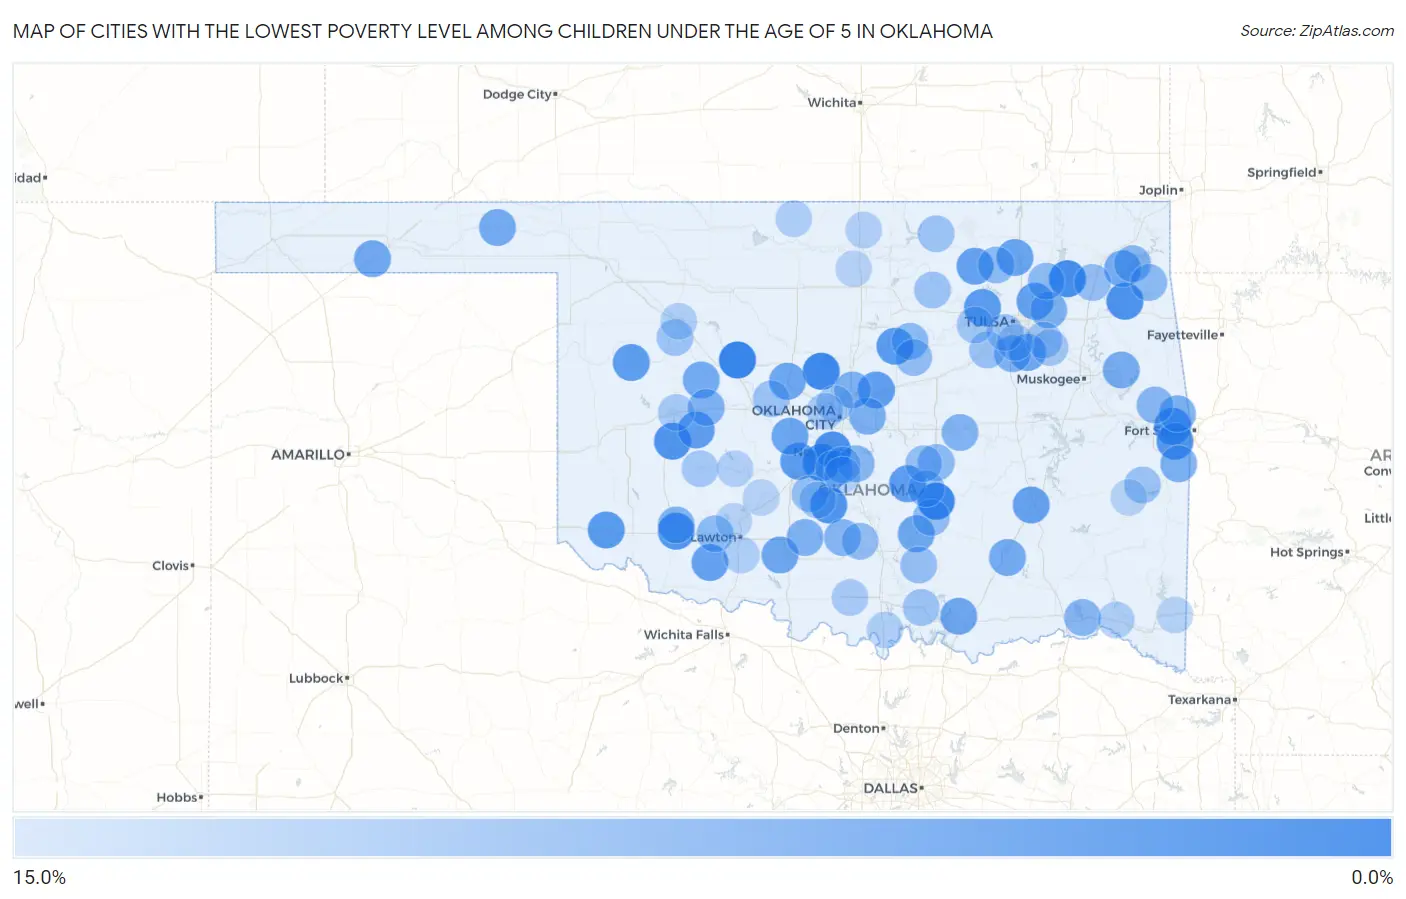
Map of Cities with the Lowest Poverty Level Among Children Under the Age of 5 in Oklahoma
15.0%
0.0%
Cities with the Lowest Poverty Level Among Children Under the Age of 5 in Oklahoma
| City | Child Poverty | vs State | vs National | |
| 1. | Watonga | 1.3% | 23.3%(-22.0)#1 | 18.1%(-16.7)#165 |
| 2. | Byng | 1.7% | 23.3%(-21.6)#2 | 18.1%(-16.3)#270 |
| 3. | Cashion | 2.0% | 23.3%(-21.4)#3 | 18.1%(-16.1)#332 |
| 4. | Bushyhead | 2.6% | 23.3%(-20.7)#4 | 18.1%(-15.5)#540 |
| 5. | Blanchard | 2.7% | 23.3%(-20.6)#5 | 18.1%(-15.3)#598 |
| 6. | Newcastle | 3.2% | 23.3%(-20.2)#6 | 18.1%(-14.9)#768 |
| 7. | Kenwood | 3.5% | 23.3%(-19.9)#7 | 18.1%(-14.6)#902 |
| 8. | New Cordell | 3.6% | 23.3%(-19.7)#8 | 18.1%(-14.4)#972 |
| 9. | Muldrow | 3.9% | 23.3%(-19.5)#9 | 18.1%(-14.2)#1,079 |
| 10. | Lindsay | 3.9% | 23.3%(-19.4)#10 | 18.1%(-14.1)#1,094 |
| 11. | Snyder | 4.2% | 23.3%(-19.2)#11 | 18.1%(-13.9)#1,192 |
| 12. | Fort Coffee | 4.3% | 23.3%(-19.1)#12 | 18.1%(-13.8)#1,239 |
| 13. | Prue | 4.8% | 23.3%(-18.6)#13 | 18.1%(-13.3)#1,458 |
| 14. | East Duke | 4.8% | 23.3%(-18.6)#14 | 18.1%(-13.3)#1,461 |
| 15. | Perkins | 4.8% | 23.3%(-18.5)#15 | 18.1%(-13.2)#1,493 |
| 16. | Asher | 5.0% | 23.3%(-18.3)#16 | 18.1%(-13.1)#1,569 |
| 17. | Amber | 5.0% | 23.3%(-18.3)#17 | 18.1%(-13.1)#1,573 |
| 18. | Leedey | 5.3% | 23.3%(-18.1)#18 | 18.1%(-12.8)#1,691 |
| 19. | Luther | 5.3% | 23.3%(-18.0)#19 | 18.1%(-12.7)#1,719 |
| 20. | Corn | 5.5% | 23.3%(-17.9)#20 | 18.1%(-12.6)#1,770 |
| 21. | Owasso | 5.9% | 23.3%(-17.5)#21 | 18.1%(-12.2)#1,927 |
| 22. | Wynona | 5.9% | 23.3%(-17.5)#22 | 18.1%(-12.2)#1,946 |
| 23. | Chattanooga | 6.0% | 23.3%(-17.4)#23 | 18.1%(-12.1)#1,977 |
| 24. | Savanna | 6.1% | 23.3%(-17.3)#24 | 18.1%(-12.0)#2,008 |
| 25. | Ochelata | 6.2% | 23.3%(-17.1)#25 | 18.1%(-11.8)#2,100 |
| 26. | Okarche | 6.7% | 23.3%(-16.7)#26 | 18.1%(-11.4)#2,253 |
| 27. | Moodys | 6.7% | 23.3%(-16.7)#27 | 18.1%(-11.4)#2,257 |
| 28. | Bixby | 6.7% | 23.3%(-16.7)#28 | 18.1%(-11.4)#2,278 |
| 29. | Minco | 6.8% | 23.3%(-16.6)#29 | 18.1%(-11.3)#2,308 |
| 30. | Silo | 6.9% | 23.3%(-16.4)#30 | 18.1%(-11.2)#2,377 |
| 31. | Empire City | 7.0% | 23.3%(-16.4)#31 | 18.1%(-11.1)#2,416 |
| 32. | Roff | 7.0% | 23.3%(-16.3)#32 | 18.1%(-11.0)#2,431 |
| 33. | Goodwell | 7.1% | 23.3%(-16.2)#33 | 18.1%(-10.9)#2,485 |
| 34. | Ketchum | 7.3% | 23.3%(-16.0)#34 | 18.1%(-10.7)#2,559 |
| 35. | Beaver | 7.5% | 23.3%(-15.8)#35 | 18.1%(-10.6)#2,634 |
| 36. | Thomas | 7.6% | 23.3%(-15.8)#36 | 18.1%(-10.5)#2,658 |
| 37. | Stringtown | 7.7% | 23.3%(-15.7)#37 | 18.1%(-10.4)#2,724 |
| 38. | Zeb | 7.8% | 23.3%(-15.5)#38 | 18.1%(-10.3)#2,772 |
| 39. | Choctaw | 8.3% | 23.3%(-15.1)#39 | 18.1%(-9.80)#2,925 |
| 40. | Long | 8.3% | 23.3%(-15.0)#40 | 18.1%(-9.73)#2,978 |
| 41. | Cameron | 8.3% | 23.3%(-15.0)#41 | 18.1%(-9.73)#2,982 |
| 42. | Edmond | 8.4% | 23.3%(-14.9)#42 | 18.1%(-9.63)#3,013 |
| 43. | Cole | 8.5% | 23.3%(-14.8)#43 | 18.1%(-9.55)#3,044 |
| 44. | Verdigris | 8.5% | 23.3%(-14.8)#44 | 18.1%(-9.53)#3,057 |
| 45. | Bray | 8.6% | 23.3%(-14.8)#45 | 18.1%(-9.49)#3,071 |
| 46. | Weatherford | 8.7% | 23.3%(-14.7)#46 | 18.1%(-9.38)#3,116 |
| 47. | Glenpool | 8.7% | 23.3%(-14.6)#47 | 18.1%(-9.32)#3,150 |
| 48. | Mountain Park | 9.1% | 23.3%(-14.3)#48 | 18.1%(-8.97)#3,301 |
| 49. | Foster | 9.1% | 23.3%(-14.3)#49 | 18.1%(-8.97)#3,308 |
| 50. | Cromwell | 9.1% | 23.3%(-14.3)#50 | 18.1%(-8.97)#3,310 |
| 51. | Noble | 9.3% | 23.3%(-14.0)#51 | 18.1%(-8.71)#3,408 |
| 52. | Cleora | 9.5% | 23.3%(-13.8)#52 | 18.1%(-8.54)#3,471 |
| 53. | Sawyer | 9.5% | 23.3%(-13.8)#53 | 18.1%(-8.54)#3,483 |
| 54. | Brushy | 9.6% | 23.3%(-13.7)#54 | 18.1%(-8.45)#3,513 |
| 55. | Cache | 9.9% | 23.3%(-13.5)#55 | 18.1%(-8.17)#3,606 |
| 56. | Barnsdall | 10.0% | 23.3%(-13.3)#56 | 18.1%(-8.06)#3,641 |
| 57. | Bowlegs | 10.0% | 23.3%(-13.3)#57 | 18.1%(-8.06)#3,665 |
| 58. | Ripley | 10.0% | 23.3%(-13.3)#58 | 18.1%(-8.06)#3,670 |
| 59. | Jay | 10.1% | 23.3%(-13.3)#59 | 18.1%(-8.01)#3,688 |
| 60. | Oologah | 10.1% | 23.3%(-13.3)#60 | 18.1%(-7.99)#3,693 |
| 61. | Latta | 10.5% | 23.3%(-12.8)#61 | 18.1%(-7.54)#3,864 |
| 62. | Katie | 10.5% | 23.3%(-12.8)#62 | 18.1%(-7.54)#3,882 |
| 63. | Agra | 10.7% | 23.3%(-12.6)#63 | 18.1%(-7.35)#3,943 |
| 64. | Goldsby | 10.7% | 23.3%(-12.6)#64 | 18.1%(-7.32)#3,956 |
| 65. | Adair | 10.8% | 23.3%(-12.5)#65 | 18.1%(-7.25)#3,977 |
| 66. | Konawa | 10.9% | 23.3%(-12.4)#66 | 18.1%(-7.13)#4,018 |
| 67. | Maud | 11.1% | 23.3%(-12.2)#67 | 18.1%(-6.95)#4,090 |
| 68. | Alex | 11.1% | 23.3%(-12.2)#68 | 18.1%(-6.95)#4,098 |
| 69. | Mill Creek | 11.1% | 23.3%(-12.2)#69 | 18.1%(-6.95)#4,125 |
| 70. | Kellyville | 11.5% | 23.3%(-11.8)#70 | 18.1%(-6.52)#4,276 |
| 71. | Fanshawe | 11.5% | 23.3%(-11.8)#71 | 18.1%(-6.52)#4,283 |
| 72. | Calumet | 11.7% | 23.3%(-11.7)#72 | 18.1%(-6.37)#4,334 |
| 73. | Oakland | 11.8% | 23.3%(-11.6)#73 | 18.1%(-6.30)#4,358 |
| 74. | Shidler | 11.8% | 23.3%(-11.6)#74 | 18.1%(-6.30)#4,372 |
| 75. | Taloga | 11.8% | 23.3%(-11.6)#75 | 18.1%(-6.30)#4,375 |
| 76. | Skedee | 11.8% | 23.3%(-11.6)#76 | 18.1%(-6.30)#4,379 |
| 77. | Oakhurst | 12.0% | 23.3%(-11.4)#77 | 18.1%(-6.11)#4,430 |
| 78. | Broken Arrow | 12.0% | 23.3%(-11.3)#78 | 18.1%(-6.06)#4,445 |
| 79. | The Village | 12.2% | 23.3%(-11.1)#79 | 18.1%(-5.86)#4,524 |
| 80. | Coweta | 12.3% | 23.3%(-11.1)#80 | 18.1%(-5.81)#4,538 |
| 81. | Mannford | 12.3% | 23.3%(-11.1)#81 | 18.1%(-5.77)#4,550 |
| 82. | Mountain View | 12.5% | 23.3%(-10.8)#82 | 18.1%(-5.56)#4,627 |
| 83. | Bradley | 12.5% | 23.3%(-10.8)#83 | 18.1%(-5.56)#4,667 |
| 84. | Clinton | 12.7% | 23.3%(-10.6)#84 | 18.1%(-5.34)#4,723 |
| 85. | Wilson | 13.0% | 23.3%(-10.3)#85 | 18.1%(-5.02)#4,844 |
| 86. | Bethany | 13.1% | 23.3%(-10.3)#86 | 18.1%(-5.00)#4,861 |
| 87. | Valliant | 13.3% | 23.3%(-10.0)#87 | 18.1%(-4.73)#4,957 |
| 88. | Wakita | 13.3% | 23.3%(-10.0)#88 | 18.1%(-4.73)#4,971 |
| 89. | Seiling | 13.6% | 23.3%(-9.71)#89 | 18.1%(-4.43)#5,066 |
| 90. | Geronimo | 13.7% | 23.3%(-9.62)#90 | 18.1%(-4.34)#5,107 |
| 91. | Marietta | 13.7% | 23.3%(-9.61)#91 | 18.1%(-4.32)#5,112 |
| 92. | Jenks | 13.8% | 23.3%(-9.57)#92 | 18.1%(-4.29)#5,124 |
| 93. | Washington | 13.9% | 23.3%(-9.46)#93 | 18.1%(-4.17)#5,168 |
| 94. | Fort Cobb | 13.9% | 23.3%(-9.46)#94 | 18.1%(-4.17)#5,170 |
| 95. | Blackwell | 14.0% | 23.3%(-9.39)#95 | 18.1%(-4.11)#5,195 |
| 96. | Cyril | 14.3% | 23.3%(-9.06)#96 | 18.1%(-3.78)#5,323 |
| 97. | Billings | 14.3% | 23.3%(-9.06)#97 | 18.1%(-3.78)#5,337 |
| 98. | Eagletown | 14.3% | 23.3%(-9.06)#98 | 18.1%(-3.78)#5,341 |
| 99. | Medicine Park | 14.3% | 23.3%(-9.06)#99 | 18.1%(-3.78)#5,351 |
| 100. | Le Flore | 14.3% | 23.3%(-9.06)#100 | 18.1%(-3.78)#5,365 |
Common Questions
What are the Top 10 Cities with the Lowest Poverty Level Among Children Under the Age of 5 in Oklahoma?
Top 10 Cities with the Lowest Poverty Level Among Children Under the Age of 5 in Oklahoma are:
What city has the Lowest Poverty Level Among Children Under the Age of 5 in Oklahoma?
Watonga has the Lowest Poverty Level Among Children Under the Age of 5 in Oklahoma with 1.3%.
What is the Poverty Level Among Children Under the Age of 5 in the State of Oklahoma?
Poverty Level Among Children Under the Age of 5 in Oklahoma is 23.3%.
What is the Poverty Level Among Children Under the Age of 5 in the United States?
Poverty Level Among Children Under the Age of 5 in the United States is 18.1%.