Battle Ground, WA Map & Demographics
Battle Ground Map
Battle Ground Overview
$37,287
PER CAPITA INCOME
$97,199
AVG FAMILY INCOME
$94,360
AVG HOUSEHOLD INCOME
33.2%
WAGE / INCOME GAP [ % ]
66.8¢/ $1
WAGE / INCOME GAP [ $ ]
0.36
INEQUALITY / GINI INDEX
20,888
TOTAL POPULATION
10,361
MALE POPULATION
10,527
FEMALE POPULATION
98.42
MALES / 100 FEMALES
101.60
FEMALES / 100 MALES
33.8
MEDIAN AGE
3.4
AVG FAMILY SIZE
3.0
AVG HOUSEHOLD SIZE
10,379
LABOR FORCE [ PEOPLE ]
64.6%
PERCENT IN LABOR FORCE
4.3%
UNEMPLOYMENT RATE
Battle Ground Zip Codes
Battle Ground Area Codes
Income in Battle Ground
Income Overview in Battle Ground
Per Capita Income in Battle Ground is $37,287, while median incomes of families and households are $97,199 and $94,360 respectively.
| Characteristic | Number | Measure |
| Per Capita Income | 20,888 | $37,287 |
| Median Family Income | 5,244 | $97,199 |
| Mean Family Income | 5,244 | $113,641 |
| Median Household Income | 7,041 | $94,360 |
| Mean Household Income | 7,041 | $107,755 |
| Income Deficit | 5,244 | $0 |
| Wage / Income Gap (%) | 20,888 | 33.20% |
| Wage / Income Gap ($) | 20,888 | 66.80¢ per $1 |
| Gini / Inequality Index | 20,888 | 0.36 |
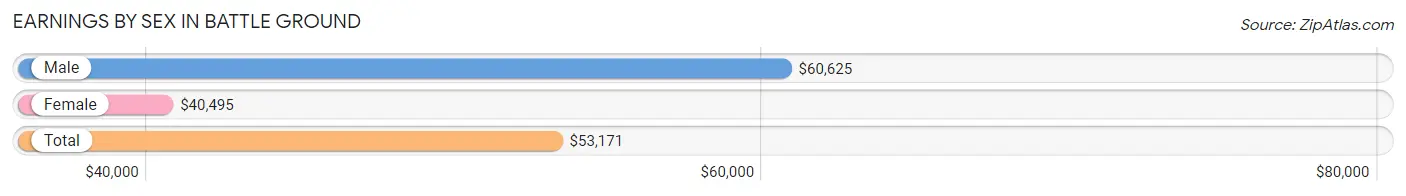
Earnings by Sex in Battle Ground
Average Earnings in Battle Ground are $53,171, $60,625 for men and $40,495 for women, a difference of 33.2%.
| Sex | Number | Average Earnings |
| Male | 5,962 (55.6%) | $60,625 |
| Female | 4,751 (44.4%) | $40,495 |
| Total | 10,713 (100.0%) | $53,171 |
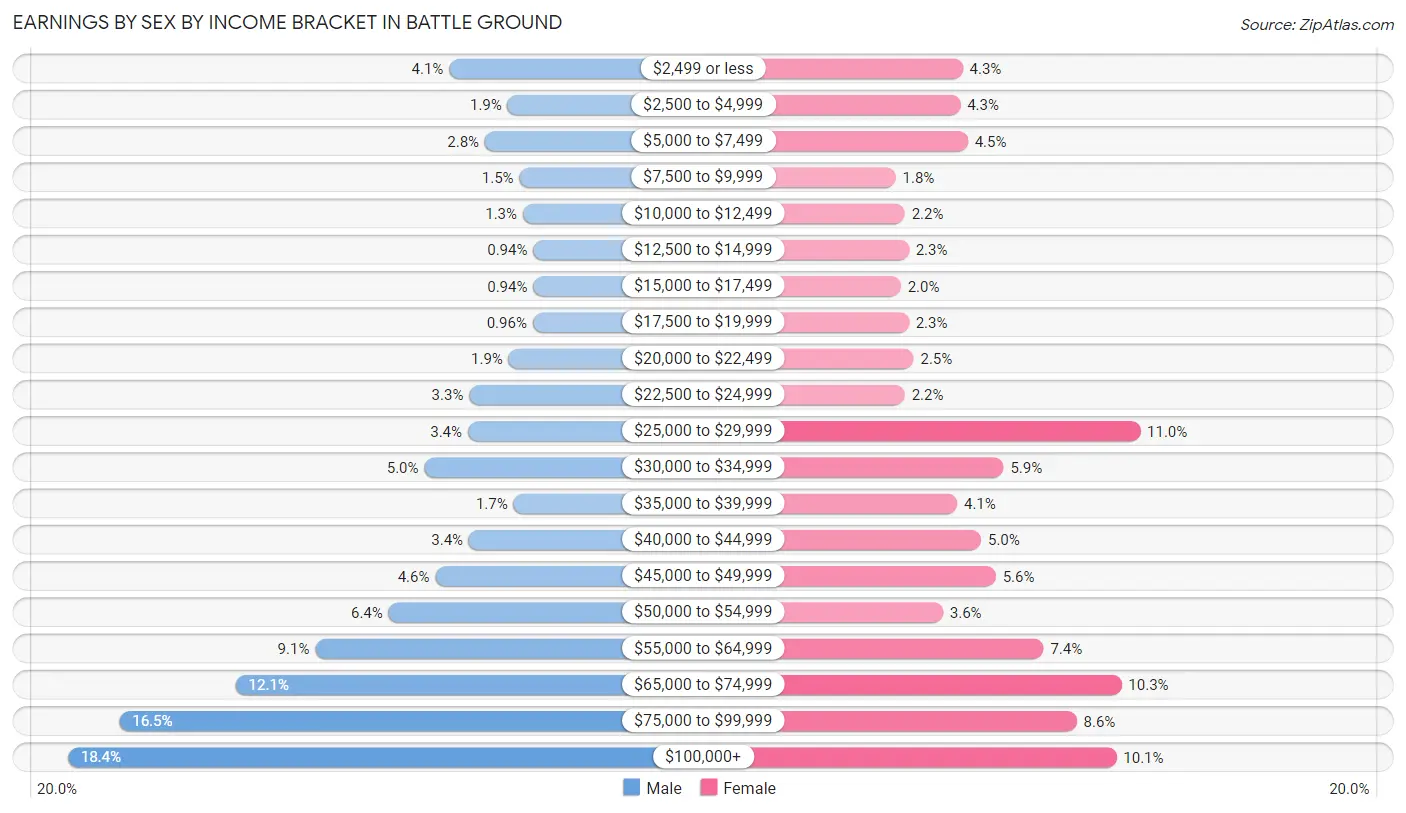
Earnings by Sex by Income Bracket in Battle Ground
The most common earnings brackets in Battle Ground are $100,000+ for men (1,096 | 18.4%) and $25,000 to $29,999 for women (522 | 11.0%).
| Income | Male | Female |
| $2,499 or less | 244 (4.1%) | 206 (4.3%) |
| $2,500 to $4,999 | 113 (1.9%) | 202 (4.3%) |
| $5,000 to $7,499 | 164 (2.8%) | 215 (4.5%) |
| $7,500 to $9,999 | 87 (1.5%) | 87 (1.8%) |
| $10,000 to $12,499 | 79 (1.3%) | 103 (2.2%) |
| $12,500 to $14,999 | 56 (0.9%) | 110 (2.3%) |
| $15,000 to $17,499 | 56 (0.9%) | 96 (2.0%) |
| $17,500 to $19,999 | 57 (1.0%) | 110 (2.3%) |
| $20,000 to $22,499 | 111 (1.9%) | 119 (2.5%) |
| $22,500 to $24,999 | 199 (3.3%) | 103 (2.2%) |
| $25,000 to $29,999 | 202 (3.4%) | 522 (11.0%) |
| $30,000 to $34,999 | 299 (5.0%) | 279 (5.9%) |
| $35,000 to $39,999 | 100 (1.7%) | 196 (4.1%) |
| $40,000 to $44,999 | 200 (3.4%) | 239 (5.0%) |
| $45,000 to $49,999 | 275 (4.6%) | 265 (5.6%) |
| $50,000 to $54,999 | 379 (6.4%) | 171 (3.6%) |
| $55,000 to $64,999 | 543 (9.1%) | 350 (7.4%) |
| $65,000 to $74,999 | 721 (12.1%) | 489 (10.3%) |
| $75,000 to $99,999 | 981 (16.5%) | 409 (8.6%) |
| $100,000+ | 1,096 (18.4%) | 480 (10.1%) |
| Total | 5,962 (100.0%) | 4,751 (100.0%) |
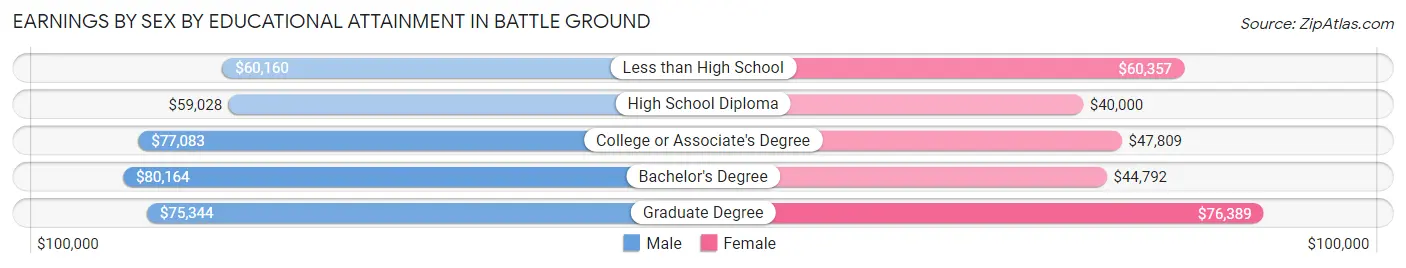
Earnings by Sex by Educational Attainment in Battle Ground
Average earnings in Battle Ground are $69,817 for men and $47,422 for women, a difference of 32.1%. Men with an educational attainment of bachelor's degree enjoy the highest average annual earnings of $80,164, while those with high school diploma education earn the least with $59,028. Women with an educational attainment of graduate degree earn the most with the average annual earnings of $76,389, while those with high school diploma education have the smallest earnings of $40,000.
| Educational Attainment | Male Income | Female Income |
| Less than High School | $60,160 | $60,357 |
| High School Diploma | $59,028 | $40,000 |
| College or Associate's Degree | $77,083 | $47,809 |
| Bachelor's Degree | $80,164 | $44,792 |
| Graduate Degree | $75,344 | $76,389 |
| Total | $69,817 | $47,422 |
Family Income in Battle Ground
Family Income Brackets in Battle Ground
According to the Battle Ground family income data, there are 1,269 families falling into the $100,000 to $149,999 income range, which is the most common income bracket and makes up 24.2% of all families. Conversely, the $10,000 to $14,999 income bracket is the least frequent group with only 42 families (0.8%) belonging to this category.
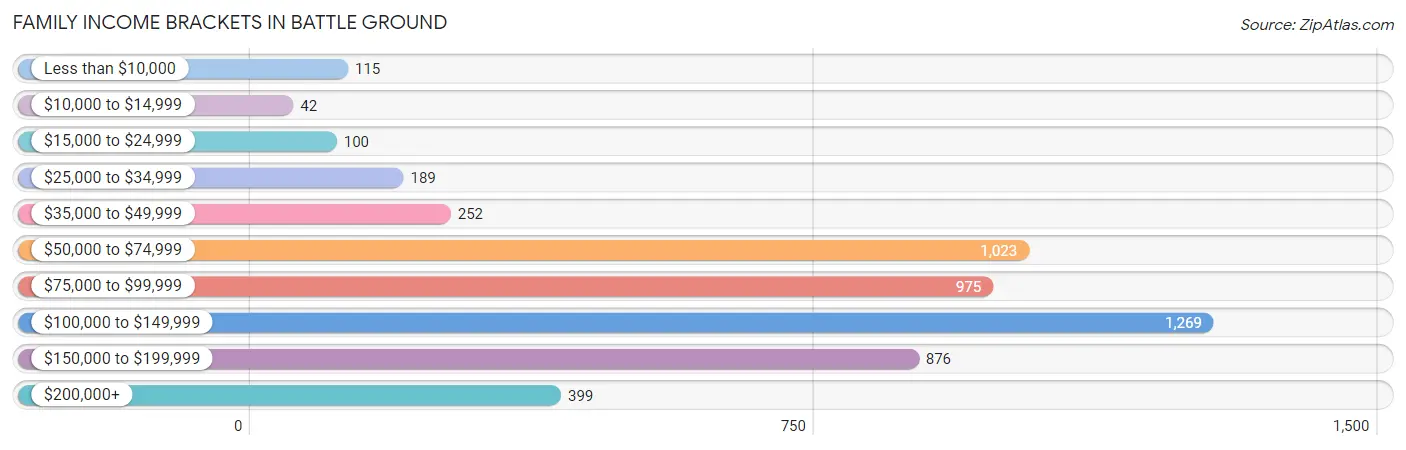
| Income Bracket | # Families | % Families |
| Less than $10,000 | 115 | 2.2% |
| $10,000 to $14,999 | 42 | 0.8% |
| $15,000 to $24,999 | 100 | 1.9% |
| $25,000 to $34,999 | 189 | 3.6% |
| $35,000 to $49,999 | 252 | 4.8% |
| $50,000 to $74,999 | 1,023 | 19.5% |
| $75,000 to $99,999 | 975 | 18.6% |
| $100,000 to $149,999 | 1,269 | 24.2% |
| $150,000 to $199,999 | 876 | 16.7% |
| $200,000+ | 399 | 7.6% |
Family Income by Famaliy Size in Battle Ground
7+ person families (311 | 5.9%) account for the highest median family income in Battle Ground with $135,885 per family, while 2-person families (2,215 | 42.2%) have the highest median income of $43,341 per family member.
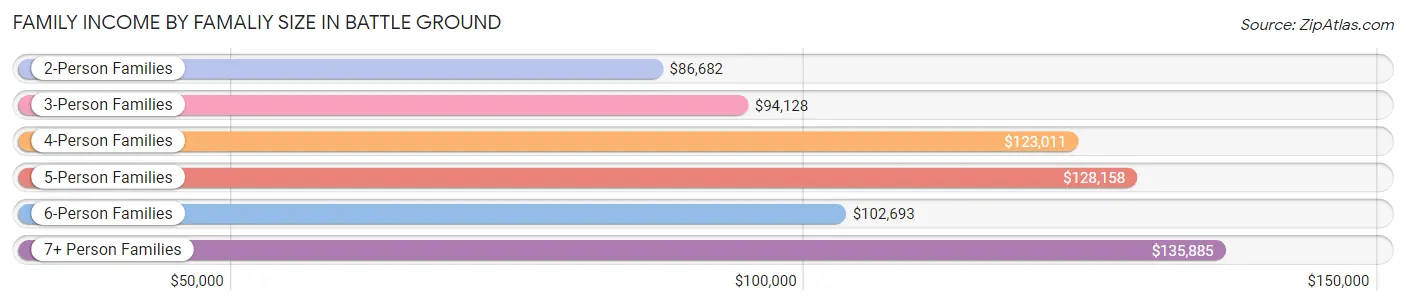
| Income Bracket | # Families | Median Income |
| 2-Person Families | 2,215 (42.2%) | $86,682 |
| 3-Person Families | 994 (19.0%) | $94,128 |
| 4-Person Families | 1,055 (20.1%) | $123,011 |
| 5-Person Families | 420 (8.0%) | $128,158 |
| 6-Person Families | 249 (4.8%) | $102,693 |
| 7+ Person Families | 311 (5.9%) | $135,885 |
| Total | 5,244 (100.0%) | $97,199 |
Family Income by Number of Earners in Battle Ground
The median family income in Battle Ground is $97,199, with families comprising 3+ earners (582) having the highest median family income of $162,917, while families with no earners (586) have the lowest median family income of $60,924, accounting for 11.1% and 11.2% of families, respectively.
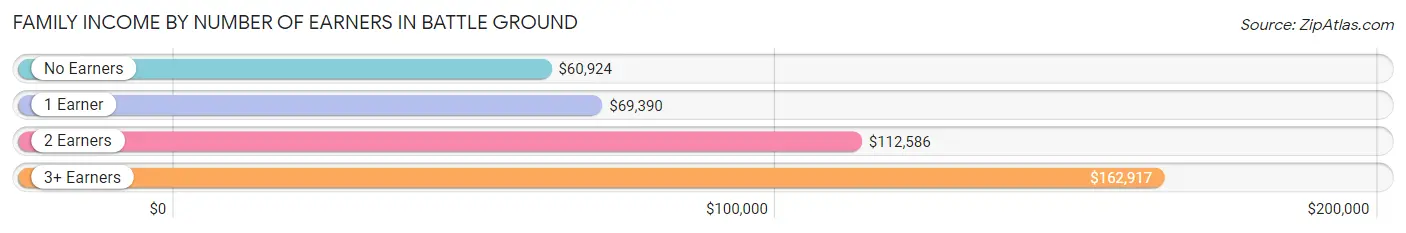
| Number of Earners | # Families | Median Income |
| No Earners | 586 (11.2%) | $60,924 |
| 1 Earner | 1,706 (32.5%) | $69,390 |
| 2 Earners | 2,370 (45.2%) | $112,586 |
| 3+ Earners | 582 (11.1%) | $162,917 |
| Total | 5,244 (100.0%) | $97,199 |
Household Income in Battle Ground
Household Income Brackets in Battle Ground
With 1,648 households falling in the category, the $100,000 to $149,999 income range is the most frequent in Battle Ground, accounting for 23.4% of all households. In contrast, only 141 households (2.0%) fall into the less than $10,000 income bracket, making it the least populous group.
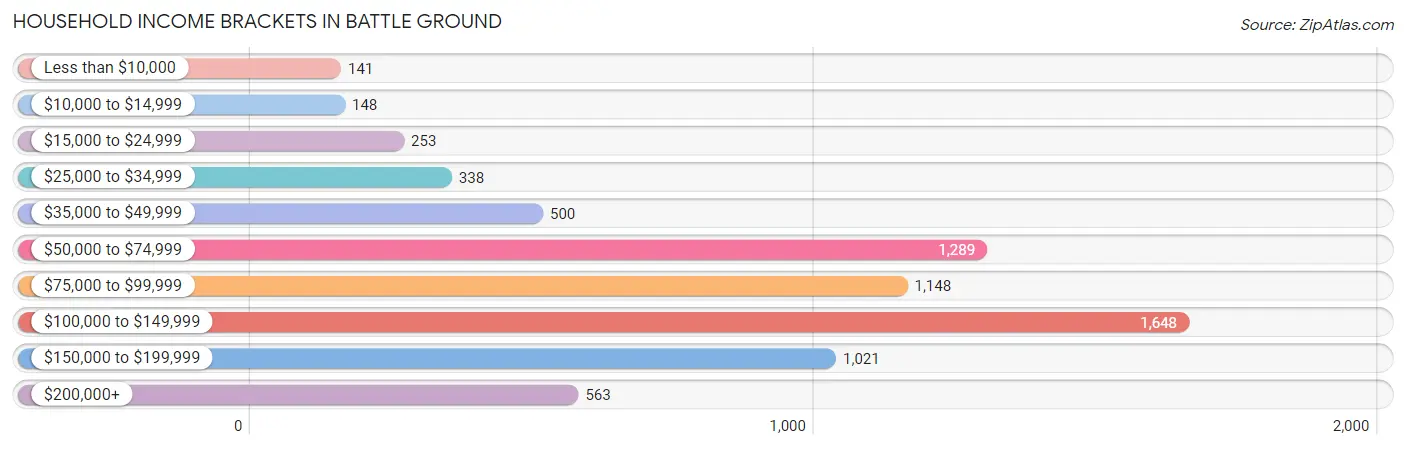
| Income Bracket | # Households | % Households |
| Less than $10,000 | 141 | 2.0% |
| $10,000 to $14,999 | 148 | 2.1% |
| $15,000 to $24,999 | 253 | 3.6% |
| $25,000 to $34,999 | 338 | 4.8% |
| $35,000 to $49,999 | 500 | 7.1% |
| $50,000 to $74,999 | 1,289 | 18.3% |
| $75,000 to $99,999 | 1,148 | 16.3% |
| $100,000 to $149,999 | 1,648 | 23.4% |
| $150,000 to $199,999 | 1,021 | 14.5% |
| $200,000+ | 563 | 8.0% |
Household Income by Householder Age in Battle Ground
The median household income in Battle Ground is $94,360, with the highest median household income of $112,861 found in the 25 to 44 years age bracket for the primary householder. A total of 2,699 households (38.3%) fall into this category. Meanwhile, the 65+ years age bracket for the primary householder has the lowest median household income of $59,695, with 1,572 households (22.3%) in this group.
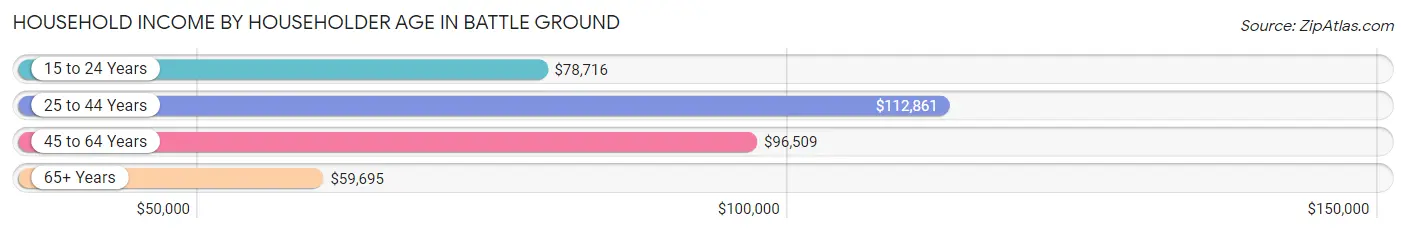
| Income Bracket | # Households | Median Income |
| 15 to 24 Years | 360 (5.1%) | $78,716 |
| 25 to 44 Years | 2,699 (38.3%) | $112,861 |
| 45 to 64 Years | 2,410 (34.2%) | $96,509 |
| 65+ Years | 1,572 (22.3%) | $59,695 |
| Total | 7,041 (100.0%) | $94,360 |
Poverty in Battle Ground
Income Below Poverty by Sex and Age in Battle Ground
With 6.4% poverty level for males and 6.5% for females among the residents of Battle Ground, 5 year old males and 18 to 24 year old females are the most vulnerable to poverty, with 28 males (57.1%) and 138 females (14.6%) in their respective age groups living below the poverty level.
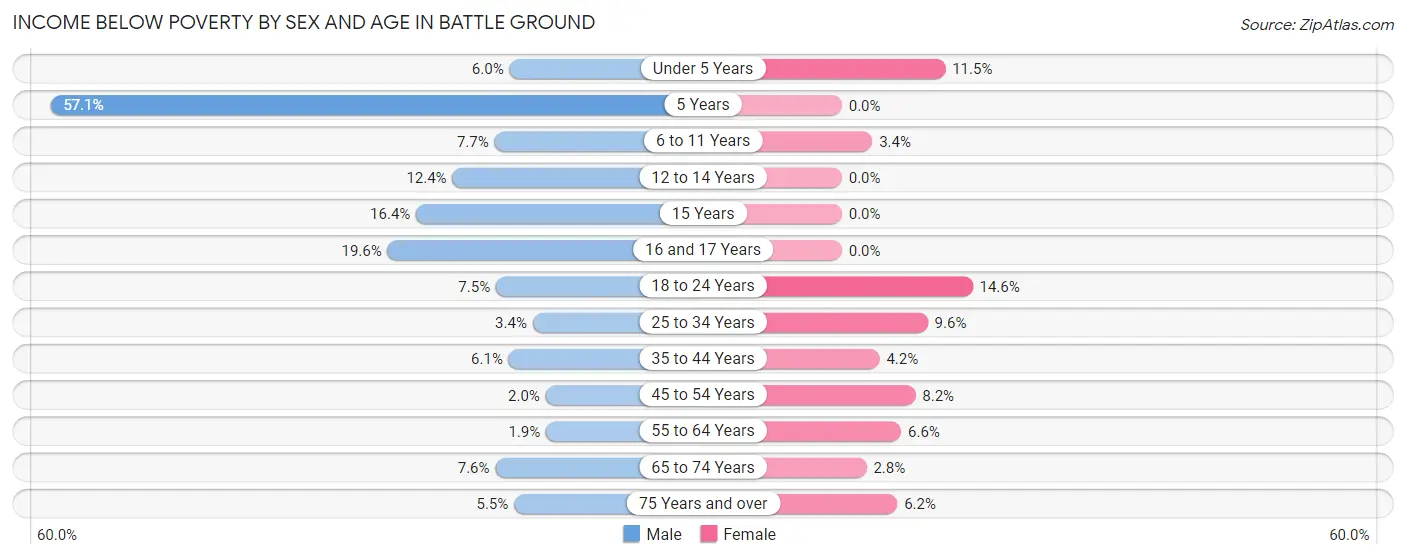
| Age Bracket | Male | Female |
| Under 5 Years | 49 (6.0%) | 82 (11.5%) |
| 5 Years | 28 (57.1%) | 0 (0.0%) |
| 6 to 11 Years | 67 (7.7%) | 37 (3.4%) |
| 12 to 14 Years | 41 (12.3%) | 0 (0.0%) |
| 15 Years | 30 (16.4%) | 0 (0.0%) |
| 16 and 17 Years | 75 (19.6%) | 0 (0.0%) |
| 18 to 24 Years | 108 (7.5%) | 138 (14.6%) |
| 25 to 34 Years | 46 (3.4%) | 134 (9.6%) |
| 35 to 44 Years | 95 (6.1%) | 72 (4.2%) |
| 45 to 54 Years | 23 (2.0%) | 93 (8.2%) |
| 55 to 64 Years | 20 (1.9%) | 64 (6.6%) |
| 65 to 74 Years | 54 (7.6%) | 24 (2.8%) |
| 75 Years and over | 23 (5.5%) | 33 (6.2%) |
| Total | 659 (6.4%) | 677 (6.5%) |
Income Above Poverty by Sex and Age in Battle Ground
According to the poverty statistics in Battle Ground, males aged 55 to 64 years and females aged 5 years are the age groups that are most secure financially, with 98.1% of males and 100.0% of females in these age groups living above the poverty line.
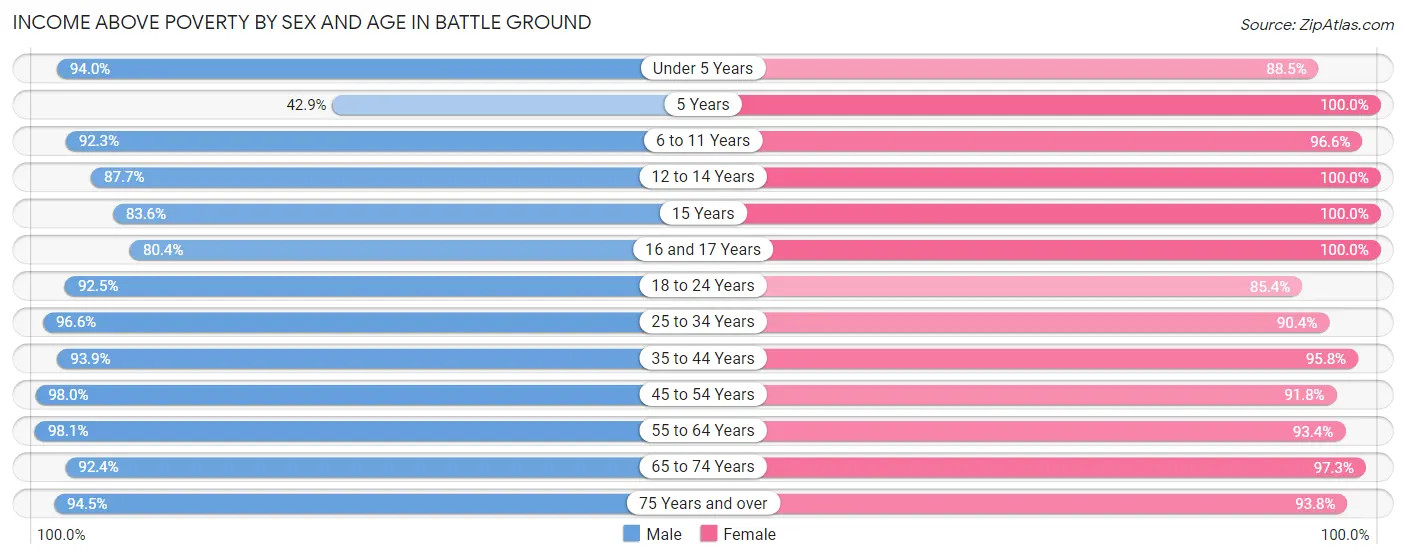
| Age Bracket | Male | Female |
| Under 5 Years | 768 (94.0%) | 630 (88.5%) |
| 5 Years | 21 (42.9%) | 106 (100.0%) |
| 6 to 11 Years | 808 (92.3%) | 1,056 (96.6%) |
| 12 to 14 Years | 291 (87.6%) | 322 (100.0%) |
| 15 Years | 153 (83.6%) | 292 (100.0%) |
| 16 and 17 Years | 308 (80.4%) | 343 (100.0%) |
| 18 to 24 Years | 1,332 (92.5%) | 810 (85.4%) |
| 25 to 34 Years | 1,304 (96.6%) | 1,268 (90.4%) |
| 35 to 44 Years | 1,467 (93.9%) | 1,642 (95.8%) |
| 45 to 54 Years | 1,143 (98.0%) | 1,043 (91.8%) |
| 55 to 64 Years | 1,014 (98.1%) | 905 (93.4%) |
| 65 to 74 Years | 659 (92.4%) | 850 (97.3%) |
| 75 Years and over | 397 (94.5%) | 502 (93.8%) |
| Total | 9,665 (93.6%) | 9,769 (93.5%) |
Income Below Poverty Among Married-Couple Families in Battle Ground
The poverty statistics for married-couple families in Battle Ground show that 3.9% or 162 of the total 4,155 families live below the poverty line. Families with 3 or 4 children have the highest poverty rate of 7.0%, comprising of 43 families. On the other hand, families with 5 or more children have the lowest poverty rate of 0.0%, which includes 0 families.
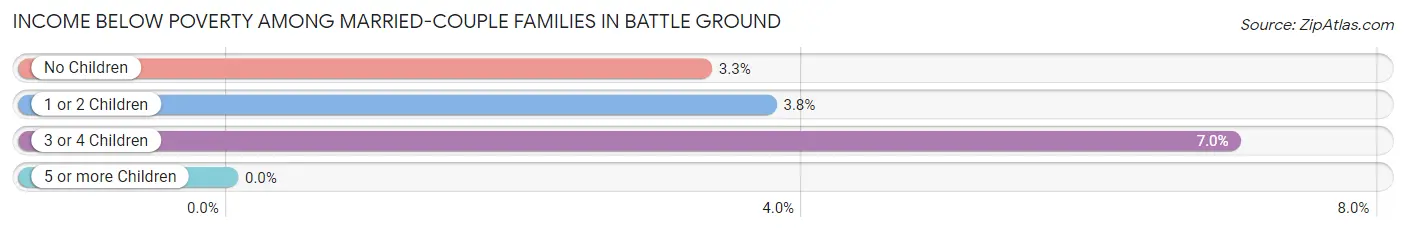
| Children | Above Poverty | Below Poverty |
| No Children | 2,023 (96.7%) | 69 (3.3%) |
| 1 or 2 Children | 1,284 (96.3%) | 50 (3.7%) |
| 3 or 4 Children | 573 (93.0%) | 43 (7.0%) |
| 5 or more Children | 113 (100.0%) | 0 (0.0%) |
| Total | 3,993 (96.1%) | 162 (3.9%) |
Income Below Poverty Among Single-Parent Households in Battle Ground
According to the poverty data in Battle Ground, 3.7% or 10 single-father households and 8.1% or 66 single-mother households are living below the poverty line. Among single-father households, those with 1 or 2 children have the highest poverty rate, with 10 households (11.5%) experiencing poverty. Likewise, among single-mother households, those with 1 or 2 children have the highest poverty rate, with 66 households (14.5%) falling below the poverty line.
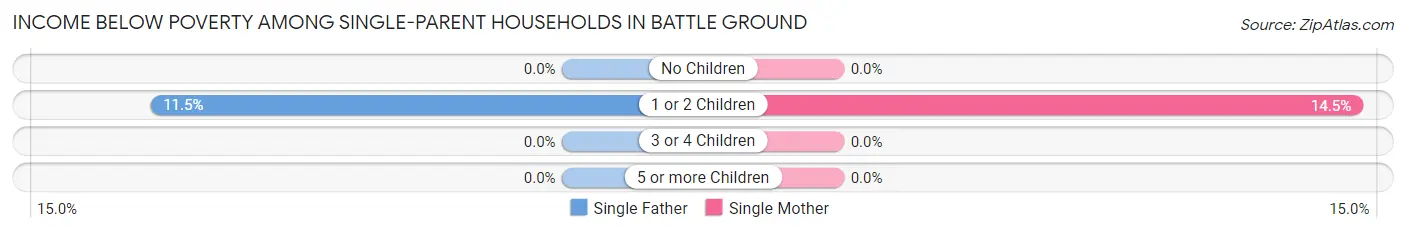
| Children | Single Father | Single Mother |
| No Children | 0 (0.0%) | 0 (0.0%) |
| 1 or 2 Children | 10 (11.5%) | 66 (14.5%) |
| 3 or 4 Children | 0 (0.0%) | 0 (0.0%) |
| 5 or more Children | 0 (0.0%) | 0 (0.0%) |
| Total | 10 (3.7%) | 66 (8.1%) |
Income Below Poverty Among Married-Couple vs Single-Parent Households in Battle Ground
The poverty data for Battle Ground shows that 162 of the married-couple family households (3.9%) and 76 of the single-parent households (7.0%) are living below the poverty level. Within the married-couple family households, those with 3 or 4 children have the highest poverty rate, with 43 households (7.0%) falling below the poverty line. Among the single-parent households, those with 1 or 2 children have the highest poverty rate, with 76 household (14.0%) living below poverty.
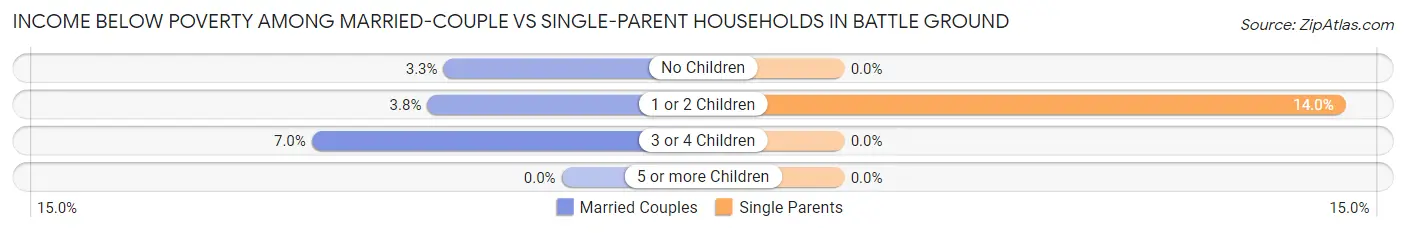
| Children | Married-Couple Families | Single-Parent Households |
| No Children | 69 (3.3%) | 0 (0.0%) |
| 1 or 2 Children | 50 (3.7%) | 76 (14.0%) |
| 3 or 4 Children | 43 (7.0%) | 0 (0.0%) |
| 5 or more Children | 0 (0.0%) | 0 (0.0%) |
| Total | 162 (3.9%) | 76 (7.0%) |
Race in Battle Ground
The most populous races in Battle Ground are White / Caucasian (18,912 | 90.5%), Two or more Races (1,571 | 7.5%), and Hispanic or Latino (1,510 | 7.2%).
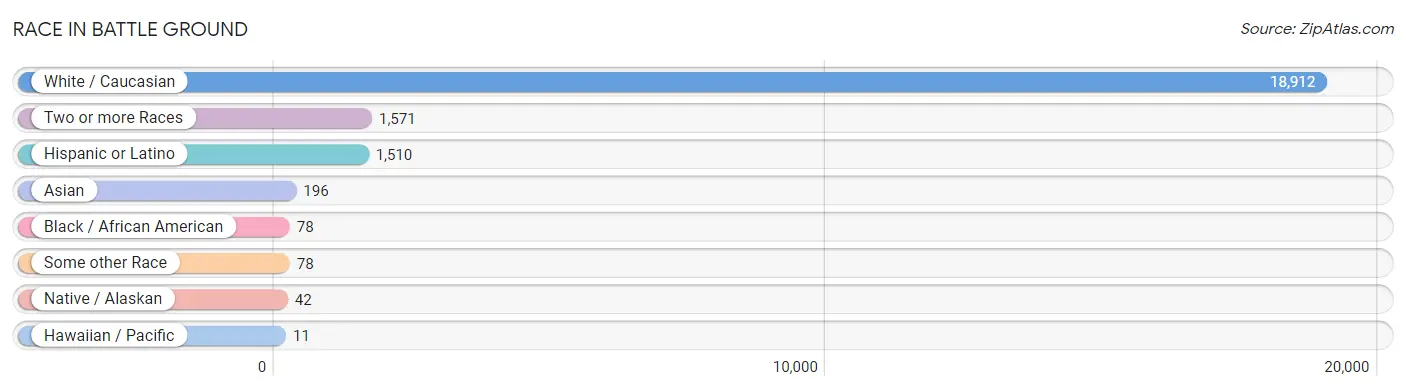
| Race | # Population | % Population |
| Asian | 196 | 0.9% |
| Black / African American | 78 | 0.4% |
| Hawaiian / Pacific | 11 | 0.1% |
| Hispanic or Latino | 1,510 | 7.2% |
| Native / Alaskan | 42 | 0.2% |
| White / Caucasian | 18,912 | 90.5% |
| Two or more Races | 1,571 | 7.5% |
| Some other Race | 78 | 0.4% |
| Total | 20,888 | 100.0% |
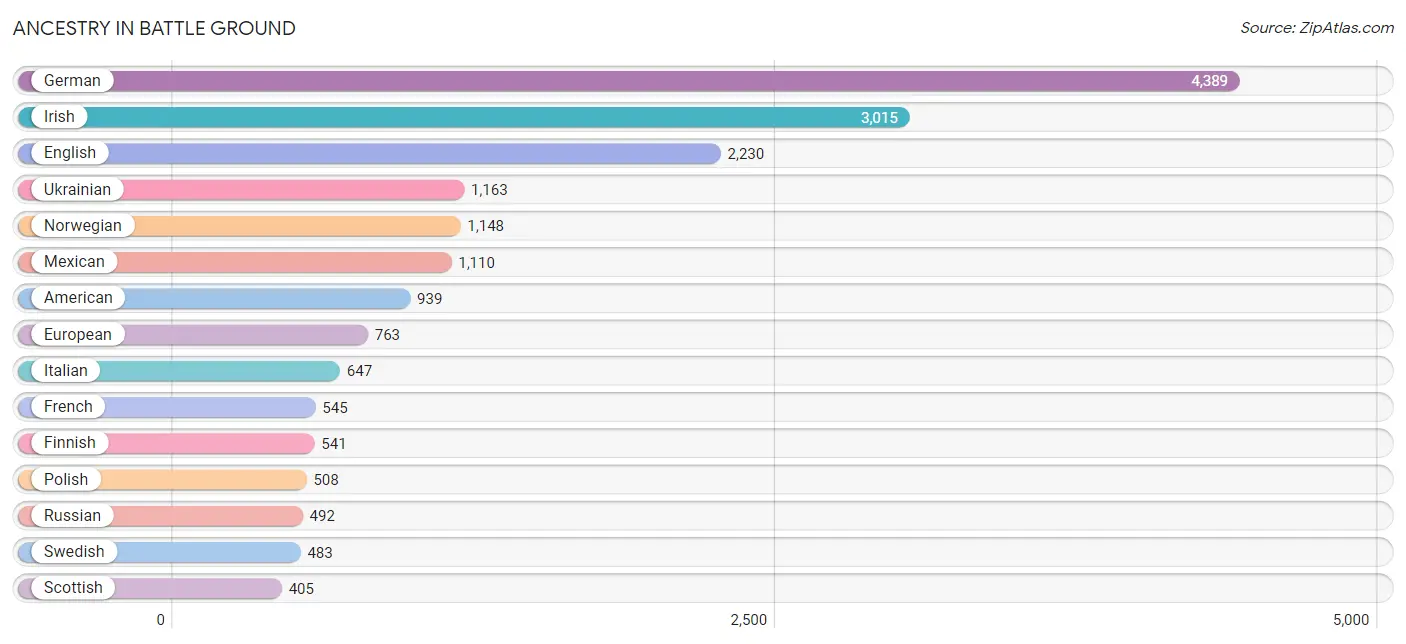
Ancestry in Battle Ground
The most populous ancestries reported in Battle Ground are German (4,389 | 21.0%), Irish (3,015 | 14.4%), English (2,230 | 10.7%), Ukrainian (1,163 | 5.6%), and Norwegian (1,148 | 5.5%), together accounting for 57.2% of all Battle Ground residents.
| Ancestry | # Population | % Population |
| African | 20 | 0.1% |
| Aleut | 9 | 0.0% |
| American | 939 | 4.5% |
| Arab | 15 | 0.1% |
| Armenian | 13 | 0.1% |
| Austrian | 30 | 0.1% |
| Basque | 14 | 0.1% |
| Bhutanese | 92 | 0.4% |
| Brazilian | 14 | 0.1% |
| British | 222 | 1.1% |
| Canadian | 8 | 0.0% |
| Celtic | 8 | 0.0% |
| Central American | 109 | 0.5% |
| Central American Indian | 10 | 0.1% |
| Cherokee | 59 | 0.3% |
| Chippewa | 27 | 0.1% |
| Choctaw | 12 | 0.1% |
| Colombian | 30 | 0.1% |
| Costa Rican | 10 | 0.1% |
| Croatian | 12 | 0.1% |
| Czech | 46 | 0.2% |
| Czechoslovakian | 8 | 0.0% |
| Danish | 156 | 0.7% |
| Dominican | 2 | 0.0% |
| Dutch | 248 | 1.2% |
| Eastern European | 60 | 0.3% |
| English | 2,230 | 10.7% |
| European | 763 | 3.6% |
| Filipino | 5 | 0.0% |
| Finnish | 541 | 2.6% |
| French | 545 | 2.6% |
| French Canadian | 100 | 0.5% |
| German | 4,389 | 21.0% |
| Greek | 16 | 0.1% |
| Guatemalan | 38 | 0.2% |
| Hopi | 22 | 0.1% |
| Hungarian | 28 | 0.1% |
| Indian (Asian) | 16 | 0.1% |
| Irish | 3,015 | 14.4% |
| Iroquois | 9 | 0.0% |
| Italian | 647 | 3.1% |
| Jamaican | 2 | 0.0% |
| Japanese | 22 | 0.1% |
| Korean | 368 | 1.8% |
| Laotian | 10 | 0.1% |
| Lebanese | 15 | 0.1% |
| Lithuanian | 21 | 0.1% |
| Malaysian | 16 | 0.1% |
| Mexican | 1,110 | 5.3% |
| Native Hawaiian | 20 | 0.1% |
| Navajo | 7 | 0.0% |
| Northern European | 27 | 0.1% |
| Norwegian | 1,148 | 5.5% |
| Pakistani | 16 | 0.1% |
| Panamanian | 10 | 0.1% |
| Peruvian | 19 | 0.1% |
| Polish | 508 | 2.4% |
| Portuguese | 59 | 0.3% |
| Puerto Rican | 80 | 0.4% |
| Romanian | 10 | 0.1% |
| Russian | 492 | 2.4% |
| Salvadoran | 51 | 0.2% |
| Samoan | 28 | 0.1% |
| Scandinavian | 161 | 0.8% |
| Scotch-Irish | 109 | 0.5% |
| Scottish | 405 | 1.9% |
| Serbian | 11 | 0.1% |
| Shoshone | 12 | 0.1% |
| Sioux | 26 | 0.1% |
| South American | 127 | 0.6% |
| Spaniard | 6 | 0.0% |
| Spanish | 73 | 0.4% |
| Sri Lankan | 92 | 0.4% |
| Subsaharan African | 34 | 0.2% |
| Swedish | 483 | 2.3% |
| Swiss | 138 | 0.7% |
| Ukrainian | 1,163 | 5.6% |
| Uruguayan | 78 | 0.4% |
| Welsh | 148 | 0.7% |
| Yugoslavian | 11 | 0.1% | View All 80 Rows |
Immigrants in Battle Ground
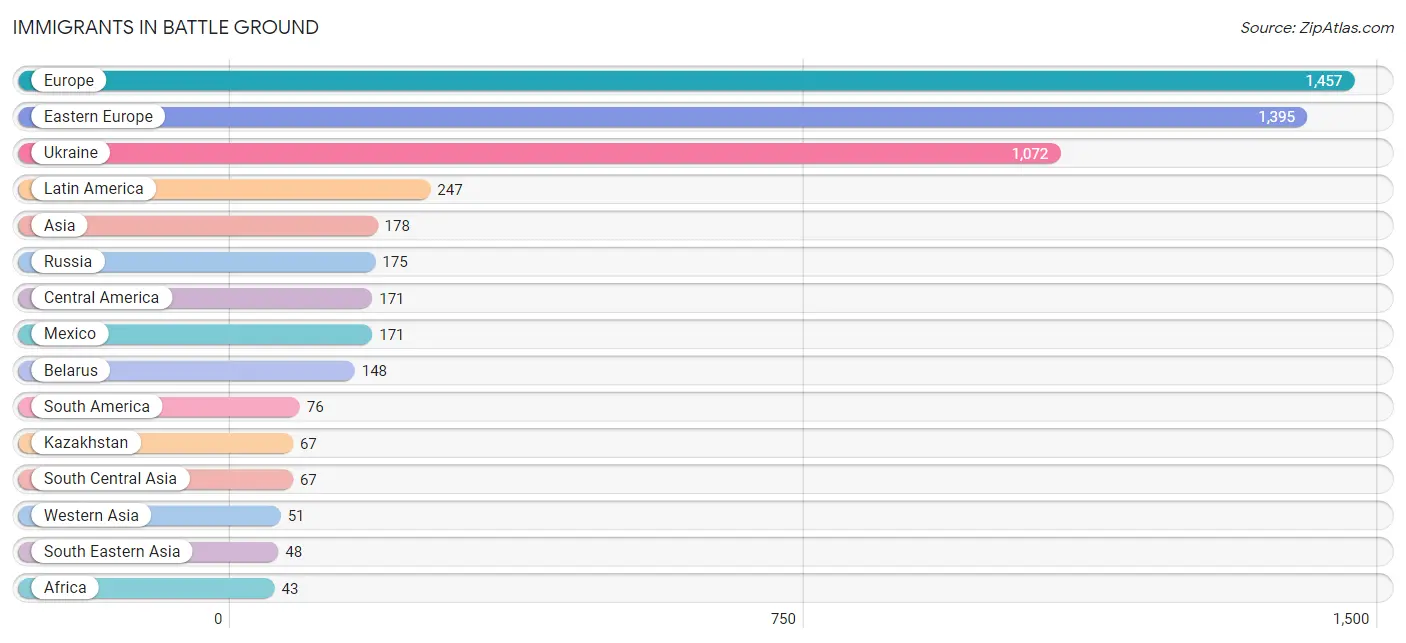
The most numerous immigrant groups reported in Battle Ground came from Europe (1,457 | 7.0%), Eastern Europe (1,395 | 6.7%), Ukraine (1,072 | 5.1%), Latin America (247 | 1.2%), and Asia (178 | 0.9%), together accounting for 20.8% of all Battle Ground residents.
| Immigration Origin | # Population | % Population |
| Africa | 43 | 0.2% |
| Asia | 178 | 0.9% |
| Austria | 9 | 0.0% |
| Belarus | 148 | 0.7% |
| Cambodia | 6 | 0.0% |
| Canada | 42 | 0.2% |
| Central America | 171 | 0.8% |
| China | 12 | 0.1% |
| Colombia | 22 | 0.1% |
| Eastern Asia | 12 | 0.1% |
| Eastern Europe | 1,395 | 6.7% |
| Europe | 1,457 | 7.0% |
| Fiji | 5 | 0.0% |
| Germany | 15 | 0.1% |
| Kazakhstan | 67 | 0.3% |
| Laos | 10 | 0.1% |
| Latin America | 247 | 1.2% |
| Lebanon | 15 | 0.1% |
| Liberia | 16 | 0.1% |
| Mexico | 171 | 0.8% |
| Middle Africa | 14 | 0.1% |
| Netherlands | 10 | 0.1% |
| Northern Europe | 7 | 0.0% |
| Norway | 7 | 0.0% |
| Oceania | 5 | 0.0% |
| Peru | 19 | 0.1% |
| Philippines | 22 | 0.1% |
| Portugal | 21 | 0.1% |
| Russia | 175 | 0.8% |
| South Africa | 13 | 0.1% |
| South America | 76 | 0.4% |
| South Central Asia | 67 | 0.3% |
| South Eastern Asia | 48 | 0.2% |
| Southern Europe | 21 | 0.1% |
| Taiwan | 5 | 0.0% |
| Ukraine | 1,072 | 5.1% |
| Uruguay | 35 | 0.2% |
| Vietnam | 10 | 0.1% |
| Western Africa | 16 | 0.1% |
| Western Asia | 51 | 0.2% |
| Western Europe | 34 | 0.2% |
| Zaire | 14 | 0.1% | View All 42 Rows |
Sex and Age in Battle Ground
Sex and Age in Battle Ground
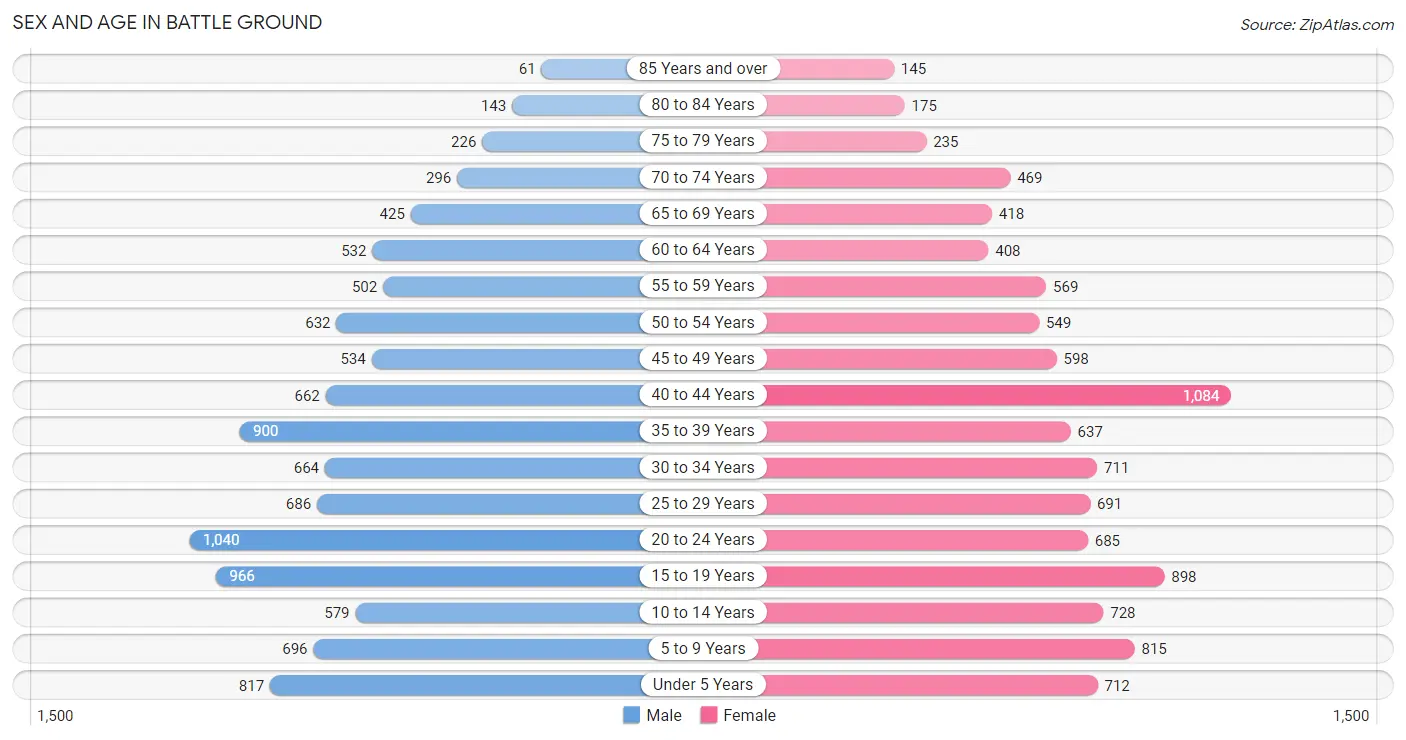
The most populous age groups in Battle Ground are 20 to 24 Years (1,040 | 10.0%) for men and 40 to 44 Years (1,084 | 10.3%) for women.
| Age Bracket | Male | Female |
| Under 5 Years | 817 (7.9%) | 712 (6.8%) |
| 5 to 9 Years | 696 (6.7%) | 815 (7.7%) |
| 10 to 14 Years | 579 (5.6%) | 728 (6.9%) |
| 15 to 19 Years | 966 (9.3%) | 898 (8.5%) |
| 20 to 24 Years | 1,040 (10.0%) | 685 (6.5%) |
| 25 to 29 Years | 686 (6.6%) | 691 (6.6%) |
| 30 to 34 Years | 664 (6.4%) | 711 (6.8%) |
| 35 to 39 Years | 900 (8.7%) | 637 (6.0%) |
| 40 to 44 Years | 662 (6.4%) | 1,084 (10.3%) |
| 45 to 49 Years | 534 (5.1%) | 598 (5.7%) |
| 50 to 54 Years | 632 (6.1%) | 549 (5.2%) |
| 55 to 59 Years | 502 (4.9%) | 569 (5.4%) |
| 60 to 64 Years | 532 (5.1%) | 408 (3.9%) |
| 65 to 69 Years | 425 (4.1%) | 418 (4.0%) |
| 70 to 74 Years | 296 (2.9%) | 469 (4.5%) |
| 75 to 79 Years | 226 (2.2%) | 235 (2.2%) |
| 80 to 84 Years | 143 (1.4%) | 175 (1.7%) |
| 85 Years and over | 61 (0.6%) | 145 (1.4%) |
| Total | 10,361 (100.0%) | 10,527 (100.0%) |
Families and Households in Battle Ground
Median Family Size in Battle Ground
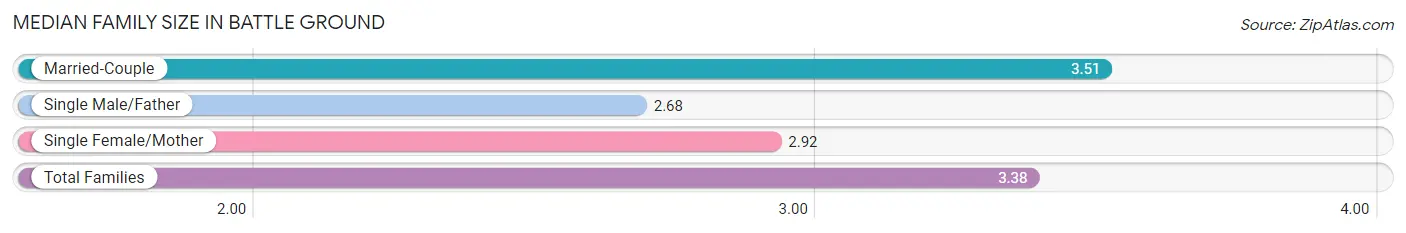
The median family size in Battle Ground is 3.38 persons per family, with married-couple families (4,155 | 79.2%) accounting for the largest median family size of 3.51 persons per family. On the other hand, single male/father families (270 | 5.1%) represent the smallest median family size with 2.68 persons per family.
| Family Type | # Families | Family Size |
| Married-Couple | 4,155 (79.2%) | 3.51 |
| Single Male/Father | 270 (5.1%) | 2.68 |
| Single Female/Mother | 819 (15.6%) | 2.92 |
| Total Families | 5,244 (100.0%) | 3.38 |
Median Household Size in Battle Ground
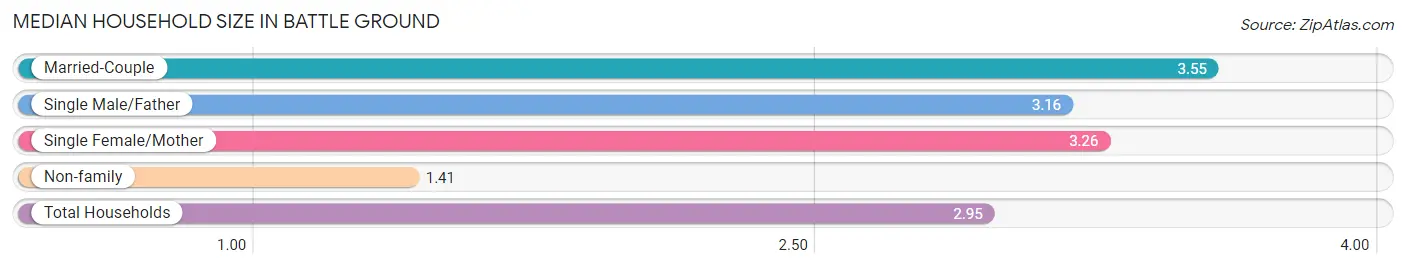
The median household size in Battle Ground is 2.95 persons per household, with married-couple households (4,155 | 59.0%) accounting for the largest median household size of 3.55 persons per household. non-family households (1,797 | 25.5%) represent the smallest median household size with 1.41 persons per household.
| Household Type | # Households | Household Size |
| Married-Couple | 4,155 (59.0%) | 3.55 |
| Single Male/Father | 270 (3.8%) | 3.16 |
| Single Female/Mother | 819 (11.6%) | 3.26 |
| Non-family | 1,797 (25.5%) | 1.41 |
| Total Households | 7,041 (100.0%) | 2.95 |
Household Size by Marriage Status in Battle Ground
Out of a total of 7,041 households in Battle Ground, 5,244 (74.5%) are family households, while 1,797 (25.5%) are nonfamily households. The most numerous type of family households are 2-person households, comprising 1,995, and the most common type of nonfamily households are 1-person households, comprising 1,314.
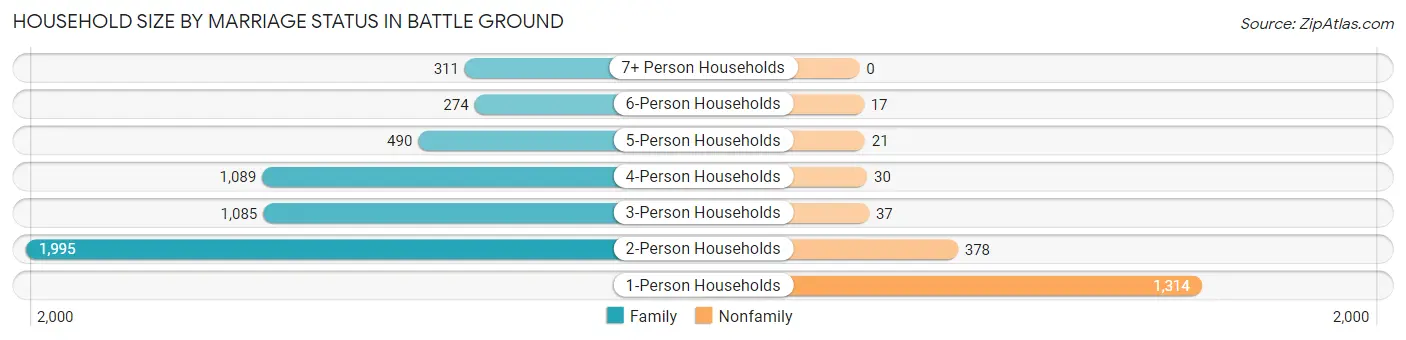
| Household Size | Family Households | Nonfamily Households |
| 1-Person Households | - | 1,314 (18.7%) |
| 2-Person Households | 1,995 (28.3%) | 378 (5.4%) |
| 3-Person Households | 1,085 (15.4%) | 37 (0.5%) |
| 4-Person Households | 1,089 (15.5%) | 30 (0.4%) |
| 5-Person Households | 490 (7.0%) | 21 (0.3%) |
| 6-Person Households | 274 (3.9%) | 17 (0.2%) |
| 7+ Person Households | 311 (4.4%) | 0 (0.0%) |
| Total | 5,244 (74.5%) | 1,797 (25.5%) |
Female Fertility in Battle Ground
Fertility by Age in Battle Ground
Average fertility rate in Battle Ground is 57.0 births per 1,000 women. Women in the age bracket of 20 to 34 years have the highest fertility rate with 105.0 births per 1,000 women. Women in the age bracket of 20 to 34 years acount for 70.7% of all women with births.
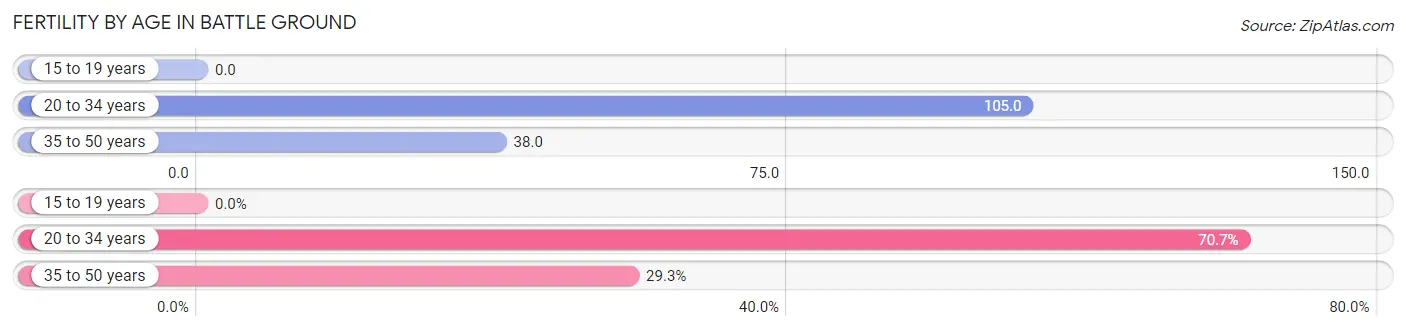
| Age Bracket | Women with Births | Births / 1,000 Women |
| 15 to 19 years | 0 (0.0%) | 0.0 |
| 20 to 34 years | 220 (70.7%) | 105.0 |
| 35 to 50 years | 91 (29.3%) | 38.0 |
| Total | 311 (100.0%) | 57.0 |
Fertility by Age by Marriage Status in Battle Ground
77.2% of women with births (311) in Battle Ground are married. The highest percentage of unmarried women with births falls into 20 to 34 years age bracket with 32.3% of them unmarried at the time of birth, while the lowest percentage of unmarried women with births belong to 35 to 50 years age bracket with 0.0% of them unmarried.
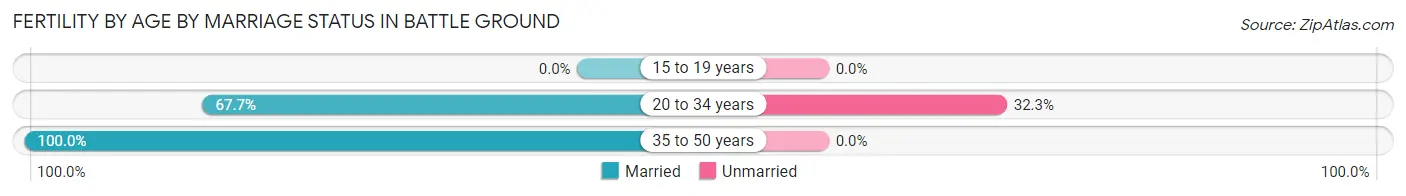
| Age Bracket | Married | Unmarried |
| 15 to 19 years | 0 (0.0%) | 0 (0.0%) |
| 20 to 34 years | 149 (67.7%) | 71 (32.3%) |
| 35 to 50 years | 91 (100.0%) | 0 (0.0%) |
| Total | 240 (77.2%) | 71 (22.8%) |
Fertility by Education in Battle Ground
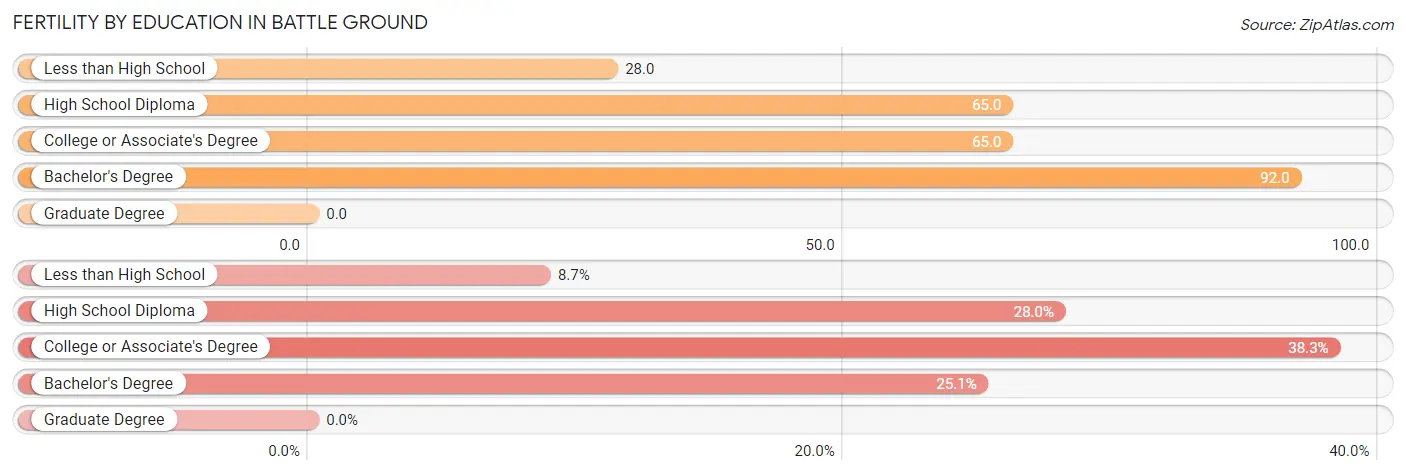
| Educational Attainment | Women with Births | Births / 1,000 Women |
| Less than High School | 27 (8.7%) | 28.0 |
| High School Diploma | 87 (28.0%) | 65.0 |
| College or Associate's Degree | 119 (38.3%) | 65.0 |
| Bachelor's Degree | 78 (25.1%) | 92.0 |
| Graduate Degree | 0 (0.0%) | 0.0 |
| Total | 311 (100.0%) | 57.0 |
Fertility by Education by Marriage Status in Battle Ground
22.8% of women with births in Battle Ground are unmarried. Women with the educational attainment of less than high school are most likely to be married with 100.0% of them married at childbirth, while women with the educational attainment of high school diploma are least likely to be married with 51.7% of them unmarried at childbirth.
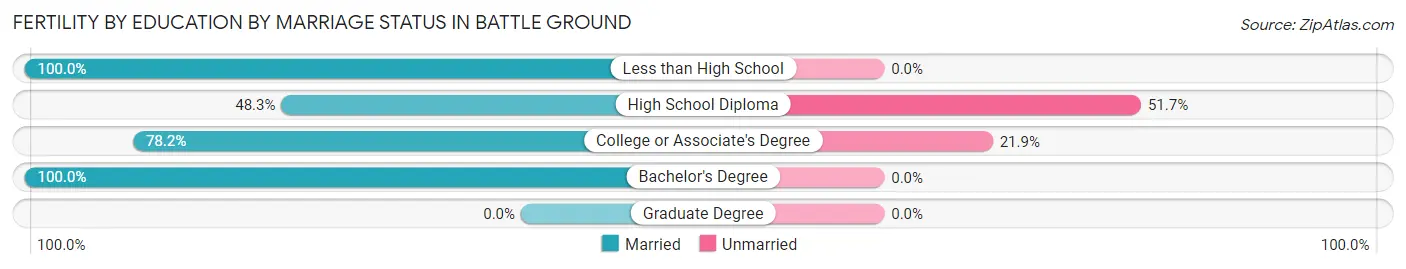
| Educational Attainment | Married | Unmarried |
| Less than High School | 27 (100.0%) | 0 (0.0%) |
| High School Diploma | 42 (48.3%) | 45 (51.7%) |
| College or Associate's Degree | 93 (78.1%) | 26 (21.8%) |
| Bachelor's Degree | 78 (100.0%) | 0 (0.0%) |
| Graduate Degree | 0 (0.0%) | 0 (0.0%) |
| Total | 240 (77.2%) | 71 (22.8%) |
Employment Characteristics in Battle Ground
Employment by Class of Employer in Battle Ground
Among the 9,717 employed individuals in Battle Ground, private company employees (6,613 | 68.1%), local government employees (864 | 8.9%), and not-for-profit organizations (597 | 6.1%) make up the most common classes of employment.
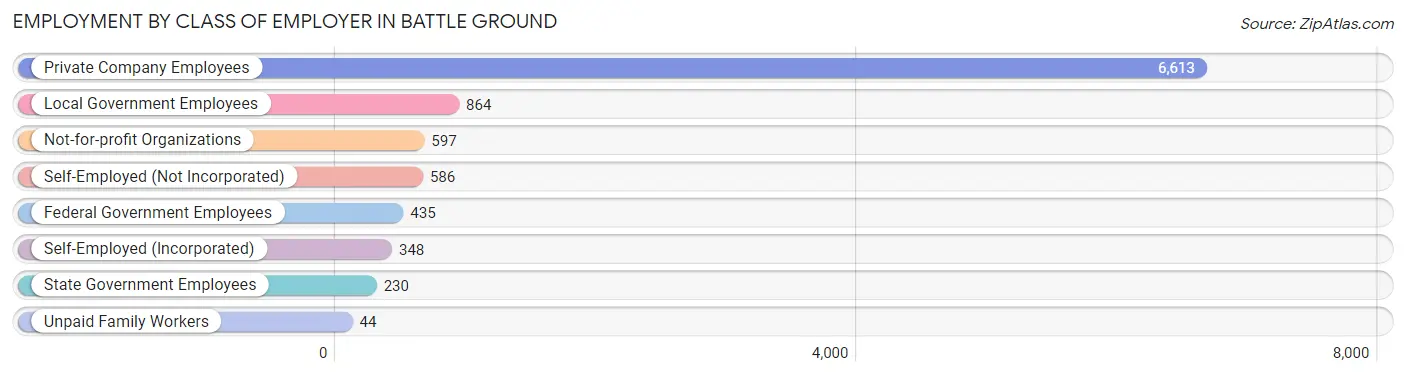
| Employer Class | # Employees | % Employees |
| Private Company Employees | 6,613 | 68.1% |
| Self-Employed (Incorporated) | 348 | 3.6% |
| Self-Employed (Not Incorporated) | 586 | 6.0% |
| Not-for-profit Organizations | 597 | 6.1% |
| Local Government Employees | 864 | 8.9% |
| State Government Employees | 230 | 2.4% |
| Federal Government Employees | 435 | 4.5% |
| Unpaid Family Workers | 44 | 0.4% |
| Total | 9,717 | 100.0% |
Employment Status by Age in Battle Ground
According to the labor force statistics for Battle Ground, out of the total population over 16 years of age (16,066), 64.6% or 10,379 individuals are in the labor force, with 4.3% or 446 of them unemployed. The age group with the highest labor force participation rate is 25 to 29 years, with 87.4% or 1,203 individuals in the labor force. Within the labor force, the 16 to 19 years age range has the highest percentage of unemployed individuals, with 17.4% or 87 of them being unemployed.
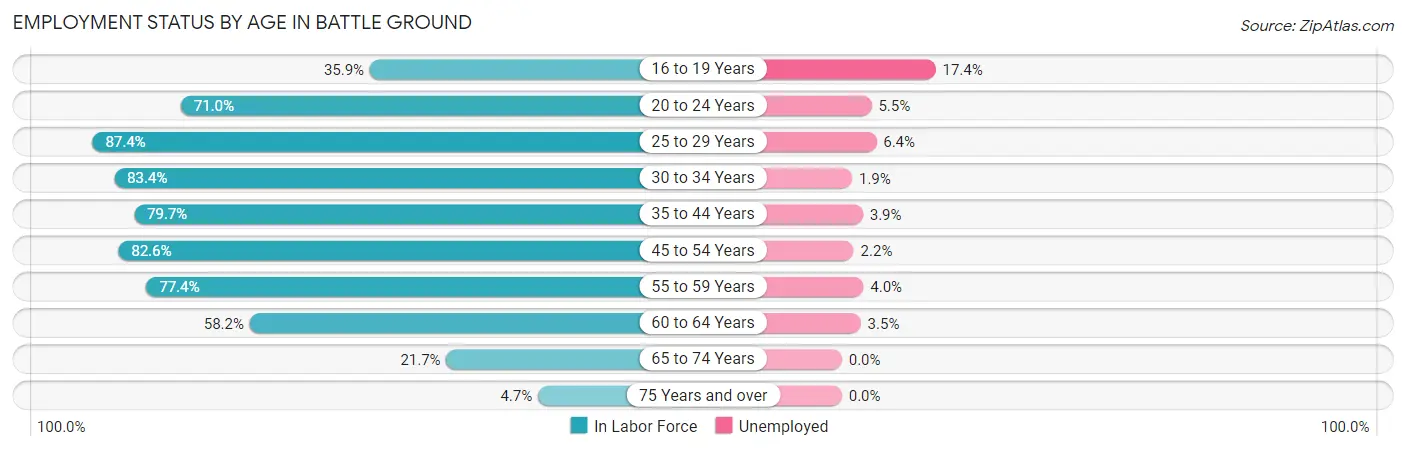
| Age Bracket | In Labor Force | Unemployed |
| 16 to 19 Years | 499 (35.9%) | 87 (17.4%) |
| 20 to 24 Years | 1,225 (71.0%) | 67 (5.5%) |
| 25 to 29 Years | 1,203 (87.4%) | 77 (6.4%) |
| 30 to 34 Years | 1,147 (83.4%) | 22 (1.9%) |
| 35 to 44 Years | 2,617 (79.7%) | 102 (3.9%) |
| 45 to 54 Years | 1,911 (82.6%) | 42 (2.2%) |
| 55 to 59 Years | 829 (77.4%) | 33 (4.0%) |
| 60 to 64 Years | 547 (58.2%) | 19 (3.5%) |
| 65 to 74 Years | 349 (21.7%) | 0 (0.0%) |
| 75 Years and over | 46 (4.7%) | 0 (0.0%) |
| Total | 10,379 (64.6%) | 446 (4.3%) |
Employment Status by Educational Attainment in Battle Ground
According to labor force statistics for Battle Ground, 79.7% of individuals (8,256) out of the total population between 25 and 64 years of age (10,359) are in the labor force, with 3.6% or 297 of them being unemployed. The group with the highest labor force participation rate are those with the educational attainment of bachelor's degree or higher, with 83.1% or 2,008 individuals in the labor force. Within the labor force, individuals with high school diploma education have the highest percentage of unemployment, with 4.0% or 100 of them being unemployed.
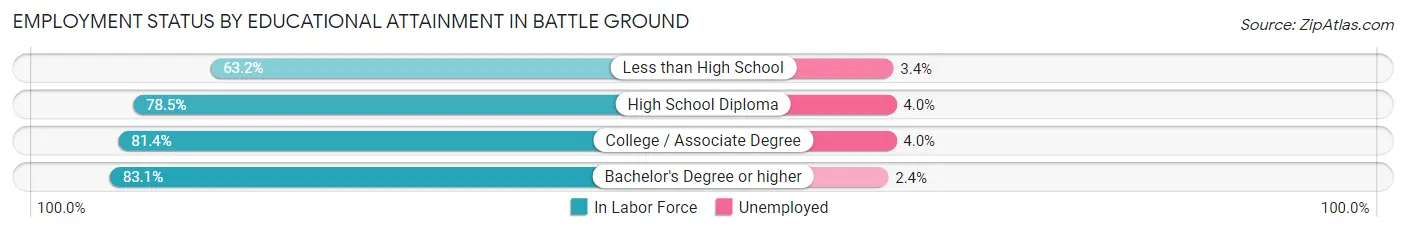
| Educational Attainment | In Labor Force | Unemployed |
| Less than High School | 444 (63.2%) | 24 (3.4%) |
| High School Diploma | 2,493 (78.5%) | 127 (4.0%) |
| College / Associate Degree | 3,308 (81.4%) | 163 (4.0%) |
| Bachelor's Degree or higher | 2,008 (83.1%) | 58 (2.4%) |
| Total | 8,256 (79.7%) | 373 (3.6%) |
Employment Occupations by Sex in Battle Ground
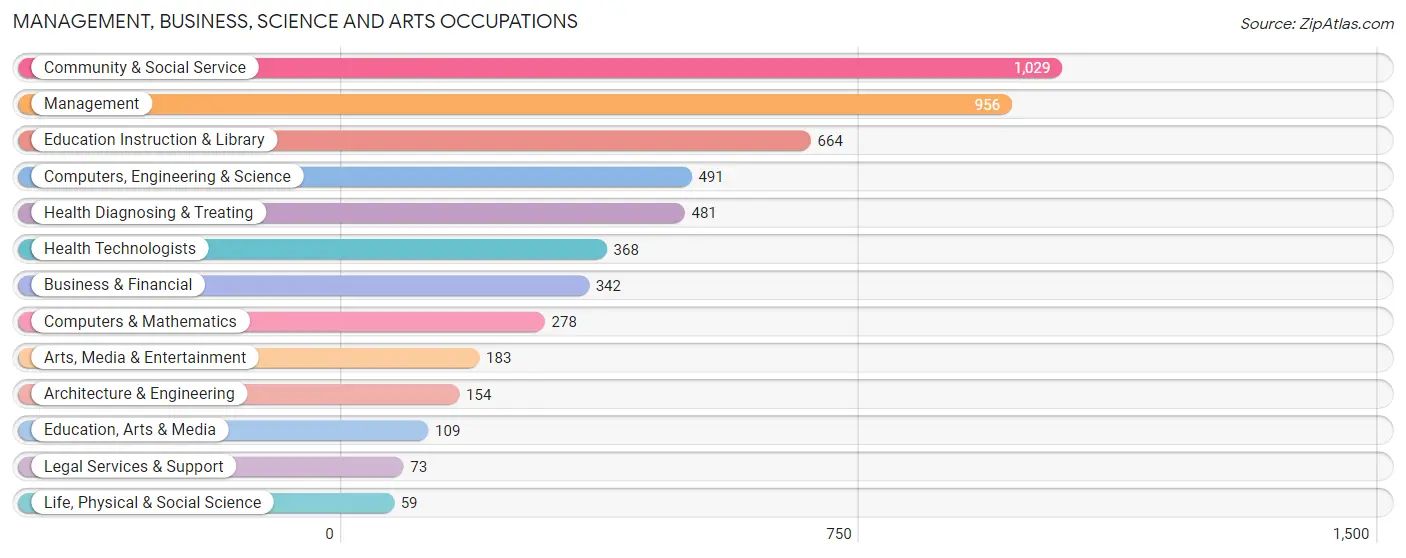
Management, Business, Science and Arts Occupations
The most common Management, Business, Science and Arts occupations in Battle Ground are Community & Social Service (1,029 | 10.4%), Management (956 | 9.6%), Education Instruction & Library (664 | 6.7%), Computers, Engineering & Science (491 | 5.0%), and Health Diagnosing & Treating (481 | 4.9%).
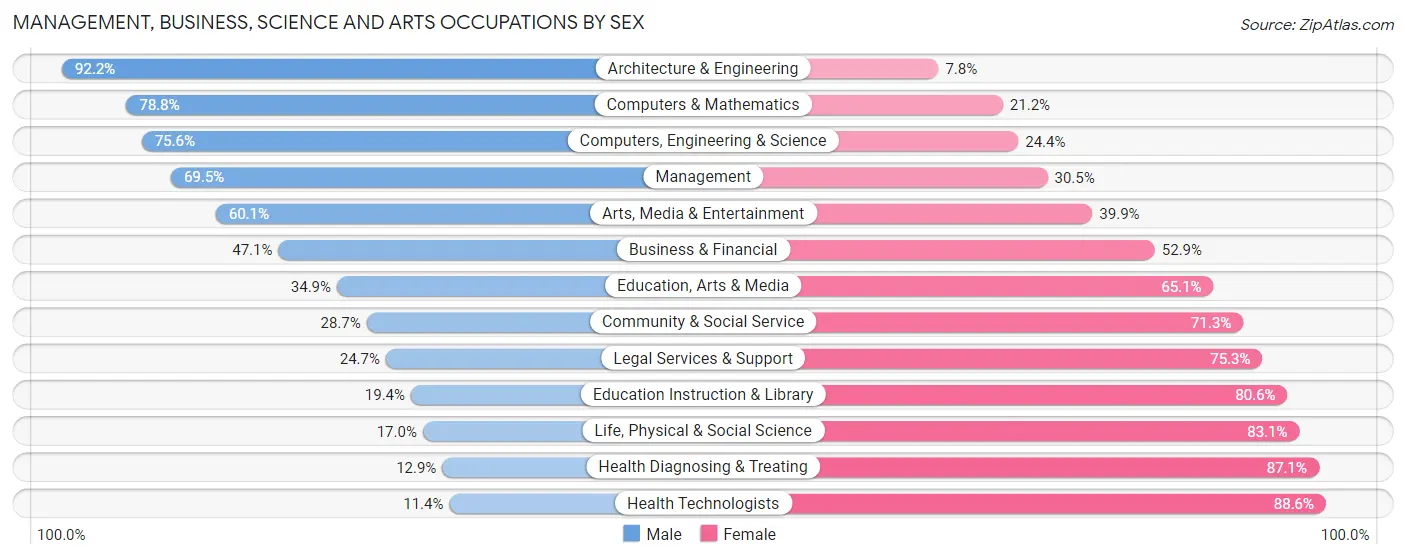
Management, Business, Science and Arts Occupations by Sex
Within the Management, Business, Science and Arts occupations in Battle Ground, the most male-oriented occupations are Architecture & Engineering (92.2%), Computers & Mathematics (78.8%), and Computers, Engineering & Science (75.6%), while the most female-oriented occupations are Health Technologists (88.6%), Health Diagnosing & Treating (87.1%), and Life, Physical & Social Science (83.1%).
| Occupation | Male | Female |
| Management | 664 (69.5%) | 292 (30.5%) |
| Business & Financial | 161 (47.1%) | 181 (52.9%) |
| Computers, Engineering & Science | 371 (75.6%) | 120 (24.4%) |
| Computers & Mathematics | 219 (78.8%) | 59 (21.2%) |
| Architecture & Engineering | 142 (92.2%) | 12 (7.8%) |
| Life, Physical & Social Science | 10 (17.0%) | 49 (83.1%) |
| Community & Social Service | 295 (28.7%) | 734 (71.3%) |
| Education, Arts & Media | 38 (34.9%) | 71 (65.1%) |
| Legal Services & Support | 18 (24.7%) | 55 (75.3%) |
| Education Instruction & Library | 129 (19.4%) | 535 (80.6%) |
| Arts, Media & Entertainment | 110 (60.1%) | 73 (39.9%) |
| Health Diagnosing & Treating | 62 (12.9%) | 419 (87.1%) |
| Health Technologists | 42 (11.4%) | 326 (88.6%) |
| Total (Category) | 1,553 (47.1%) | 1,746 (52.9%) |
| Total (Overall) | 5,594 (56.4%) | 4,322 (43.6%) |
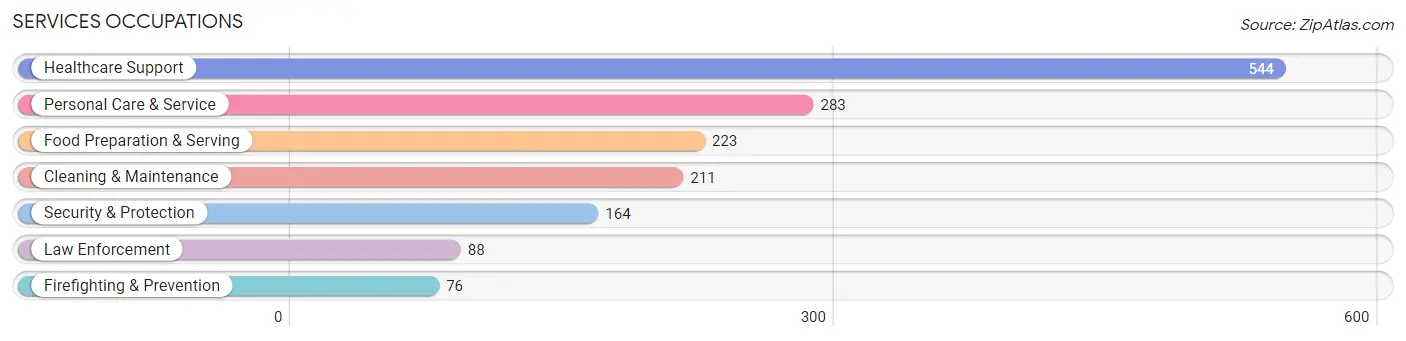
Services Occupations
The most common Services occupations in Battle Ground are Healthcare Support (544 | 5.5%), Personal Care & Service (283 | 2.9%), Food Preparation & Serving (223 | 2.2%), Cleaning & Maintenance (211 | 2.1%), and Security & Protection (164 | 1.7%).
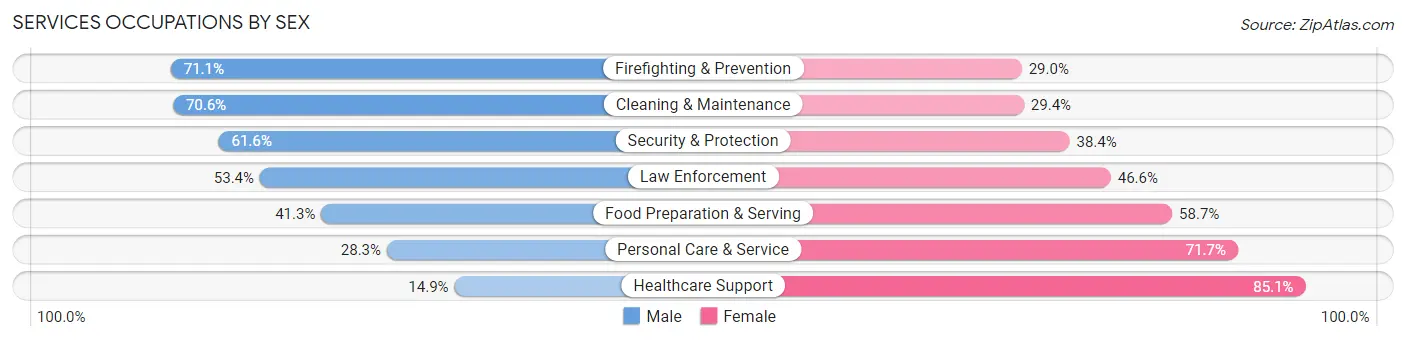
Services Occupations by Sex
Within the Services occupations in Battle Ground, the most male-oriented occupations are Firefighting & Prevention (71.1%), Cleaning & Maintenance (70.6%), and Security & Protection (61.6%), while the most female-oriented occupations are Healthcare Support (85.1%), Personal Care & Service (71.7%), and Food Preparation & Serving (58.7%).
| Occupation | Male | Female |
| Healthcare Support | 81 (14.9%) | 463 (85.1%) |
| Security & Protection | 101 (61.6%) | 63 (38.4%) |
| Firefighting & Prevention | 54 (71.1%) | 22 (28.9%) |
| Law Enforcement | 47 (53.4%) | 41 (46.6%) |
| Food Preparation & Serving | 92 (41.3%) | 131 (58.7%) |
| Cleaning & Maintenance | 149 (70.6%) | 62 (29.4%) |
| Personal Care & Service | 80 (28.3%) | 203 (71.7%) |
| Total (Category) | 503 (35.3%) | 922 (64.7%) |
| Total (Overall) | 5,594 (56.4%) | 4,322 (43.6%) |
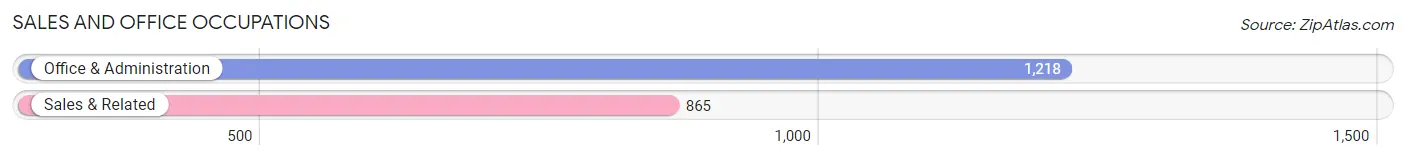
Sales and Office Occupations
The most common Sales and Office occupations in Battle Ground are Office & Administration (1,218 | 12.3%), and Sales & Related (865 | 8.7%).
Sales and Office Occupations by Sex
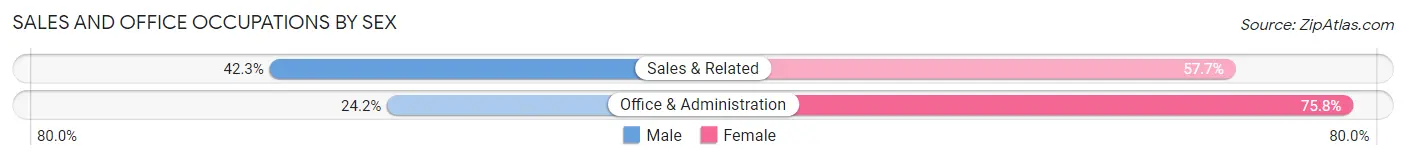
| Occupation | Male | Female |
| Sales & Related | 366 (42.3%) | 499 (57.7%) |
| Office & Administration | 295 (24.2%) | 923 (75.8%) |
| Total (Category) | 661 (31.7%) | 1,422 (68.3%) |
| Total (Overall) | 5,594 (56.4%) | 4,322 (43.6%) |
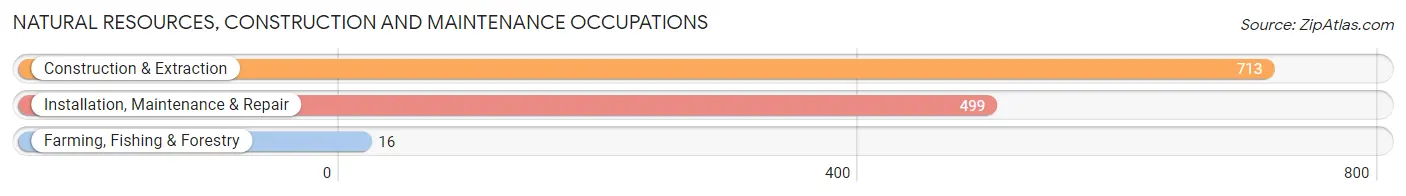
Natural Resources, Construction and Maintenance Occupations
The most common Natural Resources, Construction and Maintenance occupations in Battle Ground are Construction & Extraction (713 | 7.2%), Installation, Maintenance & Repair (499 | 5.0%), and Farming, Fishing & Forestry (16 | 0.2%).
Natural Resources, Construction and Maintenance Occupations by Sex
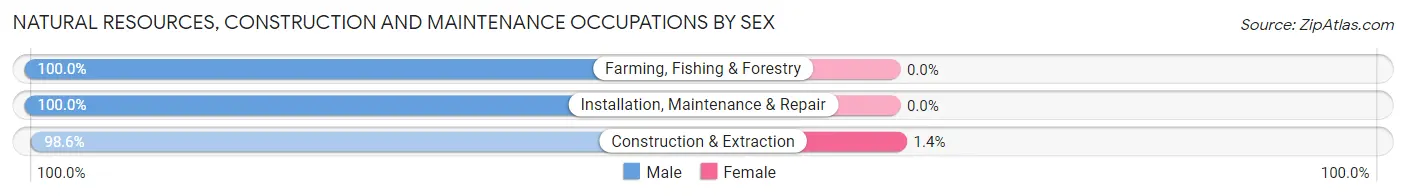
| Occupation | Male | Female |
| Farming, Fishing & Forestry | 16 (100.0%) | 0 (0.0%) |
| Construction & Extraction | 703 (98.6%) | 10 (1.4%) |
| Installation, Maintenance & Repair | 499 (100.0%) | 0 (0.0%) |
| Total (Category) | 1,218 (99.2%) | 10 (0.8%) |
| Total (Overall) | 5,594 (56.4%) | 4,322 (43.6%) |
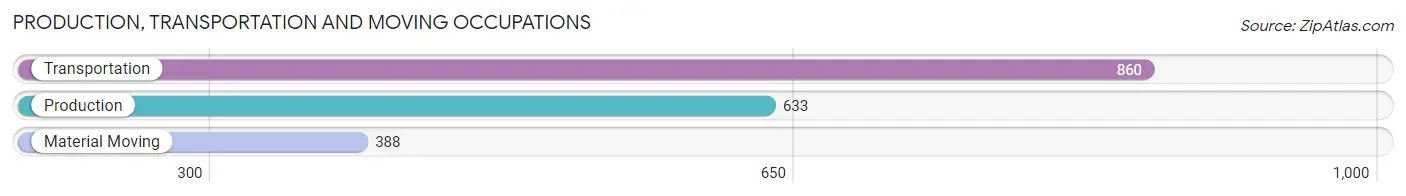
Production, Transportation and Moving Occupations
The most common Production, Transportation and Moving occupations in Battle Ground are Transportation (860 | 8.7%), Production (633 | 6.4%), and Material Moving (388 | 3.9%).
Production, Transportation and Moving Occupations by Sex
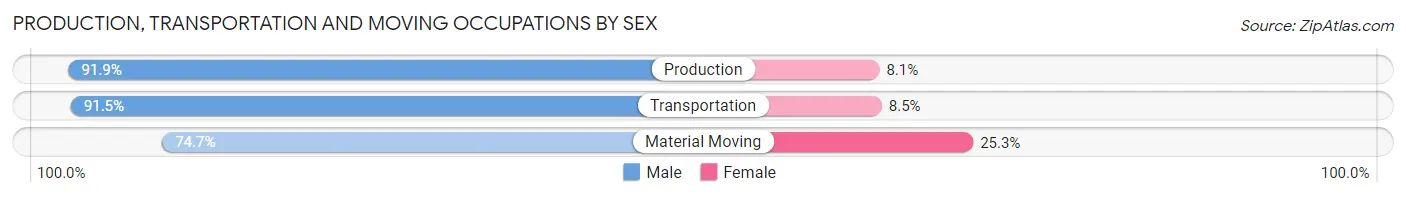
| Occupation | Male | Female |
| Production | 582 (91.9%) | 51 (8.1%) |
| Transportation | 787 (91.5%) | 73 (8.5%) |
| Material Moving | 290 (74.7%) | 98 (25.3%) |
| Total (Category) | 1,659 (88.2%) | 222 (11.8%) |
| Total (Overall) | 5,594 (56.4%) | 4,322 (43.6%) |
Employment Industries by Sex in Battle Ground
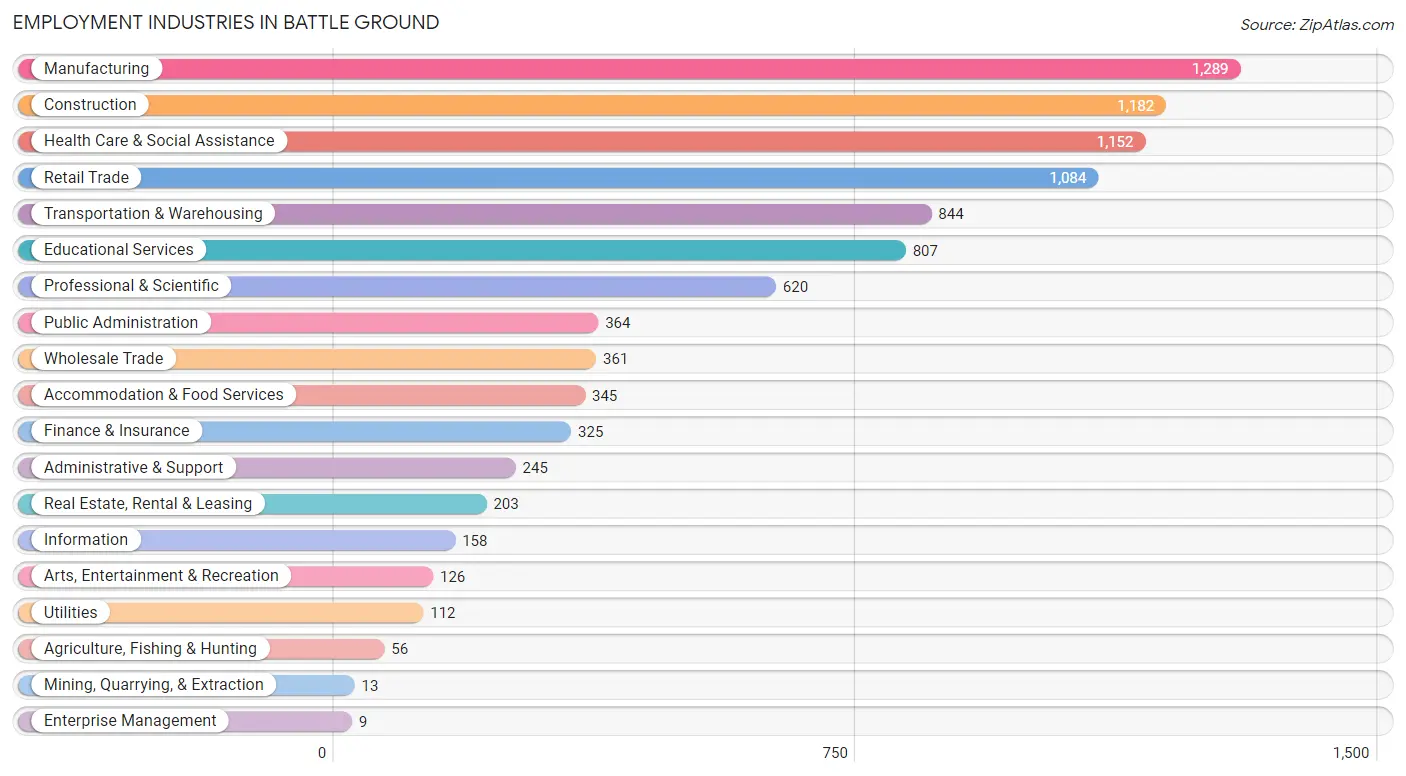
Employment Industries in Battle Ground
The major employment industries in Battle Ground include Manufacturing (1,289 | 13.0%), Construction (1,182 | 11.9%), Health Care & Social Assistance (1,152 | 11.6%), Retail Trade (1,084 | 10.9%), and Transportation & Warehousing (844 | 8.5%).
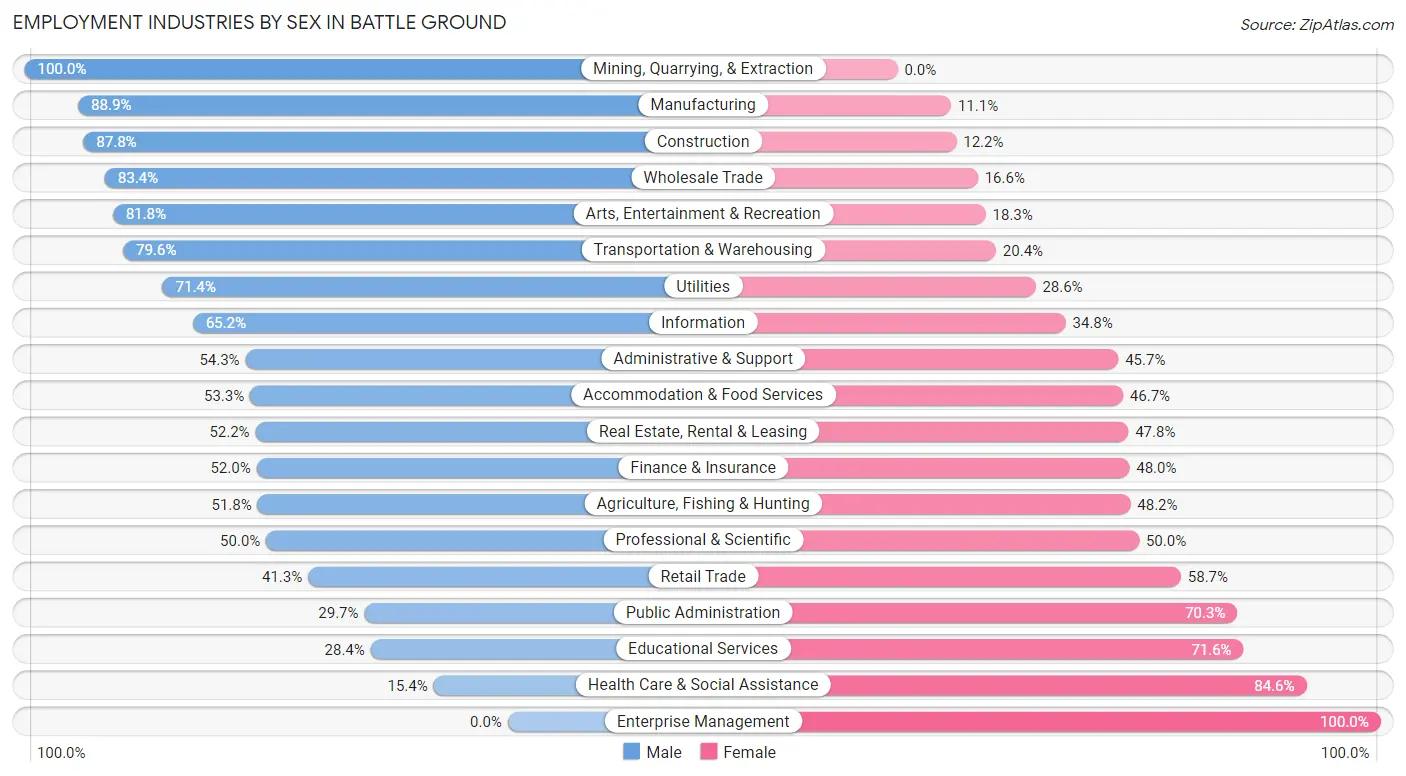
Employment Industries by Sex in Battle Ground
The Battle Ground industries that see more men than women are Mining, Quarrying, & Extraction (100.0%), Manufacturing (88.9%), and Construction (87.8%), whereas the industries that tend to have a higher number of women are Enterprise Management (100.0%), Health Care & Social Assistance (84.6%), and Educational Services (71.6%).
| Industry | Male | Female |
| Agriculture, Fishing & Hunting | 29 (51.8%) | 27 (48.2%) |
| Mining, Quarrying, & Extraction | 13 (100.0%) | 0 (0.0%) |
| Construction | 1,038 (87.8%) | 144 (12.2%) |
| Manufacturing | 1,146 (88.9%) | 143 (11.1%) |
| Wholesale Trade | 301 (83.4%) | 60 (16.6%) |
| Retail Trade | 448 (41.3%) | 636 (58.7%) |
| Transportation & Warehousing | 672 (79.6%) | 172 (20.4%) |
| Utilities | 80 (71.4%) | 32 (28.6%) |
| Information | 103 (65.2%) | 55 (34.8%) |
| Finance & Insurance | 169 (52.0%) | 156 (48.0%) |
| Real Estate, Rental & Leasing | 106 (52.2%) | 97 (47.8%) |
| Professional & Scientific | 310 (50.0%) | 310 (50.0%) |
| Enterprise Management | 0 (0.0%) | 9 (100.0%) |
| Administrative & Support | 133 (54.3%) | 112 (45.7%) |
| Educational Services | 229 (28.4%) | 578 (71.6%) |
| Health Care & Social Assistance | 177 (15.4%) | 975 (84.6%) |
| Arts, Entertainment & Recreation | 103 (81.8%) | 23 (18.2%) |
| Accommodation & Food Services | 184 (53.3%) | 161 (46.7%) |
| Public Administration | 108 (29.7%) | 256 (70.3%) |
| Total | 5,594 (56.4%) | 4,322 (43.6%) |
Education in Battle Ground
School Enrollment in Battle Ground
The most common levels of schooling among the 5,429 students in Battle Ground are high school (1,589 | 29.3%), elementary school (1,362 | 25.1%), and college / undergraduate (974 | 17.9%).
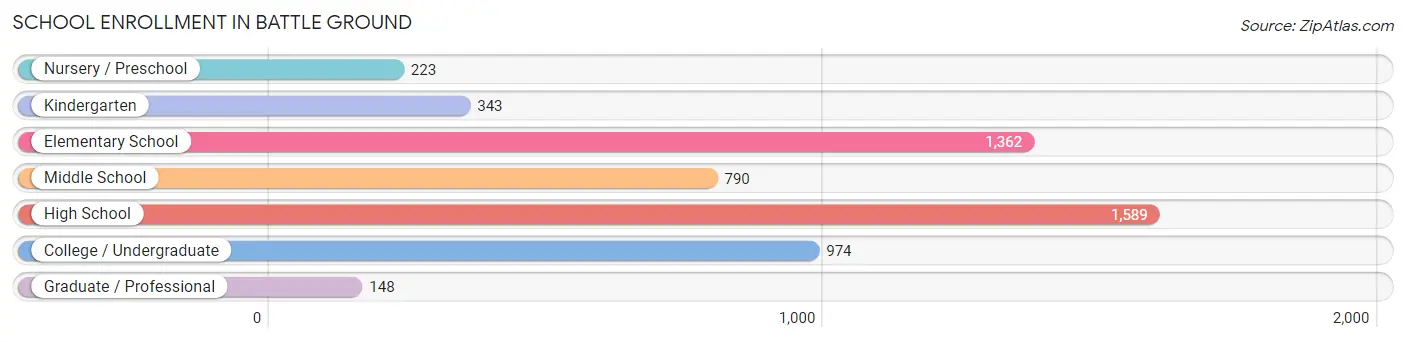
| School Level | # Students | % Students |
| Nursery / Preschool | 223 | 4.1% |
| Kindergarten | 343 | 6.3% |
| Elementary School | 1,362 | 25.1% |
| Middle School | 790 | 14.5% |
| High School | 1,589 | 29.3% |
| College / Undergraduate | 974 | 17.9% |
| Graduate / Professional | 148 | 2.7% |
| Total | 5,429 | 100.0% |
School Enrollment by Age by Funding Source in Battle Ground
Out of a total of 5,429 students who are enrolled in schools in Battle Ground, 722 (13.3%) attend a private institution, while the remaining 4,707 (86.7%) are enrolled in public schools. The age group of 3 to 4 year olds has the highest likelihood of being enrolled in private schools, with 111 (74.0% in the age bracket) enrolled. Conversely, the age group of 18 to 19 year olds has the lowest likelihood of being enrolled in a private school, with 322 (100.0% in the age bracket) attending a public institution.
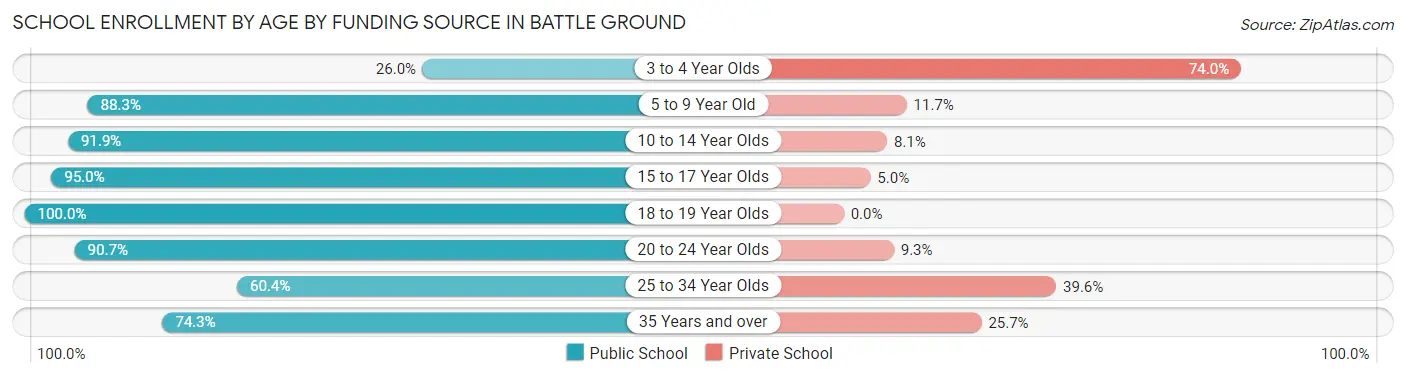
| Age Bracket | Public School | Private School |
| 3 to 4 Year Olds | 39 (26.0%) | 111 (74.0%) |
| 5 to 9 Year Old | 1,302 (88.3%) | 173 (11.7%) |
| 10 to 14 Year Olds | 1,174 (91.9%) | 103 (8.1%) |
| 15 to 17 Year Olds | 1,107 (95.0%) | 58 (5.0%) |
| 18 to 19 Year Olds | 322 (100.0%) | 0 (0.0%) |
| 20 to 24 Year Olds | 340 (90.7%) | 35 (9.3%) |
| 25 to 34 Year Olds | 310 (60.4%) | 203 (39.6%) |
| 35 Years and over | 113 (74.3%) | 39 (25.7%) |
| Total | 4,707 (86.7%) | 722 (13.3%) |
Educational Attainment by Field of Study in Battle Ground
Education (679 | 20.6%), business (606 | 18.4%), literature & languages (281 | 8.6%), science & technology (216 | 6.6%), and psychology (210 | 6.4%) are the most common fields of study among 3,288 individuals in Battle Ground who have obtained a bachelor's degree or higher.
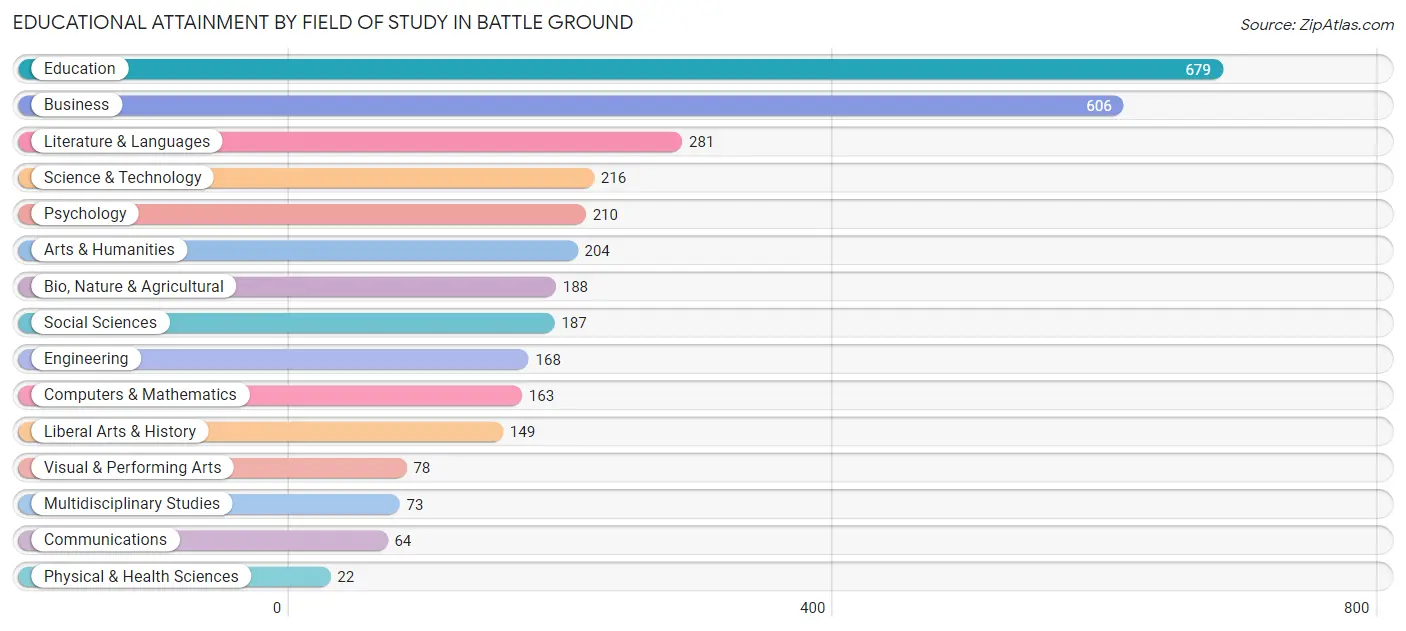
| Field of Study | # Graduates | % Graduates |
| Computers & Mathematics | 163 | 5.0% |
| Bio, Nature & Agricultural | 188 | 5.7% |
| Physical & Health Sciences | 22 | 0.7% |
| Psychology | 210 | 6.4% |
| Social Sciences | 187 | 5.7% |
| Engineering | 168 | 5.1% |
| Multidisciplinary Studies | 73 | 2.2% |
| Science & Technology | 216 | 6.6% |
| Business | 606 | 18.4% |
| Education | 679 | 20.6% |
| Literature & Languages | 281 | 8.6% |
| Liberal Arts & History | 149 | 4.5% |
| Visual & Performing Arts | 78 | 2.4% |
| Communications | 64 | 1.9% |
| Arts & Humanities | 204 | 6.2% |
| Total | 3,288 | 100.0% |
Transportation & Commute in Battle Ground
Vehicle Availability by Sex in Battle Ground
The most prevalent vehicle ownership categories in Battle Ground are males with 2 vehicles (2,128, accounting for 38.3%) and females with 2 vehicles (1,447, making up 51.2%).
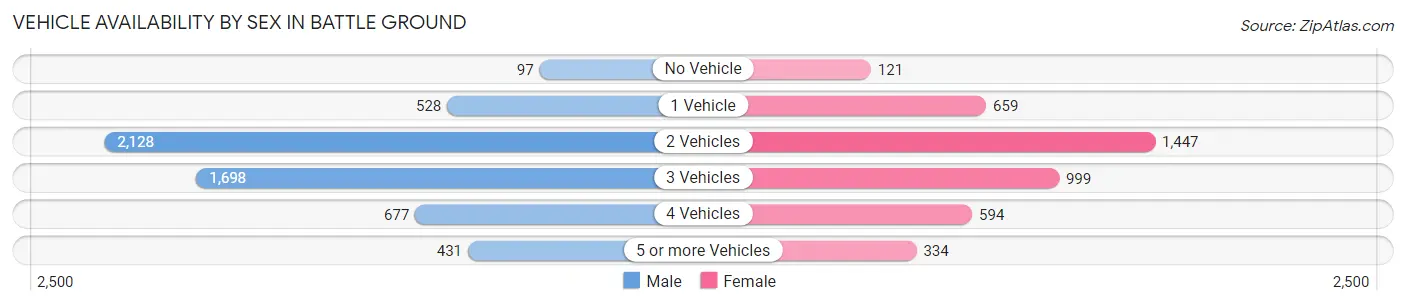
| Vehicles Available | Male | Female |
| No Vehicle | 97 (1.7%) | 121 (2.9%) |
| 1 Vehicle | 528 (9.5%) | 659 (15.9%) |
| 2 Vehicles | 2,128 (38.3%) | 1,447 (34.8%) |
| 3 Vehicles | 1,698 (30.5%) | 999 (24.0%) |
| 4 Vehicles | 677 (12.2%) | 594 (14.3%) |
| 5 or more Vehicles | 431 (7.7%) | 334 (8.0%) |
| Total | 5,559 (100.0%) | 4,154 (100.0%) |
Commute Time in Battle Ground
The most frequently occuring commute durations in Battle Ground are 30 to 34 minutes (1,622 commuters, 18.4%), 20 to 24 minutes (1,051 commuters, 11.9%), and 45 to 59 minutes (1,005 commuters, 11.4%).
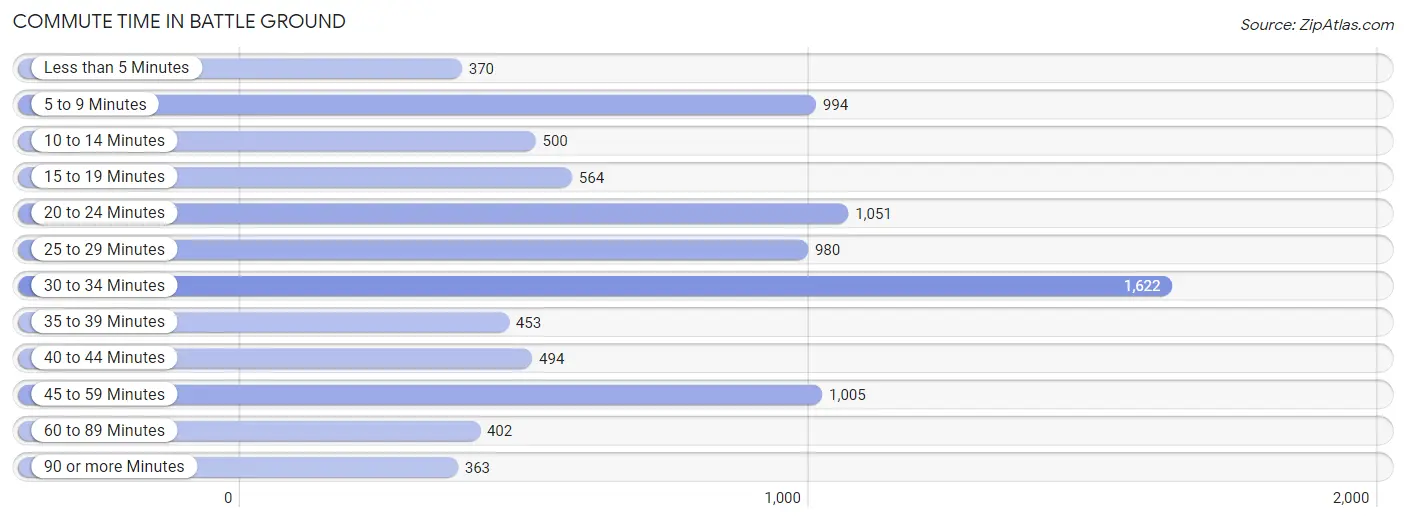
| Commute Time | # Commuters | % Commuters |
| Less than 5 Minutes | 370 | 4.2% |
| 5 to 9 Minutes | 994 | 11.3% |
| 10 to 14 Minutes | 500 | 5.7% |
| 15 to 19 Minutes | 564 | 6.4% |
| 20 to 24 Minutes | 1,051 | 11.9% |
| 25 to 29 Minutes | 980 | 11.1% |
| 30 to 34 Minutes | 1,622 | 18.4% |
| 35 to 39 Minutes | 453 | 5.1% |
| 40 to 44 Minutes | 494 | 5.6% |
| 45 to 59 Minutes | 1,005 | 11.4% |
| 60 to 89 Minutes | 402 | 4.6% |
| 90 or more Minutes | 363 | 4.1% |
Commute Time by Sex in Battle Ground
The most common commute times in Battle Ground are 30 to 34 minutes (851 commuters, 16.7%) for males and 30 to 34 minutes (771 commuters, 20.8%) for females.
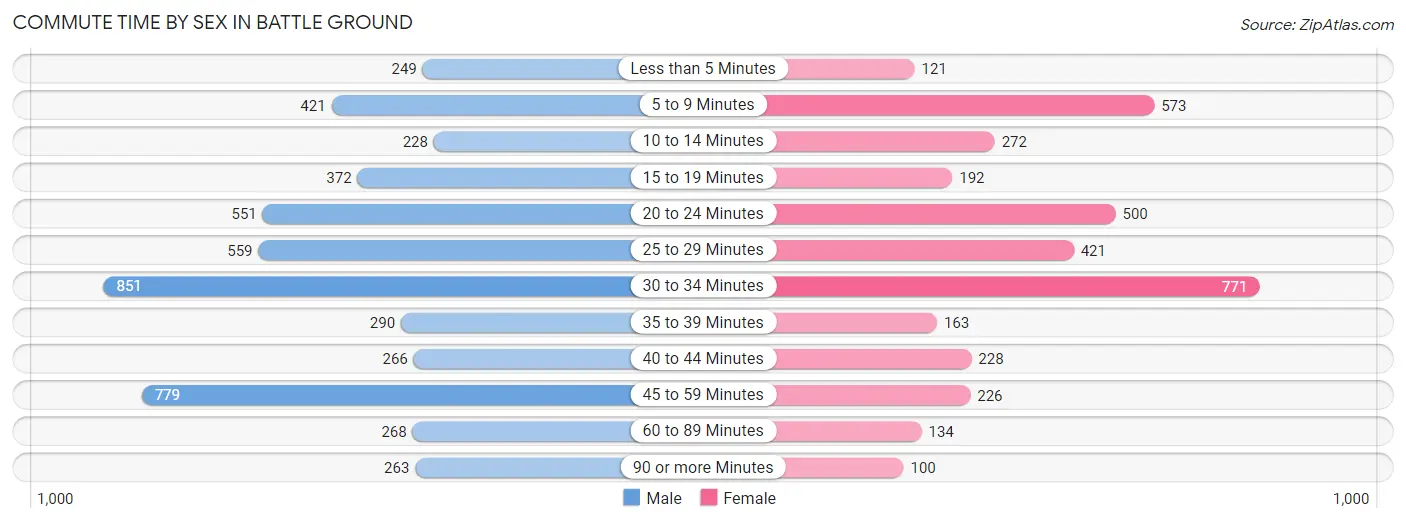
| Commute Time | Male | Female |
| Less than 5 Minutes | 249 (4.9%) | 121 (3.3%) |
| 5 to 9 Minutes | 421 (8.3%) | 573 (15.5%) |
| 10 to 14 Minutes | 228 (4.5%) | 272 (7.3%) |
| 15 to 19 Minutes | 372 (7.3%) | 192 (5.2%) |
| 20 to 24 Minutes | 551 (10.8%) | 500 (13.5%) |
| 25 to 29 Minutes | 559 (11.0%) | 421 (11.4%) |
| 30 to 34 Minutes | 851 (16.7%) | 771 (20.8%) |
| 35 to 39 Minutes | 290 (5.7%) | 163 (4.4%) |
| 40 to 44 Minutes | 266 (5.2%) | 228 (6.2%) |
| 45 to 59 Minutes | 779 (15.3%) | 226 (6.1%) |
| 60 to 89 Minutes | 268 (5.3%) | 134 (3.6%) |
| 90 or more Minutes | 263 (5.2%) | 100 (2.7%) |
Time of Departure to Work by Sex in Battle Ground
The most frequent times of departure to work in Battle Ground are 12:00 AM to 4:59 AM (969, 19.0%) for males and 7:00 AM to 7:29 AM (675, 18.2%) for females.
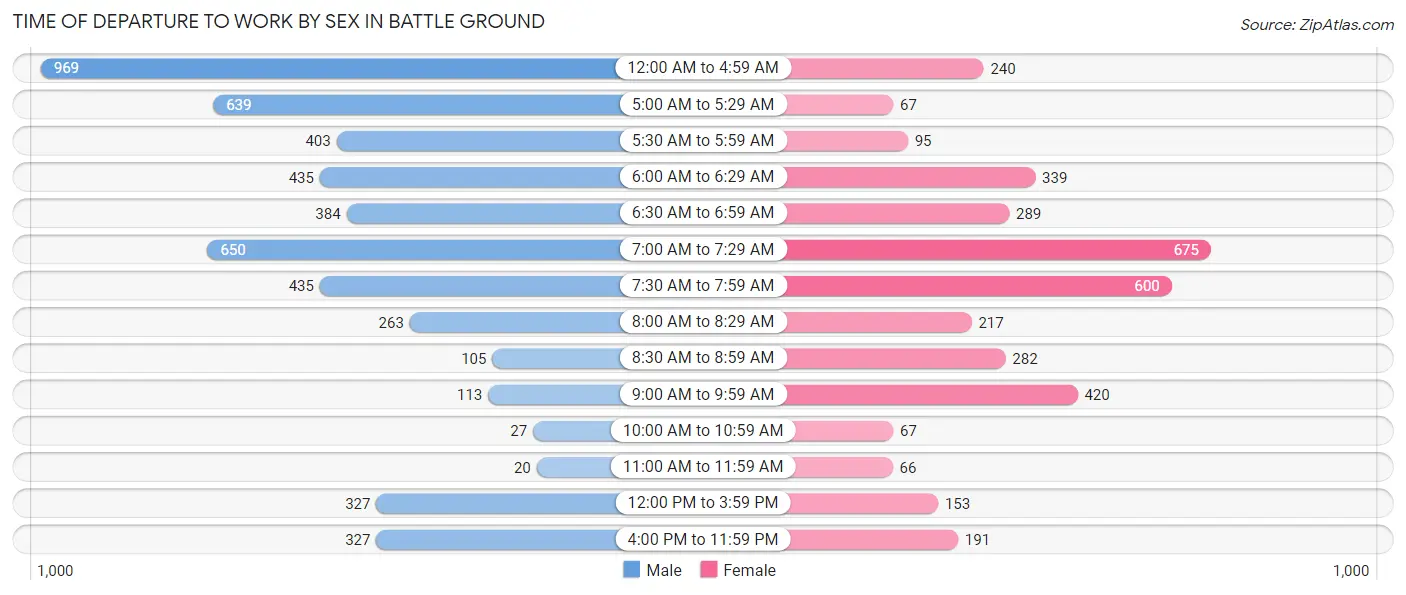
| Time of Departure | Male | Female |
| 12:00 AM to 4:59 AM | 969 (19.0%) | 240 (6.5%) |
| 5:00 AM to 5:29 AM | 639 (12.5%) | 67 (1.8%) |
| 5:30 AM to 5:59 AM | 403 (7.9%) | 95 (2.6%) |
| 6:00 AM to 6:29 AM | 435 (8.5%) | 339 (9.2%) |
| 6:30 AM to 6:59 AM | 384 (7.5%) | 289 (7.8%) |
| 7:00 AM to 7:29 AM | 650 (12.8%) | 675 (18.2%) |
| 7:30 AM to 7:59 AM | 435 (8.5%) | 600 (16.2%) |
| 8:00 AM to 8:29 AM | 263 (5.2%) | 217 (5.9%) |
| 8:30 AM to 8:59 AM | 105 (2.1%) | 282 (7.6%) |
| 9:00 AM to 9:59 AM | 113 (2.2%) | 420 (11.4%) |
| 10:00 AM to 10:59 AM | 27 (0.5%) | 67 (1.8%) |
| 11:00 AM to 11:59 AM | 20 (0.4%) | 66 (1.8%) |
| 12:00 PM to 3:59 PM | 327 (6.4%) | 153 (4.1%) |
| 4:00 PM to 11:59 PM | 327 (6.4%) | 191 (5.2%) |
| Total | 5,097 (100.0%) | 3,701 (100.0%) |
Housing Occupancy in Battle Ground
Occupancy by Ownership in Battle Ground
Of the total 7,041 dwellings in Battle Ground, owner-occupied units account for 5,093 (72.3%), while renter-occupied units make up 1,948 (27.7%).
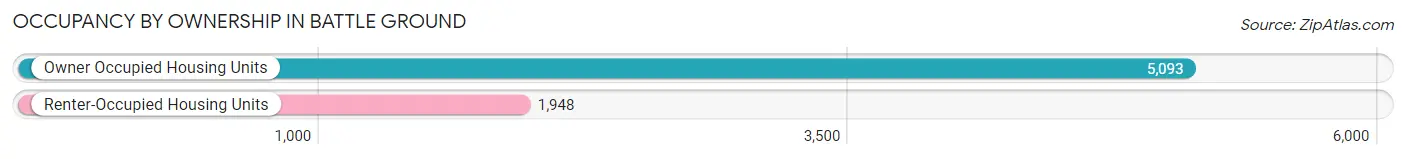
| Occupancy | # Housing Units | % Housing Units |
| Owner Occupied Housing Units | 5,093 | 72.3% |
| Renter-Occupied Housing Units | 1,948 | 27.7% |
| Total Occupied Housing Units | 7,041 | 100.0% |
Occupancy by Household Size in Battle Ground
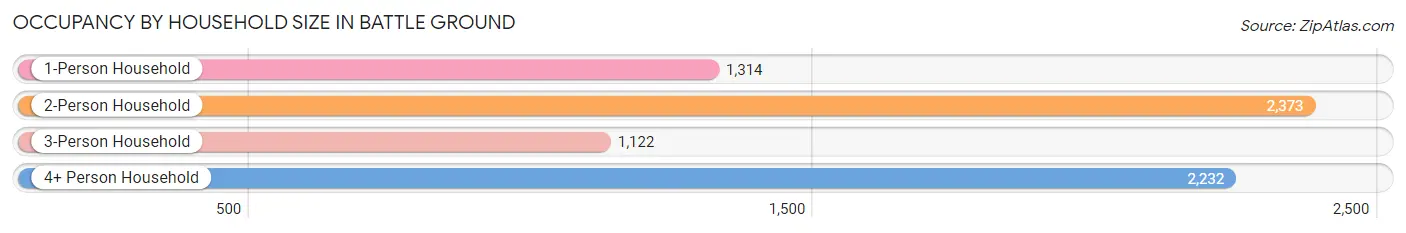
| Household Size | # Housing Units | % Housing Units |
| 1-Person Household | 1,314 | 18.7% |
| 2-Person Household | 2,373 | 33.7% |
| 3-Person Household | 1,122 | 15.9% |
| 4+ Person Household | 2,232 | 31.7% |
| Total Housing Units | 7,041 | 100.0% |
Occupancy by Ownership by Household Size in Battle Ground
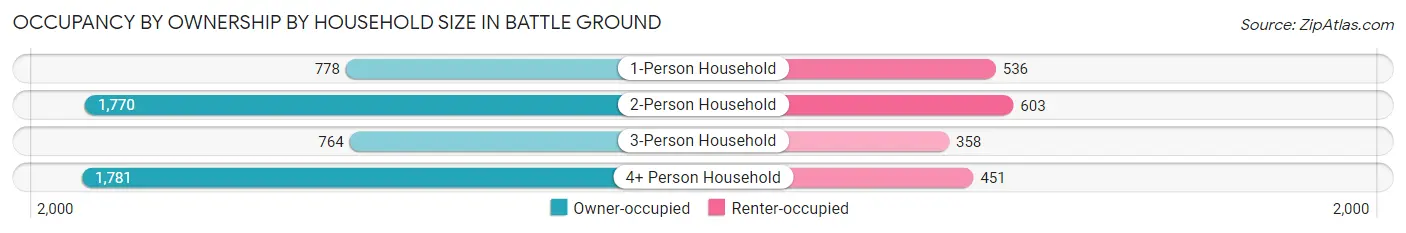
| Household Size | Owner-occupied | Renter-occupied |
| 1-Person Household | 778 (59.2%) | 536 (40.8%) |
| 2-Person Household | 1,770 (74.6%) | 603 (25.4%) |
| 3-Person Household | 764 (68.1%) | 358 (31.9%) |
| 4+ Person Household | 1,781 (79.8%) | 451 (20.2%) |
| Total Housing Units | 5,093 (72.3%) | 1,948 (27.7%) |
Occupancy by Educational Attainment in Battle Ground
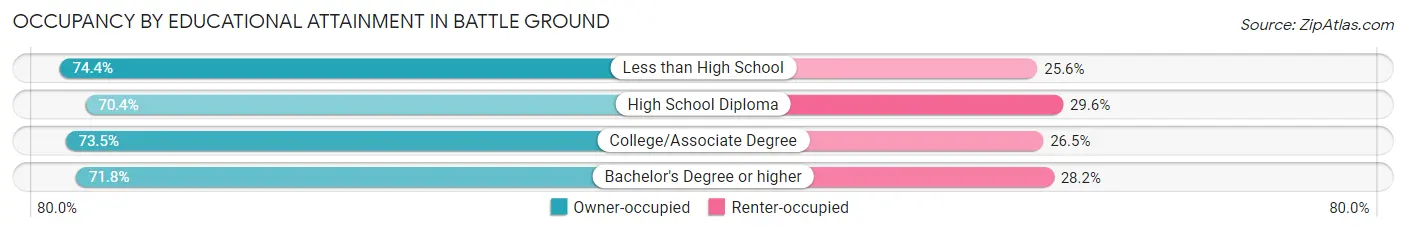
| Household Size | Owner-occupied | Renter-occupied |
| Less than High School | 329 (74.4%) | 113 (25.6%) |
| High School Diploma | 1,247 (70.4%) | 525 (29.6%) |
| College/Associate Degree | 2,188 (73.5%) | 789 (26.5%) |
| Bachelor's Degree or higher | 1,329 (71.8%) | 521 (28.2%) |
Occupancy by Age of Householder in Battle Ground
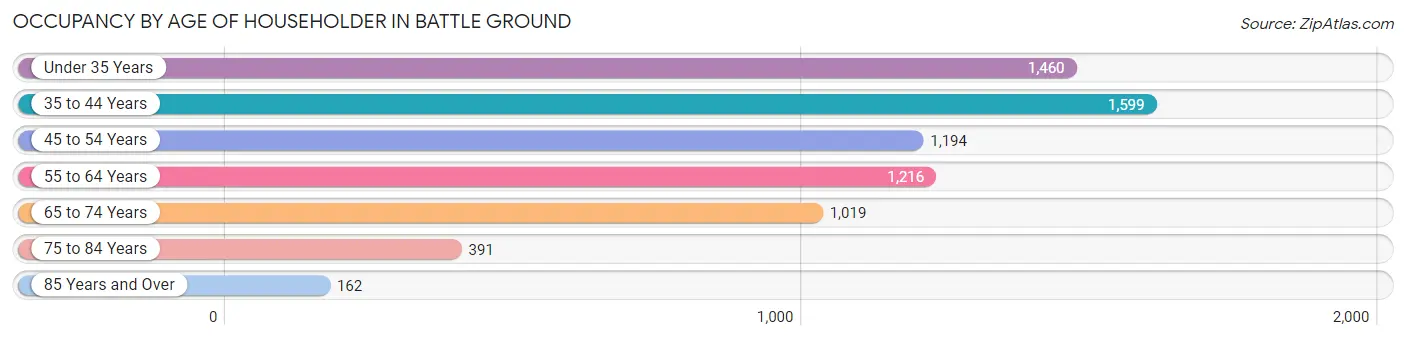
| Age Bracket | # Households | % Households |
| Under 35 Years | 1,460 | 20.7% |
| 35 to 44 Years | 1,599 | 22.7% |
| 45 to 54 Years | 1,194 | 17.0% |
| 55 to 64 Years | 1,216 | 17.3% |
| 65 to 74 Years | 1,019 | 14.5% |
| 75 to 84 Years | 391 | 5.6% |
| 85 Years and Over | 162 | 2.3% |
| Total | 7,041 | 100.0% |
Housing Finances in Battle Ground
Median Income by Occupancy in Battle Ground
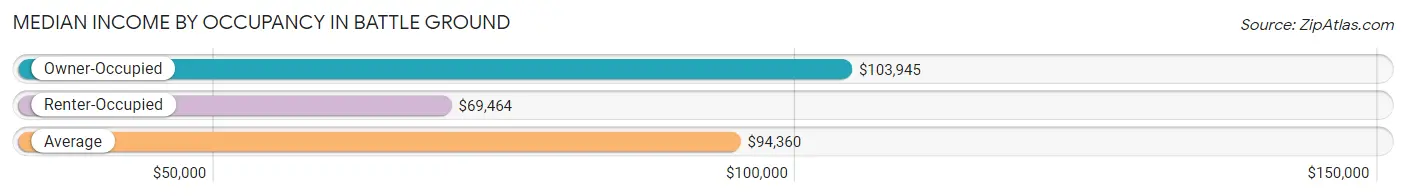
| Occupancy Type | # Households | Median Income |
| Owner-Occupied | 5,093 (72.3%) | $103,945 |
| Renter-Occupied | 1,948 (27.7%) | $69,464 |
| Average | 7,041 (100.0%) | $94,360 |
Occupancy by Householder Income Bracket in Battle Ground
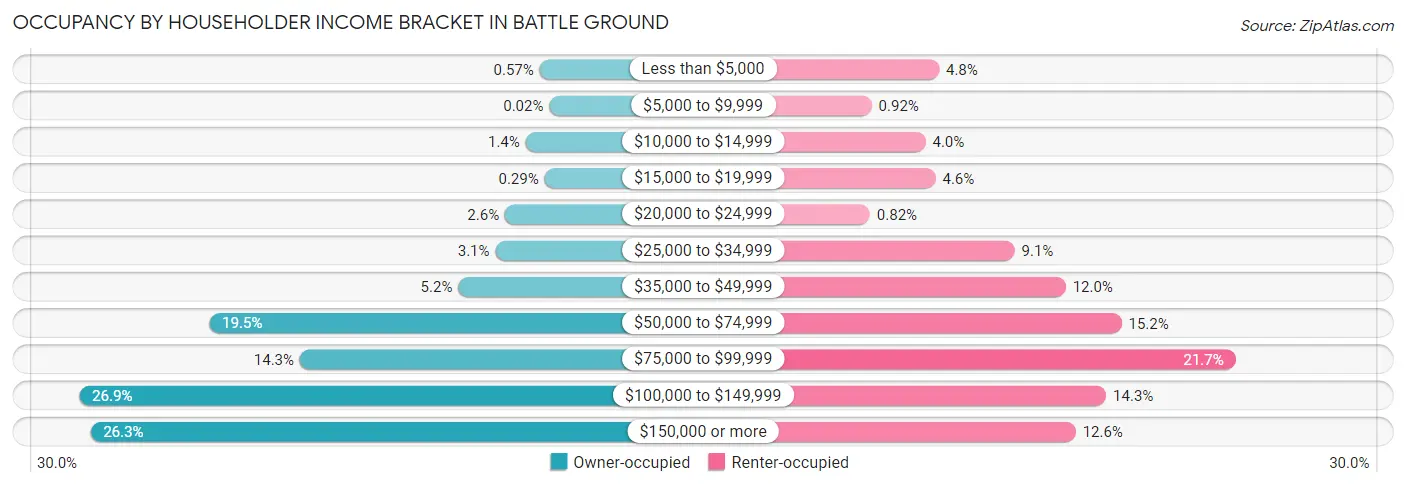
| Income Bracket | Owner-occupied | Renter-occupied |
| Less than $5,000 | 29 (0.6%) | 93 (4.8%) |
| $5,000 to $9,999 | 1 (0.0%) | 18 (0.9%) |
| $10,000 to $14,999 | 70 (1.4%) | 78 (4.0%) |
| $15,000 to $19,999 | 15 (0.3%) | 89 (4.6%) |
| $20,000 to $24,999 | 130 (2.5%) | 16 (0.8%) |
| $25,000 to $34,999 | 158 (3.1%) | 177 (9.1%) |
| $35,000 to $49,999 | 266 (5.2%) | 234 (12.0%) |
| $50,000 to $74,999 | 991 (19.5%) | 296 (15.2%) |
| $75,000 to $99,999 | 727 (14.3%) | 423 (21.7%) |
| $100,000 to $149,999 | 1,369 (26.9%) | 279 (14.3%) |
| $150,000 or more | 1,337 (26.3%) | 245 (12.6%) |
| Total | 5,093 (100.0%) | 1,948 (100.0%) |
Monthly Housing Cost Tiers in Battle Ground
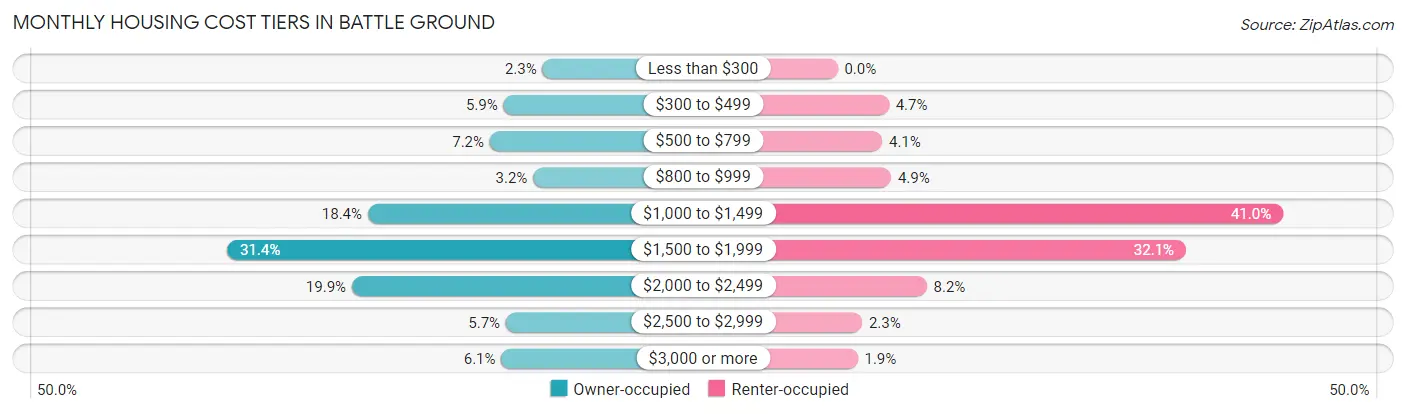
| Monthly Cost | Owner-occupied | Renter-occupied |
| Less than $300 | 118 (2.3%) | 0 (0.0%) |
| $300 to $499 | 301 (5.9%) | 92 (4.7%) |
| $500 to $799 | 365 (7.2%) | 80 (4.1%) |
| $800 to $999 | 162 (3.2%) | 96 (4.9%) |
| $1,000 to $1,499 | 937 (18.4%) | 799 (41.0%) |
| $1,500 to $1,999 | 1,597 (31.4%) | 625 (32.1%) |
| $2,000 to $2,499 | 1,012 (19.9%) | 160 (8.2%) |
| $2,500 to $2,999 | 290 (5.7%) | 44 (2.3%) |
| $3,000 or more | 311 (6.1%) | 36 (1.8%) |
| Total | 5,093 (100.0%) | 1,948 (100.0%) |
Physical Housing Characteristics in Battle Ground
Housing Structures in Battle Ground
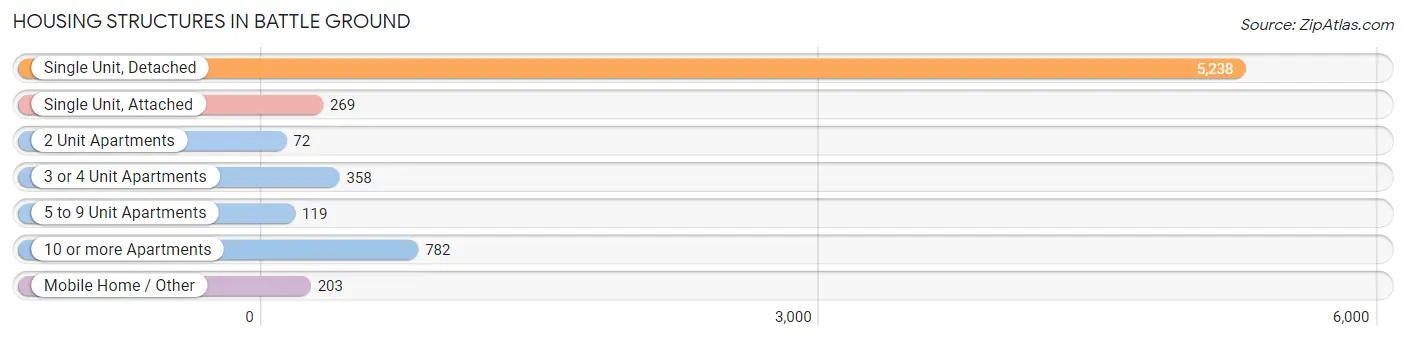
| Structure Type | # Housing Units | % Housing Units |
| Single Unit, Detached | 5,238 | 74.4% |
| Single Unit, Attached | 269 | 3.8% |
| 2 Unit Apartments | 72 | 1.0% |
| 3 or 4 Unit Apartments | 358 | 5.1% |
| 5 to 9 Unit Apartments | 119 | 1.7% |
| 10 or more Apartments | 782 | 11.1% |
| Mobile Home / Other | 203 | 2.9% |
| Total | 7,041 | 100.0% |
Housing Structures by Occupancy in Battle Ground
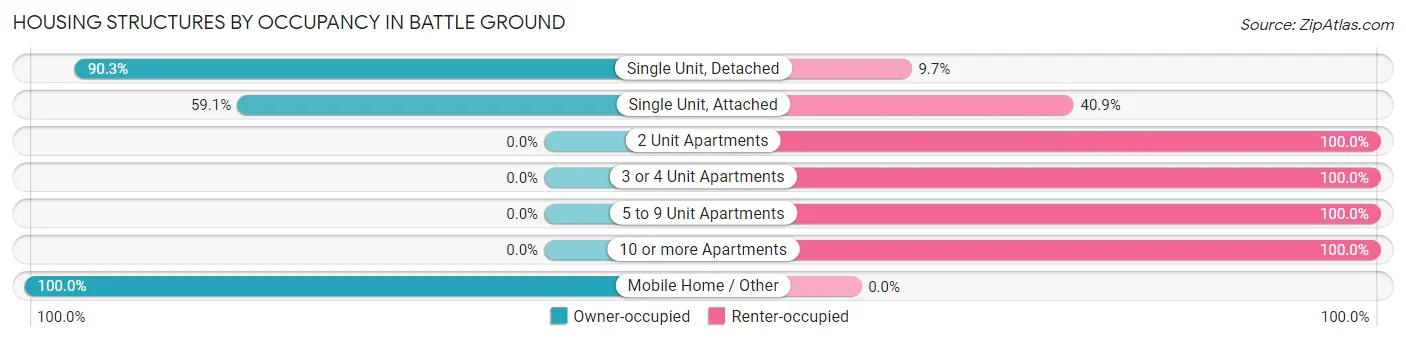
| Structure Type | Owner-occupied | Renter-occupied |
| Single Unit, Detached | 4,731 (90.3%) | 507 (9.7%) |
| Single Unit, Attached | 159 (59.1%) | 110 (40.9%) |
| 2 Unit Apartments | 0 (0.0%) | 72 (100.0%) |
| 3 or 4 Unit Apartments | 0 (0.0%) | 358 (100.0%) |
| 5 to 9 Unit Apartments | 0 (0.0%) | 119 (100.0%) |
| 10 or more Apartments | 0 (0.0%) | 782 (100.0%) |
| Mobile Home / Other | 203 (100.0%) | 0 (0.0%) |
| Total | 5,093 (72.3%) | 1,948 (27.7%) |
Housing Structures by Number of Rooms in Battle Ground
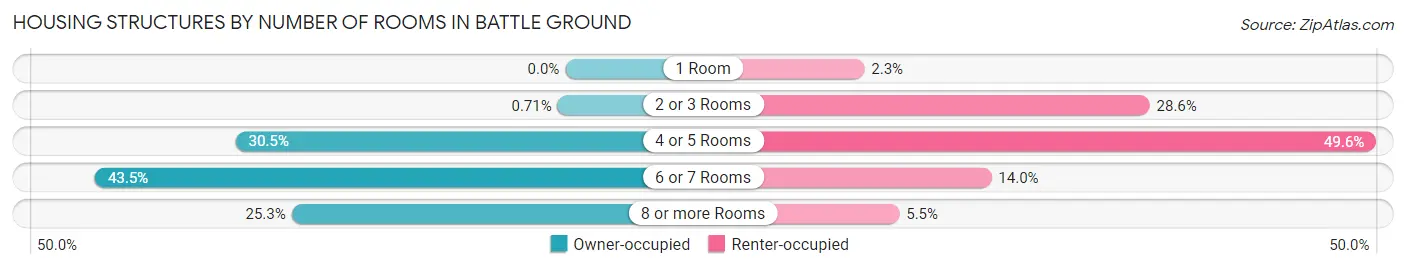
| Number of Rooms | Owner-occupied | Renter-occupied |
| 1 Room | 0 (0.0%) | 44 (2.3%) |
| 2 or 3 Rooms | 36 (0.7%) | 558 (28.6%) |
| 4 or 5 Rooms | 1,553 (30.5%) | 966 (49.6%) |
| 6 or 7 Rooms | 2,215 (43.5%) | 273 (14.0%) |
| 8 or more Rooms | 1,289 (25.3%) | 107 (5.5%) |
| Total | 5,093 (100.0%) | 1,948 (100.0%) |
Housing Structure by Heating Type in Battle Ground
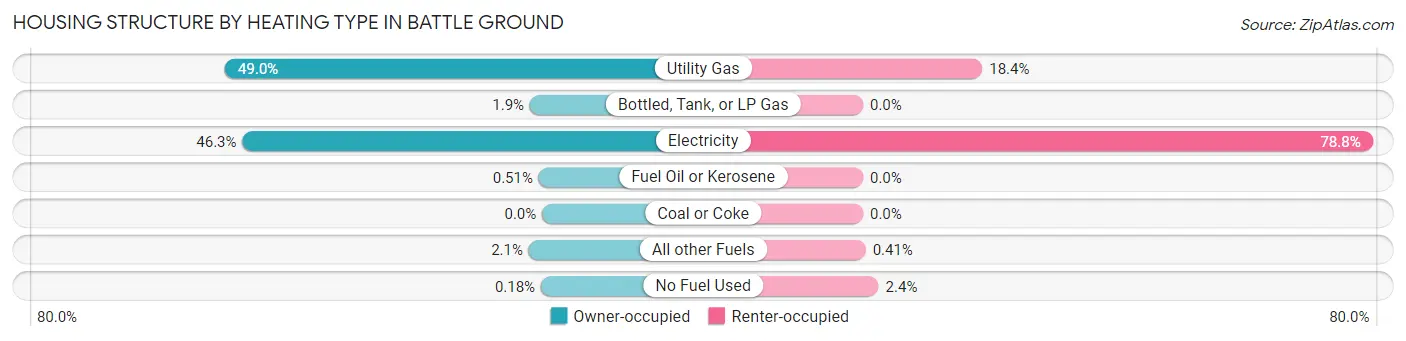
| Heating Type | Owner-occupied | Renter-occupied |
| Utility Gas | 2,497 (49.0%) | 359 (18.4%) |
| Bottled, Tank, or LP Gas | 96 (1.9%) | 0 (0.0%) |
| Electricity | 2,360 (46.3%) | 1,534 (78.7%) |
| Fuel Oil or Kerosene | 26 (0.5%) | 0 (0.0%) |
| Coal or Coke | 0 (0.0%) | 0 (0.0%) |
| All other Fuels | 105 (2.1%) | 8 (0.4%) |
| No Fuel Used | 9 (0.2%) | 47 (2.4%) |
| Total | 5,093 (100.0%) | 1,948 (100.0%) |
Household Vehicle Usage in Battle Ground
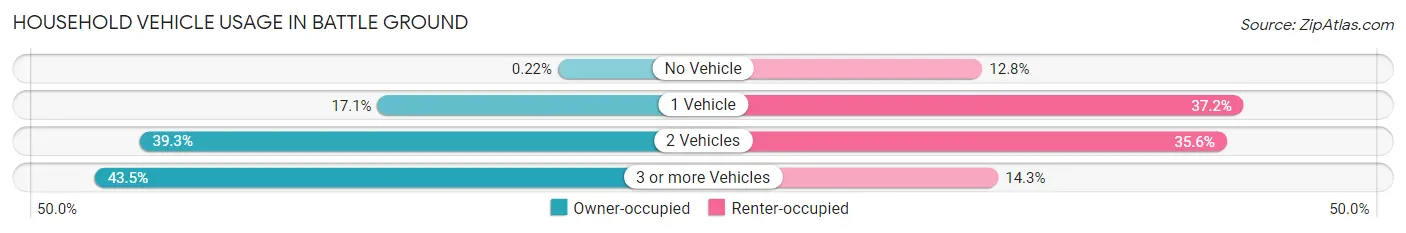
| Vehicles per Household | Owner-occupied | Renter-occupied |
| No Vehicle | 11 (0.2%) | 250 (12.8%) |
| 1 Vehicle | 869 (17.1%) | 725 (37.2%) |
| 2 Vehicles | 2,000 (39.3%) | 694 (35.6%) |
| 3 or more Vehicles | 2,213 (43.4%) | 279 (14.3%) |
| Total | 5,093 (100.0%) | 1,948 (100.0%) |
Real Estate & Mortgages in Battle Ground
Real Estate and Mortgage Overview in Battle Ground
| Characteristic | Without Mortgage | With Mortgage |
| Housing Units | 1,037 | 4,056 |
| Median Property Value | $409,900 | $416,500 |
| Median Household Income | $76,989 | $1,178 |
| Monthly Housing Costs | $552 | $311 |
| Real Estate Taxes | $2,705 | $125 |
Property Value by Mortgage Status in Battle Ground
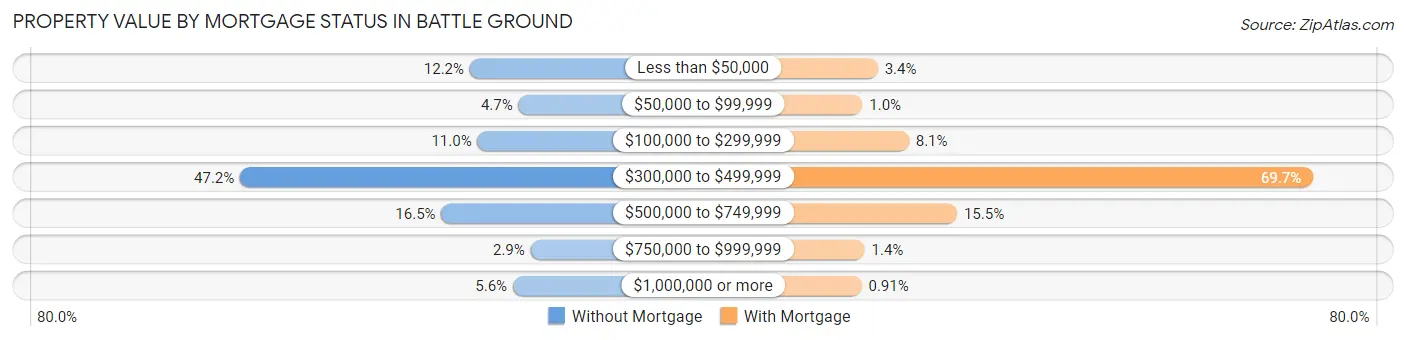
| Property Value | Without Mortgage | With Mortgage |
| Less than $50,000 | 126 (12.1%) | 137 (3.4%) |
| $50,000 to $99,999 | 49 (4.7%) | 42 (1.0%) |
| $100,000 to $299,999 | 114 (11.0%) | 329 (8.1%) |
| $300,000 to $499,999 | 489 (47.2%) | 2,828 (69.7%) |
| $500,000 to $749,999 | 171 (16.5%) | 627 (15.5%) |
| $750,000 to $999,999 | 30 (2.9%) | 56 (1.4%) |
| $1,000,000 or more | 58 (5.6%) | 37 (0.9%) |
| Total | 1,037 (100.0%) | 4,056 (100.0%) |
Household Income by Mortgage Status in Battle Ground
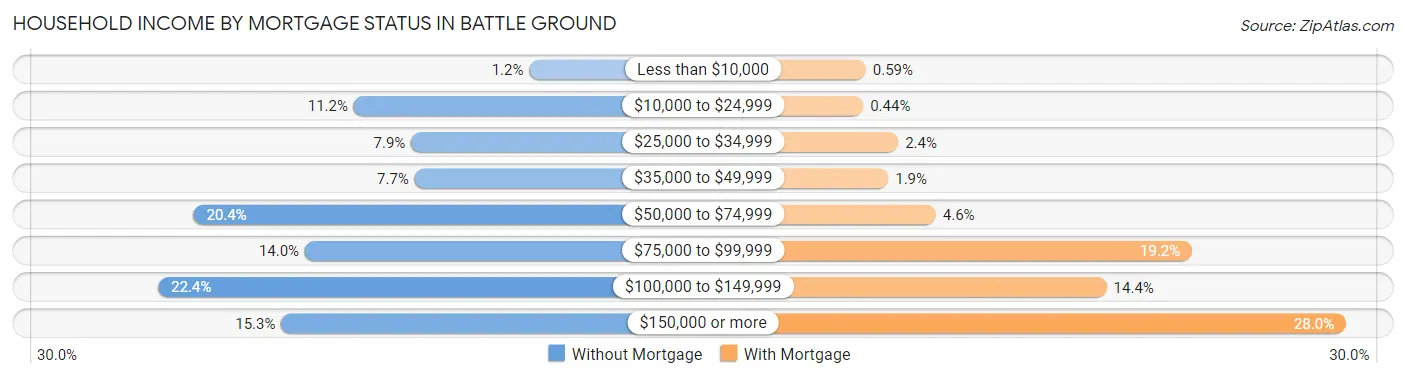
| Household Income | Without Mortgage | With Mortgage |
| Less than $10,000 | 12 (1.2%) | 24 (0.6%) |
| $10,000 to $24,999 | 116 (11.2%) | 18 (0.4%) |
| $25,000 to $34,999 | 82 (7.9%) | 99 (2.4%) |
| $35,000 to $49,999 | 80 (7.7%) | 76 (1.9%) |
| $50,000 to $74,999 | 211 (20.3%) | 186 (4.6%) |
| $75,000 to $99,999 | 145 (14.0%) | 780 (19.2%) |
| $100,000 to $149,999 | 232 (22.4%) | 582 (14.3%) |
| $150,000 or more | 159 (15.3%) | 1,137 (28.0%) |
| Total | 1,037 (100.0%) | 4,056 (100.0%) |
Property Value to Household Income Ratio in Battle Ground
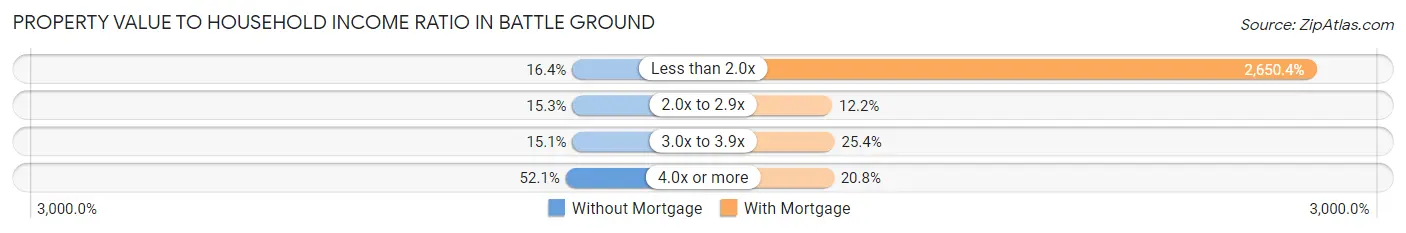
| Value-to-Income Ratio | Without Mortgage | With Mortgage |
| Less than 2.0x | 170 (16.4%) | 107,500 (2,650.4%) |
| 2.0x to 2.9x | 159 (15.3%) | 495 (12.2%) |
| 3.0x to 3.9x | 157 (15.1%) | 1,028 (25.4%) |
| 4.0x or more | 540 (52.1%) | 845 (20.8%) |
| Total | 1,037 (100.0%) | 4,056 (100.0%) |
Real Estate Taxes by Mortgage Status in Battle Ground
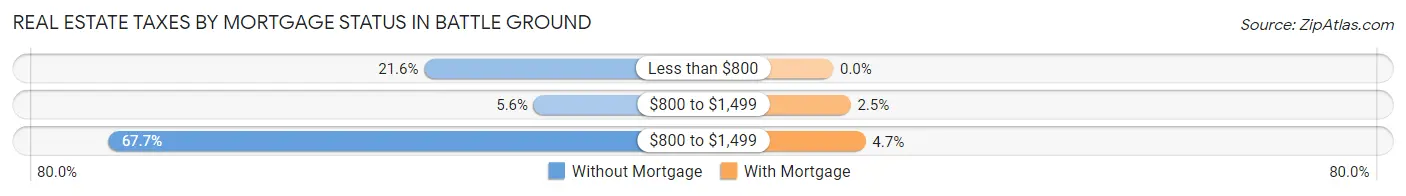
| Property Taxes | Without Mortgage | With Mortgage |
| Less than $800 | 224 (21.6%) | 0 (0.0%) |
| $800 to $1,499 | 58 (5.6%) | 103 (2.5%) |
| $800 to $1,499 | 702 (67.7%) | 192 (4.7%) |
| Total | 1,037 (100.0%) | 4,056 (100.0%) |
Health & Disability in Battle Ground
Health Insurance Coverage by Age in Battle Ground
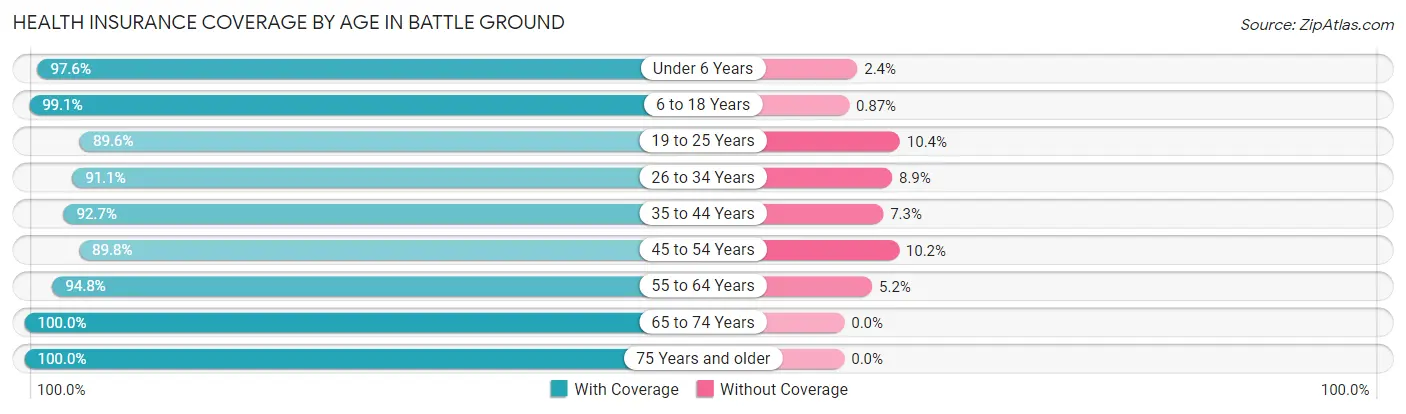
| Age Bracket | With Coverage | Without Coverage |
| Under 6 Years | 1,654 (97.6%) | 41 (2.4%) |
| 6 to 18 Years | 4,103 (99.1%) | 36 (0.9%) |
| 19 to 25 Years | 2,016 (89.6%) | 233 (10.4%) |
| 26 to 34 Years | 2,365 (91.1%) | 231 (8.9%) |
| 35 to 44 Years | 3,038 (92.7%) | 238 (7.3%) |
| 45 to 54 Years | 2,068 (89.8%) | 234 (10.2%) |
| 55 to 64 Years | 1,899 (94.8%) | 104 (5.2%) |
| 65 to 74 Years | 1,587 (100.0%) | 0 (0.0%) |
| 75 Years and older | 955 (100.0%) | 0 (0.0%) |
| Total | 19,685 (94.6%) | 1,117 (5.4%) |
Health Insurance Coverage by Citizenship Status in Battle Ground
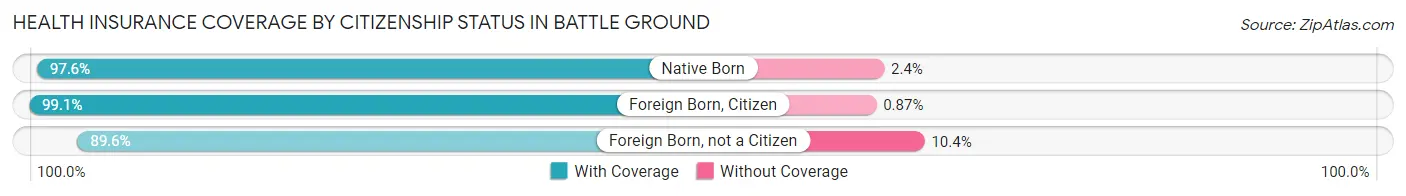
| Citizenship Status | With Coverage | Without Coverage |
| Native Born | 1,654 (97.6%) | 41 (2.4%) |
| Foreign Born, Citizen | 4,103 (99.1%) | 36 (0.9%) |
| Foreign Born, not a Citizen | 2,016 (89.6%) | 233 (10.4%) |
Health Insurance Coverage by Household Income in Battle Ground
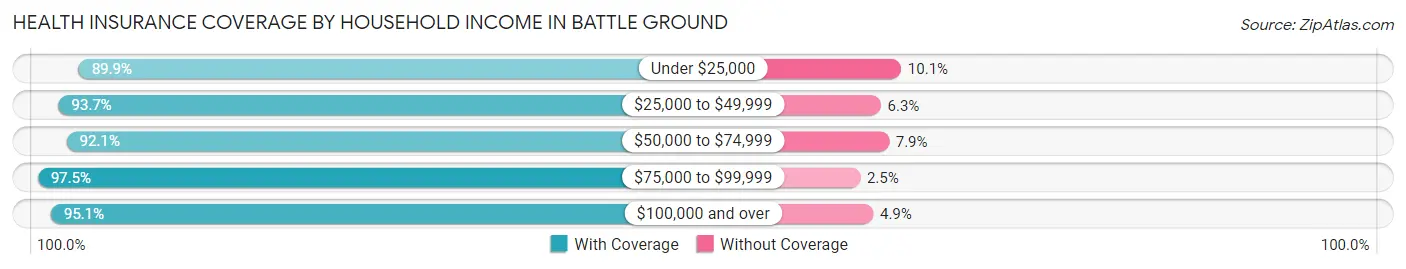
| Household Income | With Coverage | Without Coverage |
| Under $25,000 | 993 (89.9%) | 112 (10.1%) |
| $25,000 to $49,999 | 1,462 (93.7%) | 99 (6.3%) |
| $50,000 to $74,999 | 3,162 (92.1%) | 270 (7.9%) |
| $75,000 to $99,999 | 3,410 (97.5%) | 86 (2.5%) |
| $100,000 and over | 10,629 (95.1%) | 550 (4.9%) |
Public vs Private Health Insurance Coverage by Age in Battle Ground
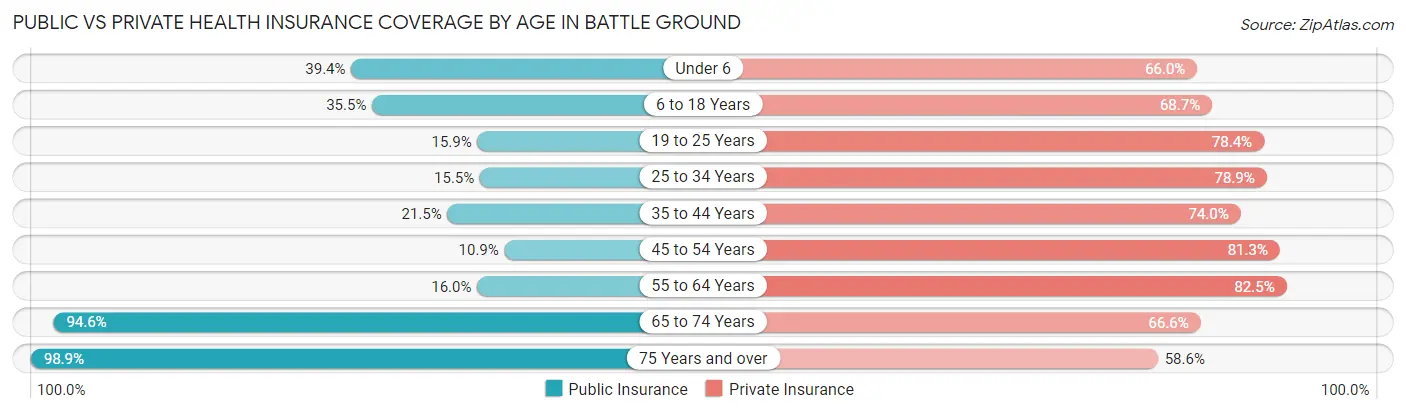
| Age Bracket | Public Insurance | Private Insurance |
| Under 6 | 667 (39.4%) | 1,118 (66.0%) |
| 6 to 18 Years | 1,468 (35.5%) | 2,844 (68.7%) |
| 19 to 25 Years | 358 (15.9%) | 1,762 (78.3%) |
| 25 to 34 Years | 401 (15.4%) | 2,047 (78.8%) |
| 35 to 44 Years | 704 (21.5%) | 2,425 (74.0%) |
| 45 to 54 Years | 251 (10.9%) | 1,871 (81.3%) |
| 55 to 64 Years | 320 (16.0%) | 1,653 (82.5%) |
| 65 to 74 Years | 1,502 (94.6%) | 1,057 (66.6%) |
| 75 Years and over | 944 (98.9%) | 560 (58.6%) |
| Total | 6,615 (31.8%) | 15,337 (73.7%) |
Disability Status by Sex by Age in Battle Ground
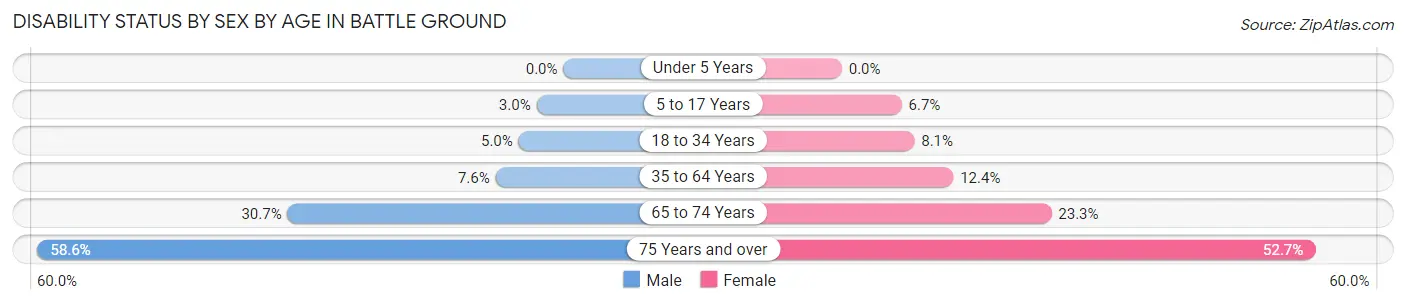
| Age Bracket | Male | Female |
| Under 5 Years | 0 (0.0%) | 0 (0.0%) |
| 5 to 17 Years | 55 (3.0%) | 145 (6.7%) |
| 18 to 34 Years | 139 (5.0%) | 189 (8.1%) |
| 35 to 64 Years | 284 (7.5%) | 474 (12.4%) |
| 65 to 74 Years | 219 (30.7%) | 204 (23.3%) |
| 75 Years and over | 246 (58.6%) | 282 (52.7%) |
Disability Class by Sex by Age in Battle Ground
Disability Class: Hearing Difficulty
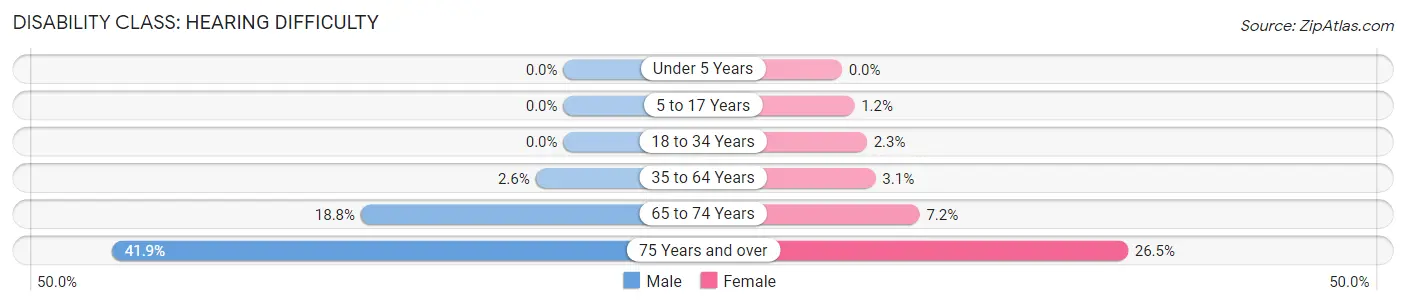
| Age Bracket | Male | Female |
| Under 5 Years | 0 (0.0%) | 0 (0.0%) |
| 5 to 17 Years | 0 (0.0%) | 25 (1.1%) |
| 18 to 34 Years | 0 (0.0%) | 54 (2.3%) |
| 35 to 64 Years | 97 (2.6%) | 119 (3.1%) |
| 65 to 74 Years | 134 (18.8%) | 63 (7.2%) |
| 75 Years and over | 176 (41.9%) | 142 (26.5%) |
Disability Class: Vision Difficulty
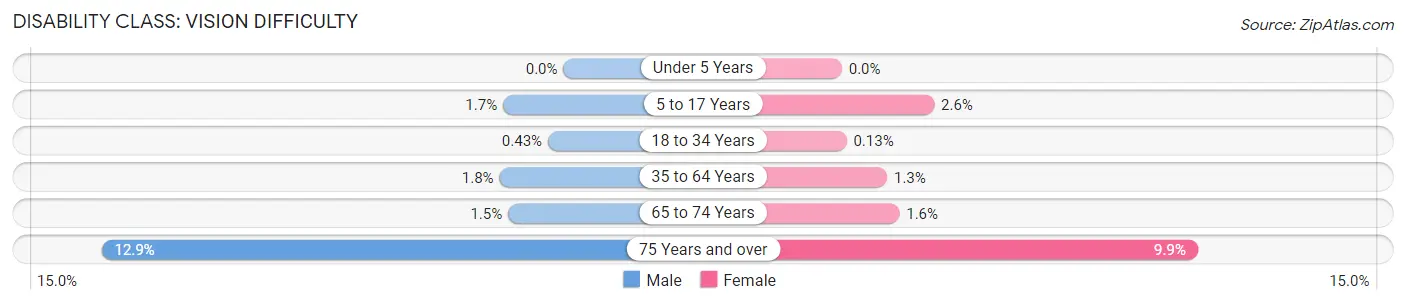
| Age Bracket | Male | Female |
| Under 5 Years | 0 (0.0%) | 0 (0.0%) |
| 5 to 17 Years | 31 (1.7%) | 56 (2.6%) |
| 18 to 34 Years | 12 (0.4%) | 3 (0.1%) |
| 35 to 64 Years | 67 (1.8%) | 48 (1.3%) |
| 65 to 74 Years | 11 (1.5%) | 14 (1.6%) |
| 75 Years and over | 54 (12.9%) | 53 (9.9%) |
Disability Class: Cognitive Difficulty
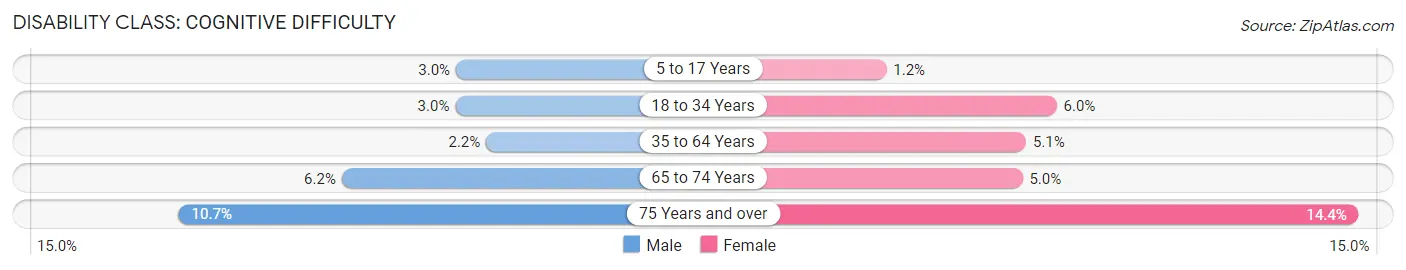
| Age Bracket | Male | Female |
| 5 to 17 Years | 55 (3.0%) | 27 (1.2%) |
| 18 to 34 Years | 84 (3.0%) | 140 (6.0%) |
| 35 to 64 Years | 81 (2.1%) | 196 (5.1%) |
| 65 to 74 Years | 44 (6.2%) | 44 (5.0%) |
| 75 Years and over | 45 (10.7%) | 77 (14.4%) |
Disability Class: Ambulatory Difficulty
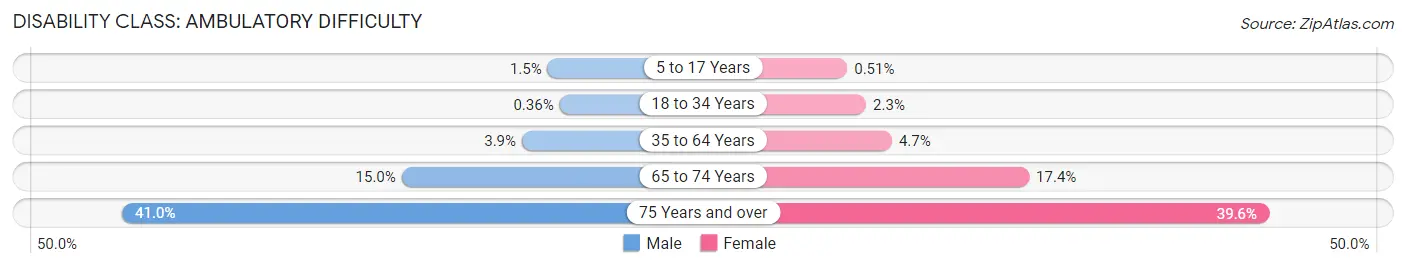
| Age Bracket | Male | Female |
| 5 to 17 Years | 27 (1.5%) | 11 (0.5%) |
| 18 to 34 Years | 10 (0.4%) | 53 (2.3%) |
| 35 to 64 Years | 145 (3.8%) | 178 (4.7%) |
| 65 to 74 Years | 107 (15.0%) | 152 (17.4%) |
| 75 Years and over | 172 (40.9%) | 212 (39.6%) |
Disability Class: Self-Care Difficulty
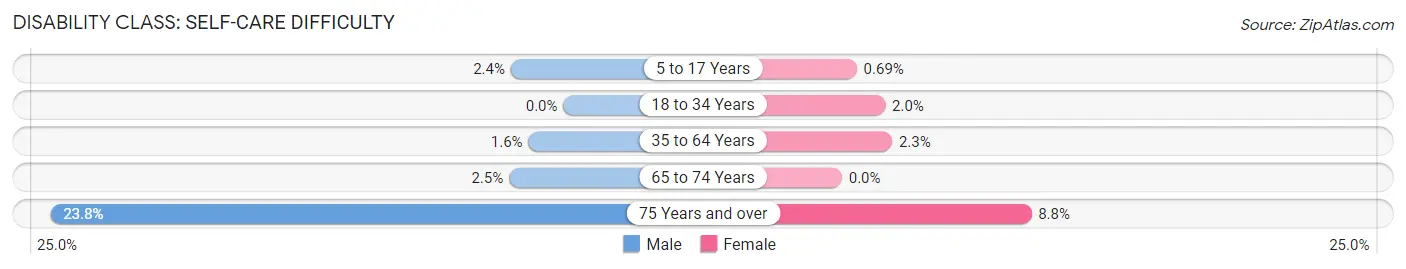
| Age Bracket | Male | Female |
| 5 to 17 Years | 45 (2.4%) | 15 (0.7%) |
| 18 to 34 Years | 0 (0.0%) | 47 (2.0%) |
| 35 to 64 Years | 61 (1.6%) | 89 (2.3%) |
| 65 to 74 Years | 18 (2.5%) | 0 (0.0%) |
| 75 Years and over | 100 (23.8%) | 47 (8.8%) |
Technology Access in Battle Ground
Computing Device Access in Battle Ground
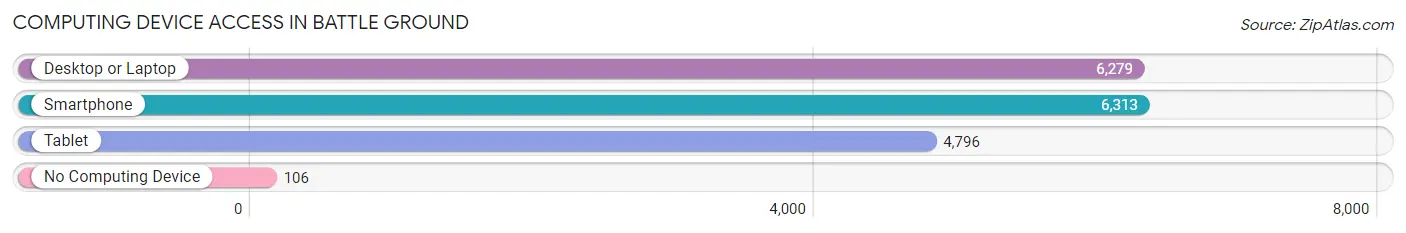
| Device Type | # Households | % Households |
| Desktop or Laptop | 6,279 | 89.2% |
| Smartphone | 6,313 | 89.7% |
| Tablet | 4,796 | 68.1% |
| No Computing Device | 106 | 1.5% |
| Total | 7,041 | 100.0% |
Internet Access in Battle Ground
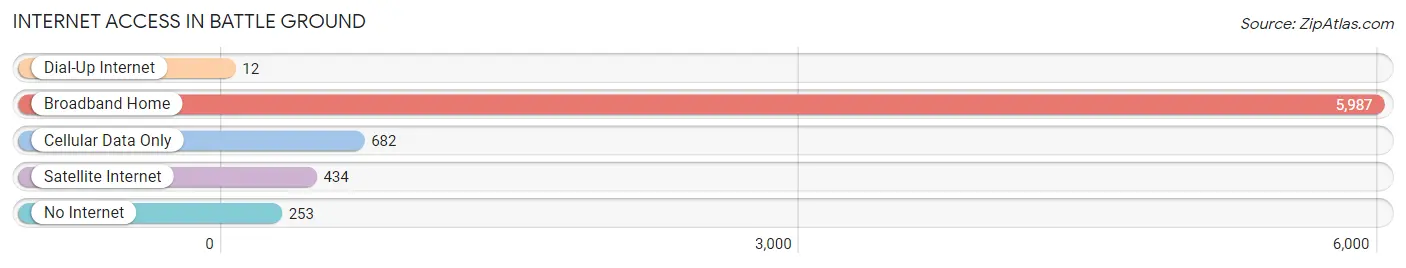
| Internet Type | # Households | % Households |
| Dial-Up Internet | 12 | 0.2% |
| Broadband Home | 5,987 | 85.0% |
| Cellular Data Only | 682 | 9.7% |
| Satellite Internet | 434 | 6.2% |
| No Internet | 253 | 3.6% |
| Total | 7,041 | 100.0% |
Battle Ground Summary
Battle Ground, Washington is a city located in Clark County, Washington, United States. The city is located in the foothills of the Cascade Mountains, approximately 20 miles north of Portland, Oregon. As of the 2010 census, the population of Battle Ground was 17,571.
History
The area that is now Battle Ground was originally inhabited by the Chinook and Klickitat Native American tribes. The first non-native settlers arrived in the area in the early 1850s. The area was originally known as “Battleground Prairie” due to the frequent skirmishes between the Native American tribes and the settlers.
In 1855, the area was officially incorporated as the town of Battle Ground. The town was named after the nearby Battle Ground Lake, which was named after the frequent skirmishes between the Native American tribes and the settlers.
In 1891, the town was officially incorporated as a city. The city was named after the nearby Battle Ground Lake, which was named after the frequent skirmishes between the Native American tribes and the settlers.
Geography
Battle Ground is located in Clark County, Washington, United States. The city is located in the foothills of the Cascade Mountains, approximately 20 miles north of Portland, Oregon. The city is situated at the confluence of the Lewis and Clark Rivers.
The city has a total area of 5.3 square miles, all of which is land. The city is located at an elevation of approximately 500 feet above sea level.
Economy
The economy of Battle Ground is largely based on agriculture and manufacturing. The city is home to several large agricultural operations, including dairy farms, fruit orchards, and vegetable farms. The city is also home to several manufacturing companies, including a paper mill, a wood products plant, and a metal fabrication plant.
The city is also home to several retail stores, restaurants, and other businesses. The city is also home to several medical facilities, including a hospital and several clinics.
Demographics
As of the 2010 census, the population of Battle Ground was 17,571. The racial makeup of the city was 87.3% White, 0.7% African American, 1.2% Native American, 1.7% Asian, 0.2% Pacific Islander, 5.7% from other races, and 3.2% from two or more races. Hispanic or Latino of any race were 11.2% of the population.
The median income for a household in the city was $50,945, and the median income for a family was $60,945. The per capita income for the city was $22,945. About 8.3% of families and 11.2% of the population were below the poverty line, including 15.2% of those under age 18 and 8.2% of those age 65 or over.
Common Questions
What is Per Capita Income in Battle Ground?
Per Capita income in Battle Ground is $37,287.
What is the Median Family Income in Battle Ground?
Median Family Income in Battle Ground is $97,199.
What is the Median Household income in Battle Ground?
Median Household Income in Battle Ground is $94,360.
What is Income or Wage Gap in Battle Ground?
Income or Wage Gap in Battle Ground is 33.2%.
Women in Battle Ground earn 66.8 cents for every dollar earned by a man.
What is Inequality or Gini Index in Battle Ground?
Inequality or Gini Index in Battle Ground is 0.36.
What is the Total Population of Battle Ground?
Total Population of Battle Ground is 20,888.
What is the Total Male Population of Battle Ground?
Total Male Population of Battle Ground is 10,361.
What is the Total Female Population of Battle Ground?
Total Female Population of Battle Ground is 10,527.
What is the Ratio of Males per 100 Females in Battle Ground?
There are 98.42 Males per 100 Females in Battle Ground.
What is the Ratio of Females per 100 Males in Battle Ground?
There are 101.60 Females per 100 Males in Battle Ground.
What is the Median Population Age in Battle Ground?
Median Population Age in Battle Ground is 33.8 Years.
What is the Average Family Size in Battle Ground
Average Family Size in Battle Ground is 3.4 People.
What is the Average Household Size in Battle Ground
Average Household Size in Battle Ground is 3.0 People.
How Large is the Labor Force in Battle Ground?
There are 10,379 People in the Labor Forcein in Battle Ground.
What is the Percentage of People in the Labor Force in Battle Ground?
64.6% of People are in the Labor Force in Battle Ground.
What is the Unemployment Rate in Battle Ground?
Unemployment Rate in Battle Ground is 4.3%.