Cities with the Lowest Poverty Level Among Children Under the Age of 5 in Michigan
RELATED REPORTS & OPTIONS
Lowest Poverty | Child 0-5
Michigan
Compare Cities
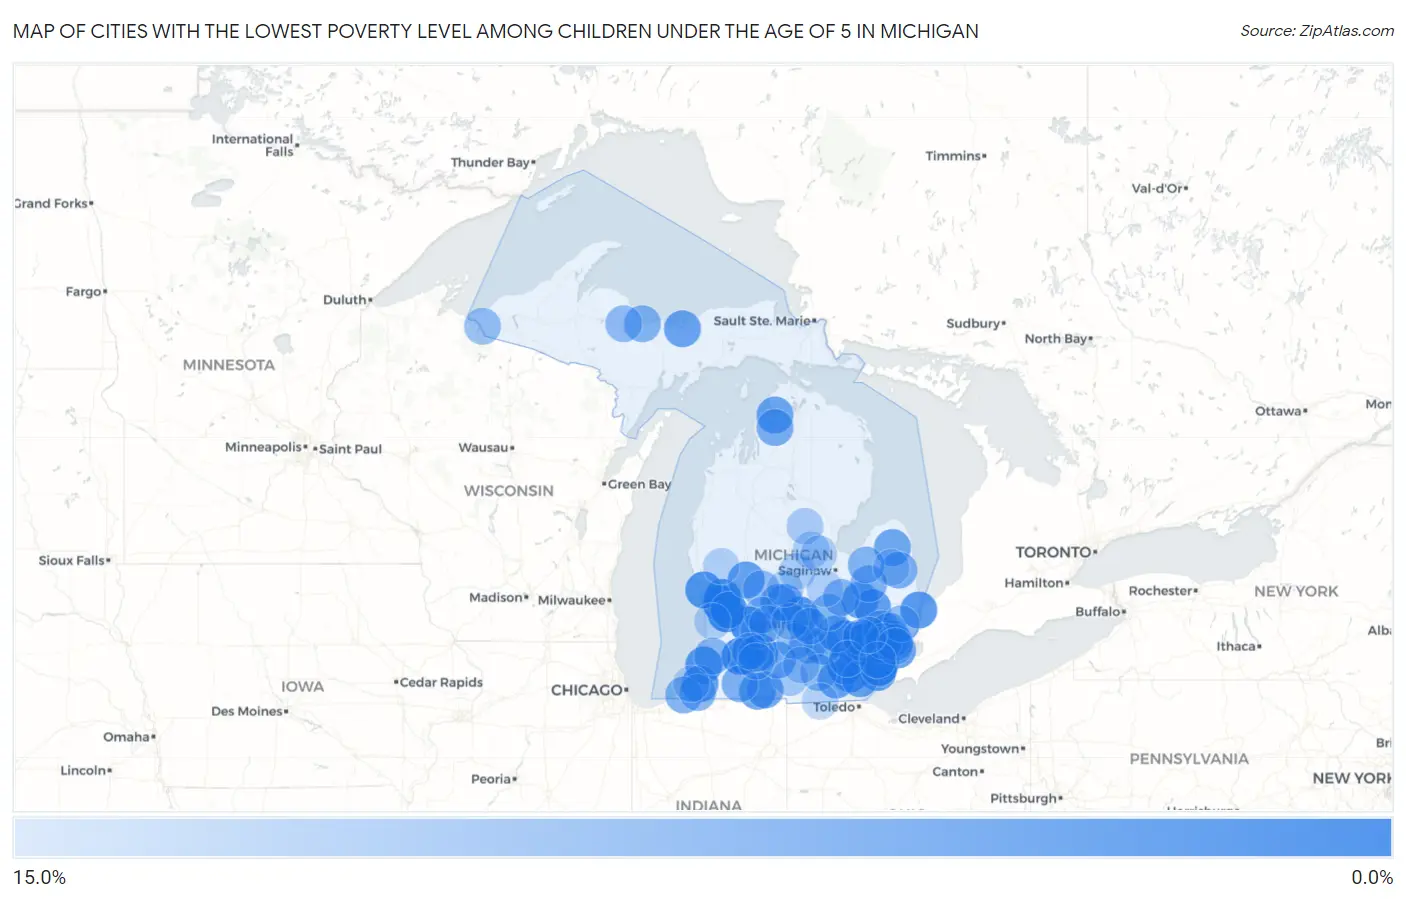
Map of Cities with the Lowest Poverty Level Among Children Under the Age of 5 in Michigan
15.0%
0.0%
Cities with the Lowest Poverty Level Among Children Under the Age of 5 in Michigan
| City | Child Poverty | vs State | vs National | |
| 1. | Farmington Hills | 0.41% | 20.1%(-19.7)#1 | 18.1%(-17.7)#13 |
| 2. | Royal Oak | 0.94% | 20.1%(-19.2)#2 | 18.1%(-17.1)#91 |
| 3. | Hudsonville | 1.4% | 20.1%(-18.7)#3 | 18.1%(-16.7)#175 |
| 4. | Allendale | 1.6% | 20.1%(-18.5)#4 | 18.1%(-16.5)#224 |
| 5. | Middleville | 1.8% | 20.1%(-18.3)#5 | 18.1%(-16.3)#284 |
| 6. | Westwood | 1.8% | 20.1%(-18.3)#6 | 18.1%(-16.2)#294 |
| 7. | Dewitt | 2.2% | 20.1%(-17.9)#7 | 18.1%(-15.8)#417 |
| 8. | Brighton | 2.2% | 20.1%(-17.9)#8 | 18.1%(-15.8)#424 |
| 9. | Coopersville | 2.3% | 20.1%(-17.9)#9 | 18.1%(-15.8)#428 |
| 10. | Northville | 2.5% | 20.1%(-17.7)#10 | 18.1%(-15.6)#491 |
| 11. | Norton Shores | 2.5% | 20.1%(-17.6)#11 | 18.1%(-15.6)#506 |
| 12. | Plymouth | 2.6% | 20.1%(-17.5)#12 | 18.1%(-15.5)#544 |
| 13. | Farmington | 2.7% | 20.1%(-17.4)#13 | 18.1%(-15.3)#595 |
| 14. | Jenison | 2.8% | 20.1%(-17.3)#14 | 18.1%(-15.3)#624 |
| 15. | Birmingham | 2.8% | 20.1%(-17.3)#15 | 18.1%(-15.2)#641 |
| 16. | Wixom | 2.9% | 20.1%(-17.2)#16 | 18.1%(-15.2)#666 |
| 17. | Milan | 3.1% | 20.1%(-17.0)#17 | 18.1%(-15.0)#737 |
| 18. | Watervliet | 3.1% | 20.1%(-17.0)#18 | 18.1%(-15.0)#739 |
| 19. | Marysville | 3.2% | 20.1%(-16.9)#19 | 18.1%(-14.8)#798 |
| 20. | Level Park Oak Park | 3.3% | 20.1%(-16.8)#20 | 18.1%(-14.7)#851 |
| 21. | Gibraltar | 3.6% | 20.1%(-16.6)#21 | 18.1%(-14.5)#936 |
| 22. | Davison | 3.7% | 20.1%(-16.4)#22 | 18.1%(-14.3)#1,012 |
| 23. | Center Line | 3.7% | 20.1%(-16.4)#23 | 18.1%(-14.3)#1,019 |
| 24. | Metamora | 3.8% | 20.1%(-16.3)#24 | 18.1%(-14.3)#1,036 |
| 25. | Grosse Pointe Farms | 3.9% | 20.1%(-16.2)#25 | 18.1%(-14.1)#1,099 |
| 26. | Trenton | 4.1% | 20.1%(-16.0)#26 | 18.1%(-14.0)#1,160 |
| 27. | Tecumseh | 4.2% | 20.1%(-16.0)#27 | 18.1%(-13.9)#1,186 |
| 28. | Sand Lake | 4.2% | 20.1%(-16.0)#28 | 18.1%(-13.9)#1,206 |
| 29. | Saline | 4.3% | 20.1%(-15.8)#29 | 18.1%(-13.8)#1,242 |
| 30. | Maybee | 4.3% | 20.1%(-15.8)#30 | 18.1%(-13.7)#1,274 |
| 31. | Berrien Springs | 4.4% | 20.1%(-15.7)#31 | 18.1%(-13.7)#1,291 |
| 32. | Munising | 4.5% | 20.1%(-15.6)#32 | 18.1%(-13.6)#1,333 |
| 33. | Livonia | 4.6% | 20.1%(-15.5)#33 | 18.1%(-13.4)#1,393 |
| 34. | Novi | 4.6% | 20.1%(-15.5)#34 | 18.1%(-13.4)#1,396 |
| 35. | Petoskey | 4.7% | 20.1%(-15.5)#35 | 18.1%(-13.4)#1,408 |
| 36. | Burr Oak | 4.8% | 20.1%(-15.4)#36 | 18.1%(-13.3)#1,449 |
| 37. | Ecorse | 4.9% | 20.1%(-15.2)#37 | 18.1%(-13.1)#1,533 |
| 38. | Ubly | 5.0% | 20.1%(-15.1)#38 | 18.1%(-13.1)#1,566 |
| 39. | Leslie | 5.0% | 20.1%(-15.1)#39 | 18.1%(-13.0)#1,588 |
| 40. | Bronson | 5.0% | 20.1%(-15.1)#40 | 18.1%(-13.0)#1,589 |
| 41. | Stockbridge | 5.1% | 20.1%(-15.0)#41 | 18.1%(-12.9)#1,628 |
| 42. | Muir | 5.3% | 20.1%(-14.9)#42 | 18.1%(-12.8)#1,690 |
| 43. | Troy | 5.4% | 20.1%(-14.7)#43 | 18.1%(-12.7)#1,738 |
| 44. | Marshall | 5.4% | 20.1%(-14.7)#44 | 18.1%(-12.6)#1,760 |
| 45. | Palo | 5.6% | 20.1%(-14.6)#45 | 18.1%(-12.5)#1,816 |
| 46. | Howell | 5.7% | 20.1%(-14.5)#46 | 18.1%(-12.4)#1,856 |
| 47. | Eastwood | 5.7% | 20.1%(-14.4)#47 | 18.1%(-12.3)#1,885 |
| 48. | Boyne City | 5.8% | 20.1%(-14.3)#48 | 18.1%(-12.3)#1,909 |
| 49. | East Lansing | 5.8% | 20.1%(-14.3)#49 | 18.1%(-12.2)#1,921 |
| 50. | Rochester Hills | 5.9% | 20.1%(-14.2)#50 | 18.1%(-12.2)#1,954 |
| 51. | Sandusky | 6.0% | 20.1%(-14.1)#51 | 18.1%(-12.0)#1,993 |
| 52. | Pewamo | 6.1% | 20.1%(-14.1)#52 | 18.1%(-12.0)#2,009 |
| 53. | Fraser | 6.2% | 20.1%(-13.9)#53 | 18.1%(-11.9)#2,060 |
| 54. | Utica | 6.2% | 20.1%(-13.9)#54 | 18.1%(-11.8)#2,084 |
| 55. | Ferndale | 6.3% | 20.1%(-13.8)#55 | 18.1%(-11.8)#2,122 |
| 56. | Riverview | 6.3% | 20.1%(-13.8)#56 | 18.1%(-11.7)#2,137 |
| 57. | Three Oaks | 6.4% | 20.1%(-13.7)#57 | 18.1%(-11.7)#2,147 |
| 58. | Fostoria | 6.4% | 20.1%(-13.7)#58 | 18.1%(-11.7)#2,159 |
| 59. | Three Rivers | 6.5% | 20.1%(-13.6)#59 | 18.1%(-11.5)#2,210 |
| 60. | Caro | 6.8% | 20.1%(-13.4)#60 | 18.1%(-11.3)#2,305 |
| 61. | Harvey | 6.9% | 20.1%(-13.3)#61 | 18.1%(-11.2)#2,351 |
| 62. | Buchanan | 6.9% | 20.1%(-13.3)#62 | 18.1%(-11.2)#2,357 |
| 63. | Bancroft | 6.9% | 20.1%(-13.2)#63 | 18.1%(-11.2)#2,376 |
| 64. | Madison Heights | 7.1% | 20.1%(-13.1)#64 | 18.1%(-11.0)#2,443 |
| 65. | Flushing | 7.1% | 20.1%(-13.1)#65 | 18.1%(-11.0)#2,447 |
| 66. | Bangor | 7.1% | 20.1%(-13.0)#66 | 18.1%(-11.0)#2,459 |
| 67. | Brooklyn | 7.3% | 20.1%(-12.8)#67 | 18.1%(-10.7)#2,557 |
| 68. | Ishpeming | 7.7% | 20.1%(-12.4)#68 | 18.1%(-10.3)#2,739 |
| 69. | Hastings | 7.8% | 20.1%(-12.3)#69 | 18.1%(-10.2)#2,782 |
| 70. | Greenville | 7.9% | 20.1%(-12.2)#70 | 18.1%(-10.2)#2,789 |
| 71. | St Clair Shores | 8.0% | 20.1%(-12.1)#71 | 18.1%(-10.1)#2,823 |
| 72. | Ironwood | 8.1% | 20.1%(-12.0)#72 | 18.1%(-9.97)#2,863 |
| 73. | Wolverine Lake | 8.1% | 20.1%(-12.0)#73 | 18.1%(-9.97)#2,866 |
| 74. | New Haven | 8.2% | 20.1%(-11.9)#74 | 18.1%(-9.83)#2,920 |
| 75. | Clarksville | 8.3% | 20.1%(-11.8)#75 | 18.1%(-9.73)#2,980 |
| 76. | Eaton Rapids | 8.4% | 20.1%(-11.8)#76 | 18.1%(-9.70)#2,992 |
| 77. | Ann Arbor | 8.4% | 20.1%(-11.7)#77 | 18.1%(-9.67)#3,003 |
| 78. | Grosse Pointe Woods | 8.5% | 20.1%(-11.6)#78 | 18.1%(-9.54)#3,056 |
| 79. | Augusta | 8.6% | 20.1%(-11.5)#79 | 18.1%(-9.49)#3,072 |
| 80. | Woodland | 9.1% | 20.1%(-11.0)#80 | 18.1%(-8.97)#3,295 |
| 81. | Chassell | 9.2% | 20.1%(-10.9)#81 | 18.1%(-8.83)#3,366 |
| 82. | Litchfield | 9.4% | 20.1%(-10.7)#82 | 18.1%(-8.69)#3,416 |
| 83. | Allen Park | 9.5% | 20.1%(-10.6)#83 | 18.1%(-8.55)#3,460 |
| 84. | Richland | 9.7% | 20.1%(-10.4)#84 | 18.1%(-8.39)#3,533 |
| 85. | Grand Ledge | 9.9% | 20.1%(-10.2)#85 | 18.1%(-8.15)#3,609 |
| 86. | Spring Arbor | 10.0% | 20.1%(-10.1)#86 | 18.1%(-8.06)#3,628 |
| 87. | Sanford | 10.0% | 20.1%(-10.1)#87 | 18.1%(-8.06)#3,644 |
| 88. | Gladwin | 10.1% | 20.1%(-10.0)#88 | 18.1%(-7.98)#3,696 |
| 89. | Okemos | 10.2% | 20.1%(-9.88)#89 | 18.1%(-7.82)#3,747 |
| 90. | St Louis | 10.2% | 20.1%(-9.88)#90 | 18.1%(-7.82)#3,749 |
| 91. | Carson City | 10.3% | 20.1%(-9.77)#91 | 18.1%(-7.72)#3,791 |
| 92. | Holland | 10.5% | 20.1%(-9.64)#92 | 18.1%(-7.58)#3,842 |
| 93. | Midland | 10.5% | 20.1%(-9.60)#93 | 18.1%(-7.54)#3,851 |
| 94. | Fremont | 10.5% | 20.1%(-9.59)#94 | 18.1%(-7.54)#3,856 |
| 95. | Snover | 10.5% | 20.1%(-9.59)#95 | 18.1%(-7.54)#3,885 |
| 96. | Chesaning | 10.6% | 20.1%(-9.48)#96 | 18.1%(-7.42)#3,915 |
| 97. | Orchard Lake Village | 10.7% | 20.1%(-9.42)#97 | 18.1%(-7.37)#3,934 |
| 98. | Climax | 10.7% | 20.1%(-9.41)#98 | 18.1%(-7.35)#3,940 |
| 99. | Morenci | 11.0% | 20.1%(-9.10)#99 | 18.1%(-7.05)#4,045 |
| 100. | Baroda | 11.1% | 20.1%(-9.01)#100 | 18.1%(-6.95)#4,087 |
Common Questions
What are the Top 10 Cities with the Lowest Poverty Level Among Children Under the Age of 5 in Michigan?
Top 10 Cities with the Lowest Poverty Level Among Children Under the Age of 5 in Michigan are:
#1
0.41%
#2
0.94%
#3
1.4%
#4
1.6%
#5
1.8%
#6
1.8%
#7
2.2%
#8
2.2%
#9
2.3%
#10
2.5%
What city has the Lowest Poverty Level Among Children Under the Age of 5 in Michigan?
Farmington Hills has the Lowest Poverty Level Among Children Under the Age of 5 in Michigan with 0.41%.
What is the Poverty Level Among Children Under the Age of 5 in the State of Michigan?
Poverty Level Among Children Under the Age of 5 in Michigan is 20.1%.
What is the Poverty Level Among Children Under the Age of 5 in the United States?
Poverty Level Among Children Under the Age of 5 in the United States is 18.1%.