Puyallup, WA Map & Demographics
Puyallup Map
Puyallup Overview
$42,541
PER CAPITA INCOME
$109,877
AVG FAMILY INCOME
$90,592
AVG HOUSEHOLD INCOME
27.9%
WAGE / INCOME GAP [ % ]
72.1¢/ $1
WAGE / INCOME GAP [ $ ]
$12,504
FAMILY INCOME DEFICIT
0.39
INEQUALITY / GINI INDEX
42,610
TOTAL POPULATION
20,572
MALE POPULATION
22,038
FEMALE POPULATION
93.35
MALES / 100 FEMALES
107.13
FEMALES / 100 MALES
36.9
MEDIAN AGE
3.1
AVG FAMILY SIZE
2.5
AVG HOUSEHOLD SIZE
22,643
LABOR FORCE [ PEOPLE ]
66.0%
PERCENT IN LABOR FORCE
6.3%
UNEMPLOYMENT RATE
Puyallup Area Codes
Income in Puyallup
Income Overview in Puyallup
Per Capita Income in Puyallup is $42,541, while median incomes of families and households are $109,877 and $90,592 respectively.
| Characteristic | Number | Measure |
| Per Capita Income | 42,610 | $42,541 |
| Median Family Income | 10,200 | $109,877 |
| Mean Family Income | 10,200 | $124,871 |
| Median Household Income | 16,583 | $90,592 |
| Mean Household Income | 16,583 | $106,806 |
| Income Deficit | 10,200 | $12,504 |
| Wage / Income Gap (%) | 42,610 | 27.89% |
| Wage / Income Gap ($) | 42,610 | 72.11¢ per $1 |
| Gini / Inequality Index | 42,610 | 0.39 |
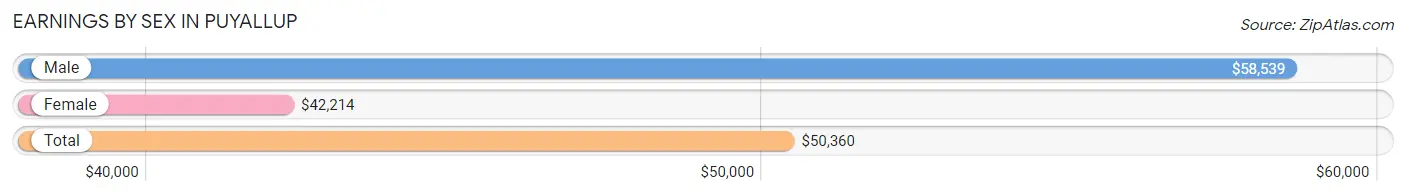
Earnings by Sex in Puyallup
Average Earnings in Puyallup are $50,360, $58,539 for men and $42,214 for women, a difference of 27.9%.
| Sex | Number | Average Earnings |
| Male | 12,462 (52.6%) | $58,539 |
| Female | 11,230 (47.4%) | $42,214 |
| Total | 23,692 (100.0%) | $50,360 |
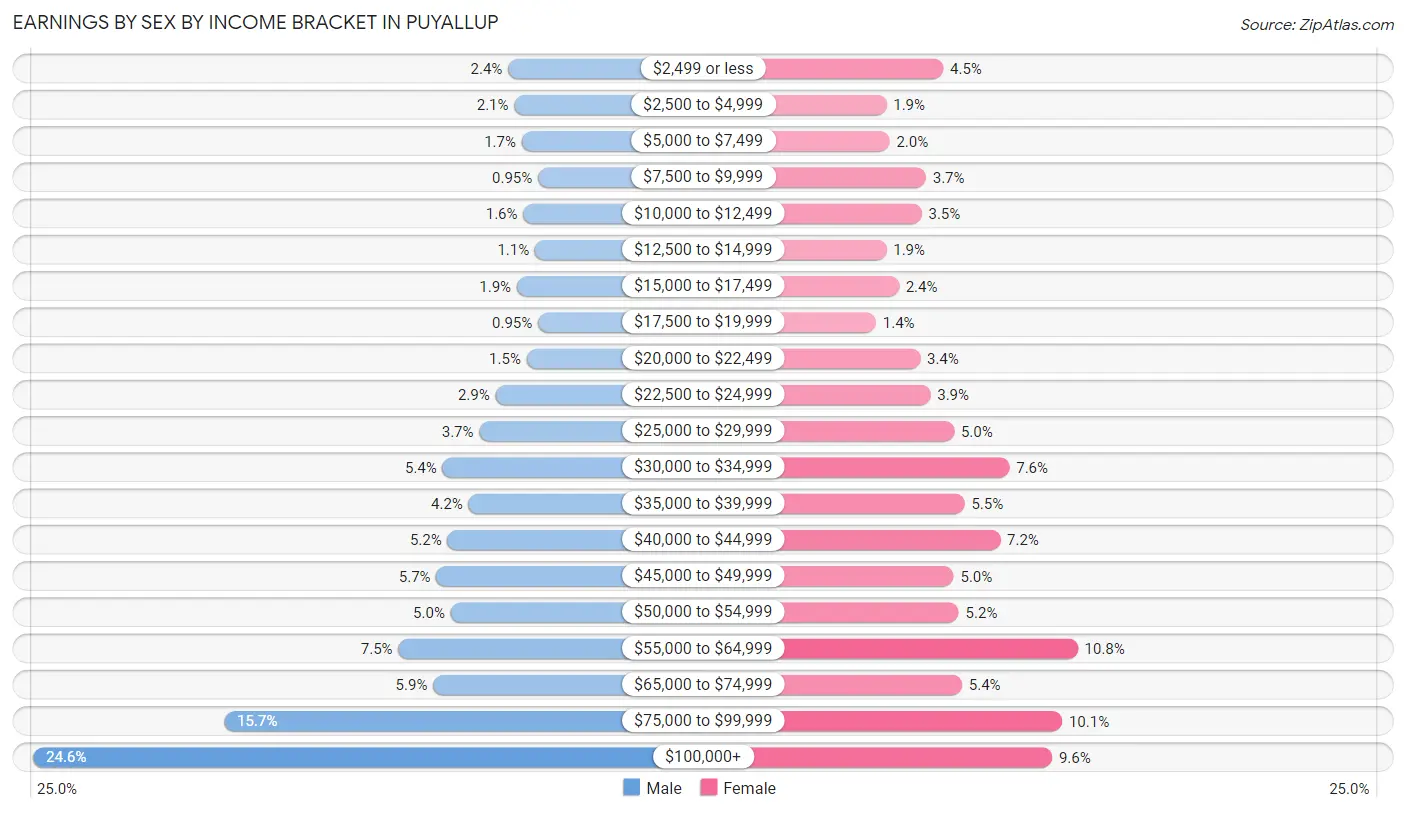
Earnings by Sex by Income Bracket in Puyallup
The most common earnings brackets in Puyallup are $100,000+ for men (3,066 | 24.6%) and $55,000 to $64,999 for women (1,214 | 10.8%).
| Income | Male | Female |
| $2,499 or less | 293 (2.4%) | 506 (4.5%) |
| $2,500 to $4,999 | 257 (2.1%) | 208 (1.8%) |
| $5,000 to $7,499 | 213 (1.7%) | 225 (2.0%) |
| $7,500 to $9,999 | 119 (0.9%) | 416 (3.7%) |
| $10,000 to $12,499 | 204 (1.6%) | 393 (3.5%) |
| $12,500 to $14,999 | 136 (1.1%) | 208 (1.8%) |
| $15,000 to $17,499 | 242 (1.9%) | 273 (2.4%) |
| $17,500 to $19,999 | 118 (0.9%) | 153 (1.4%) |
| $20,000 to $22,499 | 185 (1.5%) | 385 (3.4%) |
| $22,500 to $24,999 | 367 (2.9%) | 439 (3.9%) |
| $25,000 to $29,999 | 461 (3.7%) | 564 (5.0%) |
| $30,000 to $34,999 | 676 (5.4%) | 855 (7.6%) |
| $35,000 to $39,999 | 524 (4.2%) | 619 (5.5%) |
| $40,000 to $44,999 | 647 (5.2%) | 806 (7.2%) |
| $45,000 to $49,999 | 712 (5.7%) | 561 (5.0%) |
| $50,000 to $54,999 | 628 (5.0%) | 589 (5.2%) |
| $55,000 to $64,999 | 933 (7.5%) | 1,214 (10.8%) |
| $65,000 to $74,999 | 730 (5.9%) | 605 (5.4%) |
| $75,000 to $99,999 | 1,951 (15.7%) | 1,132 (10.1%) |
| $100,000+ | 3,066 (24.6%) | 1,079 (9.6%) |
| Total | 12,462 (100.0%) | 11,230 (100.0%) |
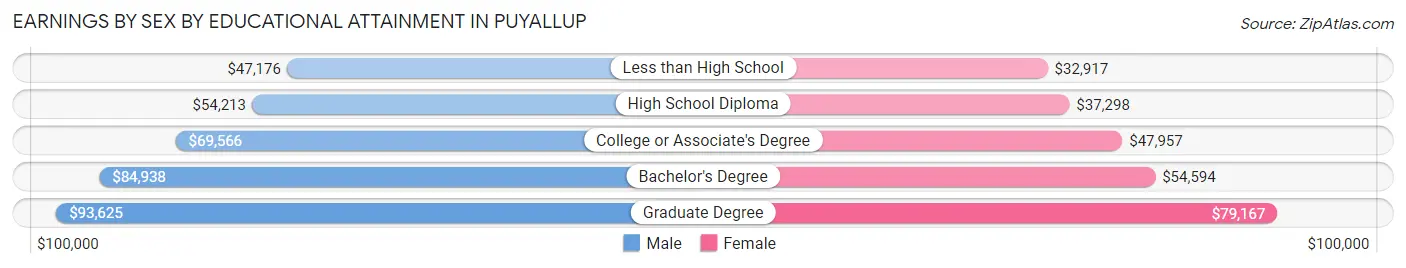
Earnings by Sex by Educational Attainment in Puyallup
Average earnings in Puyallup are $68,917 for men and $47,824 for women, a difference of 30.6%. Men with an educational attainment of graduate degree enjoy the highest average annual earnings of $93,625, while those with less than high school education earn the least with $47,176. Women with an educational attainment of graduate degree earn the most with the average annual earnings of $79,167, while those with less than high school education have the smallest earnings of $32,917.
| Educational Attainment | Male Income | Female Income |
| Less than High School | $47,176 | $32,917 |
| High School Diploma | $54,213 | $37,298 |
| College or Associate's Degree | $69,566 | $47,957 |
| Bachelor's Degree | $84,938 | $54,594 |
| Graduate Degree | $93,625 | $79,167 |
| Total | $68,917 | $47,824 |
Family Income in Puyallup
Family Income Brackets in Puyallup
According to the Puyallup family income data, there are 2,734 families falling into the $100,000 to $149,999 income range, which is the most common income bracket and makes up 26.8% of all families. Conversely, the $10,000 to $14,999 income bracket is the least frequent group with only 20 families (0.2%) belonging to this category.
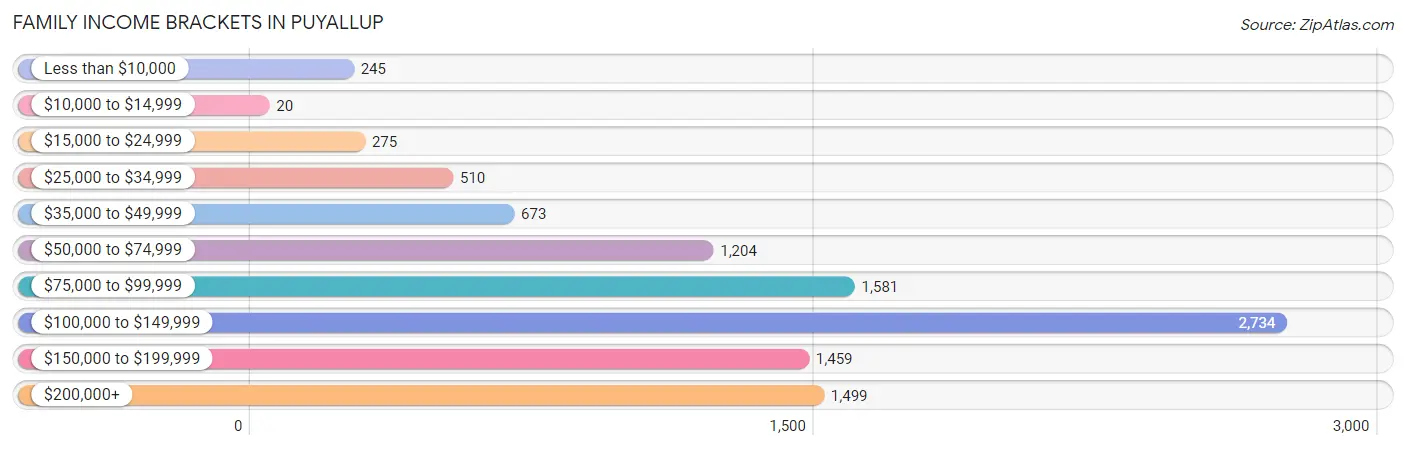
| Income Bracket | # Families | % Families |
| Less than $10,000 | 245 | 2.4% |
| $10,000 to $14,999 | 20 | 0.2% |
| $15,000 to $24,999 | 275 | 2.7% |
| $25,000 to $34,999 | 510 | 5.0% |
| $35,000 to $49,999 | 673 | 6.6% |
| $50,000 to $74,999 | 1,204 | 11.8% |
| $75,000 to $99,999 | 1,581 | 15.5% |
| $100,000 to $149,999 | 2,734 | 26.8% |
| $150,000 to $199,999 | 1,459 | 14.3% |
| $200,000+ | 1,499 | 14.7% |
Family Income by Famaliy Size in Puyallup
7+ person families (187 | 1.8%) account for the highest median family income in Puyallup with $187,829 per family, while 2-person families (4,894 | 48.0%) have the highest median income of $45,982 per family member.
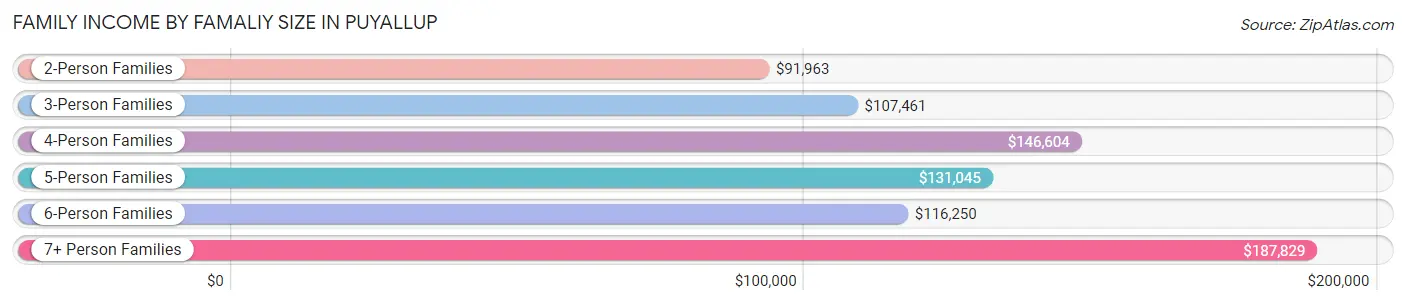
| Income Bracket | # Families | Median Income |
| 2-Person Families | 4,894 (48.0%) | $91,963 |
| 3-Person Families | 2,331 (22.9%) | $107,461 |
| 4-Person Families | 1,711 (16.8%) | $146,604 |
| 5-Person Families | 854 (8.4%) | $131,045 |
| 6-Person Families | 223 (2.2%) | $116,250 |
| 7+ Person Families | 187 (1.8%) | $187,829 |
| Total | 10,200 (100.0%) | $109,877 |
Family Income by Number of Earners in Puyallup
The median family income in Puyallup is $109,877, with families comprising 3+ earners (1,311) having the highest median family income of $177,031, while families with no earners (1,400) have the lowest median family income of $65,192, accounting for 12.9% and 13.7% of families, respectively.
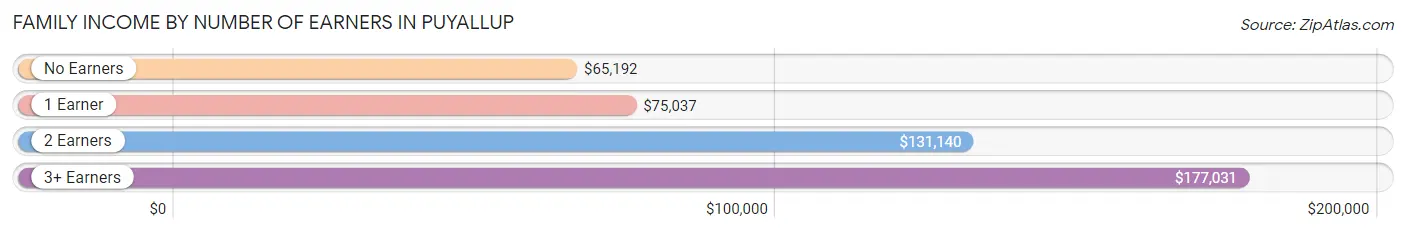
| Number of Earners | # Families | Median Income |
| No Earners | 1,400 (13.7%) | $65,192 |
| 1 Earner | 2,935 (28.8%) | $75,037 |
| 2 Earners | 4,554 (44.7%) | $131,140 |
| 3+ Earners | 1,311 (12.9%) | $177,031 |
| Total | 10,200 (100.0%) | $109,877 |
Household Income in Puyallup
Household Income Brackets in Puyallup
With 3,781 households falling in the category, the $100,000 to $149,999 income range is the most frequent in Puyallup, accounting for 22.8% of all households. In contrast, only 249 households (1.5%) fall into the $10,000 to $14,999 income bracket, making it the least populous group.
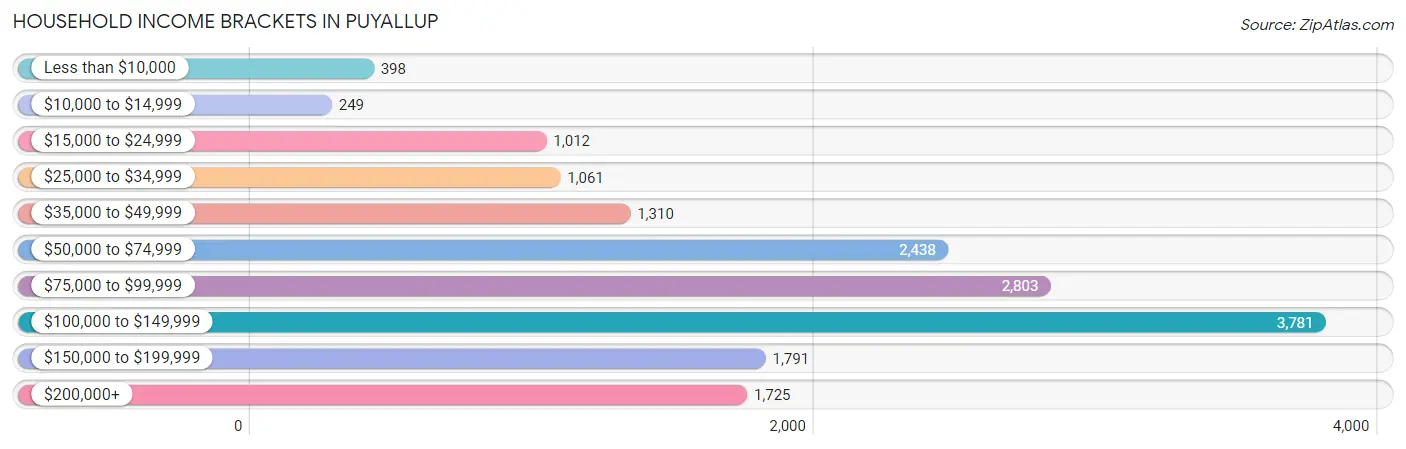
| Income Bracket | # Households | % Households |
| Less than $10,000 | 398 | 2.4% |
| $10,000 to $14,999 | 249 | 1.5% |
| $15,000 to $24,999 | 1,012 | 6.1% |
| $25,000 to $34,999 | 1,061 | 6.4% |
| $35,000 to $49,999 | 1,310 | 7.9% |
| $50,000 to $74,999 | 2,438 | 14.7% |
| $75,000 to $99,999 | 2,803 | 16.9% |
| $100,000 to $149,999 | 3,781 | 22.8% |
| $150,000 to $199,999 | 1,791 | 10.8% |
| $200,000+ | 1,725 | 10.4% |
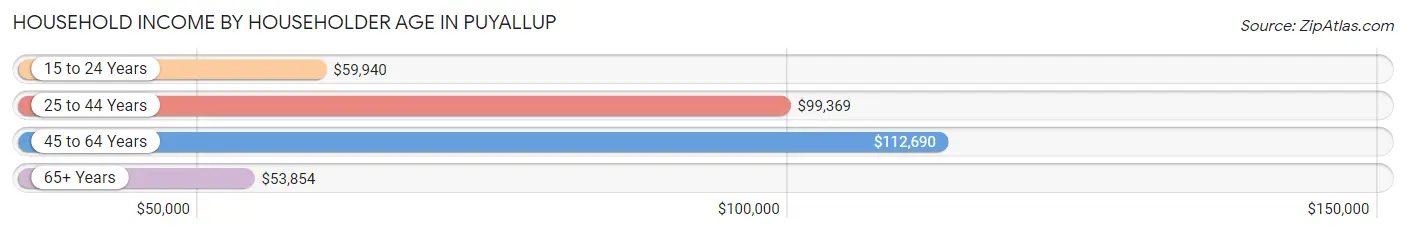
Household Income by Householder Age in Puyallup
The median household income in Puyallup is $90,592, with the highest median household income of $112,690 found in the 45 to 64 years age bracket for the primary householder. A total of 5,895 households (35.5%) fall into this category. Meanwhile, the 65+ years age bracket for the primary householder has the lowest median household income of $53,854, with 3,695 households (22.3%) in this group.
| Income Bracket | # Households | Median Income |
| 15 to 24 Years | 675 (4.1%) | $59,940 |
| 25 to 44 Years | 6,318 (38.1%) | $99,369 |
| 45 to 64 Years | 5,895 (35.5%) | $112,690 |
| 65+ Years | 3,695 (22.3%) | $53,854 |
| Total | 16,583 (100.0%) | $90,592 |
Poverty in Puyallup
Income Below Poverty by Sex and Age in Puyallup
With 6.0% poverty level for males and 8.7% for females among the residents of Puyallup, 15 year old males and 18 to 24 year old females are the most vulnerable to poverty, with 29 males (10.8%) and 251 females (14.3%) in their respective age groups living below the poverty level.
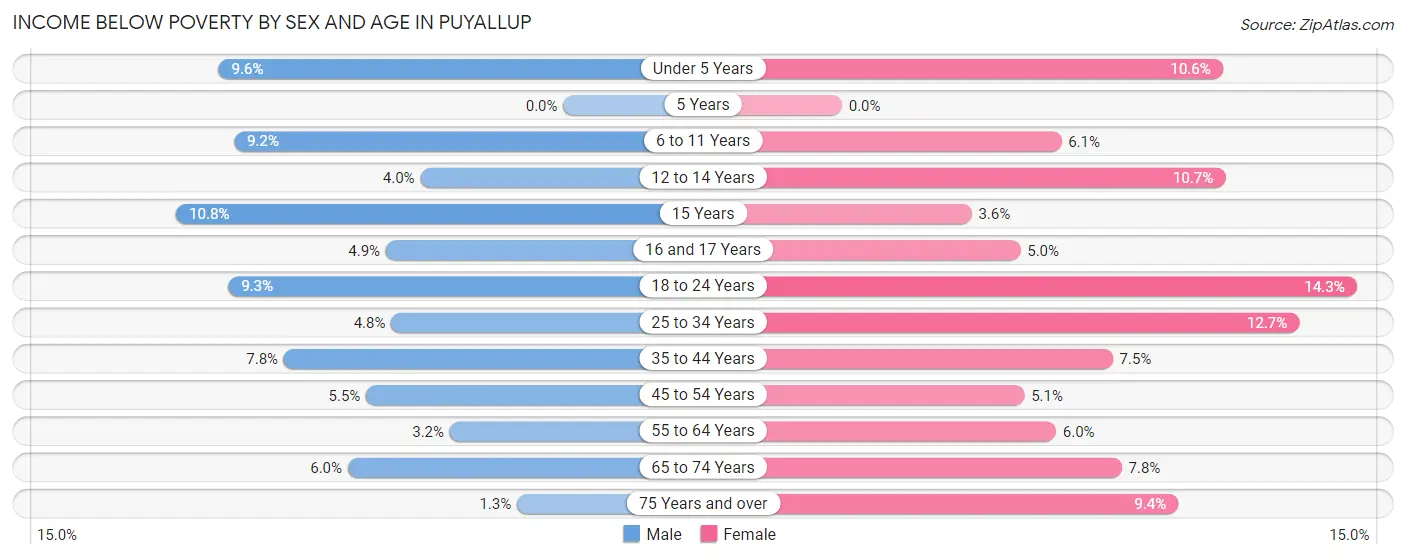
| Age Bracket | Male | Female |
| Under 5 Years | 114 (9.6%) | 136 (10.6%) |
| 5 Years | 0 (0.0%) | 0 (0.0%) |
| 6 to 11 Years | 132 (9.2%) | 98 (6.1%) |
| 12 to 14 Years | 25 (4.0%) | 67 (10.7%) |
| 15 Years | 29 (10.8%) | 15 (3.6%) |
| 16 and 17 Years | 19 (4.9%) | 29 (5.0%) |
| 18 to 24 Years | 166 (9.3%) | 251 (14.3%) |
| 25 to 34 Years | 187 (4.8%) | 486 (12.7%) |
| 35 to 44 Years | 215 (7.8%) | 188 (7.5%) |
| 45 to 54 Years | 151 (5.5%) | 135 (5.1%) |
| 55 to 64 Years | 75 (3.2%) | 149 (6.0%) |
| 65 to 74 Years | 80 (6.0%) | 143 (7.8%) |
| 75 Years and over | 13 (1.3%) | 160 (9.4%) |
| Total | 1,206 (6.0%) | 1,857 (8.7%) |
Income Above Poverty by Sex and Age in Puyallup
According to the poverty statistics in Puyallup, males aged 5 years and females aged 5 years are the age groups that are most secure financially, with 100.0% of males and 100.0% of females in these age groups living above the poverty line.
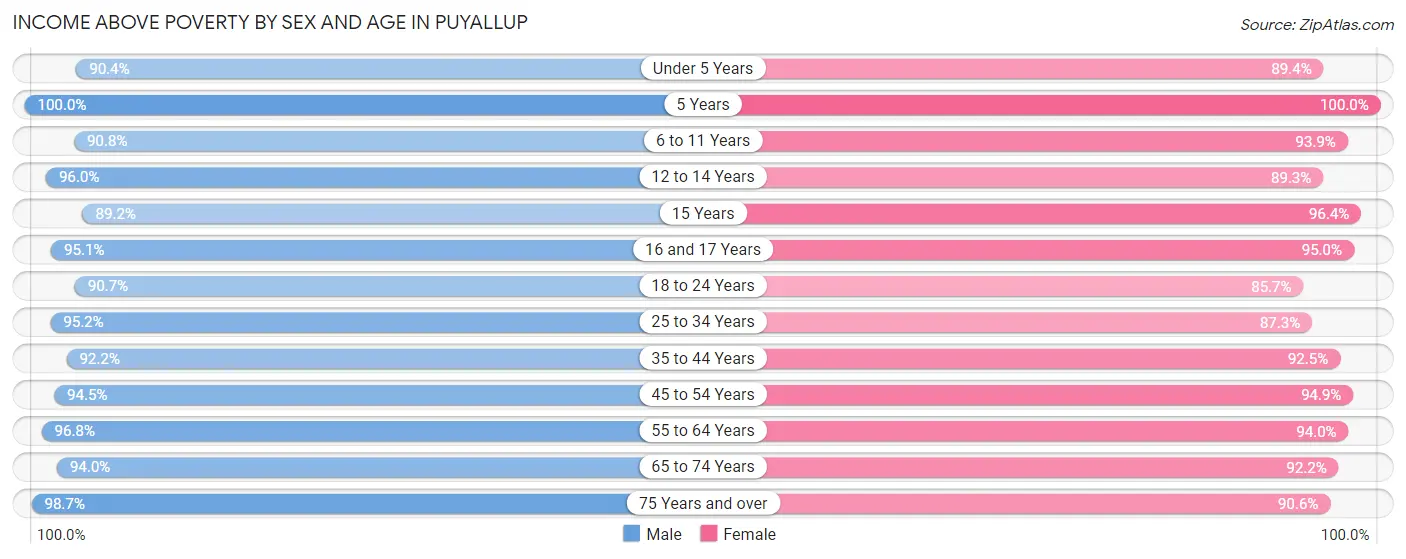
| Age Bracket | Male | Female |
| Under 5 Years | 1,074 (90.4%) | 1,147 (89.4%) |
| 5 Years | 320 (100.0%) | 149 (100.0%) |
| 6 to 11 Years | 1,307 (90.8%) | 1,506 (93.9%) |
| 12 to 14 Years | 603 (96.0%) | 561 (89.3%) |
| 15 Years | 240 (89.2%) | 400 (96.4%) |
| 16 and 17 Years | 366 (95.1%) | 555 (95.0%) |
| 18 to 24 Years | 1,613 (90.7%) | 1,500 (85.7%) |
| 25 to 34 Years | 3,716 (95.2%) | 3,333 (87.3%) |
| 35 to 44 Years | 2,548 (92.2%) | 2,307 (92.5%) |
| 45 to 54 Years | 2,600 (94.5%) | 2,525 (94.9%) |
| 55 to 64 Years | 2,295 (96.8%) | 2,350 (94.0%) |
| 65 to 74 Years | 1,253 (94.0%) | 1,692 (92.2%) |
| 75 Years and over | 998 (98.7%) | 1,549 (90.6%) |
| Total | 18,933 (94.0%) | 19,574 (91.3%) |
Income Below Poverty Among Married-Couple Families in Puyallup
The poverty statistics for married-couple families in Puyallup show that 1.4% or 108 of the total 7,627 families live below the poverty line. Families with 1 or 2 children have the highest poverty rate of 2.6%, comprising of 62 families. On the other hand, families with 5 or more children have the lowest poverty rate of 0.0%, which includes 0 families.
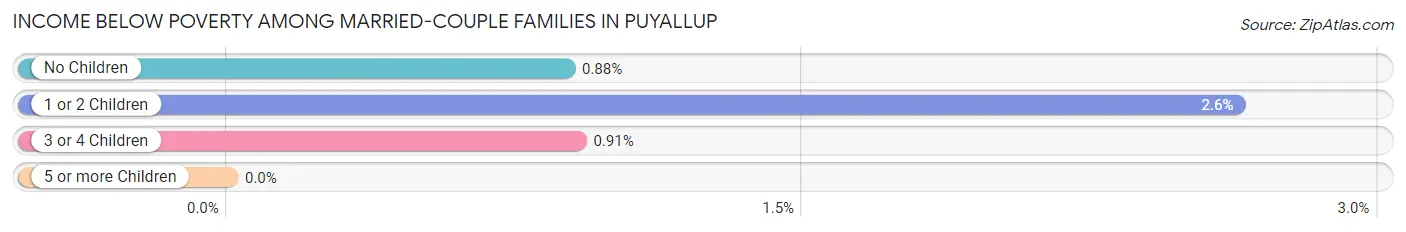
| Children | Above Poverty | Below Poverty |
| No Children | 4,418 (99.1%) | 39 (0.9%) |
| 1 or 2 Children | 2,297 (97.4%) | 62 (2.6%) |
| 3 or 4 Children | 765 (99.1%) | 7 (0.9%) |
| 5 or more Children | 39 (100.0%) | 0 (0.0%) |
| Total | 7,519 (98.6%) | 108 (1.4%) |
Income Below Poverty Among Single-Parent Households in Puyallup
According to the poverty data in Puyallup, 9.4% or 87 single-father households and 16.7% or 274 single-mother households are living below the poverty line. Among single-father households, those with 3 or 4 children have the highest poverty rate, with 29 households (76.3%) experiencing poverty. Likewise, among single-mother households, those with 5 or more children have the highest poverty rate, with 16 households (100.0%) falling below the poverty line.
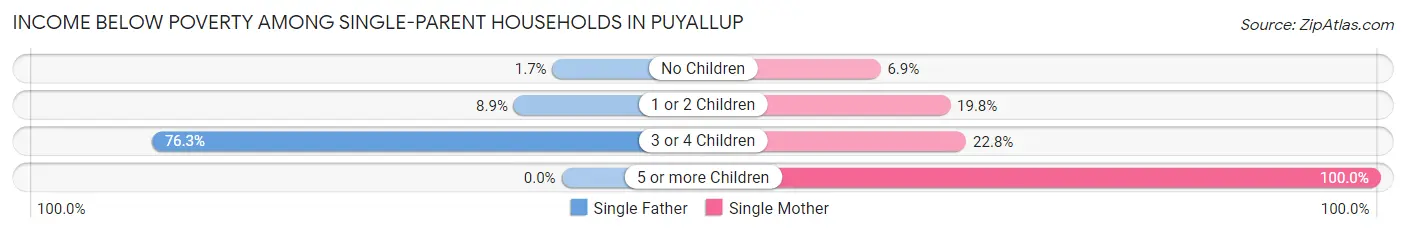
| Children | Single Father | Single Mother |
| No Children | 5 (1.7%) | 36 (6.9%) |
| 1 or 2 Children | 53 (8.9%) | 196 (19.8%) |
| 3 or 4 Children | 29 (76.3%) | 26 (22.8%) |
| 5 or more Children | 0 (0.0%) | 16 (100.0%) |
| Total | 87 (9.4%) | 274 (16.7%) |
Income Below Poverty Among Married-Couple vs Single-Parent Households in Puyallup
The poverty data for Puyallup shows that 108 of the married-couple family households (1.4%) and 361 of the single-parent households (14.0%) are living below the poverty level. Within the married-couple family households, those with 1 or 2 children have the highest poverty rate, with 62 households (2.6%) falling below the poverty line. Among the single-parent households, those with 5 or more children have the highest poverty rate, with 16 household (100.0%) living below poverty.
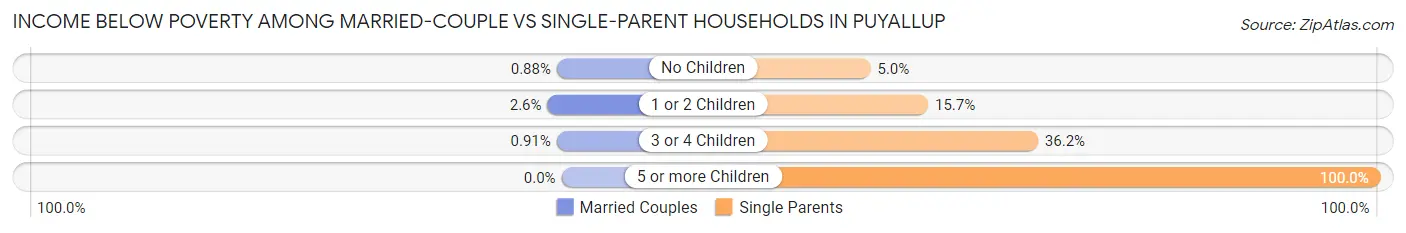
| Children | Married-Couple Families | Single-Parent Households |
| No Children | 39 (0.9%) | 41 (5.0%) |
| 1 or 2 Children | 62 (2.6%) | 249 (15.7%) |
| 3 or 4 Children | 7 (0.9%) | 55 (36.2%) |
| 5 or more Children | 0 (0.0%) | 16 (100.0%) |
| Total | 108 (1.4%) | 361 (14.0%) |
Race in Puyallup
The most populous races in Puyallup are White / Caucasian (33,099 | 77.7%), Two or more Races (3,942 | 9.2%), and Hispanic or Latino (3,346 | 7.9%).
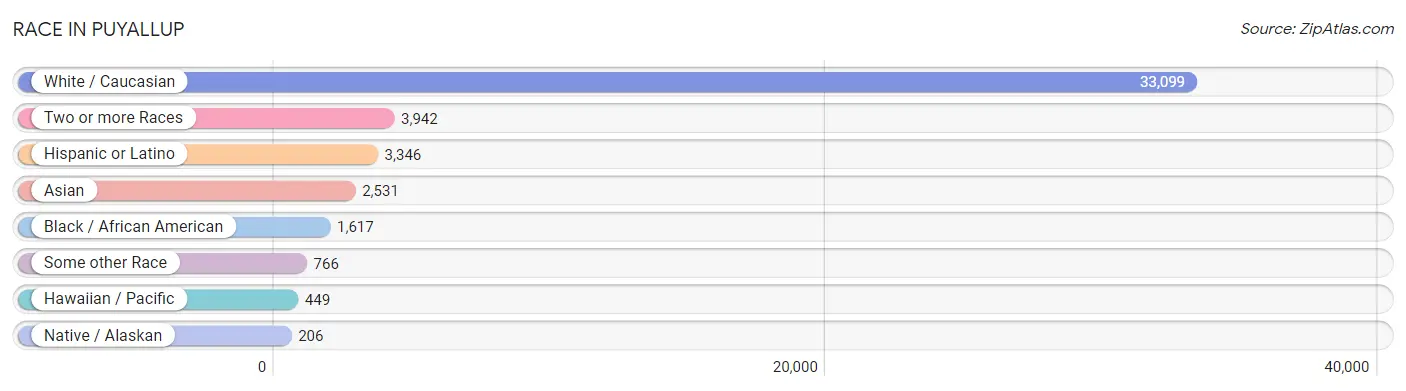
| Race | # Population | % Population |
| Asian | 2,531 | 5.9% |
| Black / African American | 1,617 | 3.8% |
| Hawaiian / Pacific | 449 | 1.1% |
| Hispanic or Latino | 3,346 | 7.9% |
| Native / Alaskan | 206 | 0.5% |
| White / Caucasian | 33,099 | 77.7% |
| Two or more Races | 3,942 | 9.2% |
| Some other Race | 766 | 1.8% |
| Total | 42,610 | 100.0% |
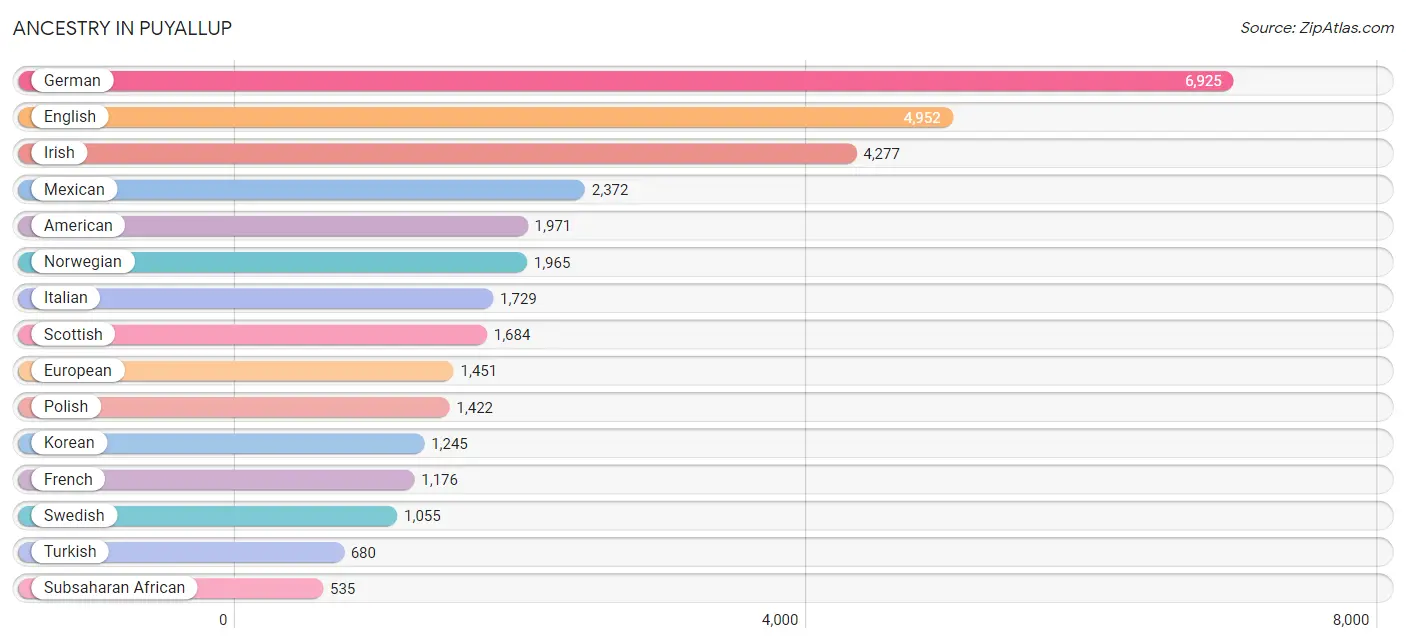
Ancestry in Puyallup
The most populous ancestries reported in Puyallup are German (6,925 | 16.3%), English (4,952 | 11.6%), Irish (4,277 | 10.0%), Mexican (2,372 | 5.6%), and American (1,971 | 4.6%), together accounting for 48.1% of all Puyallup residents.
| Ancestry | # Population | % Population |
| African | 211 | 0.5% |
| Albanian | 19 | 0.0% |
| Aleut | 25 | 0.1% |
| Alsatian | 19 | 0.0% |
| American | 1,971 | 4.6% |
| Apache | 9 | 0.0% |
| Arab | 174 | 0.4% |
| Australian | 14 | 0.0% |
| Austrian | 130 | 0.3% |
| Belgian | 122 | 0.3% |
| Bhutanese | 372 | 0.9% |
| Blackfeet | 42 | 0.1% |
| British | 422 | 1.0% |
| Burmese | 416 | 1.0% |
| Canadian | 59 | 0.1% |
| Central American | 252 | 0.6% |
| Cherokee | 162 | 0.4% |
| Choctaw | 48 | 0.1% |
| Colombian | 46 | 0.1% |
| Creek | 17 | 0.0% |
| Croatian | 119 | 0.3% |
| Cuban | 9 | 0.0% |
| Czech | 116 | 0.3% |
| Czechoslovakian | 45 | 0.1% |
| Danish | 273 | 0.6% |
| Delaware | 8 | 0.0% |
| Dominican | 7 | 0.0% |
| Dutch | 486 | 1.1% |
| Eastern European | 3 | 0.0% |
| English | 4,952 | 11.6% |
| Ethiopian | 44 | 0.1% |
| European | 1,451 | 3.4% |
| Filipino | 8 | 0.0% |
| Finnish | 126 | 0.3% |
| French | 1,176 | 2.8% |
| French American Indian | 30 | 0.1% |
| French Canadian | 324 | 0.8% |
| German | 6,925 | 16.3% |
| Greek | 64 | 0.2% |
| Guamanian / Chamorro | 124 | 0.3% |
| Guatemalan | 20 | 0.1% |
| Honduran | 20 | 0.1% |
| Hopi | 7 | 0.0% |
| Hungarian | 82 | 0.2% |
| Icelander | 61 | 0.1% |
| Indian (Asian) | 401 | 0.9% |
| Inupiat | 16 | 0.0% |
| Iraqi | 111 | 0.3% |
| Irish | 4,277 | 10.0% |
| Iroquois | 32 | 0.1% |
| Italian | 1,729 | 4.1% |
| Jamaican | 62 | 0.2% |
| Japanese | 139 | 0.3% |
| Kenyan | 189 | 0.4% |
| Korean | 1,245 | 2.9% |
| Latvian | 43 | 0.1% |
| Malaysian | 144 | 0.3% |
| Mexican | 2,372 | 5.6% |
| Mexican American Indian | 33 | 0.1% |
| Moroccan | 36 | 0.1% |
| Native Hawaiian | 116 | 0.3% |
| Nicaraguan | 72 | 0.2% |
| Nigerian | 32 | 0.1% |
| Northern European | 131 | 0.3% |
| Norwegian | 1,965 | 4.6% |
| Pakistani | 131 | 0.3% |
| Panamanian | 18 | 0.0% |
| Pennsylvania German | 11 | 0.0% |
| Peruvian | 38 | 0.1% |
| Polish | 1,422 | 3.3% |
| Portuguese | 16 | 0.0% |
| Potawatomi | 29 | 0.1% |
| Puerto Rican | 381 | 0.9% |
| Puget Sound Salish | 91 | 0.2% |
| Romanian | 71 | 0.2% |
| Russian | 387 | 0.9% |
| Salvadoran | 122 | 0.3% |
| Samoan | 288 | 0.7% |
| Scandinavian | 342 | 0.8% |
| Scotch-Irish | 205 | 0.5% |
| Scottish | 1,684 | 4.0% |
| Sioux | 28 | 0.1% |
| Slavic | 12 | 0.0% |
| Slovene | 34 | 0.1% |
| South African | 53 | 0.1% |
| South American | 84 | 0.2% |
| Spaniard | 123 | 0.3% |
| Spanish | 89 | 0.2% |
| Sri Lankan | 476 | 1.1% |
| Subsaharan African | 535 | 1.3% |
| Swedish | 1,055 | 2.5% |
| Swiss | 213 | 0.5% |
| Thai | 459 | 1.1% |
| Tlingit-Haida | 46 | 0.1% |
| Tongan | 62 | 0.2% |
| Turkish | 680 | 1.6% |
| Ukrainian | 225 | 0.5% |
| Welsh | 492 | 1.1% |
| West Indian | 25 | 0.1% |
| Yakama | 13 | 0.0% |
| Yugoslavian | 70 | 0.2% | View All 101 Rows |
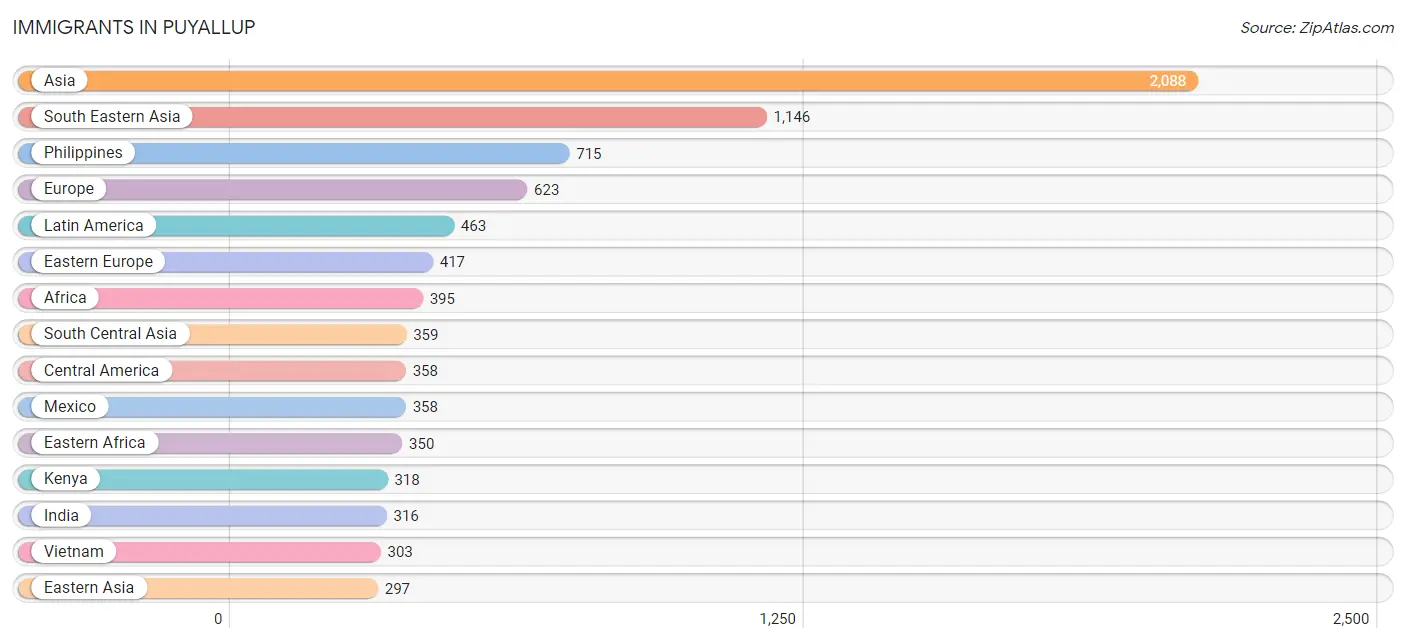
Immigrants in Puyallup
The most numerous immigrant groups reported in Puyallup came from Asia (2,088 | 4.9%), South Eastern Asia (1,146 | 2.7%), Philippines (715 | 1.7%), Europe (623 | 1.5%), and Latin America (463 | 1.1%), together accounting for 11.8% of all Puyallup residents.
| Immigration Origin | # Population | % Population |
| Africa | 395 | 0.9% |
| Asia | 2,088 | 4.9% |
| Bosnia and Herzegovina | 9 | 0.0% |
| Canada | 124 | 0.3% |
| Caribbean | 34 | 0.1% |
| Central America | 358 | 0.8% |
| China | 38 | 0.1% |
| Colombia | 46 | 0.1% |
| Cuba | 9 | 0.0% |
| Czechoslovakia | 16 | 0.0% |
| Eastern Africa | 350 | 0.8% |
| Eastern Asia | 297 | 0.7% |
| Eastern Europe | 417 | 1.0% |
| England | 11 | 0.0% |
| Ethiopia | 32 | 0.1% |
| Europe | 623 | 1.5% |
| France | 20 | 0.1% |
| Germany | 77 | 0.2% |
| Hungary | 19 | 0.0% |
| India | 316 | 0.7% |
| Iraq | 111 | 0.3% |
| Ireland | 11 | 0.0% |
| Italy | 18 | 0.0% |
| Jamaica | 25 | 0.1% |
| Japan | 73 | 0.2% |
| Kenya | 318 | 0.7% |
| Korea | 186 | 0.4% |
| Kuwait | 10 | 0.0% |
| Laos | 63 | 0.2% |
| Latin America | 463 | 1.1% |
| Mexico | 358 | 0.8% |
| Middle Africa | 7 | 0.0% |
| Moldova | 5 | 0.0% |
| Morocco | 18 | 0.0% |
| Nepal | 43 | 0.1% |
| Netherlands | 6 | 0.0% |
| Nigeria | 8 | 0.0% |
| Northern Africa | 18 | 0.0% |
| Northern Europe | 72 | 0.2% |
| Oceania | 189 | 0.4% |
| Peru | 25 | 0.1% |
| Philippines | 715 | 1.7% |
| Poland | 199 | 0.5% |
| Portugal | 13 | 0.0% |
| Russia | 35 | 0.1% |
| South Africa | 12 | 0.0% |
| South America | 71 | 0.2% |
| South Central Asia | 359 | 0.8% |
| South Eastern Asia | 1,146 | 2.7% |
| Southern Europe | 31 | 0.1% |
| Taiwan | 16 | 0.0% |
| Thailand | 65 | 0.2% |
| Turkey | 165 | 0.4% |
| Ukraine | 123 | 0.3% |
| Vietnam | 303 | 0.7% |
| Western Africa | 8 | 0.0% |
| Western Asia | 286 | 0.7% |
| Western Europe | 103 | 0.2% |
| Zaire | 7 | 0.0% | View All 59 Rows |
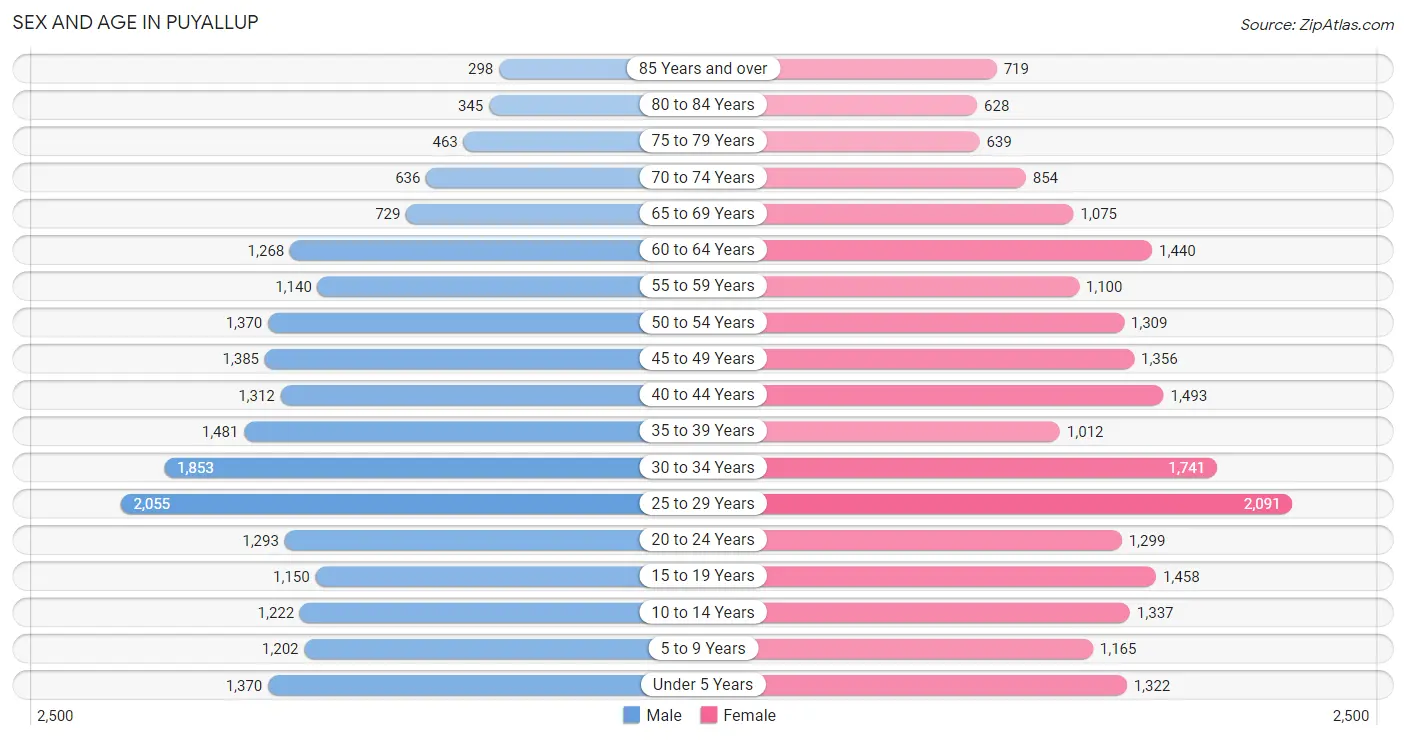
Sex and Age in Puyallup
Sex and Age in Puyallup
The most populous age groups in Puyallup are 25 to 29 Years (2,055 | 10.0%) for men and 25 to 29 Years (2,091 | 9.5%) for women.
| Age Bracket | Male | Female |
| Under 5 Years | 1,370 (6.7%) | 1,322 (6.0%) |
| 5 to 9 Years | 1,202 (5.8%) | 1,165 (5.3%) |
| 10 to 14 Years | 1,222 (5.9%) | 1,337 (6.1%) |
| 15 to 19 Years | 1,150 (5.6%) | 1,458 (6.6%) |
| 20 to 24 Years | 1,293 (6.3%) | 1,299 (5.9%) |
| 25 to 29 Years | 2,055 (10.0%) | 2,091 (9.5%) |
| 30 to 34 Years | 1,853 (9.0%) | 1,741 (7.9%) |
| 35 to 39 Years | 1,481 (7.2%) | 1,012 (4.6%) |
| 40 to 44 Years | 1,312 (6.4%) | 1,493 (6.8%) |
| 45 to 49 Years | 1,385 (6.7%) | 1,356 (6.1%) |
| 50 to 54 Years | 1,370 (6.7%) | 1,309 (5.9%) |
| 55 to 59 Years | 1,140 (5.5%) | 1,100 (5.0%) |
| 60 to 64 Years | 1,268 (6.2%) | 1,440 (6.5%) |
| 65 to 69 Years | 729 (3.5%) | 1,075 (4.9%) |
| 70 to 74 Years | 636 (3.1%) | 854 (3.9%) |
| 75 to 79 Years | 463 (2.2%) | 639 (2.9%) |
| 80 to 84 Years | 345 (1.7%) | 628 (2.9%) |
| 85 Years and over | 298 (1.5%) | 719 (3.3%) |
| Total | 20,572 (100.0%) | 22,038 (100.0%) |
Families and Households in Puyallup
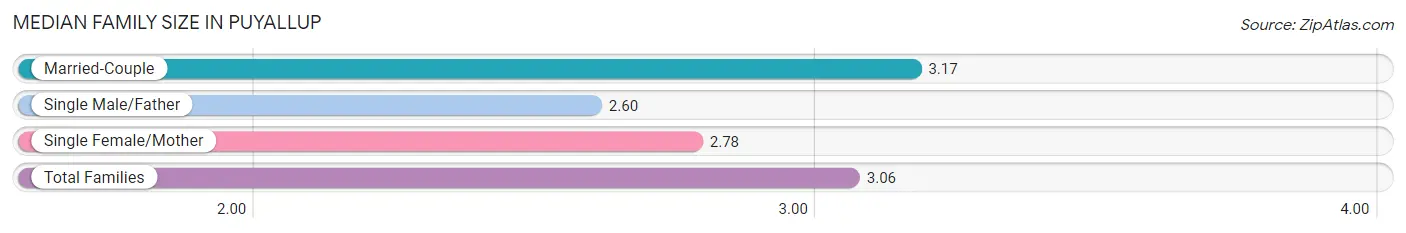
Median Family Size in Puyallup
The median family size in Puyallup is 3.06 persons per family, with married-couple families (7,627 | 74.8%) accounting for the largest median family size of 3.17 persons per family. On the other hand, single male/father families (929 | 9.1%) represent the smallest median family size with 2.60 persons per family.
| Family Type | # Families | Family Size |
| Married-Couple | 7,627 (74.8%) | 3.17 |
| Single Male/Father | 929 (9.1%) | 2.60 |
| Single Female/Mother | 1,644 (16.1%) | 2.78 |
| Total Families | 10,200 (100.0%) | 3.06 |
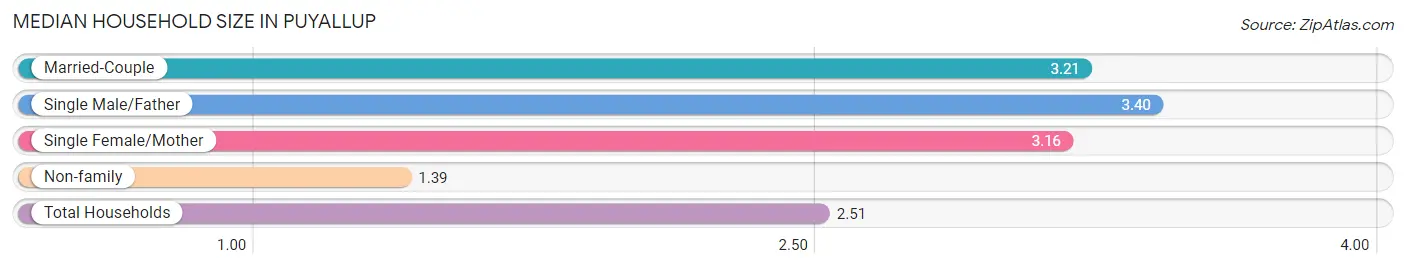
Median Household Size in Puyallup
The median household size in Puyallup is 2.51 persons per household, with single male/father households (929 | 5.6%) accounting for the largest median household size of 3.4 persons per household. non-family households (6,383 | 38.5%) represent the smallest median household size with 1.39 persons per household.
| Household Type | # Households | Household Size |
| Married-Couple | 7,627 (46.0%) | 3.21 |
| Single Male/Father | 929 (5.6%) | 3.40 |
| Single Female/Mother | 1,644 (9.9%) | 3.16 |
| Non-family | 6,383 (38.5%) | 1.39 |
| Total Households | 16,583 (100.0%) | 2.51 |
Household Size by Marriage Status in Puyallup
Out of a total of 16,583 households in Puyallup, 10,200 (61.5%) are family households, while 6,383 (38.5%) are nonfamily households. The most numerous type of family households are 2-person households, comprising 4,325, and the most common type of nonfamily households are 1-person households, comprising 4,363.
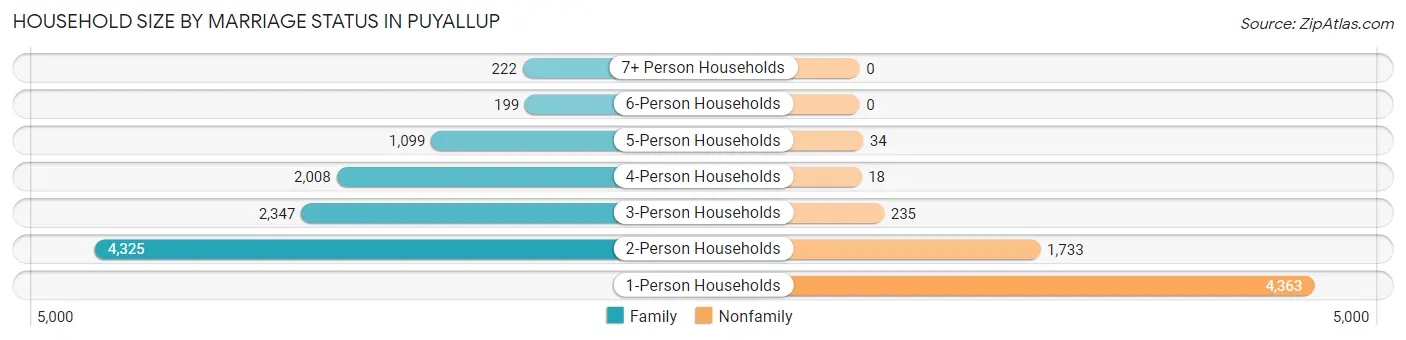
| Household Size | Family Households | Nonfamily Households |
| 1-Person Households | - | 4,363 (26.3%) |
| 2-Person Households | 4,325 (26.1%) | 1,733 (10.4%) |
| 3-Person Households | 2,347 (14.1%) | 235 (1.4%) |
| 4-Person Households | 2,008 (12.1%) | 18 (0.1%) |
| 5-Person Households | 1,099 (6.6%) | 34 (0.2%) |
| 6-Person Households | 199 (1.2%) | 0 (0.0%) |
| 7+ Person Households | 222 (1.3%) | 0 (0.0%) |
| Total | 10,200 (61.5%) | 6,383 (38.5%) |
Female Fertility in Puyallup
Fertility by Age in Puyallup
Average fertility rate in Puyallup is 62.0 births per 1,000 women. Women in the age bracket of 20 to 34 years have the highest fertility rate with 108.0 births per 1,000 women. Women in the age bracket of 20 to 34 years acount for 83.7% of all women with births.
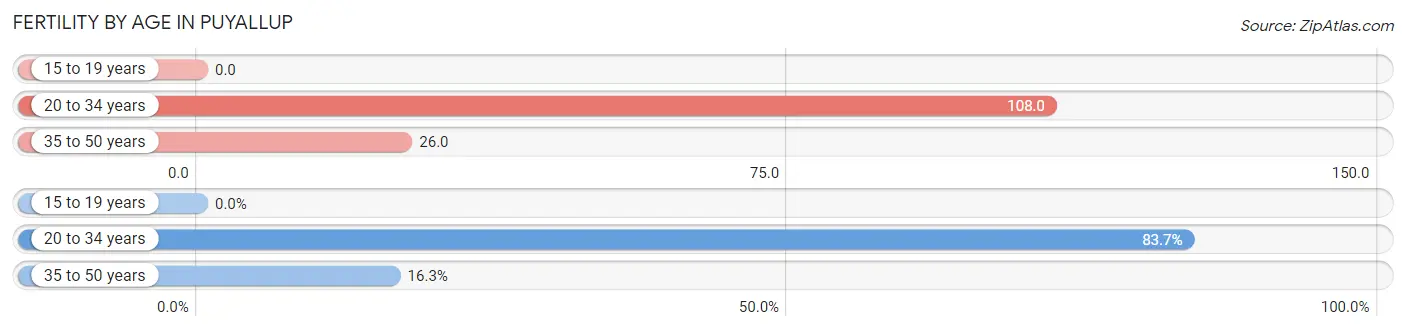
| Age Bracket | Women with Births | Births / 1,000 Women |
| 15 to 19 years | 0 (0.0%) | 0.0 |
| 20 to 34 years | 553 (83.7%) | 108.0 |
| 35 to 50 years | 108 (16.3%) | 26.0 |
| Total | 661 (100.0%) | 62.0 |
Fertility by Age by Marriage Status in Puyallup
46.7% of women with births (661) in Puyallup are married. The highest percentage of unmarried women with births falls into 20 to 34 years age bracket with 56.8% of them unmarried at the time of birth, while the lowest percentage of unmarried women with births belong to 35 to 50 years age bracket with 35.2% of them unmarried.

| Age Bracket | Married | Unmarried |
| 15 to 19 years | 0 (0.0%) | 0 (0.0%) |
| 20 to 34 years | 239 (43.2%) | 314 (56.8%) |
| 35 to 50 years | 70 (64.8%) | 38 (35.2%) |
| Total | 309 (46.8%) | 352 (53.2%) |
Fertility by Education in Puyallup
Average fertility rate in Puyallup is 62.0 births per 1,000 women. Women with the education attainment of graduate degree have the highest fertility rate of 114.0 births per 1,000 women, while women with the education attainment of less than high school have the lowest fertility at 15.0 births per 1,000 women. Women with the education attainment of college or associate's degree represent 33.7% of all women with births.
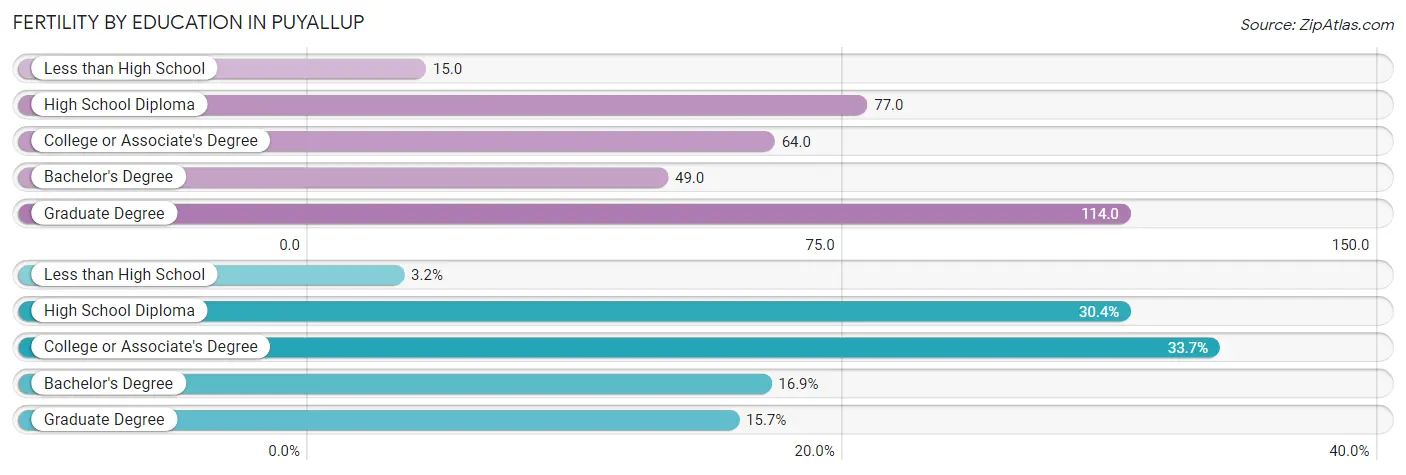
| Educational Attainment | Women with Births | Births / 1,000 Women |
| Less than High School | 21 (3.2%) | 15.0 |
| High School Diploma | 201 (30.4%) | 77.0 |
| College or Associate's Degree | 223 (33.7%) | 64.0 |
| Bachelor's Degree | 112 (16.9%) | 49.0 |
| Graduate Degree | 104 (15.7%) | 114.0 |
| Total | 661 (100.0%) | 62.0 |
Fertility by Education by Marriage Status in Puyallup
53.2% of women with births in Puyallup are unmarried. Women with the educational attainment of graduate degree are most likely to be married with 100.0% of them married at childbirth, while women with the educational attainment of less than high school are least likely to be married with 100.0% of them unmarried at childbirth.
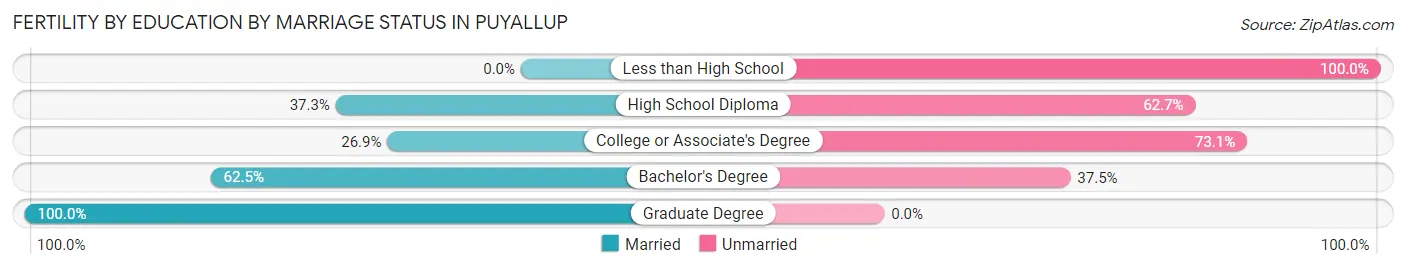
| Educational Attainment | Married | Unmarried |
| Less than High School | 0 (0.0%) | 21 (100.0%) |
| High School Diploma | 75 (37.3%) | 126 (62.7%) |
| College or Associate's Degree | 60 (26.9%) | 163 (73.1%) |
| Bachelor's Degree | 70 (62.5%) | 42 (37.5%) |
| Graduate Degree | 104 (100.0%) | 0 (0.0%) |
| Total | 309 (46.8%) | 352 (53.2%) |
Employment Characteristics in Puyallup
Employment by Class of Employer in Puyallup
Among the 20,665 employed individuals in Puyallup, private company employees (14,477 | 70.1%), local government employees (1,817 | 8.8%), and not-for-profit organizations (1,399 | 6.8%) make up the most common classes of employment.
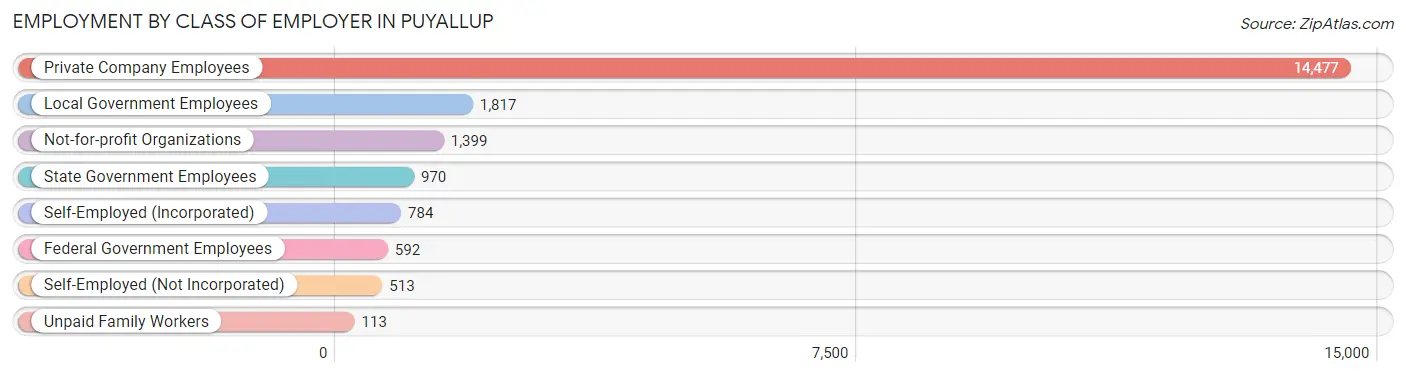
| Employer Class | # Employees | % Employees |
| Private Company Employees | 14,477 | 70.1% |
| Self-Employed (Incorporated) | 784 | 3.8% |
| Self-Employed (Not Incorporated) | 513 | 2.5% |
| Not-for-profit Organizations | 1,399 | 6.8% |
| Local Government Employees | 1,817 | 8.8% |
| State Government Employees | 970 | 4.7% |
| Federal Government Employees | 592 | 2.9% |
| Unpaid Family Workers | 113 | 0.5% |
| Total | 20,665 | 100.0% |
Employment Status by Age in Puyallup
According to the labor force statistics for Puyallup, out of the total population over 16 years of age (34,308), 66.0% or 22,643 individuals are in the labor force, with 6.3% or 1,427 of them unemployed. The age group with the highest labor force participation rate is 25 to 29 years, with 87.8% or 3,640 individuals in the labor force. Within the labor force, the 16 to 19 years age range has the highest percentage of unemployed individuals, with 24.6% or 183 of them being unemployed.
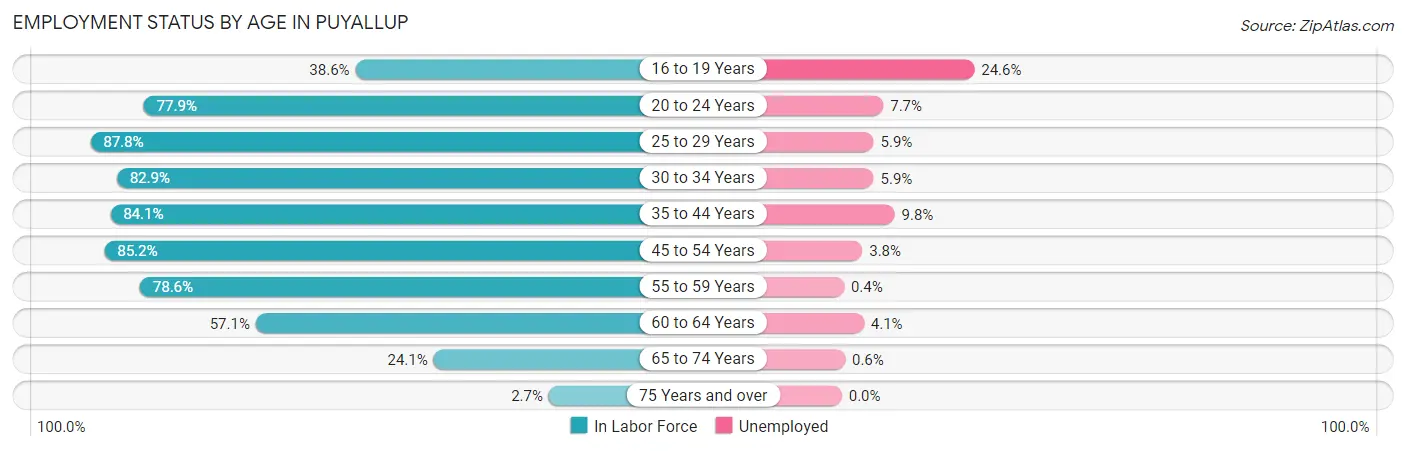
| Age Bracket | In Labor Force | Unemployed |
| 16 to 19 Years | 743 (38.6%) | 183 (24.6%) |
| 20 to 24 Years | 2,019 (77.9%) | 155 (7.7%) |
| 25 to 29 Years | 3,640 (87.8%) | 215 (5.9%) |
| 30 to 34 Years | 2,979 (82.9%) | 176 (5.9%) |
| 35 to 44 Years | 4,456 (84.1%) | 437 (9.8%) |
| 45 to 54 Years | 4,618 (85.2%) | 175 (3.8%) |
| 55 to 59 Years | 1,761 (78.6%) | 7 (0.4%) |
| 60 to 64 Years | 1,546 (57.1%) | 63 (4.1%) |
| 65 to 74 Years | 794 (24.1%) | 5 (0.6%) |
| 75 Years and over | 83 (2.7%) | 0 (0.0%) |
| Total | 22,643 (66.0%) | 1,427 (6.3%) |
Employment Status by Educational Attainment in Puyallup
According to labor force statistics for Puyallup, 81.2% of individuals (19,006) out of the total population between 25 and 64 years of age (23,406) are in the labor force, with 5.7% or 1,083 of them being unemployed. The group with the highest labor force participation rate are those with the educational attainment of bachelor's degree or higher, with 88.0% or 5,888 individuals in the labor force. Within the labor force, individuals with less than high school education have the highest percentage of unemployment, with 8.3% or 83 of them being unemployed.
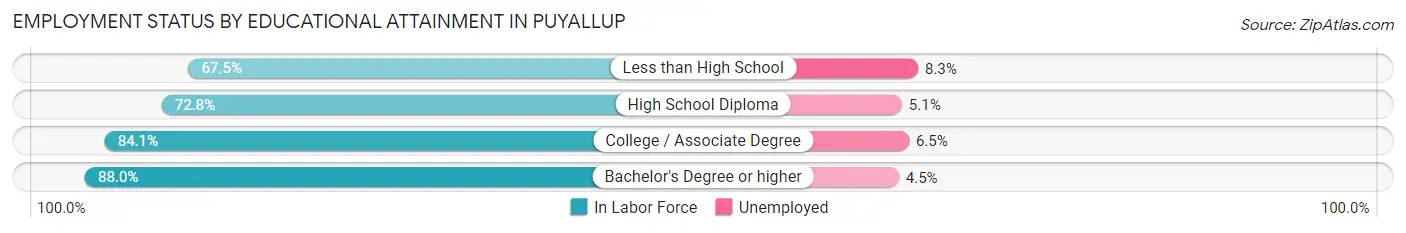
| Educational Attainment | In Labor Force | Unemployed |
| Less than High School | 998 (67.5%) | 123 (8.3%) |
| High School Diploma | 4,491 (72.8%) | 315 (5.1%) |
| College / Associate Degree | 7,626 (84.1%) | 589 (6.5%) |
| Bachelor's Degree or higher | 5,888 (88.0%) | 301 (4.5%) |
| Total | 19,006 (81.2%) | 1,334 (5.7%) |
Employment Occupations by Sex in Puyallup
Management, Business, Science and Arts Occupations
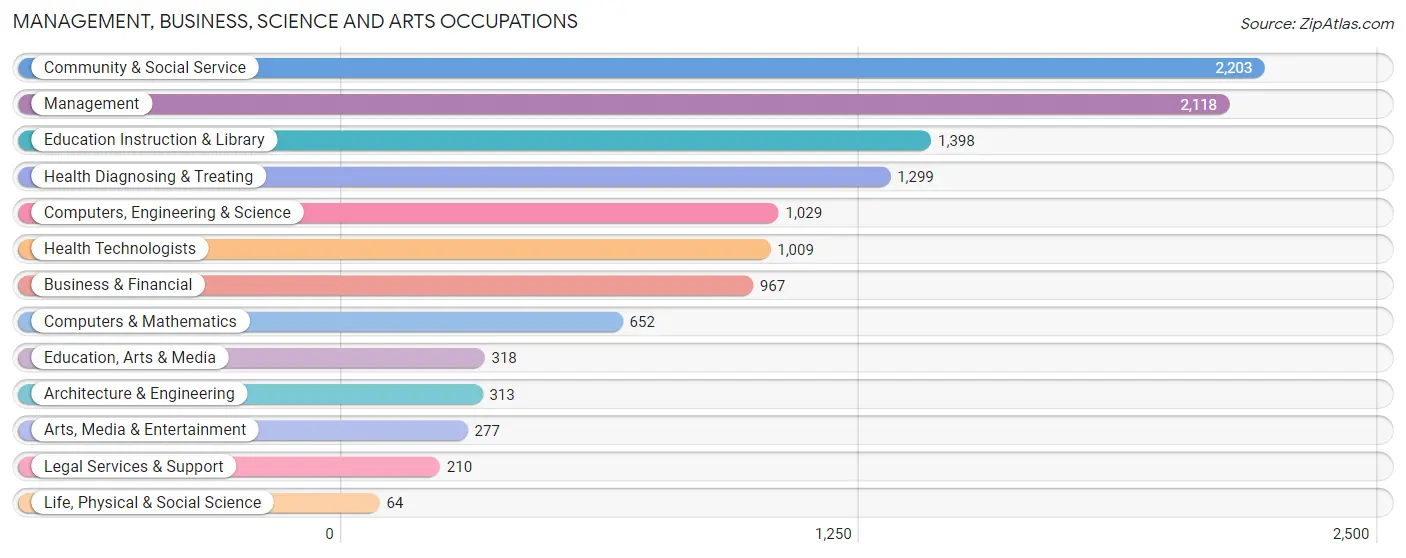
The most common Management, Business, Science and Arts occupations in Puyallup are Community & Social Service (2,203 | 10.4%), Management (2,118 | 10.0%), Education Instruction & Library (1,398 | 6.6%), Health Diagnosing & Treating (1,299 | 6.1%), and Computers, Engineering & Science (1,029 | 4.9%).
Management, Business, Science and Arts Occupations by Sex
Within the Management, Business, Science and Arts occupations in Puyallup, the most male-oriented occupations are Computers & Mathematics (93.9%), Computers, Engineering & Science (88.6%), and Life, Physical & Social Science (81.2%), while the most female-oriented occupations are Education Instruction & Library (80.5%), Health Diagnosing & Treating (76.3%), and Health Technologists (76.1%).
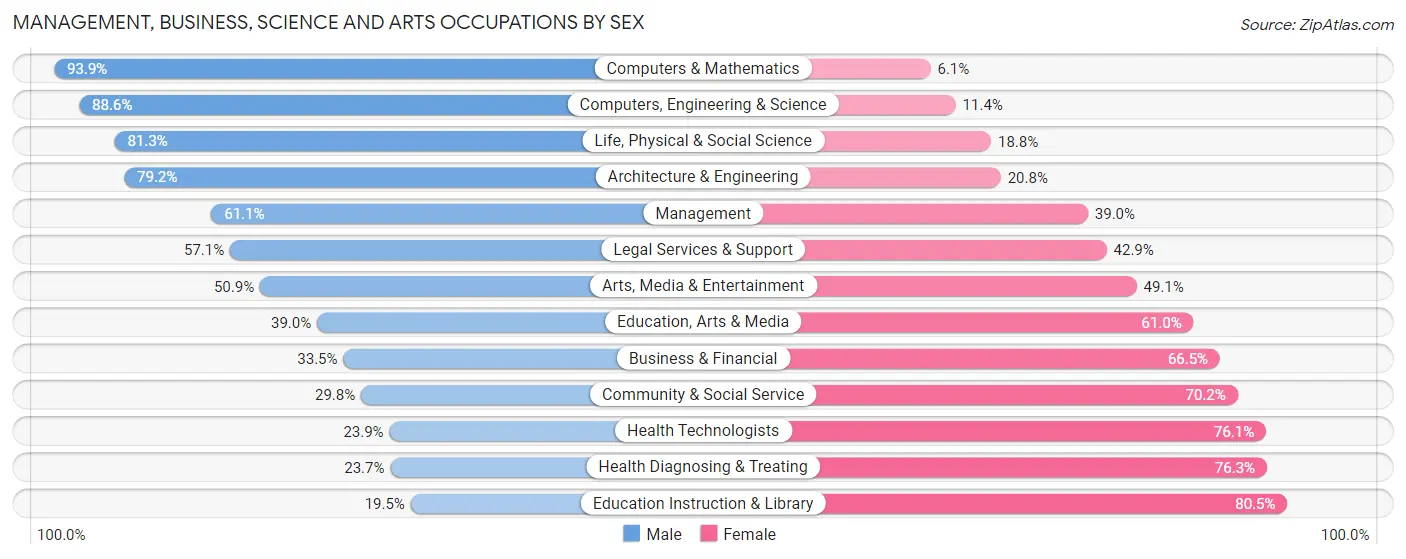
| Occupation | Male | Female |
| Management | 1,293 (61.1%) | 825 (39.0%) |
| Business & Financial | 324 (33.5%) | 643 (66.5%) |
| Computers, Engineering & Science | 912 (88.6%) | 117 (11.4%) |
| Computers & Mathematics | 612 (93.9%) | 40 (6.1%) |
| Architecture & Engineering | 248 (79.2%) | 65 (20.8%) |
| Life, Physical & Social Science | 52 (81.2%) | 12 (18.8%) |
| Community & Social Service | 657 (29.8%) | 1,546 (70.2%) |
| Education, Arts & Media | 124 (39.0%) | 194 (61.0%) |
| Legal Services & Support | 120 (57.1%) | 90 (42.9%) |
| Education Instruction & Library | 272 (19.5%) | 1,126 (80.5%) |
| Arts, Media & Entertainment | 141 (50.9%) | 136 (49.1%) |
| Health Diagnosing & Treating | 308 (23.7%) | 991 (76.3%) |
| Health Technologists | 241 (23.9%) | 768 (76.1%) |
| Total (Category) | 3,494 (45.9%) | 4,122 (54.1%) |
| Total (Overall) | 11,252 (53.3%) | 9,870 (46.7%) |
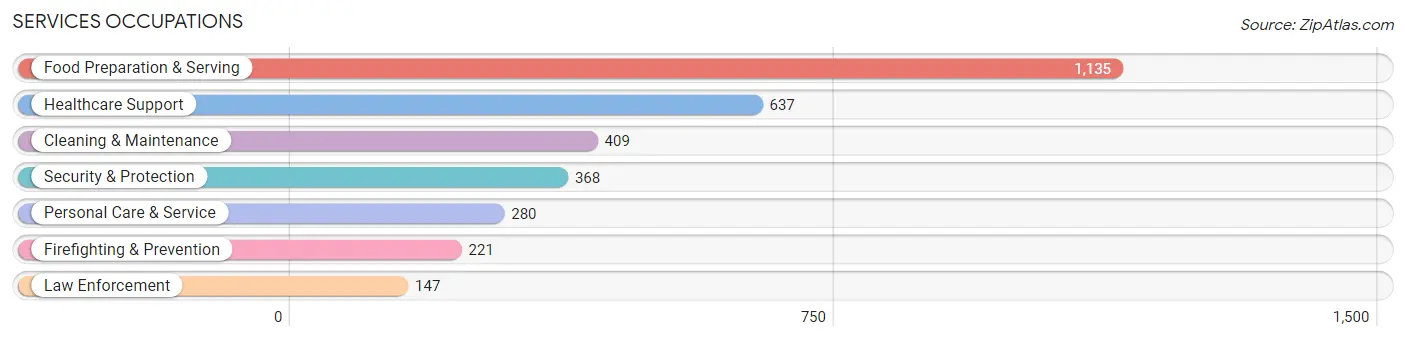
Services Occupations
The most common Services occupations in Puyallup are Food Preparation & Serving (1,135 | 5.4%), Healthcare Support (637 | 3.0%), Cleaning & Maintenance (409 | 1.9%), Security & Protection (368 | 1.7%), and Personal Care & Service (280 | 1.3%).
Services Occupations by Sex
Within the Services occupations in Puyallup, the most male-oriented occupations are Law Enforcement (87.8%), Security & Protection (77.2%), and Cleaning & Maintenance (71.4%), while the most female-oriented occupations are Healthcare Support (94.5%), Food Preparation & Serving (74.3%), and Personal Care & Service (72.9%).
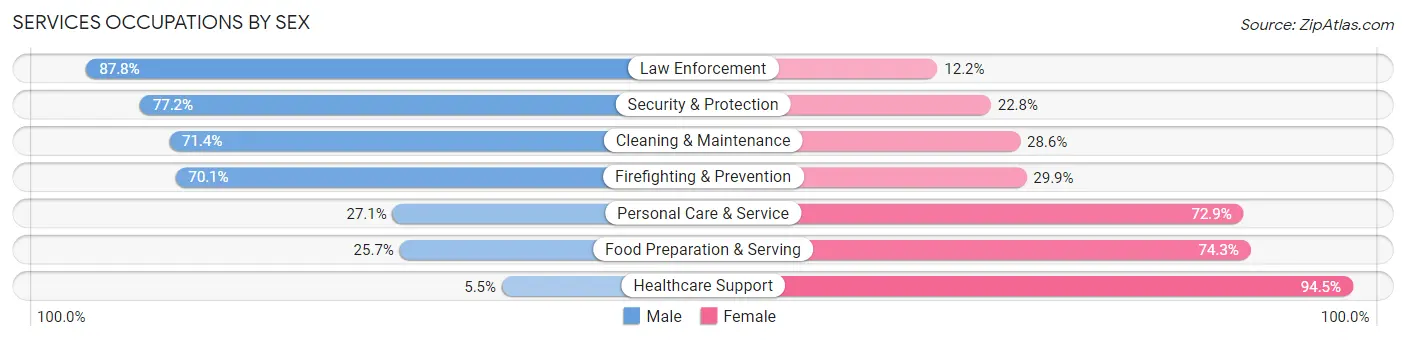
| Occupation | Male | Female |
| Healthcare Support | 35 (5.5%) | 602 (94.5%) |
| Security & Protection | 284 (77.2%) | 84 (22.8%) |
| Firefighting & Prevention | 155 (70.1%) | 66 (29.9%) |
| Law Enforcement | 129 (87.8%) | 18 (12.2%) |
| Food Preparation & Serving | 292 (25.7%) | 843 (74.3%) |
| Cleaning & Maintenance | 292 (71.4%) | 117 (28.6%) |
| Personal Care & Service | 76 (27.1%) | 204 (72.9%) |
| Total (Category) | 979 (34.6%) | 1,850 (65.4%) |
| Total (Overall) | 11,252 (53.3%) | 9,870 (46.7%) |
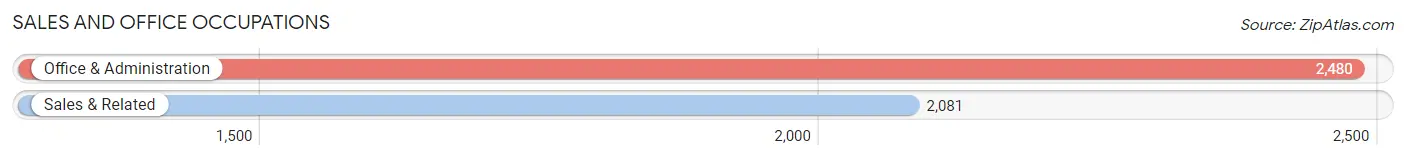
Sales and Office Occupations
The most common Sales and Office occupations in Puyallup are Office & Administration (2,480 | 11.7%), and Sales & Related (2,081 | 9.9%).
Sales and Office Occupations by Sex
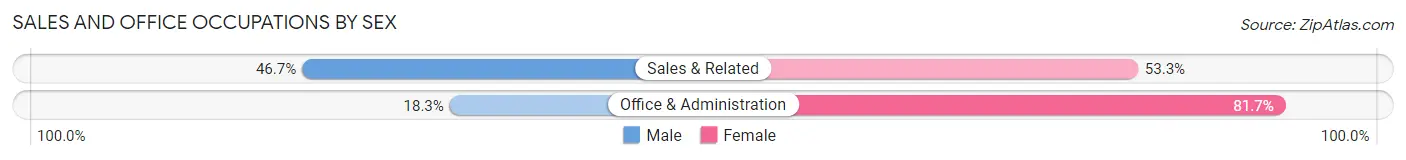
| Occupation | Male | Female |
| Sales & Related | 971 (46.7%) | 1,110 (53.3%) |
| Office & Administration | 453 (18.3%) | 2,027 (81.7%) |
| Total (Category) | 1,424 (31.2%) | 3,137 (68.8%) |
| Total (Overall) | 11,252 (53.3%) | 9,870 (46.7%) |
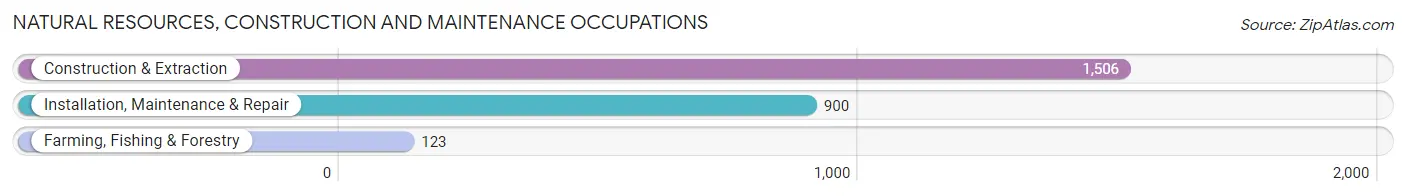
Natural Resources, Construction and Maintenance Occupations
The most common Natural Resources, Construction and Maintenance occupations in Puyallup are Construction & Extraction (1,506 | 7.1%), Installation, Maintenance & Repair (900 | 4.3%), and Farming, Fishing & Forestry (123 | 0.6%).
Natural Resources, Construction and Maintenance Occupations by Sex
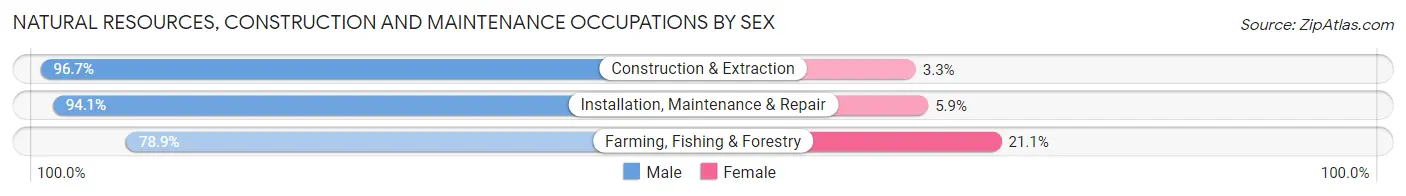
| Occupation | Male | Female |
| Farming, Fishing & Forestry | 97 (78.9%) | 26 (21.1%) |
| Construction & Extraction | 1,456 (96.7%) | 50 (3.3%) |
| Installation, Maintenance & Repair | 847 (94.1%) | 53 (5.9%) |
| Total (Category) | 2,400 (94.9%) | 129 (5.1%) |
| Total (Overall) | 11,252 (53.3%) | 9,870 (46.7%) |
Production, Transportation and Moving Occupations
The most common Production, Transportation and Moving occupations in Puyallup are Production (1,451 | 6.9%), Material Moving (1,223 | 5.8%), and Transportation (913 | 4.3%).
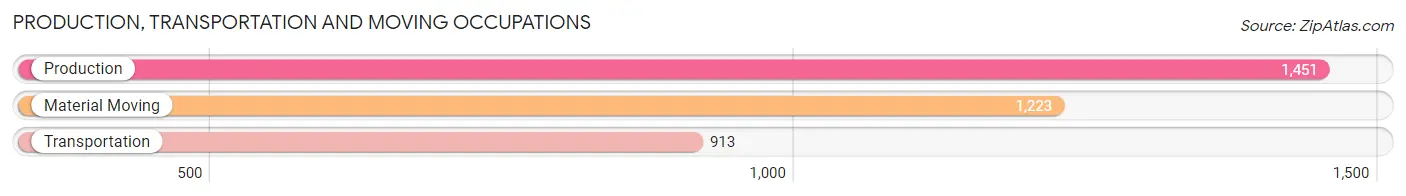
Production, Transportation and Moving Occupations by Sex
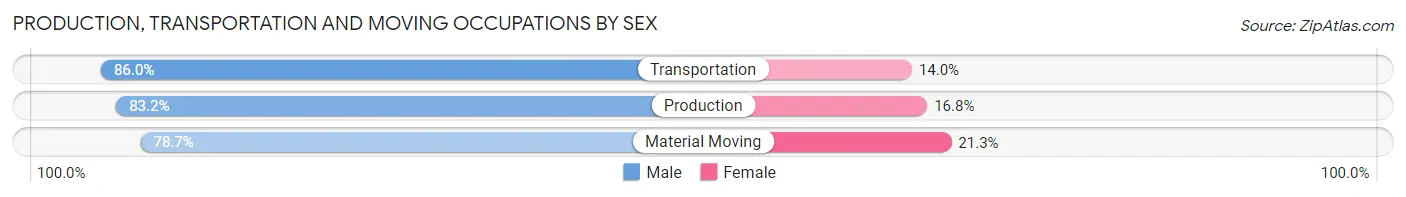
| Occupation | Male | Female |
| Production | 1,207 (83.2%) | 244 (16.8%) |
| Transportation | 785 (86.0%) | 128 (14.0%) |
| Material Moving | 963 (78.7%) | 260 (21.3%) |
| Total (Category) | 2,955 (82.4%) | 632 (17.6%) |
| Total (Overall) | 11,252 (53.3%) | 9,870 (46.7%) |
Employment Industries by Sex in Puyallup
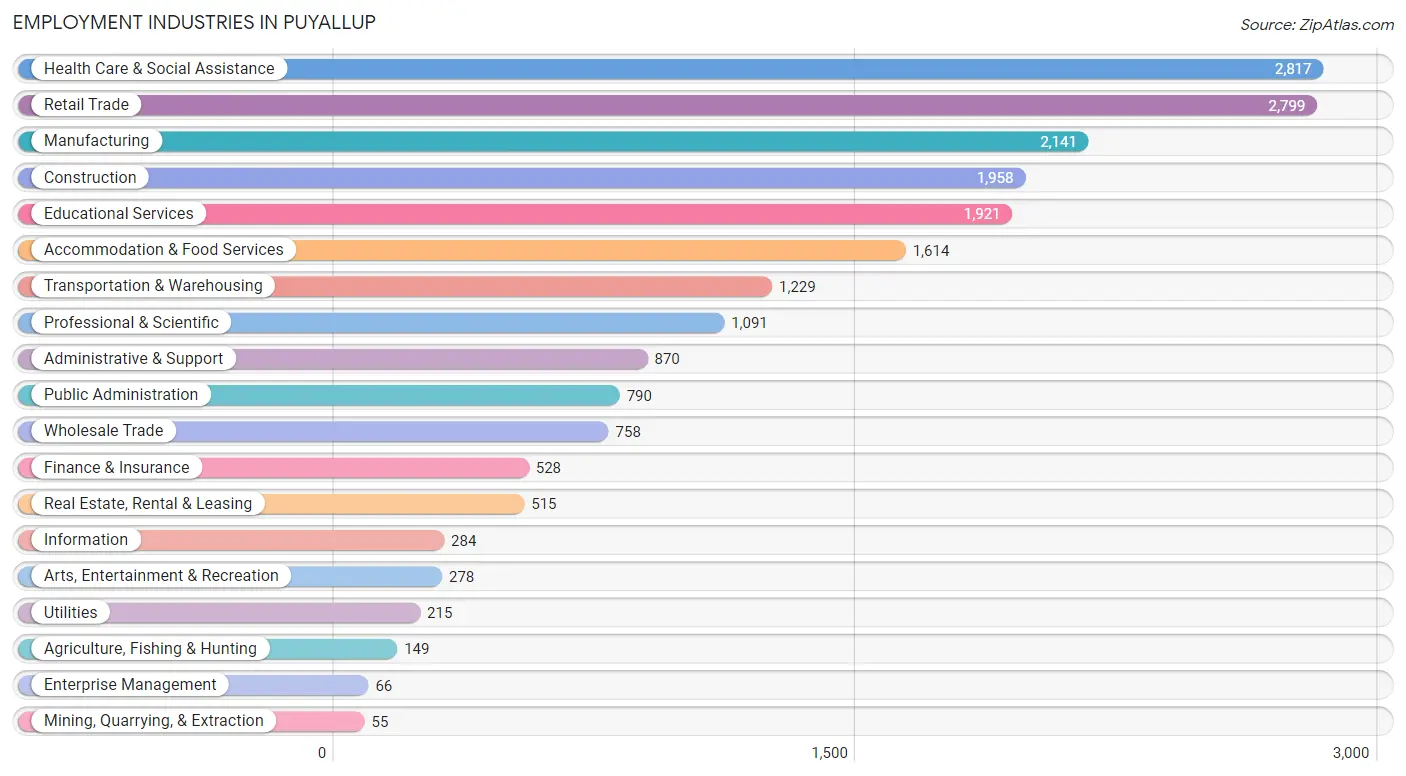
Employment Industries in Puyallup
The major employment industries in Puyallup include Health Care & Social Assistance (2,817 | 13.3%), Retail Trade (2,799 | 13.3%), Manufacturing (2,141 | 10.1%), Construction (1,958 | 9.3%), and Educational Services (1,921 | 9.1%).
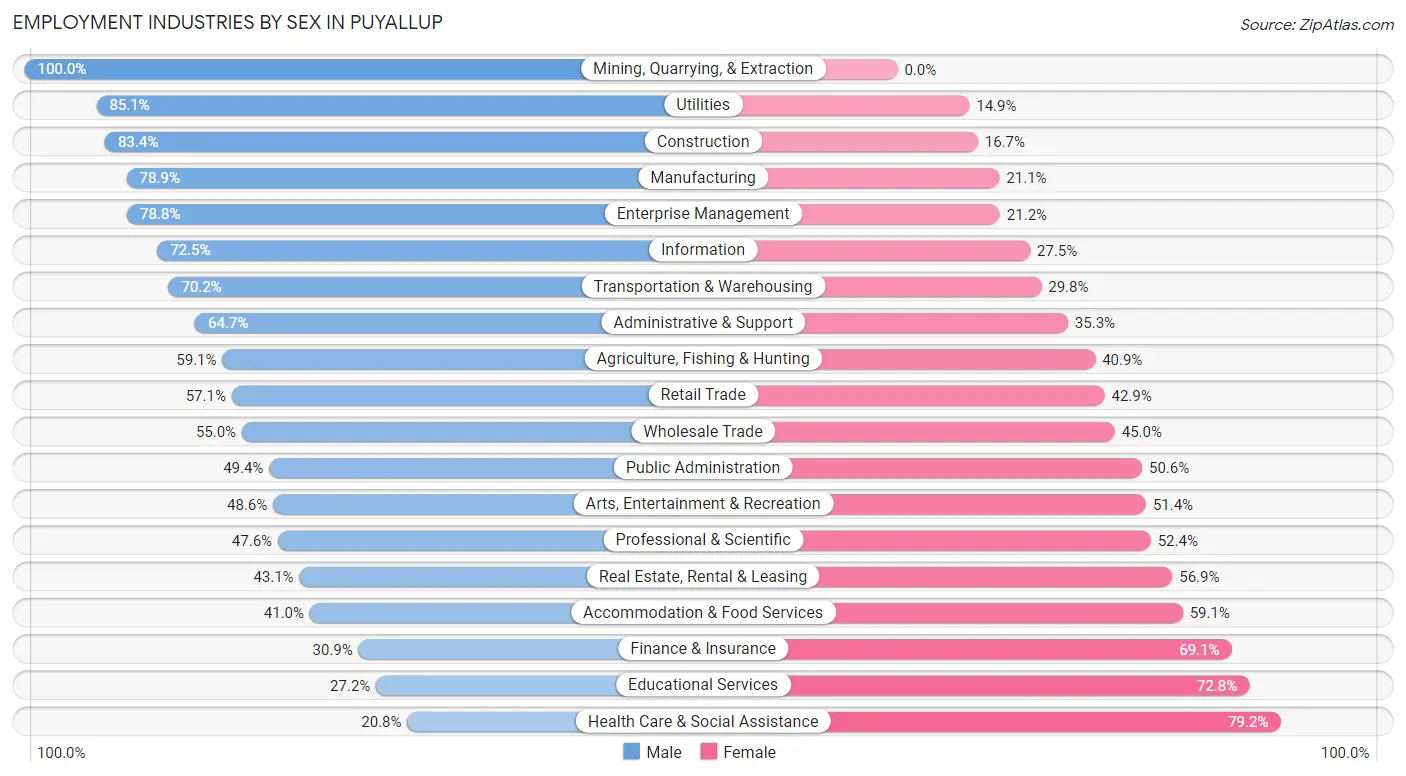
Employment Industries by Sex in Puyallup
The Puyallup industries that see more men than women are Mining, Quarrying, & Extraction (100.0%), Utilities (85.1%), and Construction (83.4%), whereas the industries that tend to have a higher number of women are Health Care & Social Assistance (79.2%), Educational Services (72.8%), and Finance & Insurance (69.1%).
| Industry | Male | Female |
| Agriculture, Fishing & Hunting | 88 (59.1%) | 61 (40.9%) |
| Mining, Quarrying, & Extraction | 55 (100.0%) | 0 (0.0%) |
| Construction | 1,632 (83.4%) | 326 (16.7%) |
| Manufacturing | 1,689 (78.9%) | 452 (21.1%) |
| Wholesale Trade | 417 (55.0%) | 341 (45.0%) |
| Retail Trade | 1,599 (57.1%) | 1,200 (42.9%) |
| Transportation & Warehousing | 863 (70.2%) | 366 (29.8%) |
| Utilities | 183 (85.1%) | 32 (14.9%) |
| Information | 206 (72.5%) | 78 (27.5%) |
| Finance & Insurance | 163 (30.9%) | 365 (69.1%) |
| Real Estate, Rental & Leasing | 222 (43.1%) | 293 (56.9%) |
| Professional & Scientific | 519 (47.6%) | 572 (52.4%) |
| Enterprise Management | 52 (78.8%) | 14 (21.2%) |
| Administrative & Support | 563 (64.7%) | 307 (35.3%) |
| Educational Services | 523 (27.2%) | 1,398 (72.8%) |
| Health Care & Social Assistance | 585 (20.8%) | 2,232 (79.2%) |
| Arts, Entertainment & Recreation | 135 (48.6%) | 143 (51.4%) |
| Accommodation & Food Services | 661 (40.9%) | 953 (59.1%) |
| Public Administration | 390 (49.4%) | 400 (50.6%) |
| Total | 11,252 (53.3%) | 9,870 (46.7%) |
Education in Puyallup
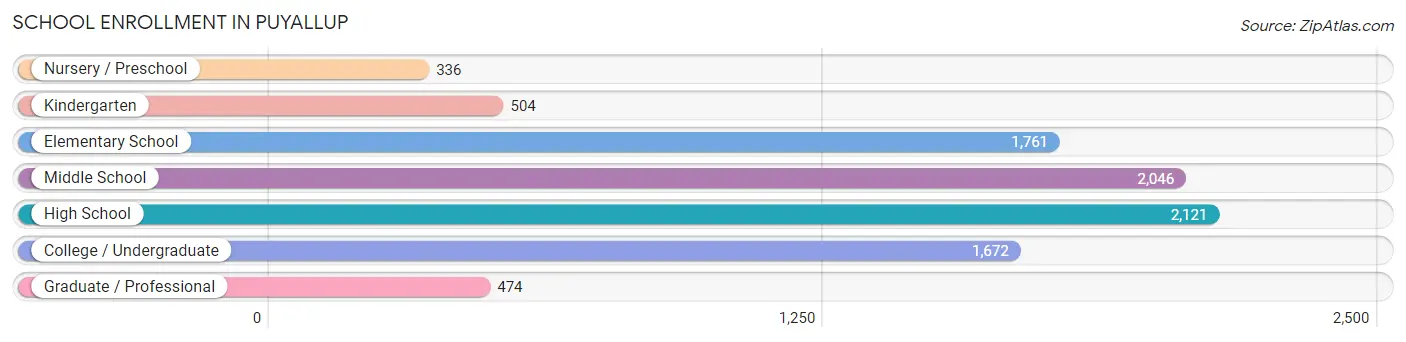
School Enrollment in Puyallup
The most common levels of schooling among the 8,914 students in Puyallup are high school (2,121 | 23.8%), middle school (2,046 | 23.0%), and elementary school (1,761 | 19.8%).
| School Level | # Students | % Students |
| Nursery / Preschool | 336 | 3.8% |
| Kindergarten | 504 | 5.7% |
| Elementary School | 1,761 | 19.8% |
| Middle School | 2,046 | 23.0% |
| High School | 2,121 | 23.8% |
| College / Undergraduate | 1,672 | 18.8% |
| Graduate / Professional | 474 | 5.3% |
| Total | 8,914 | 100.0% |
School Enrollment by Age by Funding Source in Puyallup
Out of a total of 8,914 students who are enrolled in schools in Puyallup, 1,007 (11.3%) attend a private institution, while the remaining 7,907 (88.7%) are enrolled in public schools. The age group of 3 to 4 year olds has the highest likelihood of being enrolled in private schools, with 153 (58.9% in the age bracket) enrolled. Conversely, the age group of 15 to 17 year olds has the lowest likelihood of being enrolled in a private school, with 1,558 (95.5% in the age bracket) attending a public institution.
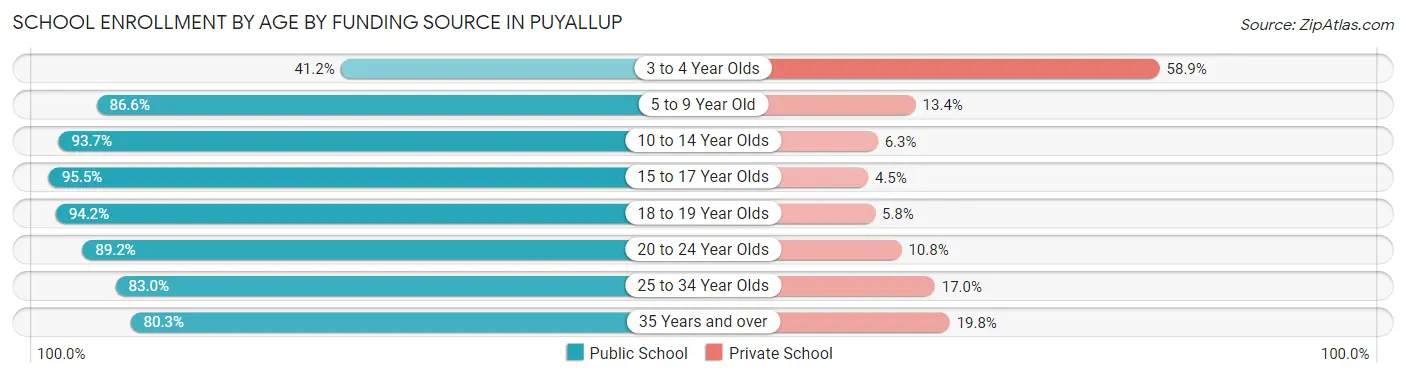
| Age Bracket | Public School | Private School |
| 3 to 4 Year Olds | 107 (41.1%) | 153 (58.9%) |
| 5 to 9 Year Old | 1,789 (86.6%) | 277 (13.4%) |
| 10 to 14 Year Olds | 2,349 (93.7%) | 159 (6.3%) |
| 15 to 17 Year Olds | 1,558 (95.5%) | 74 (4.5%) |
| 18 to 19 Year Olds | 452 (94.2%) | 28 (5.8%) |
| 20 to 24 Year Olds | 547 (89.2%) | 66 (10.8%) |
| 25 to 34 Year Olds | 587 (83.0%) | 120 (17.0%) |
| 35 Years and over | 520 (80.2%) | 128 (19.8%) |
| Total | 7,907 (88.7%) | 1,007 (11.3%) |
Educational Attainment by Field of Study in Puyallup
Business (1,829 | 21.1%), science & technology (1,125 | 13.0%), education (1,024 | 11.8%), arts & humanities (605 | 7.0%), and bio, nature & agricultural (556 | 6.4%) are the most common fields of study among 8,658 individuals in Puyallup who have obtained a bachelor's degree or higher.
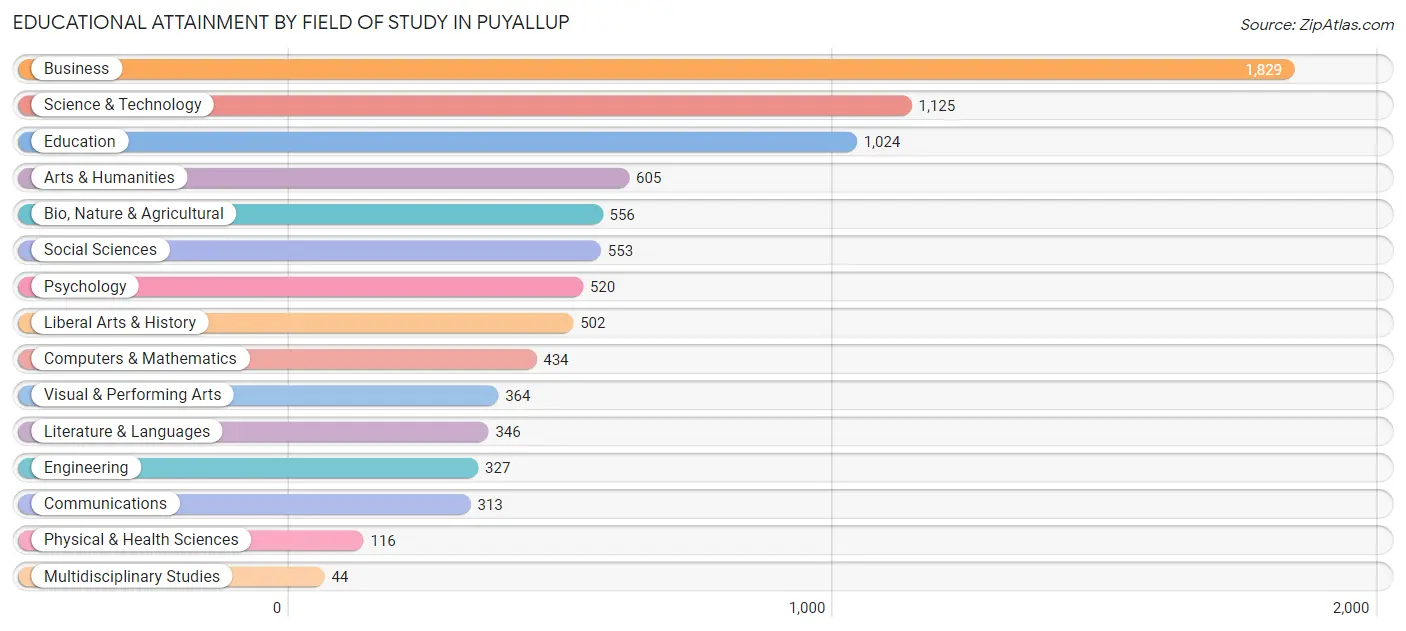
| Field of Study | # Graduates | % Graduates |
| Computers & Mathematics | 434 | 5.0% |
| Bio, Nature & Agricultural | 556 | 6.4% |
| Physical & Health Sciences | 116 | 1.3% |
| Psychology | 520 | 6.0% |
| Social Sciences | 553 | 6.4% |
| Engineering | 327 | 3.8% |
| Multidisciplinary Studies | 44 | 0.5% |
| Science & Technology | 1,125 | 13.0% |
| Business | 1,829 | 21.1% |
| Education | 1,024 | 11.8% |
| Literature & Languages | 346 | 4.0% |
| Liberal Arts & History | 502 | 5.8% |
| Visual & Performing Arts | 364 | 4.2% |
| Communications | 313 | 3.6% |
| Arts & Humanities | 605 | 7.0% |
| Total | 8,658 | 100.0% |
Transportation & Commute in Puyallup
Vehicle Availability by Sex in Puyallup
The most prevalent vehicle ownership categories in Puyallup are males with 2 vehicles (4,886, accounting for 44.0%) and females with 2 vehicles (4,091, making up 51.3%).
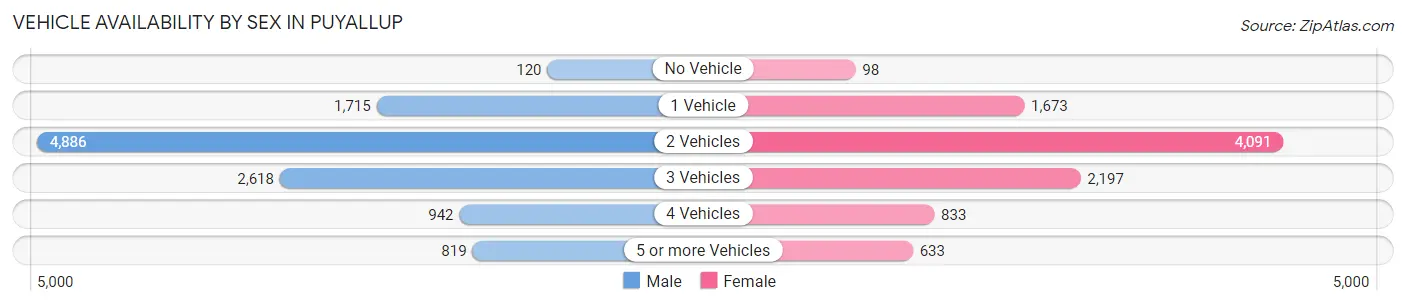
| Vehicles Available | Male | Female |
| No Vehicle | 120 (1.1%) | 98 (1.0%) |
| 1 Vehicle | 1,715 (15.4%) | 1,673 (17.6%) |
| 2 Vehicles | 4,886 (44.0%) | 4,091 (42.9%) |
| 3 Vehicles | 2,618 (23.6%) | 2,197 (23.1%) |
| 4 Vehicles | 942 (8.5%) | 833 (8.7%) |
| 5 or more Vehicles | 819 (7.4%) | 633 (6.7%) |
| Total | 11,100 (100.0%) | 9,525 (100.0%) |
Commute Time in Puyallup
The most frequently occuring commute durations in Puyallup are 30 to 34 minutes (3,152 commuters, 16.7%), 15 to 19 minutes (2,469 commuters, 13.1%), and 5 to 9 minutes (1,999 commuters, 10.6%).
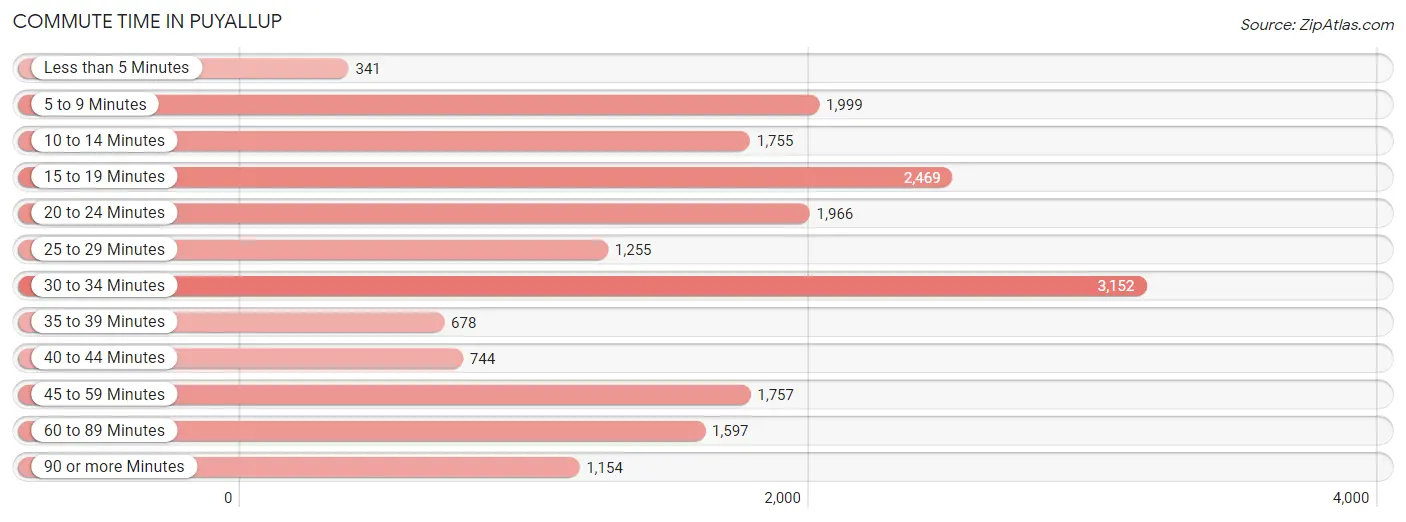
| Commute Time | # Commuters | % Commuters |
| Less than 5 Minutes | 341 | 1.8% |
| 5 to 9 Minutes | 1,999 | 10.6% |
| 10 to 14 Minutes | 1,755 | 9.3% |
| 15 to 19 Minutes | 2,469 | 13.1% |
| 20 to 24 Minutes | 1,966 | 10.4% |
| 25 to 29 Minutes | 1,255 | 6.7% |
| 30 to 34 Minutes | 3,152 | 16.7% |
| 35 to 39 Minutes | 678 | 3.6% |
| 40 to 44 Minutes | 744 | 3.9% |
| 45 to 59 Minutes | 1,757 | 9.3% |
| 60 to 89 Minutes | 1,597 | 8.5% |
| 90 or more Minutes | 1,154 | 6.1% |
Commute Time by Sex in Puyallup
The most common commute times in Puyallup are 30 to 34 minutes (1,897 commuters, 18.1%) for males and 15 to 19 minutes (1,396 commuters, 16.6%) for females.
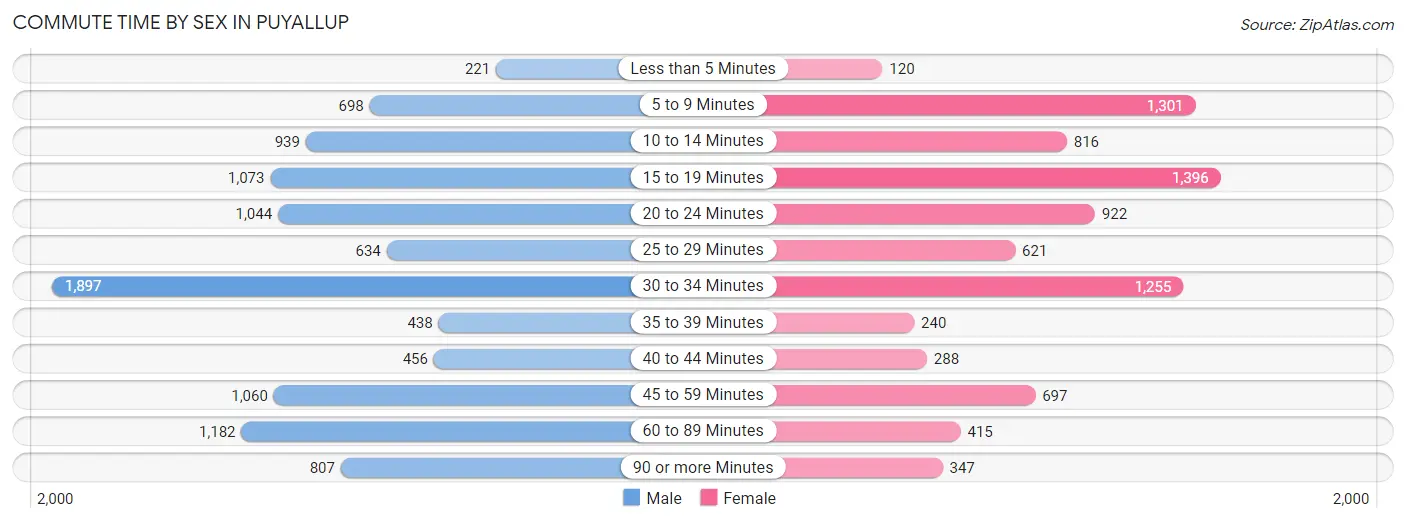
| Commute Time | Male | Female |
| Less than 5 Minutes | 221 (2.1%) | 120 (1.4%) |
| 5 to 9 Minutes | 698 (6.7%) | 1,301 (15.4%) |
| 10 to 14 Minutes | 939 (9.0%) | 816 (9.7%) |
| 15 to 19 Minutes | 1,073 (10.3%) | 1,396 (16.6%) |
| 20 to 24 Minutes | 1,044 (10.0%) | 922 (11.0%) |
| 25 to 29 Minutes | 634 (6.1%) | 621 (7.4%) |
| 30 to 34 Minutes | 1,897 (18.1%) | 1,255 (14.9%) |
| 35 to 39 Minutes | 438 (4.2%) | 240 (2.9%) |
| 40 to 44 Minutes | 456 (4.4%) | 288 (3.4%) |
| 45 to 59 Minutes | 1,060 (10.1%) | 697 (8.3%) |
| 60 to 89 Minutes | 1,182 (11.3%) | 415 (4.9%) |
| 90 or more Minutes | 807 (7.7%) | 347 (4.1%) |
Time of Departure to Work by Sex in Puyallup
The most frequent times of departure to work in Puyallup are 12:00 AM to 4:59 AM (1,441, 13.8%) for males and 7:00 AM to 7:29 AM (1,285, 15.3%) for females.
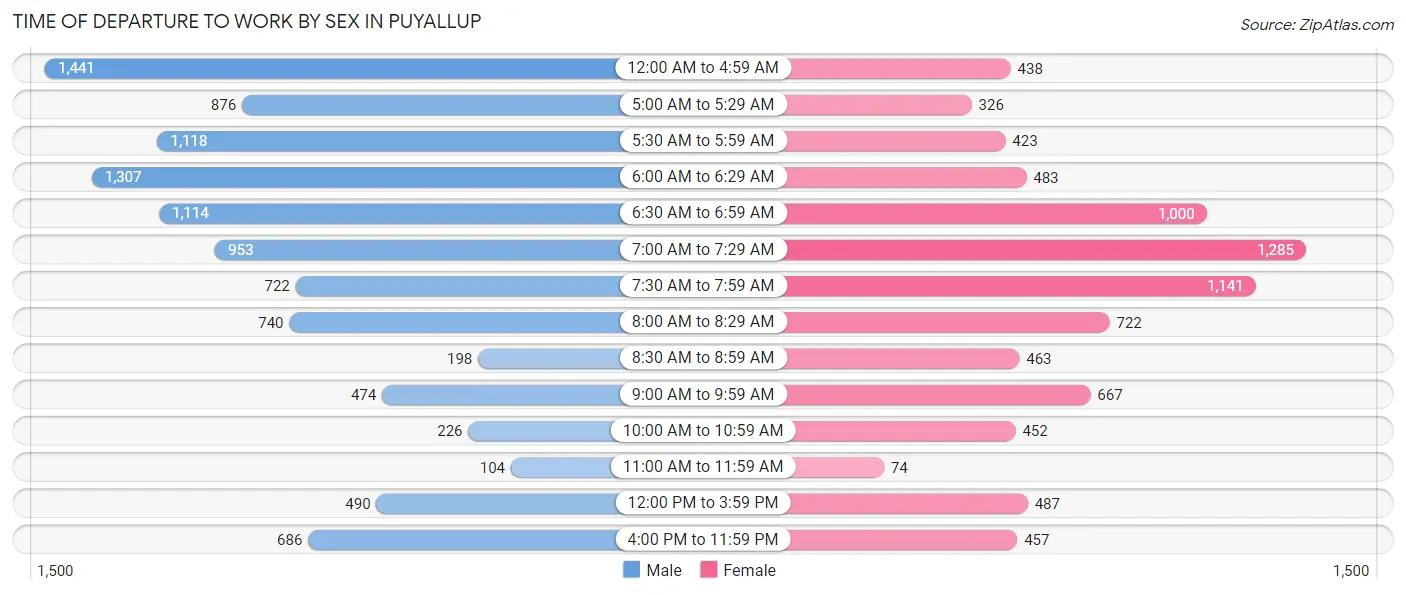
| Time of Departure | Male | Female |
| 12:00 AM to 4:59 AM | 1,441 (13.8%) | 438 (5.2%) |
| 5:00 AM to 5:29 AM | 876 (8.4%) | 326 (3.9%) |
| 5:30 AM to 5:59 AM | 1,118 (10.7%) | 423 (5.0%) |
| 6:00 AM to 6:29 AM | 1,307 (12.5%) | 483 (5.7%) |
| 6:30 AM to 6:59 AM | 1,114 (10.7%) | 1,000 (11.9%) |
| 7:00 AM to 7:29 AM | 953 (9.1%) | 1,285 (15.3%) |
| 7:30 AM to 7:59 AM | 722 (6.9%) | 1,141 (13.6%) |
| 8:00 AM to 8:29 AM | 740 (7.1%) | 722 (8.6%) |
| 8:30 AM to 8:59 AM | 198 (1.9%) | 463 (5.5%) |
| 9:00 AM to 9:59 AM | 474 (4.5%) | 667 (7.9%) |
| 10:00 AM to 10:59 AM | 226 (2.2%) | 452 (5.4%) |
| 11:00 AM to 11:59 AM | 104 (1.0%) | 74 (0.9%) |
| 12:00 PM to 3:59 PM | 490 (4.7%) | 487 (5.8%) |
| 4:00 PM to 11:59 PM | 686 (6.6%) | 457 (5.4%) |
| Total | 10,449 (100.0%) | 8,418 (100.0%) |
Housing Occupancy in Puyallup
Occupancy by Ownership in Puyallup
Of the total 16,583 dwellings in Puyallup, owner-occupied units account for 8,508 (51.3%), while renter-occupied units make up 8,075 (48.7%).
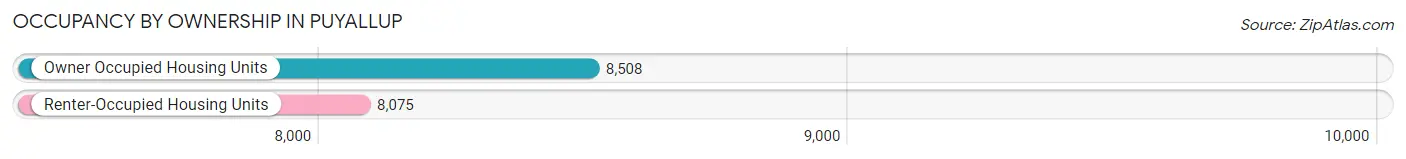
| Occupancy | # Housing Units | % Housing Units |
| Owner Occupied Housing Units | 8,508 | 51.3% |
| Renter-Occupied Housing Units | 8,075 | 48.7% |
| Total Occupied Housing Units | 16,583 | 100.0% |
Occupancy by Household Size in Puyallup
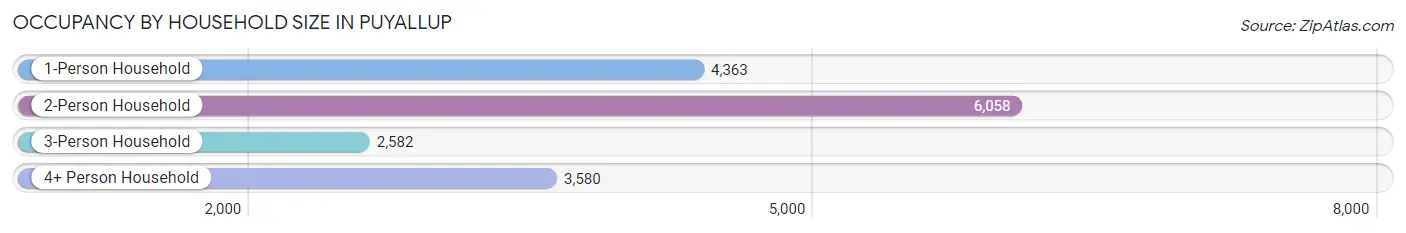
| Household Size | # Housing Units | % Housing Units |
| 1-Person Household | 4,363 | 26.3% |
| 2-Person Household | 6,058 | 36.5% |
| 3-Person Household | 2,582 | 15.6% |
| 4+ Person Household | 3,580 | 21.6% |
| Total Housing Units | 16,583 | 100.0% |
Occupancy by Ownership by Household Size in Puyallup
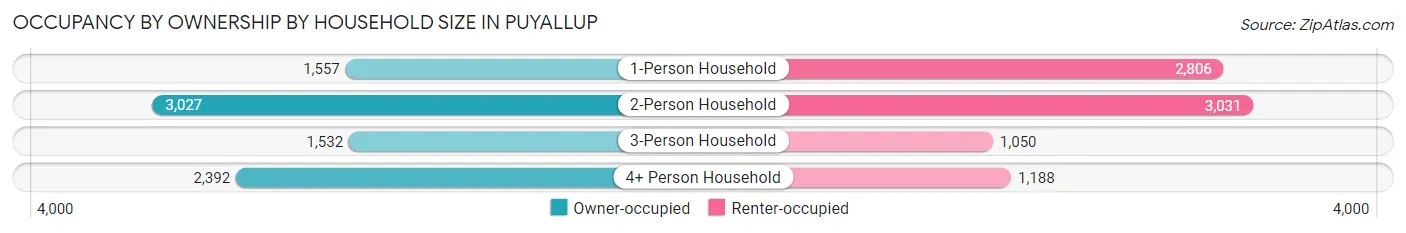
| Household Size | Owner-occupied | Renter-occupied |
| 1-Person Household | 1,557 (35.7%) | 2,806 (64.3%) |
| 2-Person Household | 3,027 (50.0%) | 3,031 (50.0%) |
| 3-Person Household | 1,532 (59.3%) | 1,050 (40.7%) |
| 4+ Person Household | 2,392 (66.8%) | 1,188 (33.2%) |
| Total Housing Units | 8,508 (51.3%) | 8,075 (48.7%) |
Occupancy by Educational Attainment in Puyallup
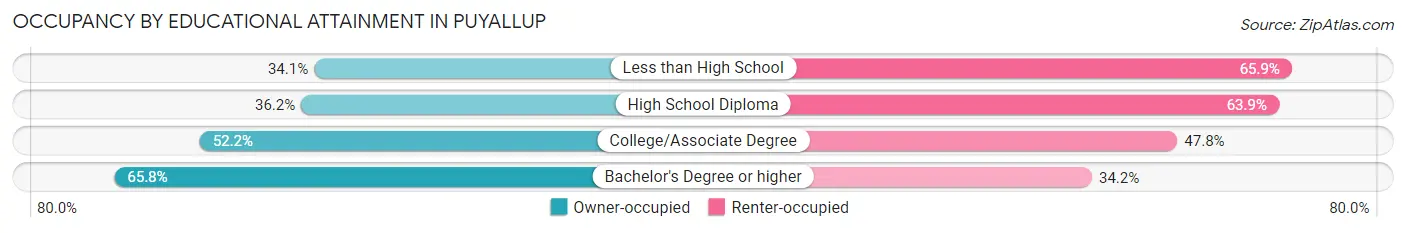
| Household Size | Owner-occupied | Renter-occupied |
| Less than High School | 251 (34.1%) | 485 (65.9%) |
| High School Diploma | 1,481 (36.1%) | 2,616 (63.8%) |
| College/Associate Degree | 3,665 (52.2%) | 3,354 (47.8%) |
| Bachelor's Degree or higher | 3,111 (65.8%) | 1,620 (34.2%) |
Occupancy by Age of Householder in Puyallup
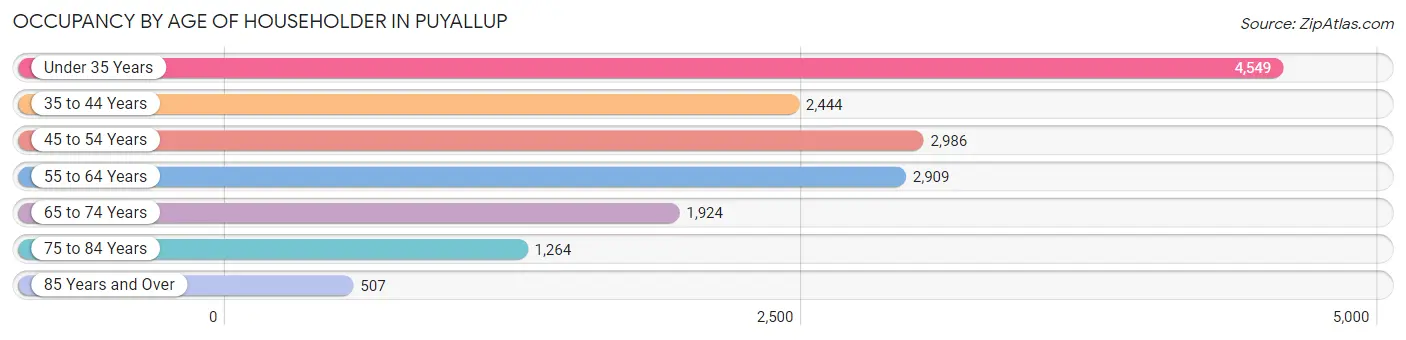
| Age Bracket | # Households | % Households |
| Under 35 Years | 4,549 | 27.4% |
| 35 to 44 Years | 2,444 | 14.7% |
| 45 to 54 Years | 2,986 | 18.0% |
| 55 to 64 Years | 2,909 | 17.5% |
| 65 to 74 Years | 1,924 | 11.6% |
| 75 to 84 Years | 1,264 | 7.6% |
| 85 Years and Over | 507 | 3.1% |
| Total | 16,583 | 100.0% |
Housing Finances in Puyallup
Median Income by Occupancy in Puyallup
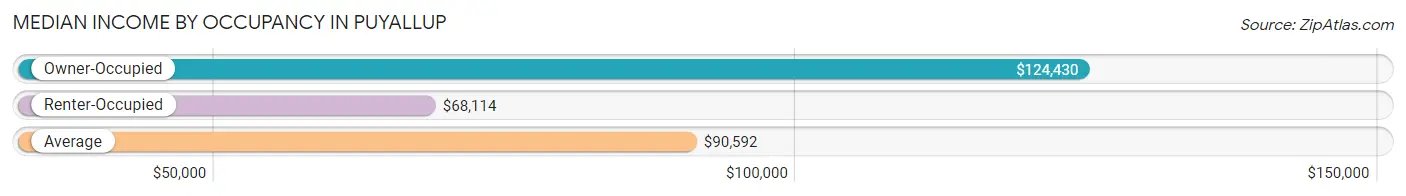
| Occupancy Type | # Households | Median Income |
| Owner-Occupied | 8,508 (51.3%) | $124,430 |
| Renter-Occupied | 8,075 (48.7%) | $68,114 |
| Average | 16,583 (100.0%) | $90,592 |
Occupancy by Householder Income Bracket in Puyallup
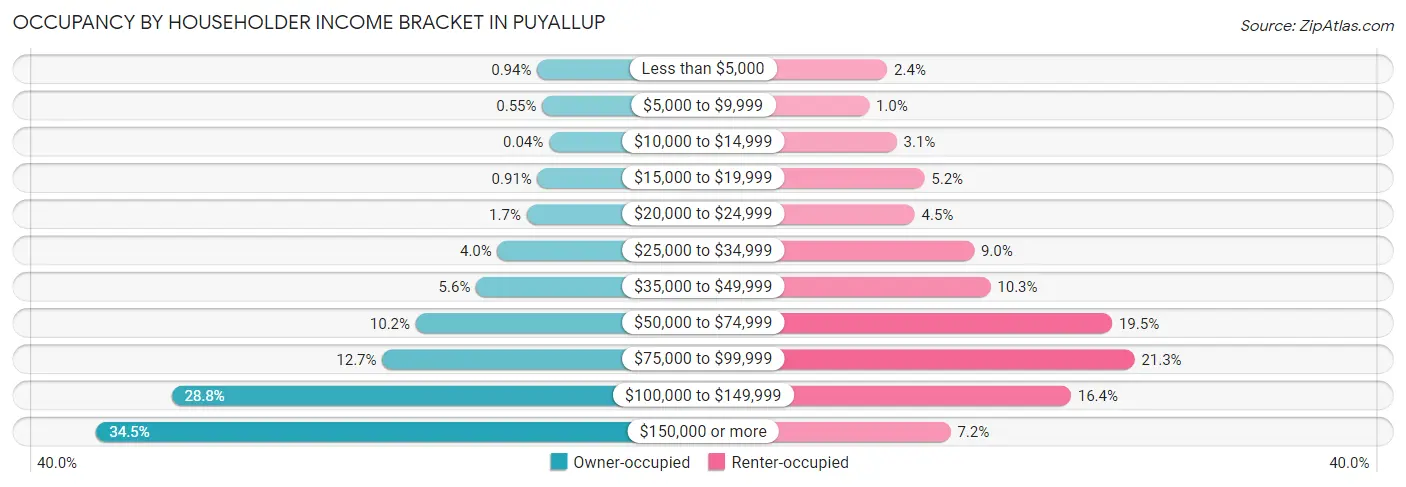
| Income Bracket | Owner-occupied | Renter-occupied |
| Less than $5,000 | 80 (0.9%) | 195 (2.4%) |
| $5,000 to $9,999 | 47 (0.5%) | 82 (1.0%) |
| $10,000 to $14,999 | 3 (0.0%) | 253 (3.1%) |
| $15,000 to $19,999 | 77 (0.9%) | 423 (5.2%) |
| $20,000 to $24,999 | 148 (1.7%) | 363 (4.5%) |
| $25,000 to $34,999 | 337 (4.0%) | 728 (9.0%) |
| $35,000 to $49,999 | 476 (5.6%) | 829 (10.3%) |
| $50,000 to $74,999 | 867 (10.2%) | 1,578 (19.5%) |
| $75,000 to $99,999 | 1,084 (12.7%) | 1,716 (21.2%) |
| $100,000 to $149,999 | 2,451 (28.8%) | 1,324 (16.4%) |
| $150,000 or more | 2,938 (34.5%) | 584 (7.2%) |
| Total | 8,508 (100.0%) | 8,075 (100.0%) |
Monthly Housing Cost Tiers in Puyallup
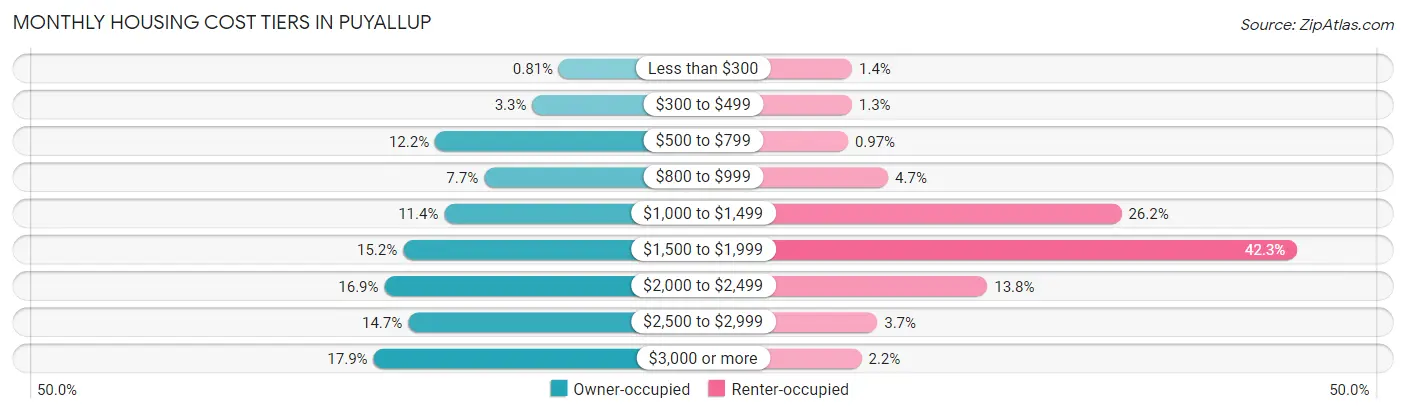
| Monthly Cost | Owner-occupied | Renter-occupied |
| Less than $300 | 69 (0.8%) | 109 (1.3%) |
| $300 to $499 | 277 (3.3%) | 107 (1.3%) |
| $500 to $799 | 1,040 (12.2%) | 78 (1.0%) |
| $800 to $999 | 656 (7.7%) | 377 (4.7%) |
| $1,000 to $1,499 | 967 (11.4%) | 2,112 (26.2%) |
| $1,500 to $1,999 | 1,290 (15.2%) | 3,417 (42.3%) |
| $2,000 to $2,499 | 1,436 (16.9%) | 1,114 (13.8%) |
| $2,500 to $2,999 | 1,251 (14.7%) | 296 (3.7%) |
| $3,000 or more | 1,522 (17.9%) | 179 (2.2%) |
| Total | 8,508 (100.0%) | 8,075 (100.0%) |
Physical Housing Characteristics in Puyallup
Housing Structures in Puyallup
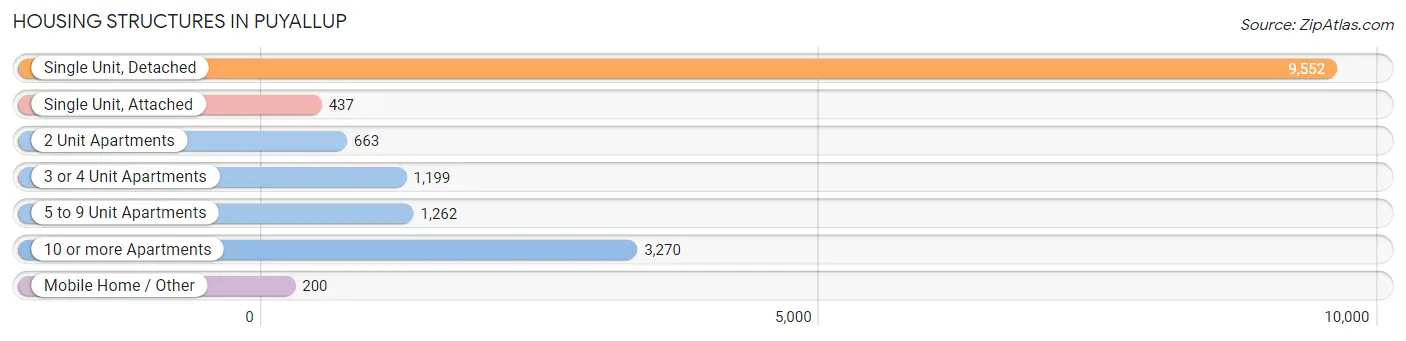
| Structure Type | # Housing Units | % Housing Units |
| Single Unit, Detached | 9,552 | 57.6% |
| Single Unit, Attached | 437 | 2.6% |
| 2 Unit Apartments | 663 | 4.0% |
| 3 or 4 Unit Apartments | 1,199 | 7.2% |
| 5 to 9 Unit Apartments | 1,262 | 7.6% |
| 10 or more Apartments | 3,270 | 19.7% |
| Mobile Home / Other | 200 | 1.2% |
| Total | 16,583 | 100.0% |
Housing Structures by Occupancy in Puyallup
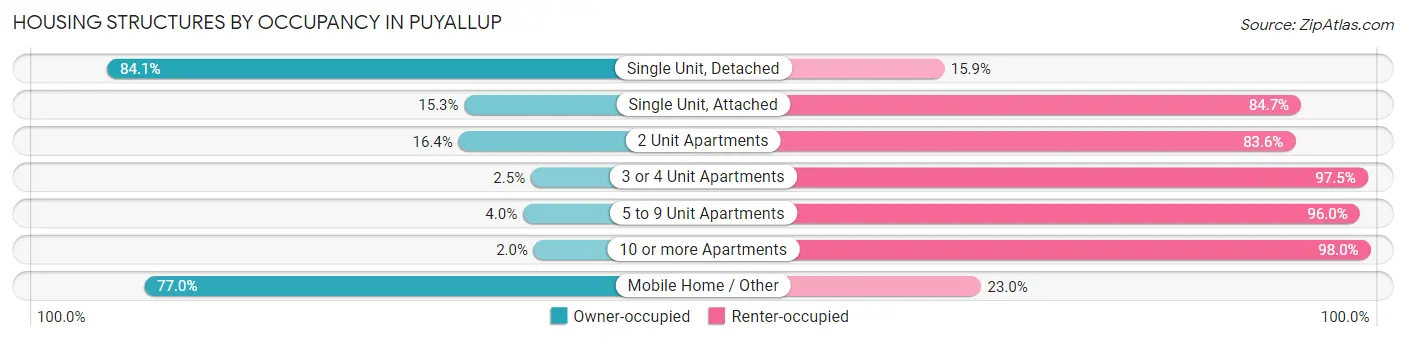
| Structure Type | Owner-occupied | Renter-occupied |
| Single Unit, Detached | 8,033 (84.1%) | 1,519 (15.9%) |
| Single Unit, Attached | 67 (15.3%) | 370 (84.7%) |
| 2 Unit Apartments | 109 (16.4%) | 554 (83.6%) |
| 3 or 4 Unit Apartments | 30 (2.5%) | 1,169 (97.5%) |
| 5 to 9 Unit Apartments | 51 (4.0%) | 1,211 (96.0%) |
| 10 or more Apartments | 64 (2.0%) | 3,206 (98.0%) |
| Mobile Home / Other | 154 (77.0%) | 46 (23.0%) |
| Total | 8,508 (51.3%) | 8,075 (48.7%) |
Housing Structures by Number of Rooms in Puyallup
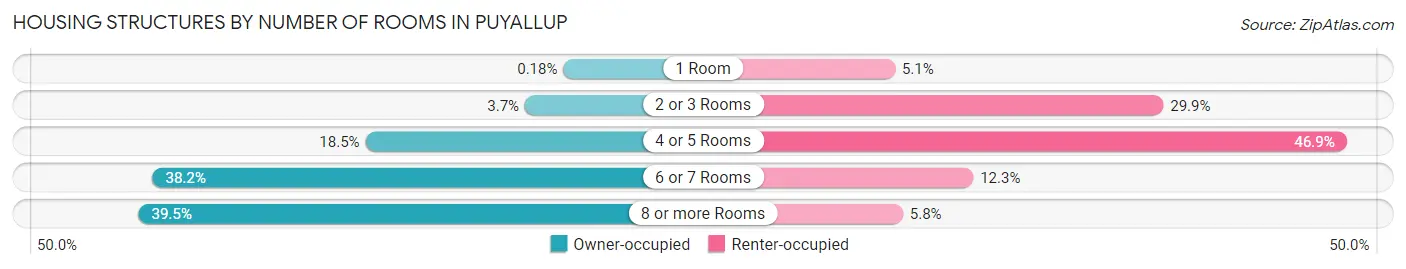
| Number of Rooms | Owner-occupied | Renter-occupied |
| 1 Room | 15 (0.2%) | 411 (5.1%) |
| 2 or 3 Rooms | 317 (3.7%) | 2,415 (29.9%) |
| 4 or 5 Rooms | 1,572 (18.5%) | 3,783 (46.9%) |
| 6 or 7 Rooms | 3,247 (38.2%) | 996 (12.3%) |
| 8 or more Rooms | 3,357 (39.5%) | 470 (5.8%) |
| Total | 8,508 (100.0%) | 8,075 (100.0%) |
Housing Structure by Heating Type in Puyallup
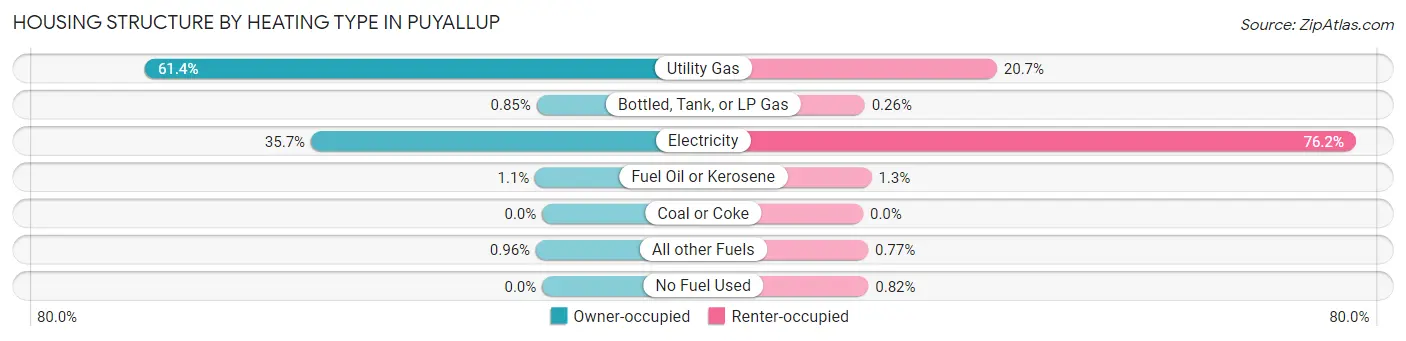
| Heating Type | Owner-occupied | Renter-occupied |
| Utility Gas | 5,222 (61.4%) | 1,671 (20.7%) |
| Bottled, Tank, or LP Gas | 72 (0.9%) | 21 (0.3%) |
| Electricity | 3,041 (35.7%) | 6,150 (76.2%) |
| Fuel Oil or Kerosene | 91 (1.1%) | 105 (1.3%) |
| Coal or Coke | 0 (0.0%) | 0 (0.0%) |
| All other Fuels | 82 (1.0%) | 62 (0.8%) |
| No Fuel Used | 0 (0.0%) | 66 (0.8%) |
| Total | 8,508 (100.0%) | 8,075 (100.0%) |
Household Vehicle Usage in Puyallup
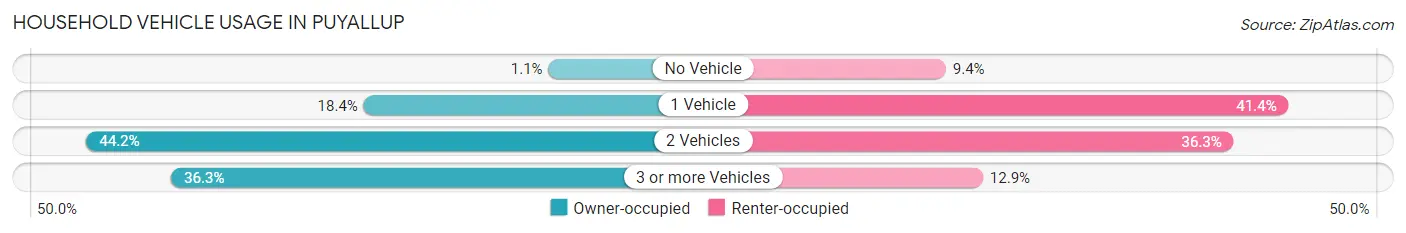
| Vehicles per Household | Owner-occupied | Renter-occupied |
| No Vehicle | 94 (1.1%) | 761 (9.4%) |
| 1 Vehicle | 1,561 (18.3%) | 3,344 (41.4%) |
| 2 Vehicles | 3,763 (44.2%) | 2,930 (36.3%) |
| 3 or more Vehicles | 3,090 (36.3%) | 1,040 (12.9%) |
| Total | 8,508 (100.0%) | 8,075 (100.0%) |
Real Estate & Mortgages in Puyallup
Real Estate and Mortgage Overview in Puyallup
| Characteristic | Without Mortgage | With Mortgage |
| Housing Units | 2,403 | 6,105 |
| Median Property Value | $439,700 | $475,300 |
| Median Household Income | $90,233 | $2,378 |
| Monthly Housing Costs | $765 | $1,511 |
| Real Estate Taxes | $4,478 | $49 |
Property Value by Mortgage Status in Puyallup
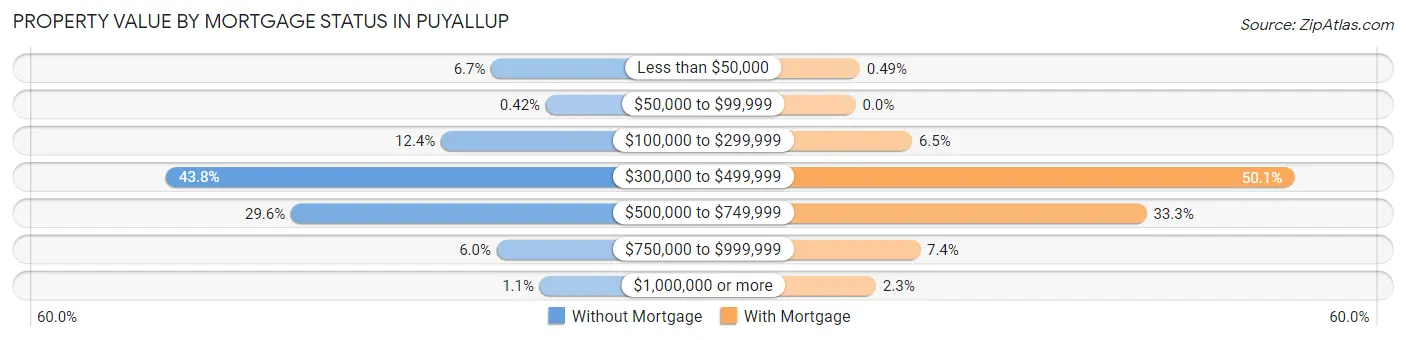
| Property Value | Without Mortgage | With Mortgage |
| Less than $50,000 | 160 (6.7%) | 30 (0.5%) |
| $50,000 to $99,999 | 10 (0.4%) | 0 (0.0%) |
| $100,000 to $299,999 | 298 (12.4%) | 394 (6.5%) |
| $300,000 to $499,999 | 1,053 (43.8%) | 3,059 (50.1%) |
| $500,000 to $749,999 | 710 (29.5%) | 2,030 (33.3%) |
| $750,000 to $999,999 | 145 (6.0%) | 450 (7.4%) |
| $1,000,000 or more | 27 (1.1%) | 142 (2.3%) |
| Total | 2,403 (100.0%) | 6,105 (100.0%) |
Household Income by Mortgage Status in Puyallup
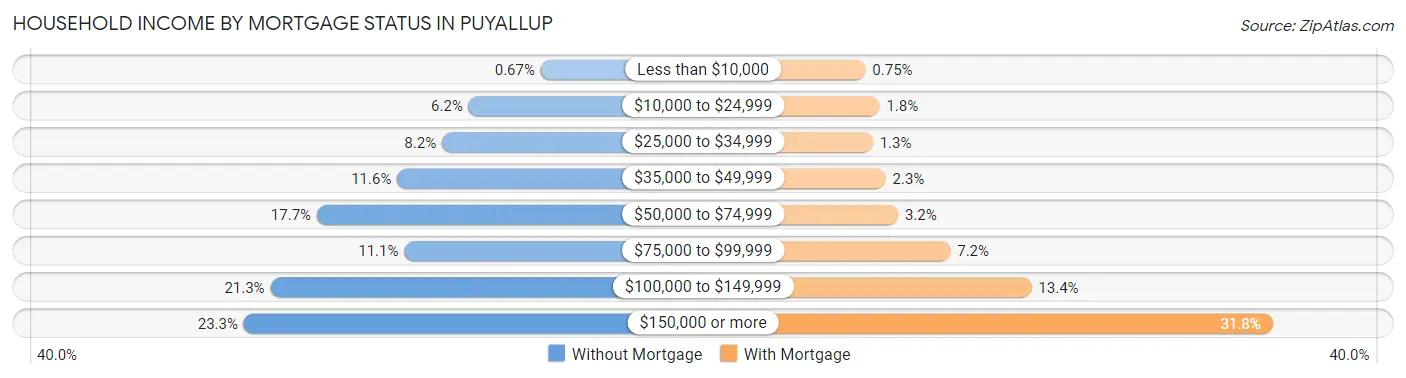
| Household Income | Without Mortgage | With Mortgage |
| Less than $10,000 | 16 (0.7%) | 46 (0.7%) |
| $10,000 to $24,999 | 148 (6.2%) | 111 (1.8%) |
| $25,000 to $34,999 | 197 (8.2%) | 80 (1.3%) |
| $35,000 to $49,999 | 279 (11.6%) | 140 (2.3%) |
| $50,000 to $74,999 | 426 (17.7%) | 197 (3.2%) |
| $75,000 to $99,999 | 266 (11.1%) | 441 (7.2%) |
| $100,000 to $149,999 | 511 (21.3%) | 818 (13.4%) |
| $150,000 or more | 560 (23.3%) | 1,940 (31.8%) |
| Total | 2,403 (100.0%) | 6,105 (100.0%) |
Property Value to Household Income Ratio in Puyallup
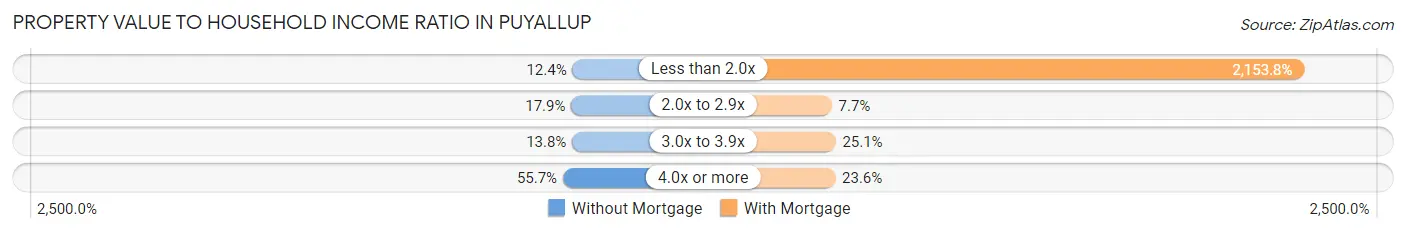
| Value-to-Income Ratio | Without Mortgage | With Mortgage |
| Less than 2.0x | 297 (12.4%) | 131,492 (2,153.8%) |
| 2.0x to 2.9x | 429 (17.8%) | 472 (7.7%) |
| 3.0x to 3.9x | 331 (13.8%) | 1,533 (25.1%) |
| 4.0x or more | 1,339 (55.7%) | 1,438 (23.5%) |
| Total | 2,403 (100.0%) | 6,105 (100.0%) |
Real Estate Taxes by Mortgage Status in Puyallup
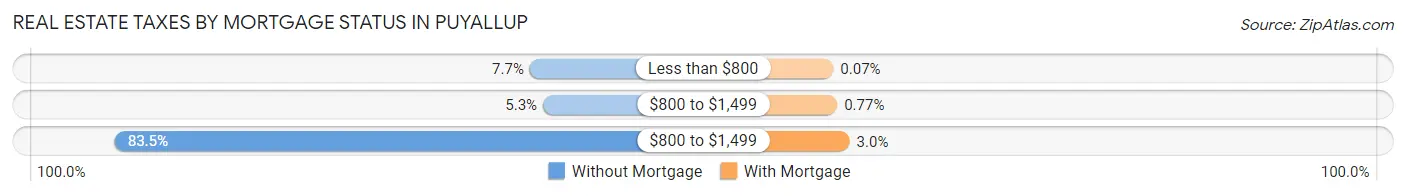
| Property Taxes | Without Mortgage | With Mortgage |
| Less than $800 | 186 (7.7%) | 4 (0.1%) |
| $800 to $1,499 | 128 (5.3%) | 47 (0.8%) |
| $800 to $1,499 | 2,007 (83.5%) | 185 (3.0%) |
| Total | 2,403 (100.0%) | 6,105 (100.0%) |
Health & Disability in Puyallup
Health Insurance Coverage by Age in Puyallup
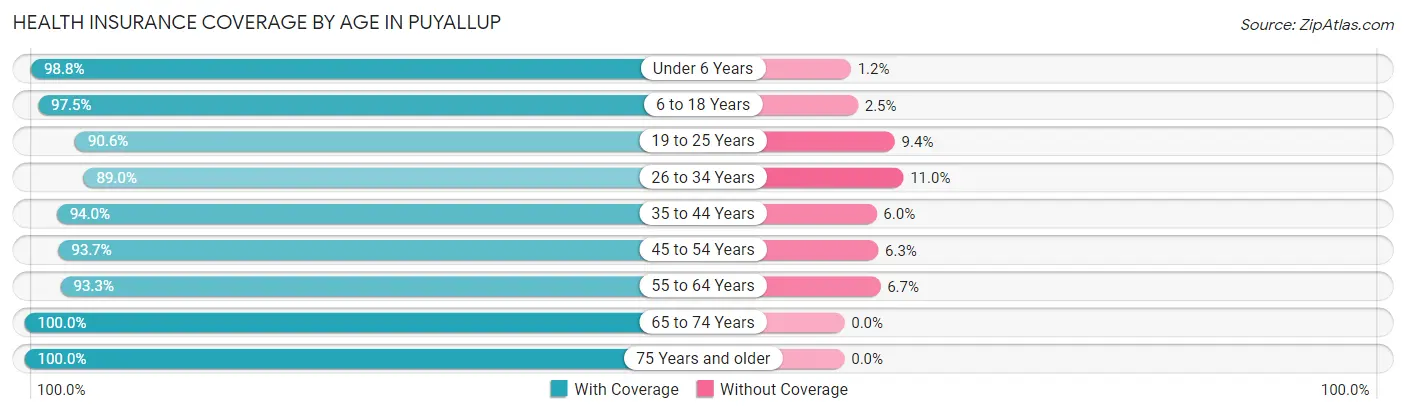
| Age Bracket | With Coverage | Without Coverage |
| Under 6 Years | 3,140 (98.8%) | 38 (1.2%) |
| 6 to 18 Years | 6,376 (97.5%) | 165 (2.5%) |
| 19 to 25 Years | 3,629 (90.6%) | 376 (9.4%) |
| 26 to 34 Years | 5,985 (89.0%) | 739 (11.0%) |
| 35 to 44 Years | 4,943 (94.0%) | 315 (6.0%) |
| 45 to 54 Years | 5,055 (93.7%) | 340 (6.3%) |
| 55 to 64 Years | 4,543 (93.3%) | 326 (6.7%) |
| 65 to 74 Years | 3,168 (100.0%) | 0 (0.0%) |
| 75 Years and older | 2,720 (100.0%) | 0 (0.0%) |
| Total | 39,559 (94.5%) | 2,299 (5.5%) |
Health Insurance Coverage by Citizenship Status in Puyallup
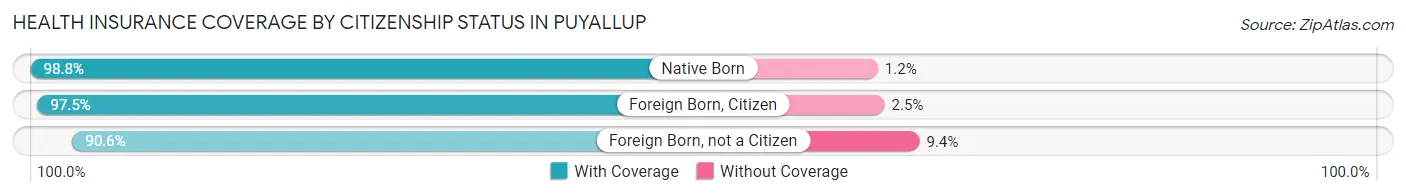
| Citizenship Status | With Coverage | Without Coverage |
| Native Born | 3,140 (98.8%) | 38 (1.2%) |
| Foreign Born, Citizen | 6,376 (97.5%) | 165 (2.5%) |
| Foreign Born, not a Citizen | 3,629 (90.6%) | 376 (9.4%) |
Health Insurance Coverage by Household Income in Puyallup
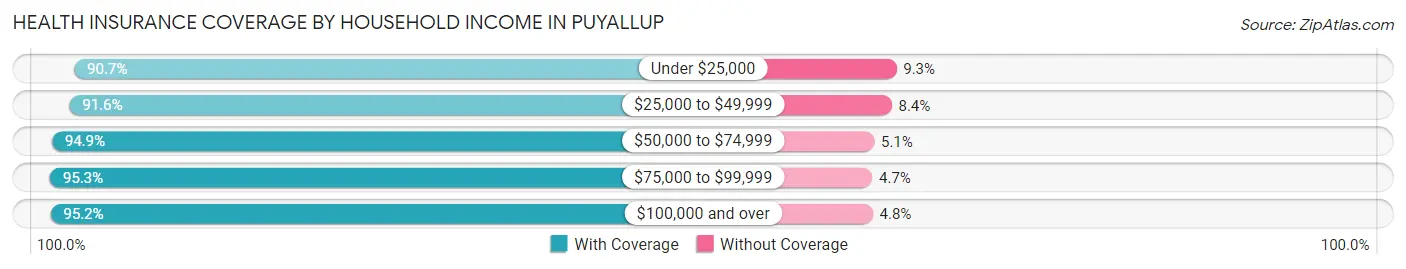
| Household Income | With Coverage | Without Coverage |
| Under $25,000 | 2,585 (90.7%) | 264 (9.3%) |
| $25,000 to $49,999 | 3,782 (91.6%) | 346 (8.4%) |
| $50,000 to $74,999 | 4,926 (94.9%) | 265 (5.1%) |
| $75,000 to $99,999 | 6,457 (95.3%) | 321 (4.7%) |
| $100,000 and over | 21,510 (95.2%) | 1,091 (4.8%) |
Public vs Private Health Insurance Coverage by Age in Puyallup
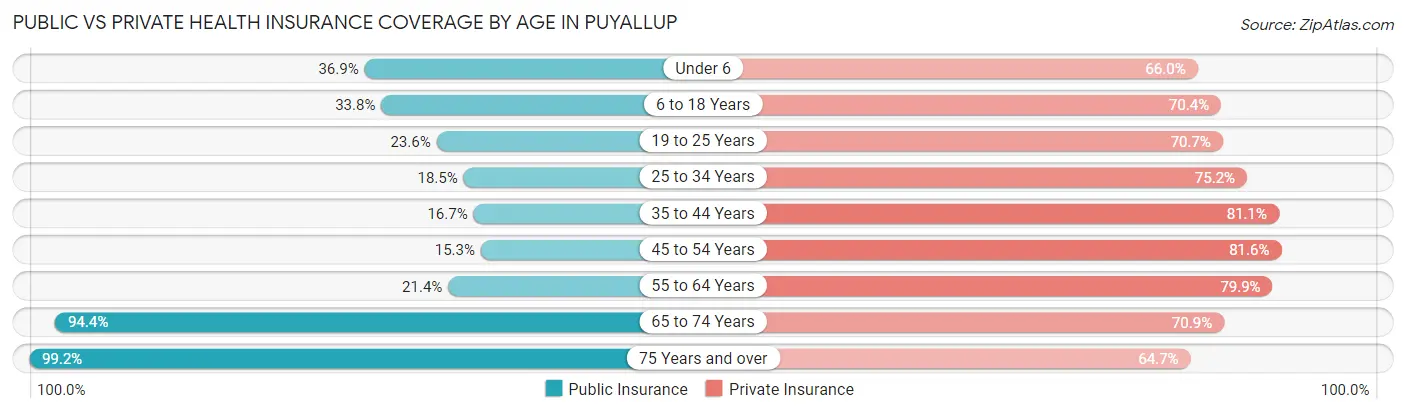
| Age Bracket | Public Insurance | Private Insurance |
| Under 6 | 1,173 (36.9%) | 2,098 (66.0%) |
| 6 to 18 Years | 2,211 (33.8%) | 4,605 (70.4%) |
| 19 to 25 Years | 943 (23.5%) | 2,831 (70.7%) |
| 25 to 34 Years | 1,246 (18.5%) | 5,056 (75.2%) |
| 35 to 44 Years | 877 (16.7%) | 4,265 (81.1%) |
| 45 to 54 Years | 827 (15.3%) | 4,400 (81.6%) |
| 55 to 64 Years | 1,041 (21.4%) | 3,892 (79.9%) |
| 65 to 74 Years | 2,989 (94.4%) | 2,247 (70.9%) |
| 75 Years and over | 2,698 (99.2%) | 1,760 (64.7%) |
| Total | 14,005 (33.5%) | 31,154 (74.4%) |
Disability Status by Sex by Age in Puyallup
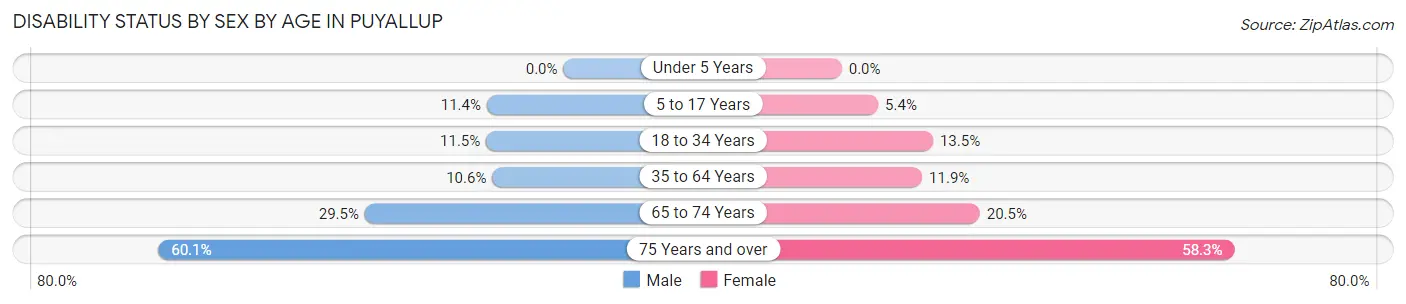
| Age Bracket | Male | Female |
| Under 5 Years | 0 (0.0%) | 0 (0.0%) |
| 5 to 17 Years | 350 (11.4%) | 189 (5.4%) |
| 18 to 34 Years | 645 (11.5%) | 752 (13.5%) |
| 35 to 64 Years | 831 (10.6%) | 913 (11.9%) |
| 65 to 74 Years | 393 (29.5%) | 376 (20.5%) |
| 75 Years and over | 608 (60.1%) | 996 (58.3%) |
Disability Class by Sex by Age in Puyallup
Disability Class: Hearing Difficulty
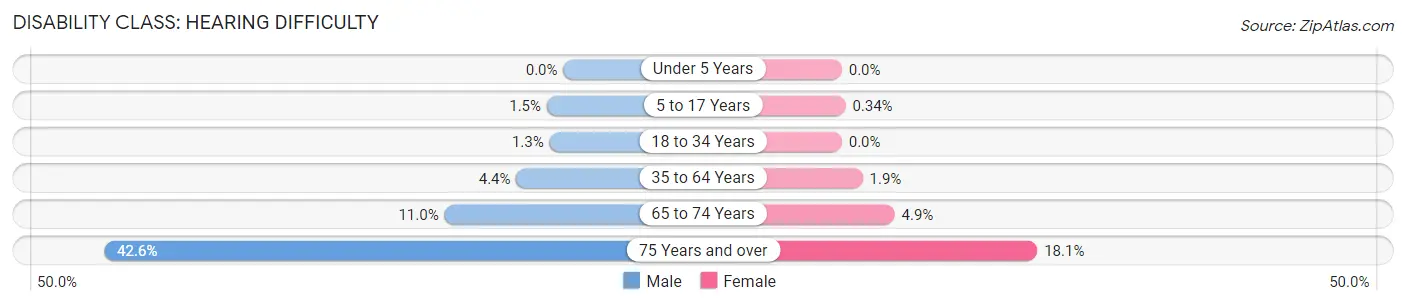
| Age Bracket | Male | Female |
| Under 5 Years | 0 (0.0%) | 0 (0.0%) |
| 5 to 17 Years | 47 (1.5%) | 12 (0.3%) |
| 18 to 34 Years | 72 (1.3%) | 0 (0.0%) |
| 35 to 64 Years | 343 (4.4%) | 148 (1.9%) |
| 65 to 74 Years | 147 (11.0%) | 90 (4.9%) |
| 75 Years and over | 431 (42.6%) | 310 (18.1%) |
Disability Class: Vision Difficulty
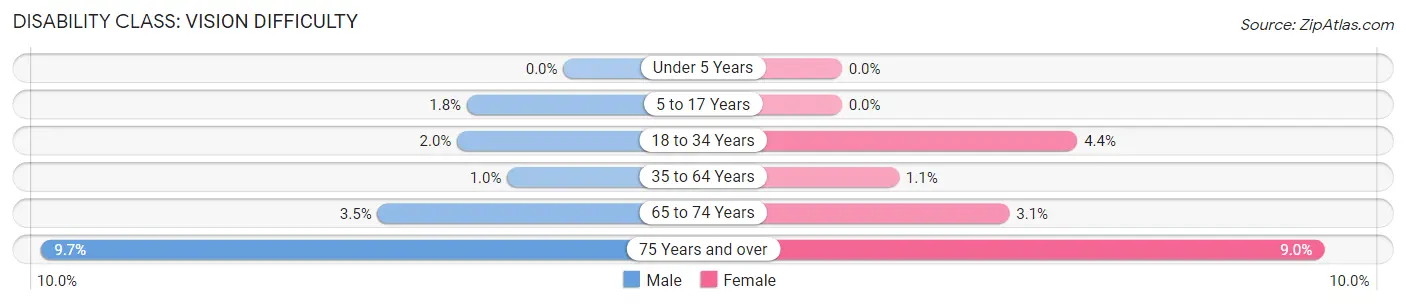
| Age Bracket | Male | Female |
| Under 5 Years | 0 (0.0%) | 0 (0.0%) |
| 5 to 17 Years | 55 (1.8%) | 0 (0.0%) |
| 18 to 34 Years | 111 (2.0%) | 243 (4.4%) |
| 35 to 64 Years | 82 (1.0%) | 81 (1.1%) |
| 65 to 74 Years | 46 (3.5%) | 57 (3.1%) |
| 75 Years and over | 98 (9.7%) | 153 (8.9%) |
Disability Class: Cognitive Difficulty
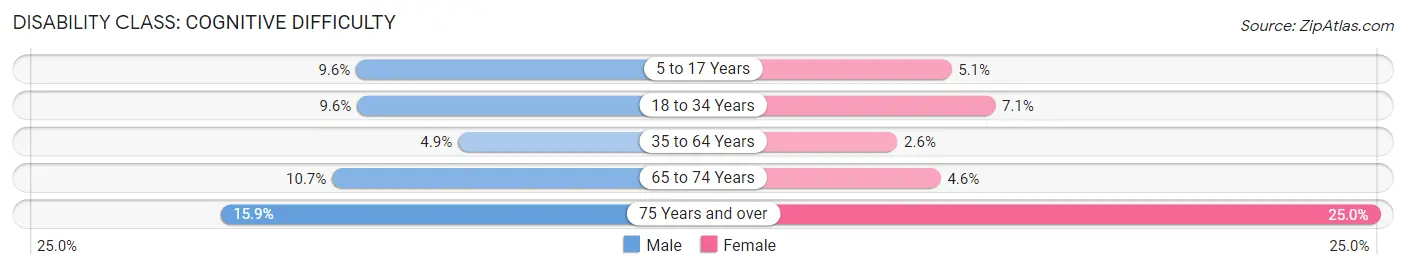
| Age Bracket | Male | Female |
| 5 to 17 Years | 296 (9.6%) | 178 (5.1%) |
| 18 to 34 Years | 538 (9.6%) | 395 (7.1%) |
| 35 to 64 Years | 385 (4.9%) | 197 (2.6%) |
| 65 to 74 Years | 143 (10.7%) | 84 (4.6%) |
| 75 Years and over | 161 (15.9%) | 427 (25.0%) |
Disability Class: Ambulatory Difficulty
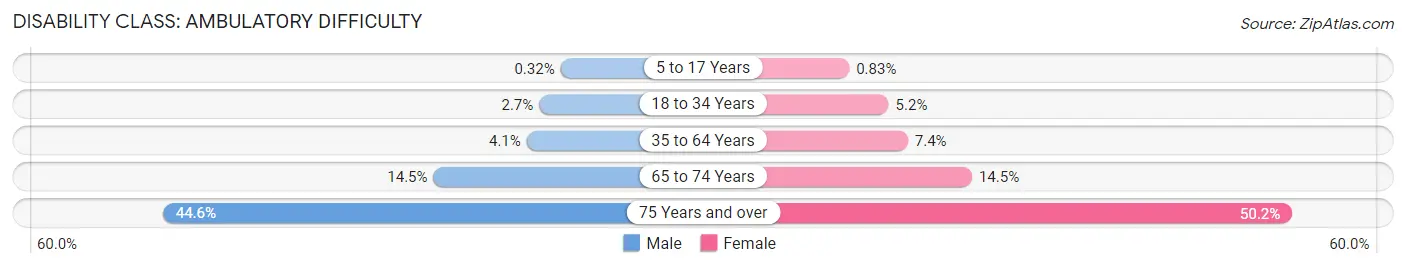
| Age Bracket | Male | Female |
| 5 to 17 Years | 10 (0.3%) | 29 (0.8%) |
| 18 to 34 Years | 152 (2.7%) | 290 (5.2%) |
| 35 to 64 Years | 322 (4.1%) | 563 (7.4%) |
| 65 to 74 Years | 193 (14.5%) | 266 (14.5%) |
| 75 Years and over | 451 (44.6%) | 857 (50.1%) |
Disability Class: Self-Care Difficulty
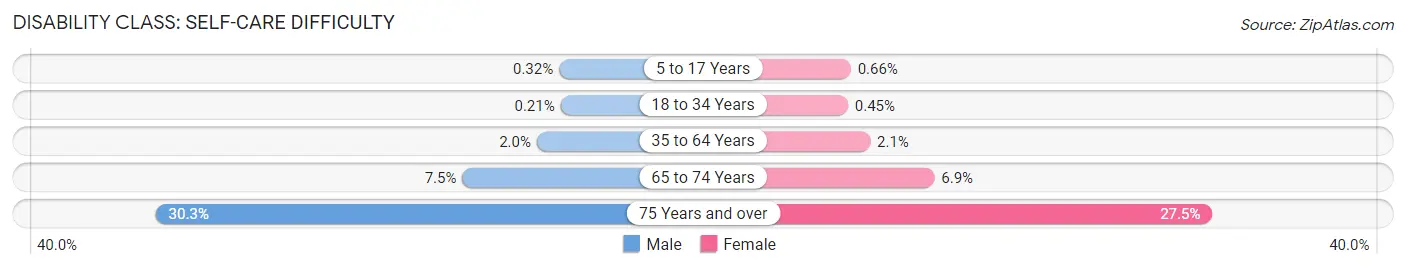
| Age Bracket | Male | Female |
| 5 to 17 Years | 10 (0.3%) | 23 (0.7%) |
| 18 to 34 Years | 12 (0.2%) | 25 (0.4%) |
| 35 to 64 Years | 155 (2.0%) | 161 (2.1%) |
| 65 to 74 Years | 100 (7.5%) | 126 (6.9%) |
| 75 Years and over | 306 (30.3%) | 470 (27.5%) |
Technology Access in Puyallup
Computing Device Access in Puyallup
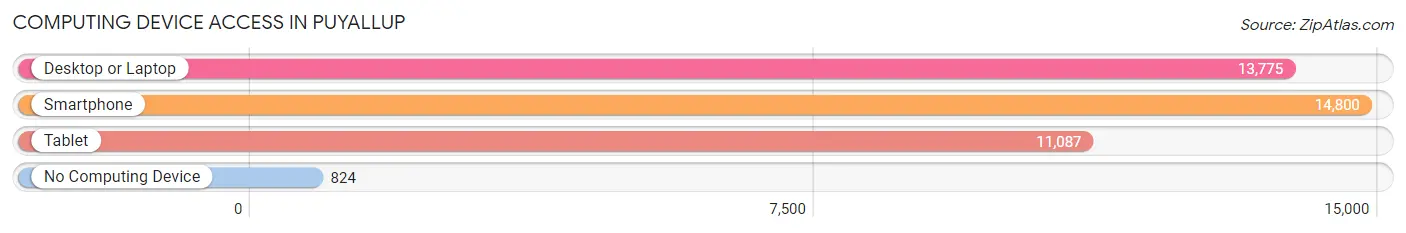
| Device Type | # Households | % Households |
| Desktop or Laptop | 13,775 | 83.1% |
| Smartphone | 14,800 | 89.2% |
| Tablet | 11,087 | 66.9% |
| No Computing Device | 824 | 5.0% |
| Total | 16,583 | 100.0% |
Internet Access in Puyallup
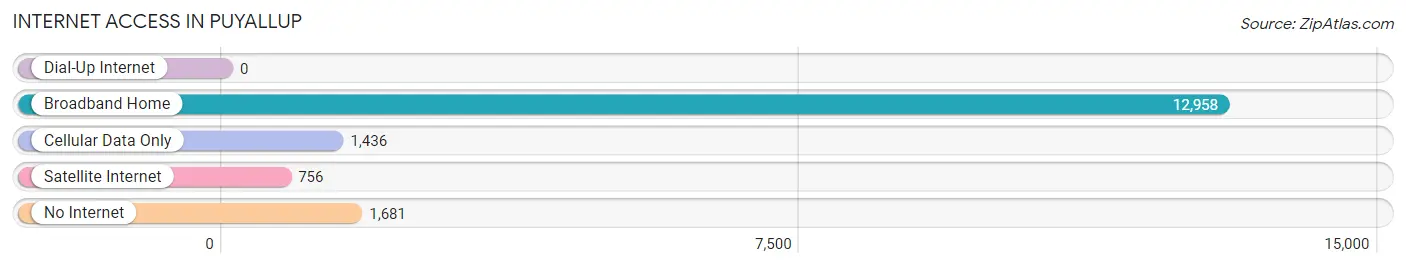
| Internet Type | # Households | % Households |
| Dial-Up Internet | 0 | 0.0% |
| Broadband Home | 12,958 | 78.1% |
| Cellular Data Only | 1,436 | 8.7% |
| Satellite Internet | 756 | 4.6% |
| No Internet | 1,681 | 10.1% |
| Total | 16,583 | 100.0% |
Puyallup Summary
Puyallup, Washington is a city located in Pierce County, Washington, United States. The population was 37,022 at the 2010 census. Puyallup is the third largest city in Pierce County and the fourth largest in the state of Washington. It is located about 10 miles (16 km) southeast of Tacoma and 35 miles (56 km) south of Seattle.
History
The area around Puyallup was first inhabited by the Puyallup Tribe of Native Americans. The tribe's name means "generous and welcoming behavior to all people who enter our lands." The first European settlers arrived in the area in 1853. The town was officially incorporated in 1890.
The city was named after the Puyallup Tribe and was originally called "New Tacoma." The name was changed to Puyallup in 1891.
The city has a rich history of logging, farming, and fishing. It was also home to the first commercial hop farm in the United States. The hop farm was established in 1872 and was a major source of income for the city until the early 1900s.
Geography
Puyallup is located at 47°10′N 122°17′W (47.17, -122.28). It is situated in the Puyallup Valley, which is surrounded by the Cascade Range to the east and the Olympic Mountains to the west. The city is located about 10 miles (16 km) southeast of Tacoma and 35 miles (56 km) south of Seattle.
The city has a total area of 11.2 square miles (29 km2), of which 11.1 square miles (29 km2) is land and 0.1 square miles (0.26 km2) is water.
Economy
Puyallup is a major center for agriculture and food processing in the Puget Sound region. The city is home to several large food processing companies, including the Puyallup Valley Canning Company, the Puyallup Valley Dairy, and the Puyallup Valley Fruit and Vegetable Company.
The city is also home to several large retail stores, including the South Hill Mall, the Puyallup Valley Mall, and the Puyallup Valley Shopping Center.
Demographics
As of the 2010 census, there were 37,022 people, 14,845 households, and 9,845 families residing in the city. The population density was 3,312.3 people per square mile (1,277.3/km2). There were 15,845 housing units at an average density of 1,420.3 per square mile (548.7/km2).
The racial makeup of the city was 77.2% White, 5.3% African American, 1.3% Native American, 5.2% Asian, 0.3% Pacific Islander, 5.2% from other races, and 5.7% from two or more races. Hispanic or Latino of any race were 11.2% of the population.
The median income for a household in the city was $50,945, and the median income for a family was $60,945. Males had a median income of $45,945 versus $35,945 for females. The per capita income for the city was $25,945. About 6.2% of families and 8.3% of the population were below the poverty line, including 11.2% of those under age 18 and 6.2% of those age 65 or over.
Common Questions
What is Per Capita Income in Puyallup?
Per Capita income in Puyallup is $42,541.
What is the Median Family Income in Puyallup?
Median Family Income in Puyallup is $109,877.
What is the Median Household income in Puyallup?
Median Household Income in Puyallup is $90,592.
What is Income or Wage Gap in Puyallup?
Income or Wage Gap in Puyallup is 27.9%.
Women in Puyallup earn 72.1 cents for every dollar earned by a man.
What is Family Income Deficit in Puyallup?
Family Income Deficit in Puyallup is $12,504.
Families that are below poverty line in Puyallup earn $12,504 less on average than the poverty threshold level.
What is Inequality or Gini Index in Puyallup?
Inequality or Gini Index in Puyallup is 0.39.
What is the Total Population of Puyallup?
Total Population of Puyallup is 42,610.
What is the Total Male Population of Puyallup?
Total Male Population of Puyallup is 20,572.
What is the Total Female Population of Puyallup?
Total Female Population of Puyallup is 22,038.
What is the Ratio of Males per 100 Females in Puyallup?
There are 93.35 Males per 100 Females in Puyallup.
What is the Ratio of Females per 100 Males in Puyallup?
There are 107.13 Females per 100 Males in Puyallup.
What is the Median Population Age in Puyallup?
Median Population Age in Puyallup is 36.9 Years.
What is the Average Family Size in Puyallup
Average Family Size in Puyallup is 3.1 People.
What is the Average Household Size in Puyallup
Average Household Size in Puyallup is 2.5 People.
How Large is the Labor Force in Puyallup?
There are 22,643 People in the Labor Forcein in Puyallup.
What is the Percentage of People in the Labor Force in Puyallup?
66.0% of People are in the Labor Force in Puyallup.
What is the Unemployment Rate in Puyallup?
Unemployment Rate in Puyallup is 6.3%.