Clover Creek, WA Map & Demographics
Clover Creek Map
Clover Creek Overview
$40,625
PER CAPITA INCOME
$94,922
AVG FAMILY INCOME
$90,688
AVG HOUSEHOLD INCOME
27.3%
WAGE / INCOME GAP [ % ]
72.7¢/ $1
WAGE / INCOME GAP [ $ ]
0.34
INEQUALITY / GINI INDEX
7,354
TOTAL POPULATION
3,759
MALE POPULATION
3,595
FEMALE POPULATION
104.56
MALES / 100 FEMALES
95.64
FEMALES / 100 MALES
41.0
MEDIAN AGE
3.0
AVG FAMILY SIZE
2.6
AVG HOUSEHOLD SIZE
4,355
LABOR FORCE [ PEOPLE ]
70.6%
PERCENT IN LABOR FORCE
7.1%
UNEMPLOYMENT RATE
Income in Clover Creek
Income Overview in Clover Creek
Per Capita Income in Clover Creek is $40,625, while median incomes of families and households are $94,922 and $90,688 respectively.
| Characteristic | Number | Measure |
| Per Capita Income | 7,354 | $40,625 |
| Median Family Income | 1,786 | $94,922 |
| Mean Family Income | 1,786 | $114,064 |
| Median Household Income | 2,811 | $90,688 |
| Mean Household Income | 2,811 | $103,339 |
| Income Deficit | 1,786 | $0 |
| Wage / Income Gap (%) | 7,354 | 27.33% |
| Wage / Income Gap ($) | 7,354 | 72.67¢ per $1 |
| Gini / Inequality Index | 7,354 | 0.34 |
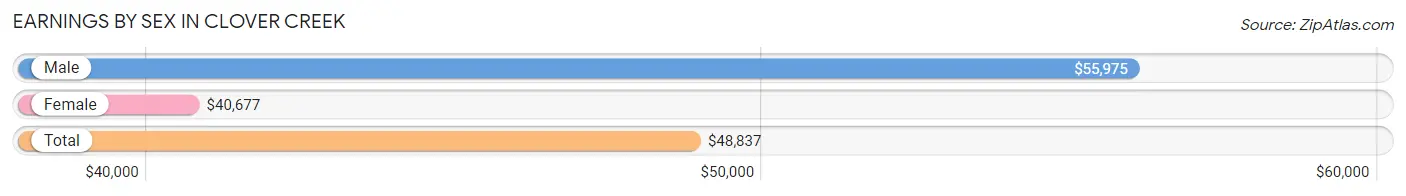
Earnings by Sex in Clover Creek
Average Earnings in Clover Creek are $48,837, $55,975 for men and $40,677 for women, a difference of 27.3%.
| Sex | Number | Average Earnings |
| Male | 2,188 (50.2%) | $55,975 |
| Female | 2,167 (49.8%) | $40,677 |
| Total | 4,355 (100.0%) | $48,837 |
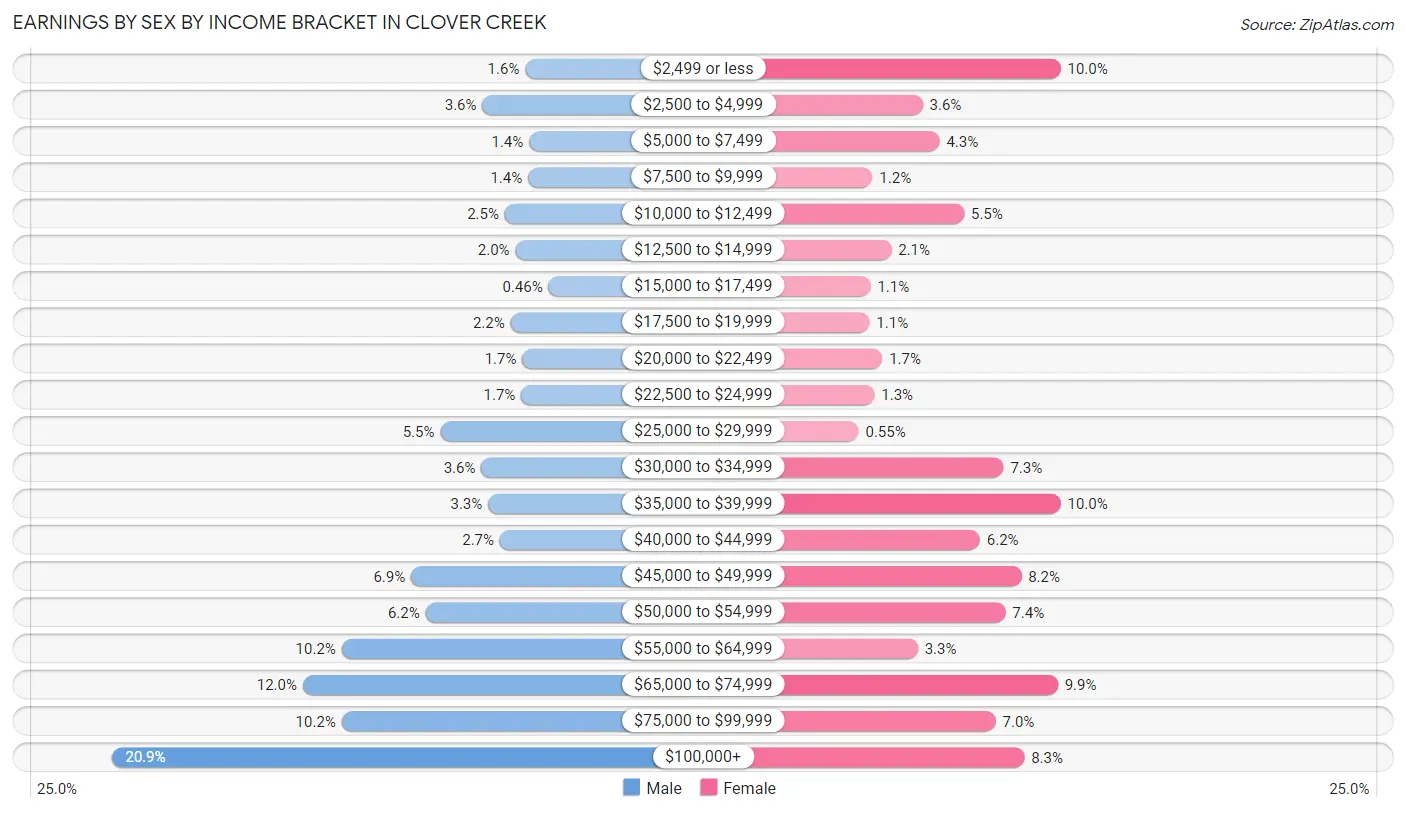
Earnings by Sex by Income Bracket in Clover Creek
The most common earnings brackets in Clover Creek are $100,000+ for men (457 | 20.9%) and $2,499 or less for women (217 | 10.0%).
| Income | Male | Female |
| $2,499 or less | 34 (1.5%) | 217 (10.0%) |
| $2,500 to $4,999 | 78 (3.6%) | 77 (3.5%) |
| $5,000 to $7,499 | 30 (1.4%) | 94 (4.3%) |
| $7,500 to $9,999 | 31 (1.4%) | 26 (1.2%) |
| $10,000 to $12,499 | 55 (2.5%) | 119 (5.5%) |
| $12,500 to $14,999 | 44 (2.0%) | 45 (2.1%) |
| $15,000 to $17,499 | 10 (0.5%) | 24 (1.1%) |
| $17,500 to $19,999 | 49 (2.2%) | 23 (1.1%) |
| $20,000 to $22,499 | 37 (1.7%) | 36 (1.7%) |
| $22,500 to $24,999 | 38 (1.7%) | 28 (1.3%) |
| $25,000 to $29,999 | 121 (5.5%) | 12 (0.5%) |
| $30,000 to $34,999 | 79 (3.6%) | 159 (7.3%) |
| $35,000 to $39,999 | 72 (3.3%) | 217 (10.0%) |
| $40,000 to $44,999 | 60 (2.7%) | 135 (6.2%) |
| $45,000 to $49,999 | 151 (6.9%) | 177 (8.2%) |
| $50,000 to $54,999 | 136 (6.2%) | 161 (7.4%) |
| $55,000 to $64,999 | 222 (10.2%) | 72 (3.3%) |
| $65,000 to $74,999 | 262 (12.0%) | 214 (9.9%) |
| $75,000 to $99,999 | 222 (10.2%) | 151 (7.0%) |
| $100,000+ | 457 (20.9%) | 180 (8.3%) |
| Total | 2,188 (100.0%) | 2,167 (100.0%) |
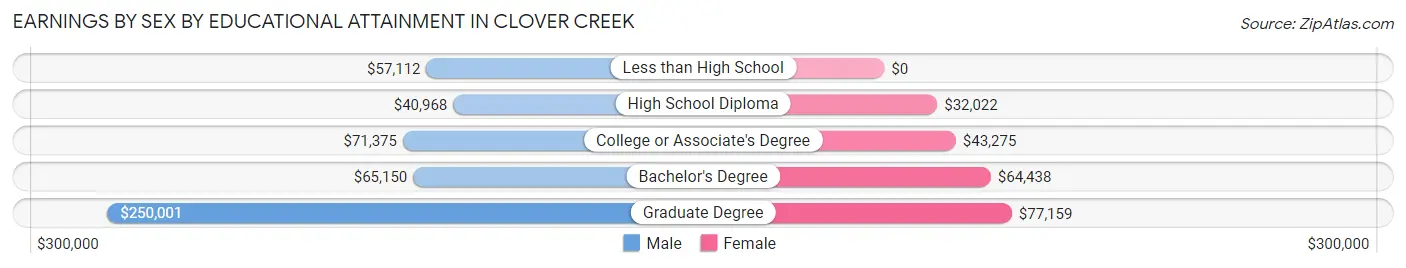
Earnings by Sex by Educational Attainment in Clover Creek
Average earnings in Clover Creek are $57,429 for men and $43,198 for women, a difference of 24.8%. Men with an educational attainment of graduate degree enjoy the highest average annual earnings of $250,001, while those with high school diploma education earn the least with $40,968. Women with an educational attainment of graduate degree earn the most with the average annual earnings of $77,159, while those with high school diploma education have the smallest earnings of $32,022.
| Educational Attainment | Male Income | Female Income |
| Less than High School | $57,112 | $0 |
| High School Diploma | $40,968 | $32,022 |
| College or Associate's Degree | $71,375 | $43,275 |
| Bachelor's Degree | $65,150 | $64,438 |
| Graduate Degree | $250,001 | $77,159 |
| Total | $57,429 | $43,198 |
Family Income in Clover Creek
Family Income Brackets in Clover Creek
According to the Clover Creek family income data, there are 452 families falling into the $100,000 to $149,999 income range, which is the most common income bracket and makes up 25.3% of all families. Conversely, the $10,000 to $14,999 income bracket is the least frequent group with only 20 families (1.1%) belonging to this category.
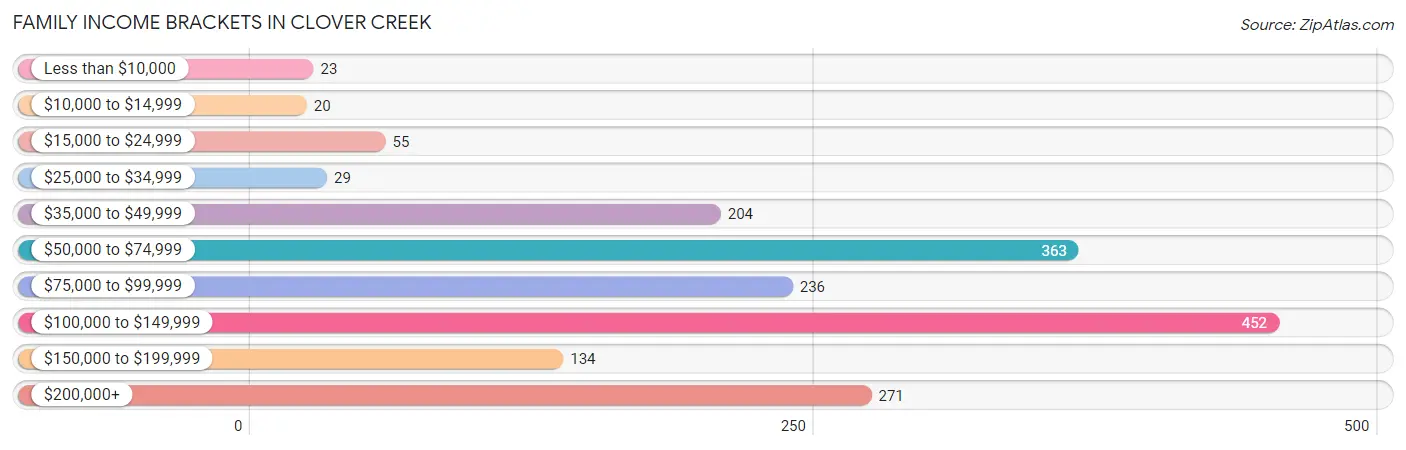
| Income Bracket | # Families | % Families |
| Less than $10,000 | 23 | 1.3% |
| $10,000 to $14,999 | 20 | 1.1% |
| $15,000 to $24,999 | 55 | 3.1% |
| $25,000 to $34,999 | 29 | 1.6% |
| $35,000 to $49,999 | 204 | 11.4% |
| $50,000 to $74,999 | 363 | 20.3% |
| $75,000 to $99,999 | 236 | 13.2% |
| $100,000 to $149,999 | 452 | 25.3% |
| $150,000 to $199,999 | 134 | 7.5% |
| $200,000+ | 271 | 15.2% |
Family Income by Famaliy Size in Clover Creek
3-person families (531 | 29.7%) account for the highest median family income in Clover Creek with $115,878 per family, while 3-person families (531 | 29.7%) have the highest median income of $38,626 per family member.
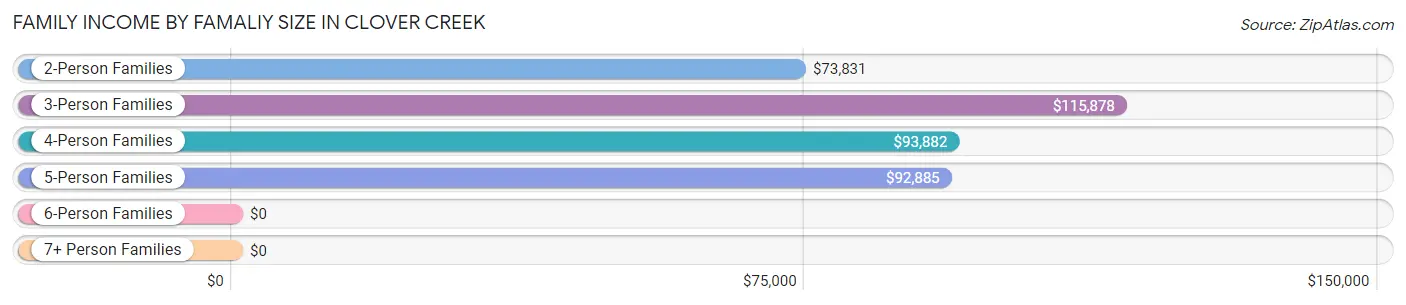
| Income Bracket | # Families | Median Income |
| 2-Person Families | 787 (44.1%) | $73,831 |
| 3-Person Families | 531 (29.7%) | $115,878 |
| 4-Person Families | 282 (15.8%) | $93,882 |
| 5-Person Families | 128 (7.2%) | $92,885 |
| 6-Person Families | 32 (1.8%) | $0 |
| 7+ Person Families | 26 (1.5%) | $0 |
| Total | 1,786 (100.0%) | $94,922 |
Family Income by Number of Earners in Clover Creek
The median family income in Clover Creek is $94,922, with families comprising 3+ earners (300) having the highest median family income of $127,667, while families with no earners (189) have the lowest median family income of $51,354, accounting for 16.8% and 10.6% of families, respectively.
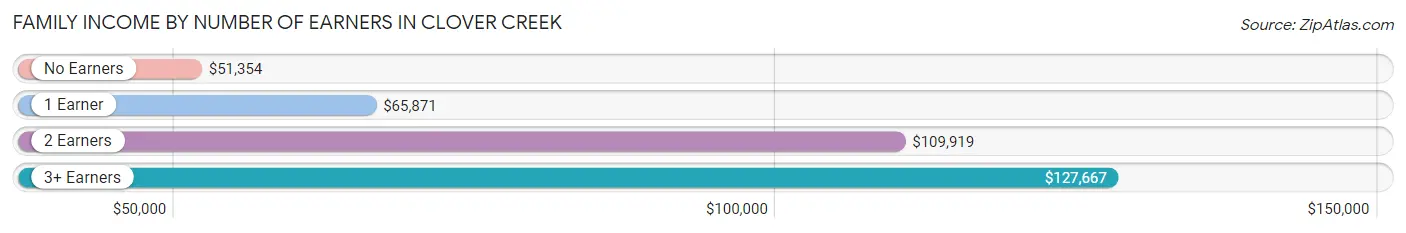
| Number of Earners | # Families | Median Income |
| No Earners | 189 (10.6%) | $51,354 |
| 1 Earner | 565 (31.6%) | $65,871 |
| 2 Earners | 732 (41.0%) | $109,919 |
| 3+ Earners | 300 (16.8%) | $127,667 |
| Total | 1,786 (100.0%) | $94,922 |
Household Income in Clover Creek
Household Income Brackets in Clover Creek
With 776 households falling in the category, the $100,000 to $149,999 income range is the most frequent in Clover Creek, accounting for 27.6% of all households. In contrast, only 48 households (1.7%) fall into the $10,000 to $14,999 income bracket, making it the least populous group.
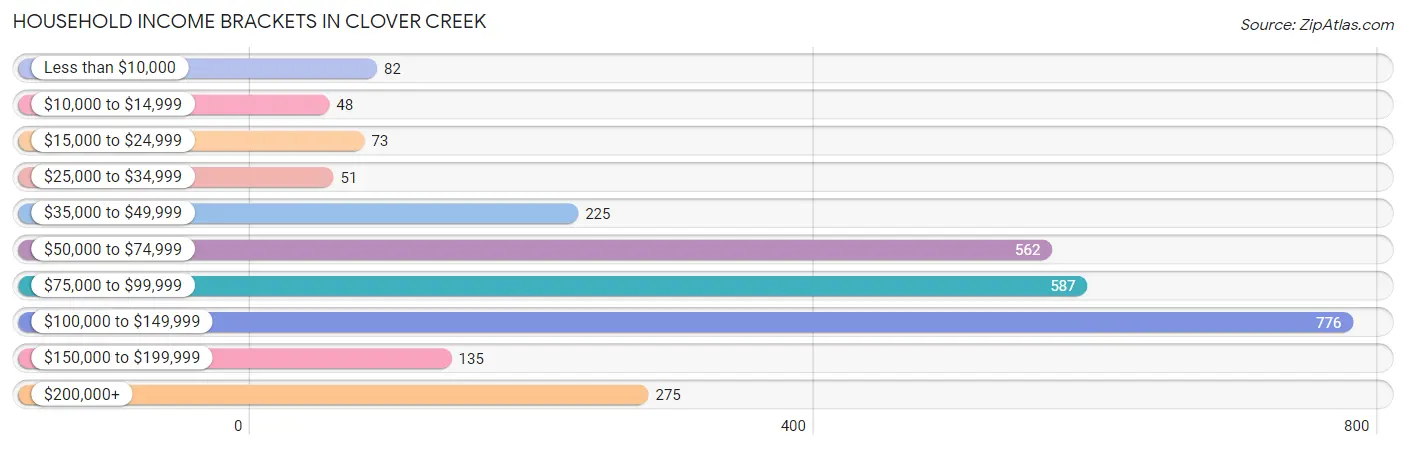
| Income Bracket | # Households | % Households |
| Less than $10,000 | 82 | 2.9% |
| $10,000 to $14,999 | 48 | 1.7% |
| $15,000 to $24,999 | 73 | 2.6% |
| $25,000 to $34,999 | 51 | 1.8% |
| $35,000 to $49,999 | 225 | 8.0% |
| $50,000 to $74,999 | 562 | 20.0% |
| $75,000 to $99,999 | 587 | 20.9% |
| $100,000 to $149,999 | 776 | 27.6% |
| $150,000 to $199,999 | 135 | 4.8% |
| $200,000+ | 275 | 9.8% |
Household Income by Householder Age in Clover Creek
The median household income in Clover Creek is $90,688, with the highest median household income of $108,108 found in the 45 to 64 years age bracket for the primary householder. A total of 1,339 households (47.6%) fall into this category. Meanwhile, the 15 to 24 years age bracket for the primary householder has the lowest median household income of $0, with 31 households (1.1%) in this group.
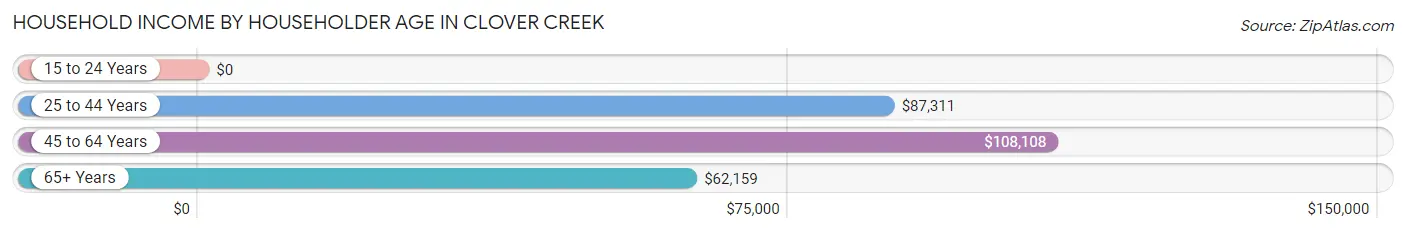
| Income Bracket | # Households | Median Income |
| 15 to 24 Years | 31 (1.1%) | $0 |
| 25 to 44 Years | 941 (33.5%) | $87,311 |
| 45 to 64 Years | 1,339 (47.6%) | $108,108 |
| 65+ Years | 500 (17.8%) | $62,159 |
| Total | 2,811 (100.0%) | $90,688 |
Poverty in Clover Creek
Income Below Poverty by Sex and Age in Clover Creek
With 7.0% poverty level for males and 9.5% for females among the residents of Clover Creek, 15 year old males and 16 and 17 year old females are the most vulnerable to poverty, with 46 males (100.0%) and 38 females (31.9%) in their respective age groups living below the poverty level.
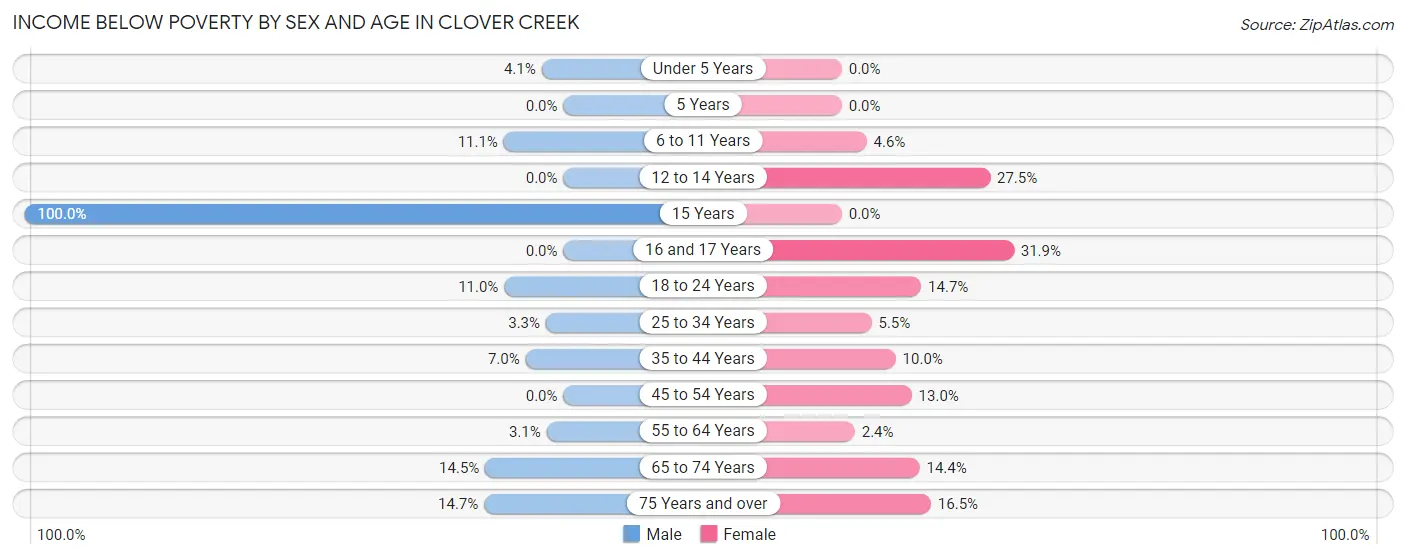
| Age Bracket | Male | Female |
| Under 5 Years | 7 (4.1%) | 0 (0.0%) |
| 5 Years | 0 (0.0%) | 0 (0.0%) |
| 6 to 11 Years | 30 (11.1%) | 11 (4.6%) |
| 12 to 14 Years | 0 (0.0%) | 30 (27.5%) |
| 15 Years | 46 (100.0%) | 0 (0.0%) |
| 16 and 17 Years | 0 (0.0%) | 38 (31.9%) |
| 18 to 24 Years | 37 (11.0%) | 19 (14.7%) |
| 25 to 34 Years | 23 (3.3%) | 36 (5.5%) |
| 35 to 44 Years | 28 (7.0%) | 46 (10.0%) |
| 45 to 54 Years | 0 (0.0%) | 79 (13.0%) |
| 55 to 64 Years | 24 (3.1%) | 16 (2.4%) |
| 65 to 74 Years | 46 (14.5%) | 44 (14.4%) |
| 75 Years and over | 20 (14.7%) | 21 (16.5%) |
| Total | 261 (7.0%) | 340 (9.5%) |
Income Above Poverty by Sex and Age in Clover Creek
According to the poverty statistics in Clover Creek, males aged 5 years and females aged under 5 years are the age groups that are most secure financially, with 100.0% of males and 100.0% of females in these age groups living above the poverty line.
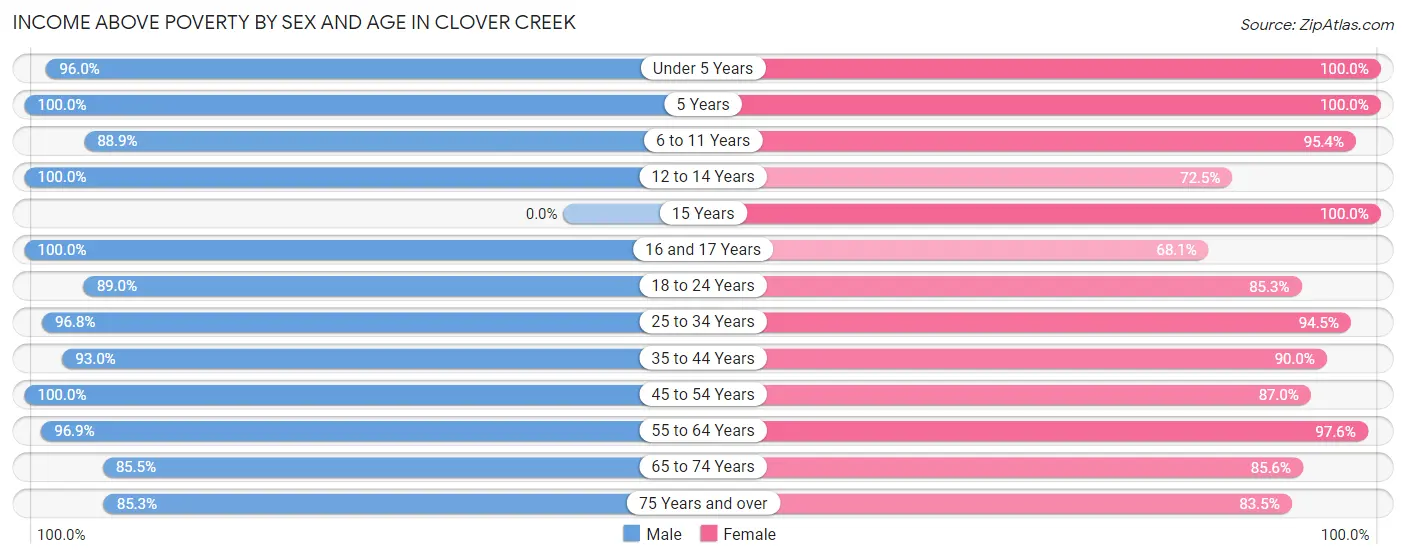
| Age Bracket | Male | Female |
| Under 5 Years | 166 (96.0%) | 95 (100.0%) |
| 5 Years | 79 (100.0%) | 5 (100.0%) |
| 6 to 11 Years | 241 (88.9%) | 228 (95.4%) |
| 12 to 14 Years | 105 (100.0%) | 79 (72.5%) |
| 15 Years | 0 (0.0%) | 63 (100.0%) |
| 16 and 17 Years | 30 (100.0%) | 81 (68.1%) |
| 18 to 24 Years | 300 (89.0%) | 110 (85.3%) |
| 25 to 34 Years | 685 (96.8%) | 616 (94.5%) |
| 35 to 44 Years | 371 (93.0%) | 414 (90.0%) |
| 45 to 54 Years | 384 (100.0%) | 530 (87.0%) |
| 55 to 64 Years | 749 (96.9%) | 647 (97.6%) |
| 65 to 74 Years | 271 (85.5%) | 261 (85.6%) |
| 75 Years and over | 116 (85.3%) | 106 (83.5%) |
| Total | 3,497 (93.0%) | 3,235 (90.5%) |
Income Below Poverty Among Married-Couple Families in Clover Creek
The poverty statistics for married-couple families in Clover Creek show that 3.8% or 57 of the total 1,479 families live below the poverty line. Families with 3 or 4 children have the highest poverty rate of 24.6%, comprising of 29 families. On the other hand, families with 1 or 2 children have the lowest poverty rate of 0.0%, which includes 0 families.
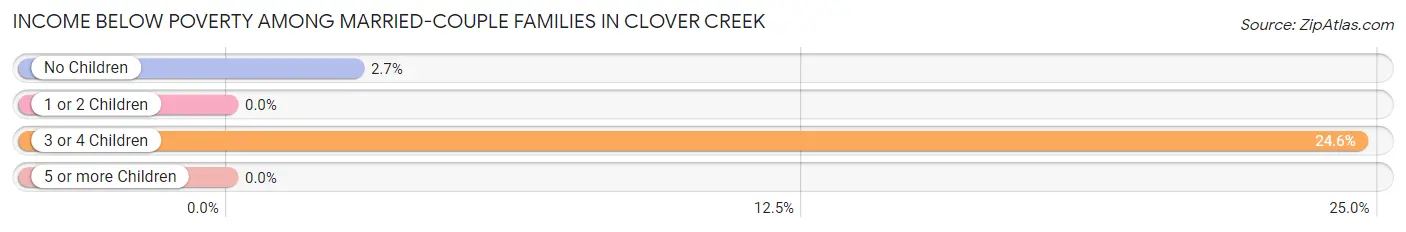
| Children | Above Poverty | Below Poverty |
| No Children | 993 (97.3%) | 28 (2.7%) |
| 1 or 2 Children | 314 (100.0%) | 0 (0.0%) |
| 3 or 4 Children | 89 (75.4%) | 29 (24.6%) |
| 5 or more Children | 26 (100.0%) | 0 (0.0%) |
| Total | 1,422 (96.2%) | 57 (3.8%) |
Income Below Poverty Among Single-Parent Households in Clover Creek
According to the poverty data in Clover Creek, 76.7% or 23 single-father households and 3.6% or 10 single-mother households are living below the poverty line. Among single-father households, those with 1 or 2 children have the highest poverty rate, with 23 households (76.7%) experiencing poverty. Likewise, among single-mother households, those with 1 or 2 children have the highest poverty rate, with 10 households (7.6%) falling below the poverty line.
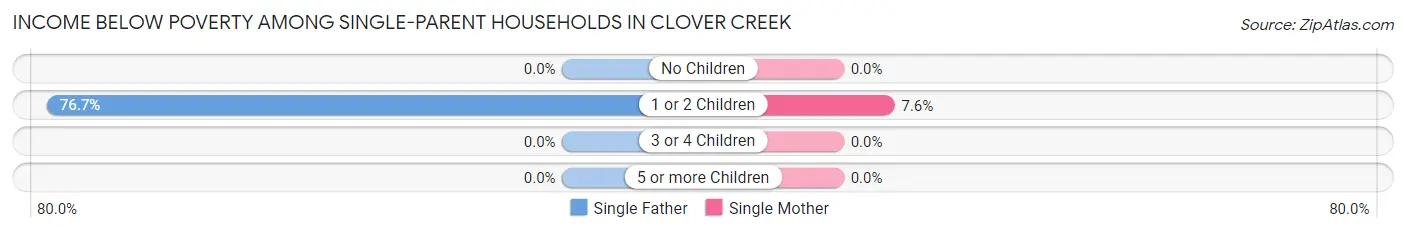
| Children | Single Father | Single Mother |
| No Children | 0 (0.0%) | 0 (0.0%) |
| 1 or 2 Children | 23 (76.7%) | 10 (7.6%) |
| 3 or 4 Children | 0 (0.0%) | 0 (0.0%) |
| 5 or more Children | 0 (0.0%) | 0 (0.0%) |
| Total | 23 (76.7%) | 10 (3.6%) |
Income Below Poverty Among Married-Couple vs Single-Parent Households in Clover Creek
The poverty data for Clover Creek shows that 57 of the married-couple family households (3.8%) and 33 of the single-parent households (10.7%) are living below the poverty level. Within the married-couple family households, those with 3 or 4 children have the highest poverty rate, with 29 households (24.6%) falling below the poverty line. Among the single-parent households, those with 1 or 2 children have the highest poverty rate, with 33 household (20.4%) living below poverty.
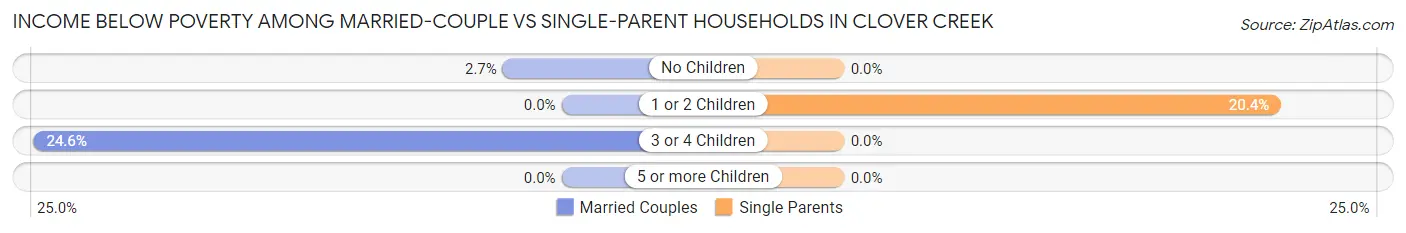
| Children | Married-Couple Families | Single-Parent Households |
| No Children | 28 (2.7%) | 0 (0.0%) |
| 1 or 2 Children | 0 (0.0%) | 33 (20.4%) |
| 3 or 4 Children | 29 (24.6%) | 0 (0.0%) |
| 5 or more Children | 0 (0.0%) | 0 (0.0%) |
| Total | 57 (3.8%) | 33 (10.7%) |
Race in Clover Creek
The most populous races in Clover Creek are White / Caucasian (5,088 | 69.2%), Two or more Races (1,151 | 15.7%), and Hispanic or Latino (973 | 13.2%).
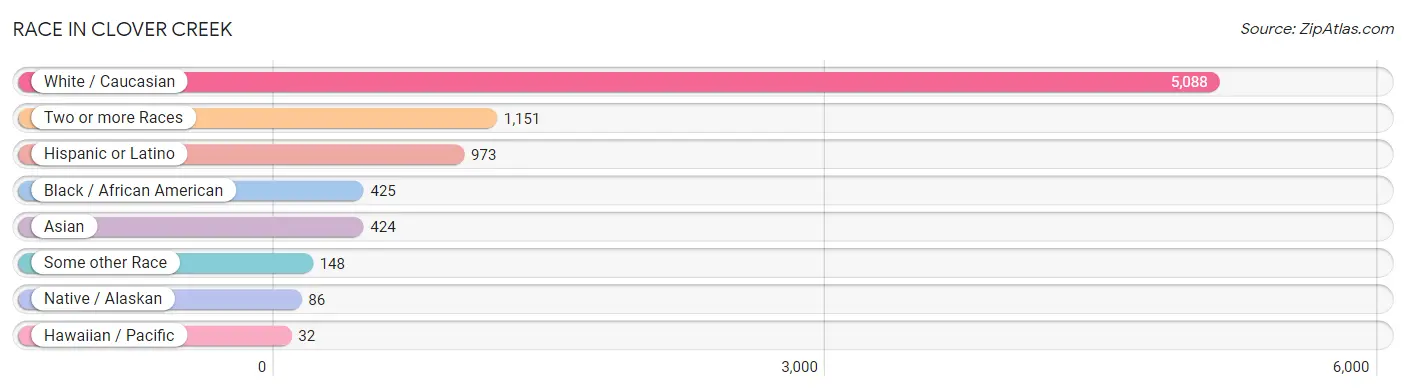
| Race | # Population | % Population |
| Asian | 424 | 5.8% |
| Black / African American | 425 | 5.8% |
| Hawaiian / Pacific | 32 | 0.4% |
| Hispanic or Latino | 973 | 13.2% |
| Native / Alaskan | 86 | 1.2% |
| White / Caucasian | 5,088 | 69.2% |
| Two or more Races | 1,151 | 15.7% |
| Some other Race | 148 | 2.0% |
| Total | 7,354 | 100.0% |
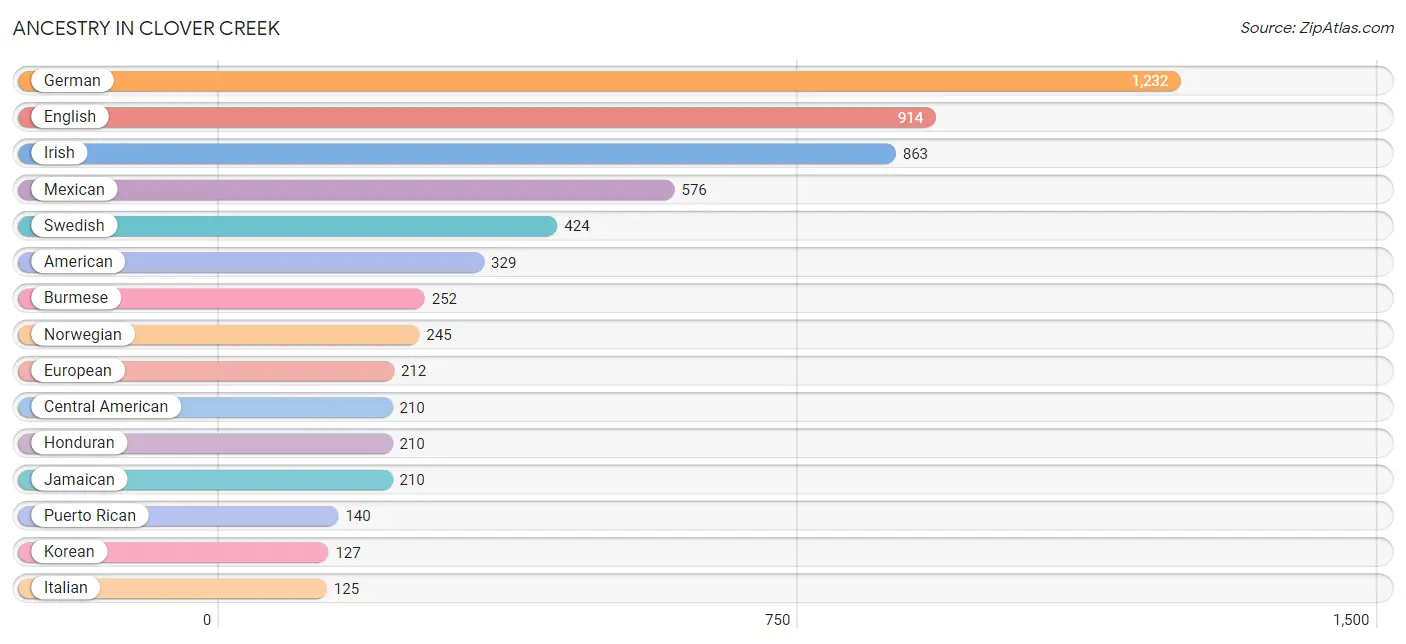
Ancestry in Clover Creek
The most populous ancestries reported in Clover Creek are German (1,232 | 16.8%), English (914 | 12.4%), Irish (863 | 11.7%), Mexican (576 | 7.8%), and Swedish (424 | 5.8%), together accounting for 54.5% of all Clover Creek residents.
| Ancestry | # Population | % Population |
| American | 329 | 4.5% |
| Apache | 23 | 0.3% |
| Austrian | 1 | 0.0% |
| Bangladeshi | 87 | 1.2% |
| Belgian | 11 | 0.2% |
| Bhutanese | 118 | 1.6% |
| Blackfeet | 59 | 0.8% |
| British | 81 | 1.1% |
| Burmese | 252 | 3.4% |
| Canadian | 10 | 0.1% |
| Central American | 210 | 2.9% |
| Cherokee | 60 | 0.8% |
| Chippewa | 43 | 0.6% |
| Choctaw | 9 | 0.1% |
| Croatian | 36 | 0.5% |
| Czech | 14 | 0.2% |
| Czechoslovakian | 35 | 0.5% |
| Danish | 111 | 1.5% |
| Dutch | 42 | 0.6% |
| English | 914 | 12.4% |
| European | 212 | 2.9% |
| Finnish | 19 | 0.3% |
| French | 106 | 1.4% |
| French Canadian | 9 | 0.1% |
| German | 1,232 | 16.8% |
| Guamanian / Chamorro | 53 | 0.7% |
| Honduran | 210 | 2.9% |
| Hungarian | 42 | 0.6% |
| Icelander | 21 | 0.3% |
| Irish | 863 | 11.7% |
| Italian | 125 | 1.7% |
| Jamaican | 210 | 2.9% |
| Japanese | 72 | 1.0% |
| Korean | 127 | 1.7% |
| Lithuanian | 1 | 0.0% |
| Mexican | 576 | 7.8% |
| Northern European | 11 | 0.2% |
| Norwegian | 245 | 3.3% |
| Pakistani | 5 | 0.1% |
| Pennsylvania German | 20 | 0.3% |
| Polish | 58 | 0.8% |
| Potawatomi | 7 | 0.1% |
| Puerto Rican | 140 | 1.9% |
| Puget Sound Salish | 41 | 0.6% |
| Scandinavian | 47 | 0.6% |
| Scotch-Irish | 31 | 0.4% |
| Scottish | 74 | 1.0% |
| Slavic | 25 | 0.3% |
| Somali | 16 | 0.2% |
| Spaniard | 23 | 0.3% |
| Sri Lankan | 40 | 0.5% |
| Subsaharan African | 16 | 0.2% |
| Swedish | 424 | 5.8% |
| Thai | 11 | 0.2% |
| Ukrainian | 61 | 0.8% |
| Welsh | 37 | 0.5% | View All 56 Rows |
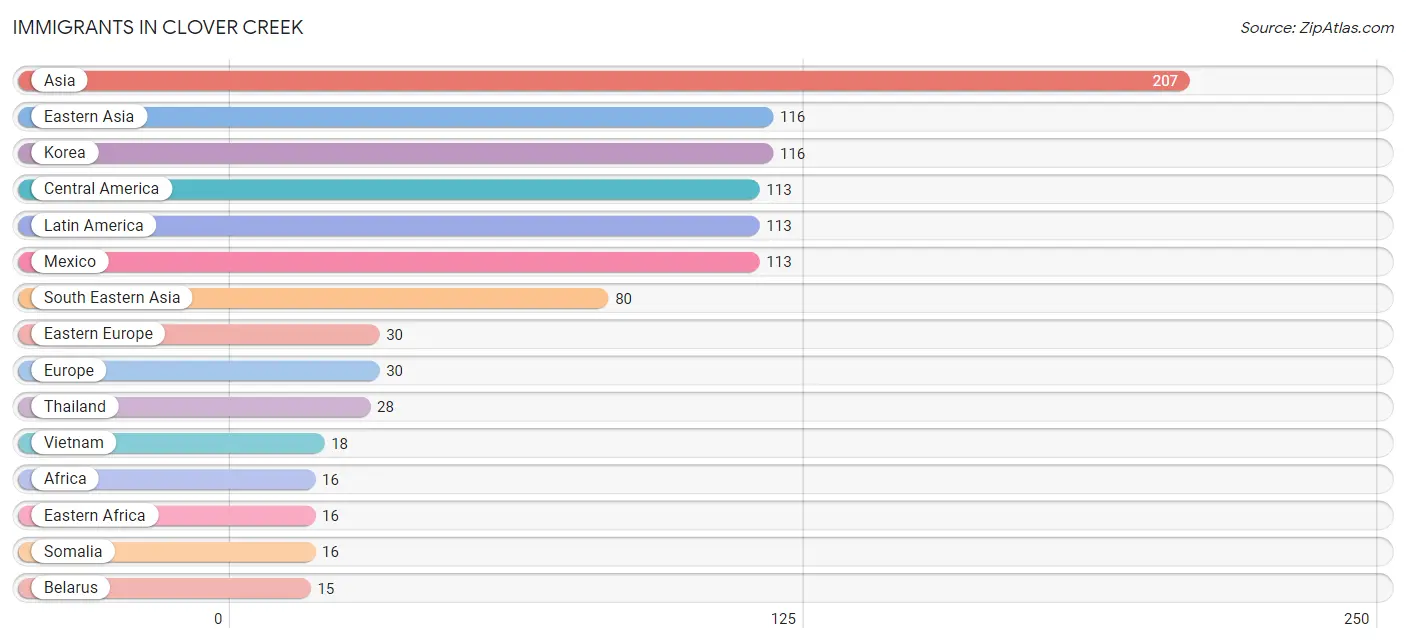
Immigrants in Clover Creek
The most numerous immigrant groups reported in Clover Creek came from Asia (207 | 2.8%), Eastern Asia (116 | 1.6%), Korea (116 | 1.6%), Central America (113 | 1.5%), and Latin America (113 | 1.5%), together accounting for 9.0% of all Clover Creek residents.
| Immigration Origin | # Population | % Population |
| Africa | 16 | 0.2% |
| Asia | 207 | 2.8% |
| Belarus | 15 | 0.2% |
| Cambodia | 12 | 0.2% |
| Central America | 113 | 1.5% |
| Eastern Africa | 16 | 0.2% |
| Eastern Asia | 116 | 1.6% |
| Eastern Europe | 30 | 0.4% |
| Europe | 30 | 0.4% |
| India | 11 | 0.2% |
| Korea | 116 | 1.6% |
| Laos | 14 | 0.2% |
| Latin America | 113 | 1.5% |
| Mexico | 113 | 1.5% |
| Moldova | 15 | 0.2% |
| Philippines | 8 | 0.1% |
| Somalia | 16 | 0.2% |
| South Central Asia | 11 | 0.2% |
| South Eastern Asia | 80 | 1.1% |
| Thailand | 28 | 0.4% |
| Vietnam | 18 | 0.2% | View All 21 Rows |
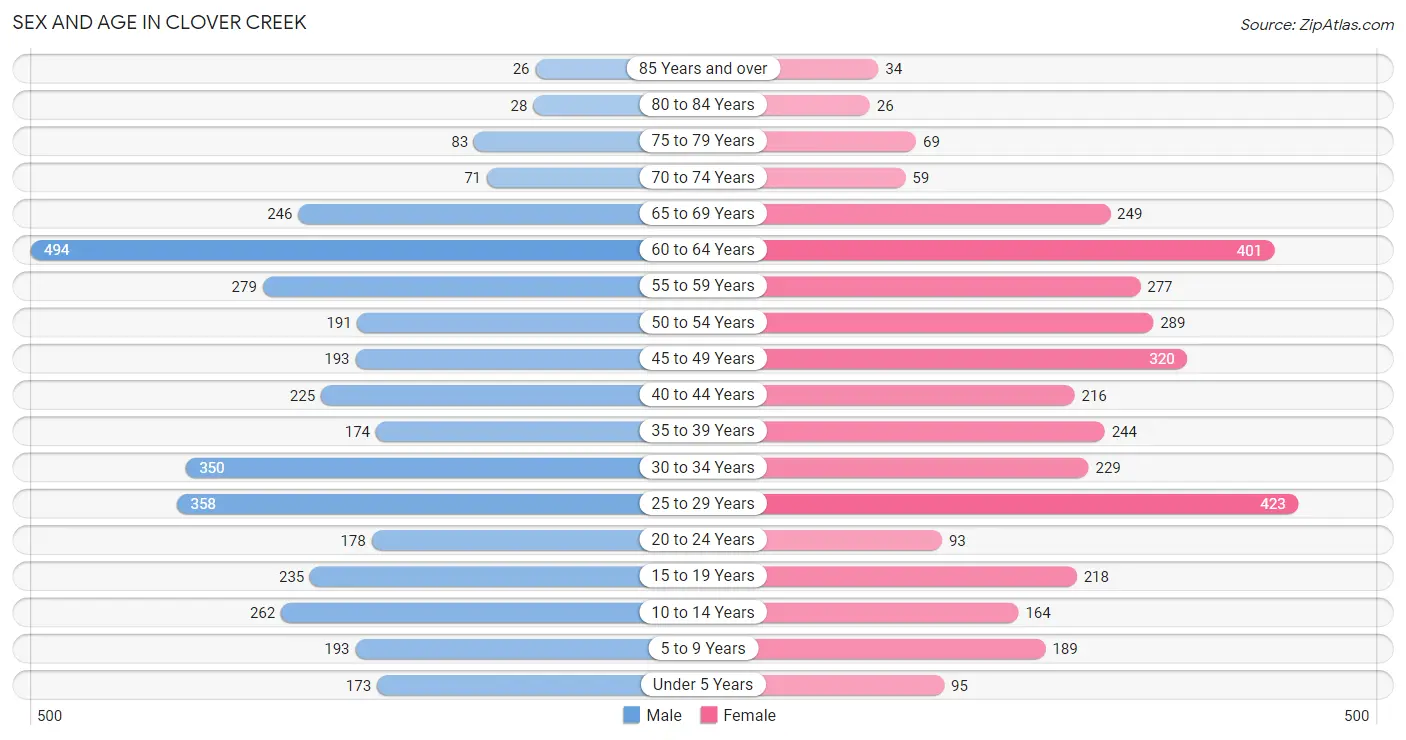
Sex and Age in Clover Creek
Sex and Age in Clover Creek
The most populous age groups in Clover Creek are 60 to 64 Years (494 | 13.1%) for men and 25 to 29 Years (423 | 11.8%) for women.
| Age Bracket | Male | Female |
| Under 5 Years | 173 (4.6%) | 95 (2.6%) |
| 5 to 9 Years | 193 (5.1%) | 189 (5.3%) |
| 10 to 14 Years | 262 (7.0%) | 164 (4.6%) |
| 15 to 19 Years | 235 (6.2%) | 218 (6.1%) |
| 20 to 24 Years | 178 (4.7%) | 93 (2.6%) |
| 25 to 29 Years | 358 (9.5%) | 423 (11.8%) |
| 30 to 34 Years | 350 (9.3%) | 229 (6.4%) |
| 35 to 39 Years | 174 (4.6%) | 244 (6.8%) |
| 40 to 44 Years | 225 (6.0%) | 216 (6.0%) |
| 45 to 49 Years | 193 (5.1%) | 320 (8.9%) |
| 50 to 54 Years | 191 (5.1%) | 289 (8.0%) |
| 55 to 59 Years | 279 (7.4%) | 277 (7.7%) |
| 60 to 64 Years | 494 (13.1%) | 401 (11.2%) |
| 65 to 69 Years | 246 (6.5%) | 249 (6.9%) |
| 70 to 74 Years | 71 (1.9%) | 59 (1.6%) |
| 75 to 79 Years | 83 (2.2%) | 69 (1.9%) |
| 80 to 84 Years | 28 (0.7%) | 26 (0.7%) |
| 85 Years and over | 26 (0.7%) | 34 (0.9%) |
| Total | 3,759 (100.0%) | 3,595 (100.0%) |
Families and Households in Clover Creek
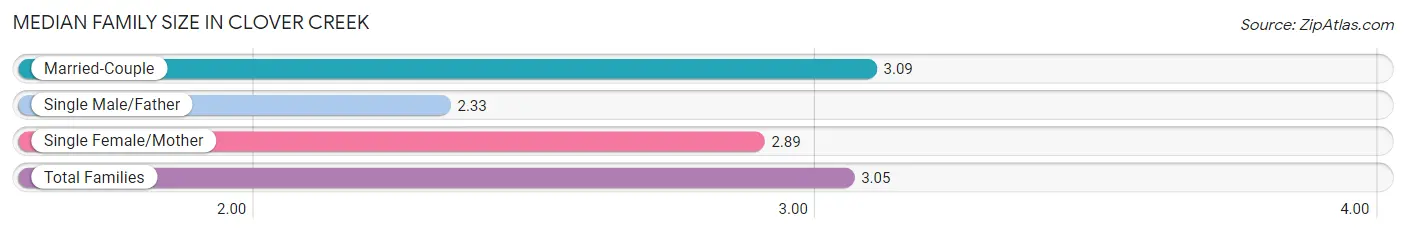
Median Family Size in Clover Creek
The median family size in Clover Creek is 3.05 persons per family, with married-couple families (1,479 | 82.8%) accounting for the largest median family size of 3.09 persons per family. On the other hand, single male/father families (30 | 1.7%) represent the smallest median family size with 2.33 persons per family.
| Family Type | # Families | Family Size |
| Married-Couple | 1,479 (82.8%) | 3.09 |
| Single Male/Father | 30 (1.7%) | 2.33 |
| Single Female/Mother | 277 (15.5%) | 2.89 |
| Total Families | 1,786 (100.0%) | 3.05 |
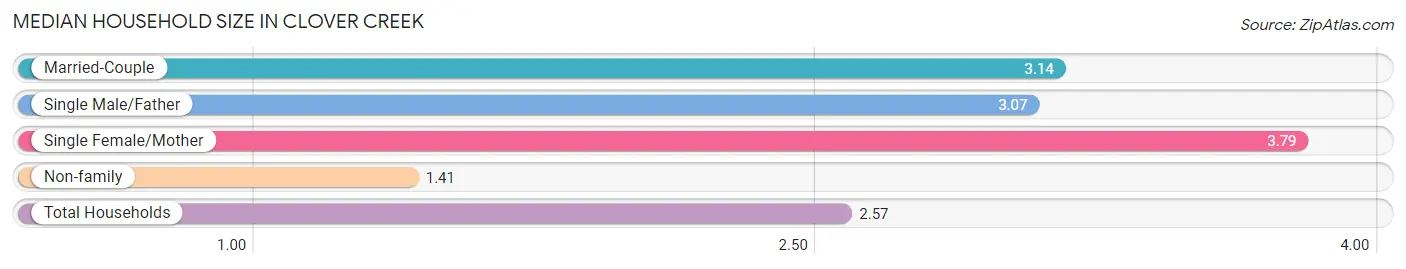
Median Household Size in Clover Creek
The median household size in Clover Creek is 2.57 persons per household, with single female/mother households (277 | 9.9%) accounting for the largest median household size of 3.79 persons per household. non-family households (1,025 | 36.5%) represent the smallest median household size with 1.41 persons per household.
| Household Type | # Households | Household Size |
| Married-Couple | 1,479 (52.6%) | 3.14 |
| Single Male/Father | 30 (1.1%) | 3.07 |
| Single Female/Mother | 277 (9.9%) | 3.79 |
| Non-family | 1,025 (36.5%) | 1.41 |
| Total Households | 2,811 (100.0%) | 2.57 |
Household Size by Marriage Status in Clover Creek
Out of a total of 2,811 households in Clover Creek, 1,786 (63.5%) are family households, while 1,025 (36.5%) are nonfamily households. The most numerous type of family households are 2-person households, comprising 656, and the most common type of nonfamily households are 1-person households, comprising 725.
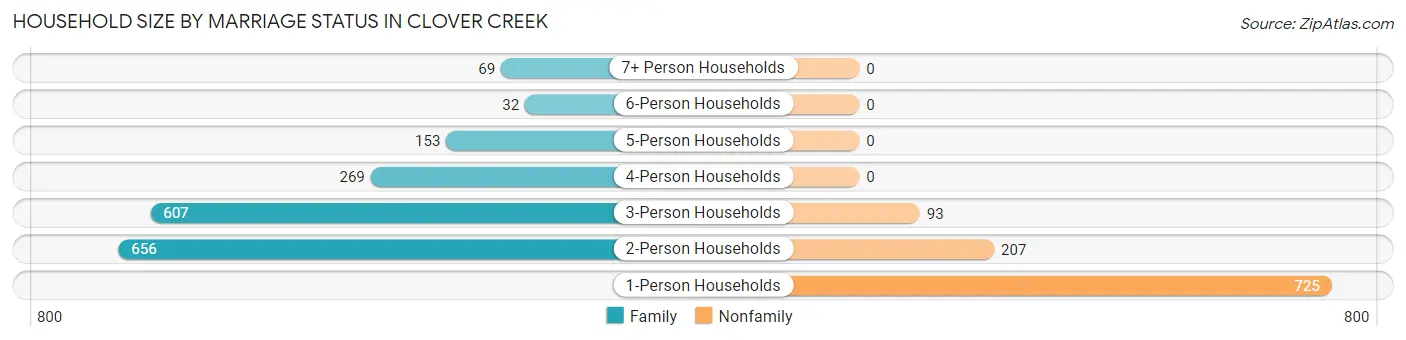
| Household Size | Family Households | Nonfamily Households |
| 1-Person Households | - | 725 (25.8%) |
| 2-Person Households | 656 (23.3%) | 207 (7.4%) |
| 3-Person Households | 607 (21.6%) | 93 (3.3%) |
| 4-Person Households | 269 (9.6%) | 0 (0.0%) |
| 5-Person Households | 153 (5.4%) | 0 (0.0%) |
| 6-Person Households | 32 (1.1%) | 0 (0.0%) |
| 7+ Person Households | 69 (2.5%) | 0 (0.0%) |
| Total | 1,786 (63.5%) | 1,025 (36.5%) |
Female Fertility in Clover Creek
Fertility by Age in Clover Creek
Average fertility rate in Clover Creek is 41.0 births per 1,000 women. Women in the age bracket of 20 to 34 years have the highest fertility rate with 101.0 births per 1,000 women. Women in the age bracket of 20 to 34 years acount for 100.0% of all women with births.
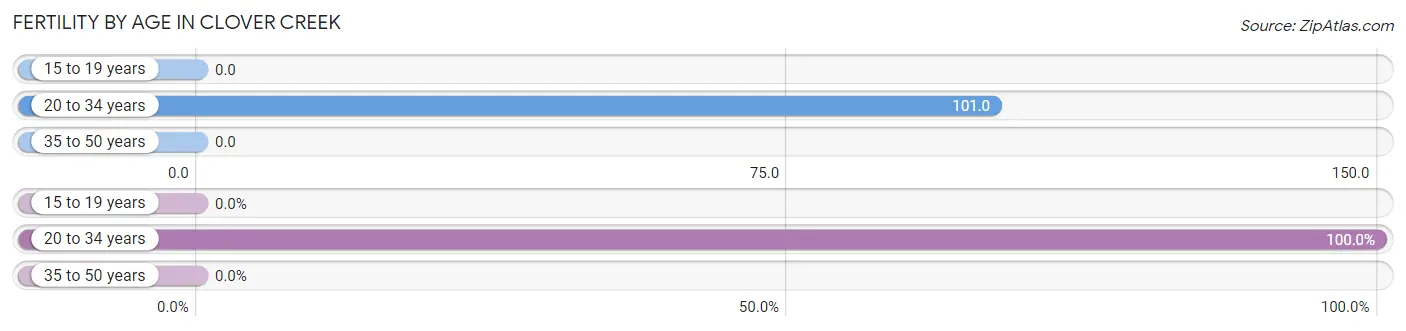
| Age Bracket | Women with Births | Births / 1,000 Women |
| 15 to 19 years | 0 (0.0%) | 0.0 |
| 20 to 34 years | 75 (100.0%) | 101.0 |
| 35 to 50 years | 0 (0.0%) | 0.0 |
| Total | 75 (100.0%) | 41.0 |
Fertility by Age by Marriage Status in Clover Creek
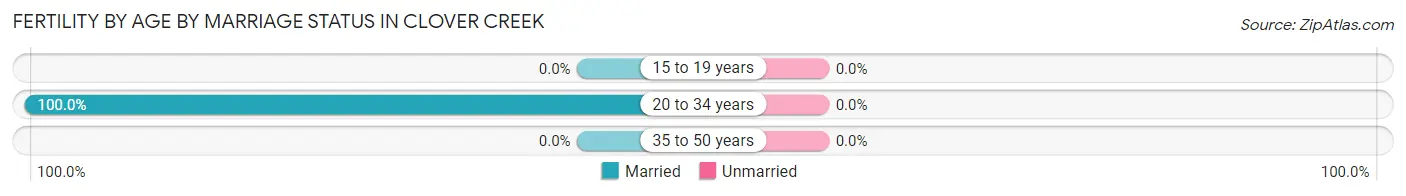
| Age Bracket | Married | Unmarried |
| 15 to 19 years | 0 (0.0%) | 0 (0.0%) |
| 20 to 34 years | 75 (100.0%) | 0 (0.0%) |
| 35 to 50 years | 0 (0.0%) | 0 (0.0%) |
| Total | 75 (100.0%) | 0 (0.0%) |
Fertility by Education in Clover Creek
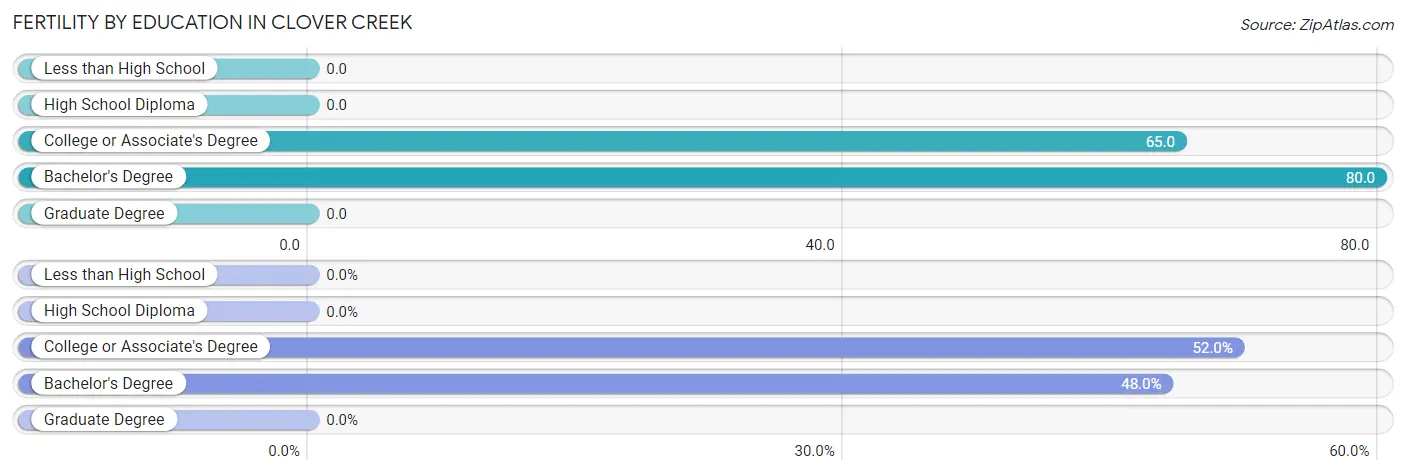
| Educational Attainment | Women with Births | Births / 1,000 Women |
| Less than High School | 0 (0.0%) | 0.0 |
| High School Diploma | 0 (0.0%) | 0.0 |
| College or Associate's Degree | 39 (52.0%) | 65.0 |
| Bachelor's Degree | 36 (48.0%) | 80.0 |
| Graduate Degree | 0 (0.0%) | 0.0 |
| Total | 75 (100.0%) | 41.0 |
Fertility by Education by Marriage Status in Clover Creek
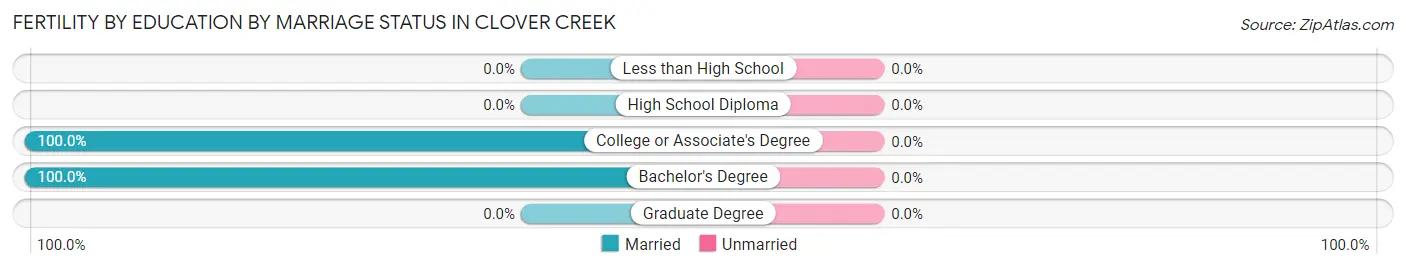
| Educational Attainment | Married | Unmarried |
| Less than High School | 0 (0.0%) | 0 (0.0%) |
| High School Diploma | 0 (0.0%) | 0 (0.0%) |
| College or Associate's Degree | 39 (100.0%) | 0 (0.0%) |
| Bachelor's Degree | 36 (100.0%) | 0 (0.0%) |
| Graduate Degree | 0 (0.0%) | 0 (0.0%) |
| Total | 75 (100.0%) | 0 (0.0%) |
Employment Characteristics in Clover Creek
Employment by Class of Employer in Clover Creek
Among the 3,817 employed individuals in Clover Creek, private company employees (2,306 | 60.4%), not-for-profit organizations (373 | 9.8%), and local government employees (355 | 9.3%) make up the most common classes of employment.
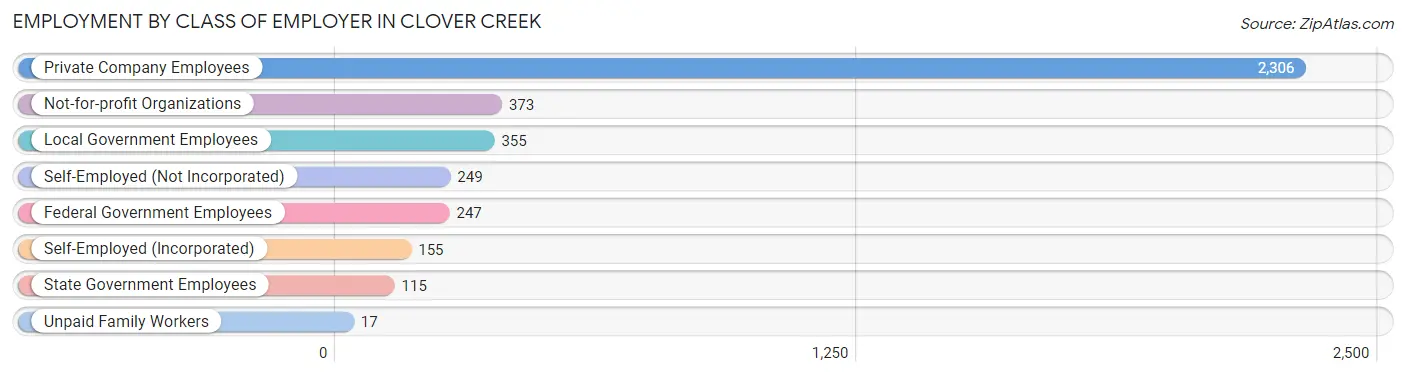
| Employer Class | # Employees | % Employees |
| Private Company Employees | 2,306 | 60.4% |
| Self-Employed (Incorporated) | 155 | 4.1% |
| Self-Employed (Not Incorporated) | 249 | 6.5% |
| Not-for-profit Organizations | 373 | 9.8% |
| Local Government Employees | 355 | 9.3% |
| State Government Employees | 115 | 3.0% |
| Federal Government Employees | 247 | 6.5% |
| Unpaid Family Workers | 17 | 0.4% |
| Total | 3,817 | 100.0% |
Employment Status by Age in Clover Creek
According to the labor force statistics for Clover Creek, out of the total population over 16 years of age (6,169), 70.6% or 4,355 individuals are in the labor force, with 7.1% or 309 of them unemployed. The age group with the highest labor force participation rate is 20 to 24 years, with 93.0% or 252 individuals in the labor force. Within the labor force, the 16 to 19 years age range has the highest percentage of unemployed individuals, with 90.4% or 141 of them being unemployed.
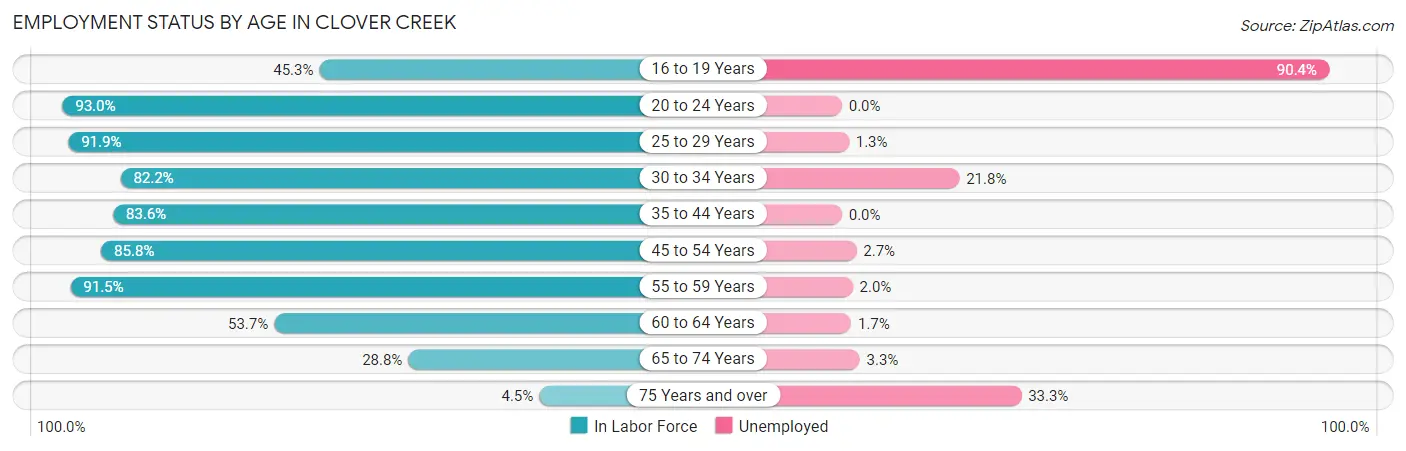
| Age Bracket | In Labor Force | Unemployed |
| 16 to 19 Years | 156 (45.3%) | 141 (90.4%) |
| 20 to 24 Years | 252 (93.0%) | 0 (0.0%) |
| 25 to 29 Years | 718 (91.9%) | 9 (1.3%) |
| 30 to 34 Years | 476 (82.2%) | 104 (21.8%) |
| 35 to 44 Years | 718 (83.6%) | 0 (0.0%) |
| 45 to 54 Years | 852 (85.8%) | 23 (2.7%) |
| 55 to 59 Years | 509 (91.5%) | 10 (2.0%) |
| 60 to 64 Years | 481 (53.7%) | 8 (1.7%) |
| 65 to 74 Years | 180 (28.8%) | 6 (3.3%) |
| 75 Years and over | 12 (4.5%) | 4 (33.3%) |
| Total | 4,355 (70.6%) | 309 (7.1%) |
Employment Status by Educational Attainment in Clover Creek
According to labor force statistics for Clover Creek, 80.5% of individuals (3,754) out of the total population between 25 and 64 years of age (4,663) are in the labor force, with 4.2% or 158 of them being unemployed. The group with the highest labor force participation rate are those with the educational attainment of college / associate degree, with 87.3% or 1,433 individuals in the labor force. Within the labor force, individuals with bachelor's degree or higher education have the highest percentage of unemployment, with 13.2% or 119 of them being unemployed.
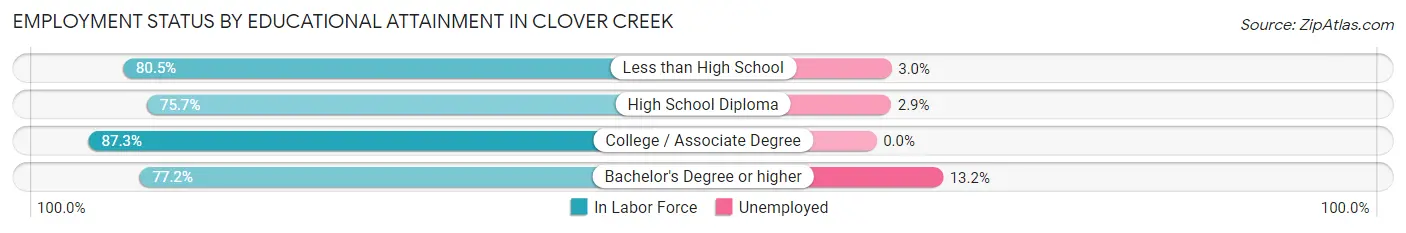
| Educational Attainment | In Labor Force | Unemployed |
| Less than High School | 268 (80.5%) | 10 (3.0%) |
| High School Diploma | 1,150 (75.7%) | 44 (2.9%) |
| College / Associate Degree | 1,433 (87.3%) | 0 (0.0%) |
| Bachelor's Degree or higher | 902 (77.2%) | 154 (13.2%) |
| Total | 3,754 (80.5%) | 196 (4.2%) |
Employment Occupations by Sex in Clover Creek
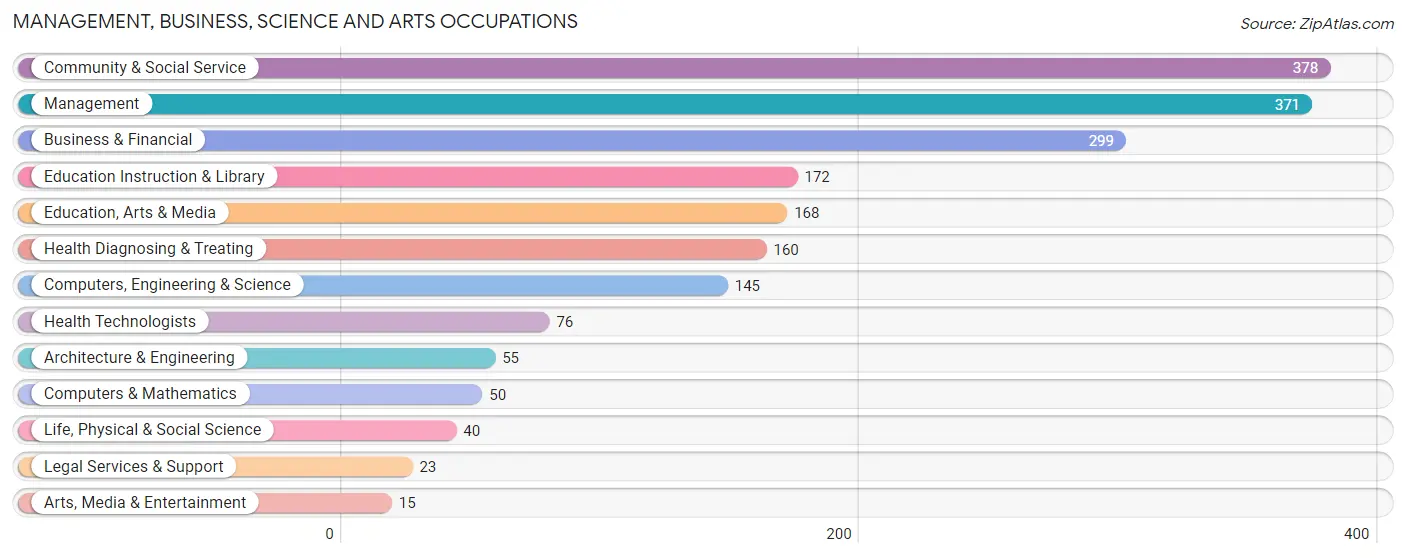
Management, Business, Science and Arts Occupations
The most common Management, Business, Science and Arts occupations in Clover Creek are Community & Social Service (378 | 9.4%), Management (371 | 9.3%), Business & Financial (299 | 7.5%), Education Instruction & Library (172 | 4.3%), and Education, Arts & Media (168 | 4.2%).
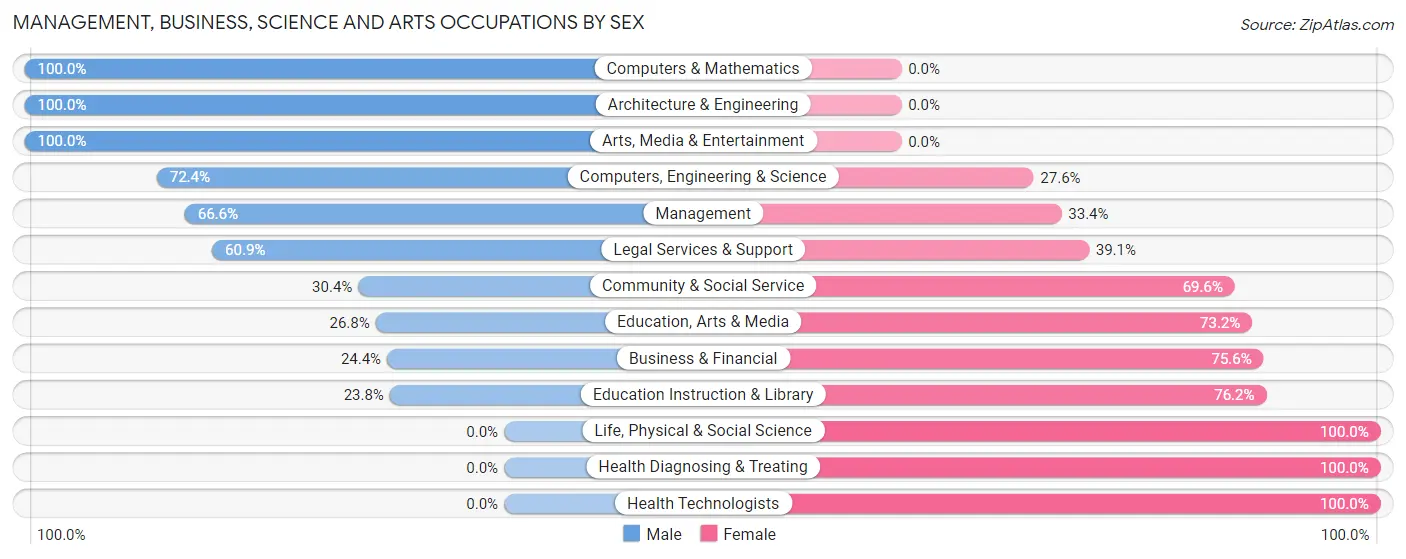
Management, Business, Science and Arts Occupations by Sex
Within the Management, Business, Science and Arts occupations in Clover Creek, the most male-oriented occupations are Computers & Mathematics (100.0%), Architecture & Engineering (100.0%), and Arts, Media & Entertainment (100.0%), while the most female-oriented occupations are Life, Physical & Social Science (100.0%), Health Diagnosing & Treating (100.0%), and Health Technologists (100.0%).
| Occupation | Male | Female |
| Management | 247 (66.6%) | 124 (33.4%) |
| Business & Financial | 73 (24.4%) | 226 (75.6%) |
| Computers, Engineering & Science | 105 (72.4%) | 40 (27.6%) |
| Computers & Mathematics | 50 (100.0%) | 0 (0.0%) |
| Architecture & Engineering | 55 (100.0%) | 0 (0.0%) |
| Life, Physical & Social Science | 0 (0.0%) | 40 (100.0%) |
| Community & Social Service | 115 (30.4%) | 263 (69.6%) |
| Education, Arts & Media | 45 (26.8%) | 123 (73.2%) |
| Legal Services & Support | 14 (60.9%) | 9 (39.1%) |
| Education Instruction & Library | 41 (23.8%) | 131 (76.2%) |
| Arts, Media & Entertainment | 15 (100.0%) | 0 (0.0%) |
| Health Diagnosing & Treating | 0 (0.0%) | 160 (100.0%) |
| Health Technologists | 0 (0.0%) | 76 (100.0%) |
| Total (Category) | 540 (39.9%) | 813 (60.1%) |
| Total (Overall) | 1,983 (49.5%) | 2,020 (50.5%) |
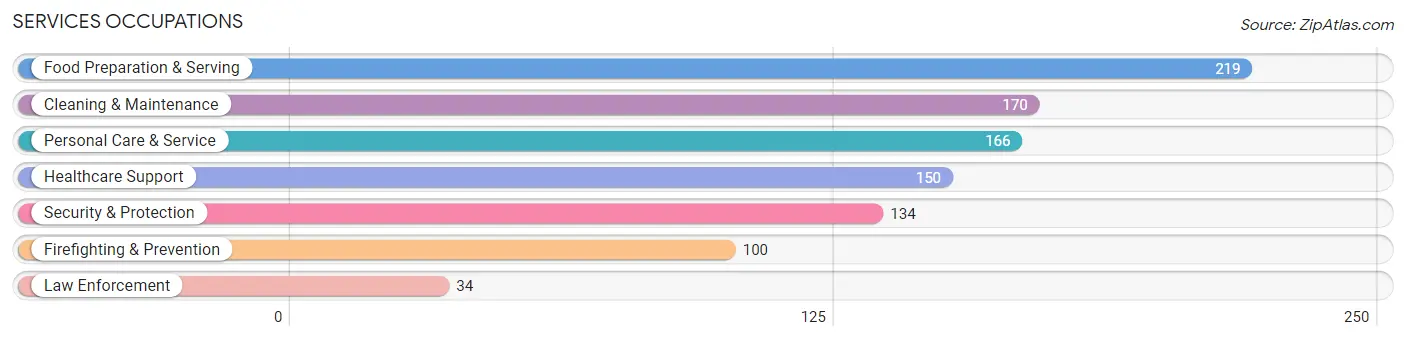
Services Occupations
The most common Services occupations in Clover Creek are Food Preparation & Serving (219 | 5.5%), Cleaning & Maintenance (170 | 4.3%), Personal Care & Service (166 | 4.2%), Healthcare Support (150 | 3.7%), and Security & Protection (134 | 3.4%).
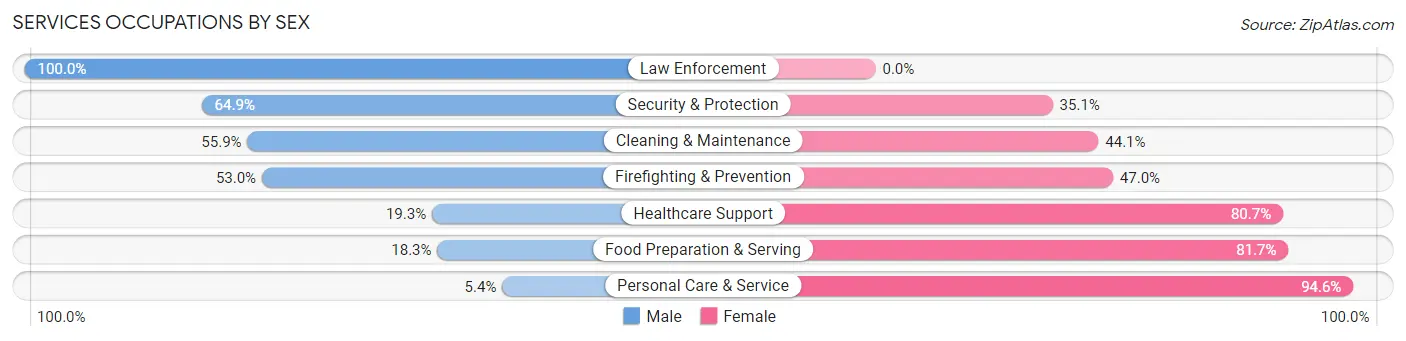
Services Occupations by Sex
Within the Services occupations in Clover Creek, the most male-oriented occupations are Law Enforcement (100.0%), Security & Protection (64.9%), and Cleaning & Maintenance (55.9%), while the most female-oriented occupations are Personal Care & Service (94.6%), Food Preparation & Serving (81.7%), and Healthcare Support (80.7%).
| Occupation | Male | Female |
| Healthcare Support | 29 (19.3%) | 121 (80.7%) |
| Security & Protection | 87 (64.9%) | 47 (35.1%) |
| Firefighting & Prevention | 53 (53.0%) | 47 (47.0%) |
| Law Enforcement | 34 (100.0%) | 0 (0.0%) |
| Food Preparation & Serving | 40 (18.3%) | 179 (81.7%) |
| Cleaning & Maintenance | 95 (55.9%) | 75 (44.1%) |
| Personal Care & Service | 9 (5.4%) | 157 (94.6%) |
| Total (Category) | 260 (31.0%) | 579 (69.0%) |
| Total (Overall) | 1,983 (49.5%) | 2,020 (50.5%) |
Sales and Office Occupations
The most common Sales and Office occupations in Clover Creek are Office & Administration (408 | 10.2%), and Sales & Related (202 | 5.1%).

Sales and Office Occupations by Sex
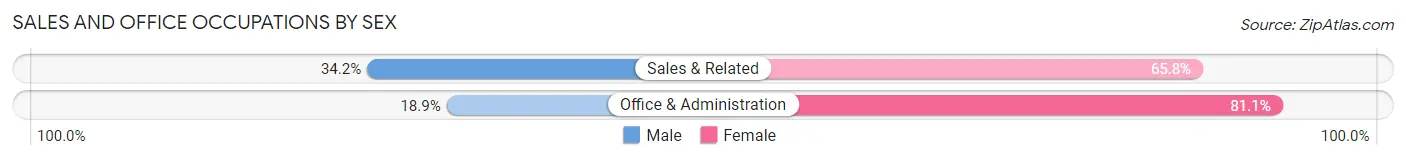
| Occupation | Male | Female |
| Sales & Related | 69 (34.2%) | 133 (65.8%) |
| Office & Administration | 77 (18.9%) | 331 (81.1%) |
| Total (Category) | 146 (23.9%) | 464 (76.1%) |
| Total (Overall) | 1,983 (49.5%) | 2,020 (50.5%) |
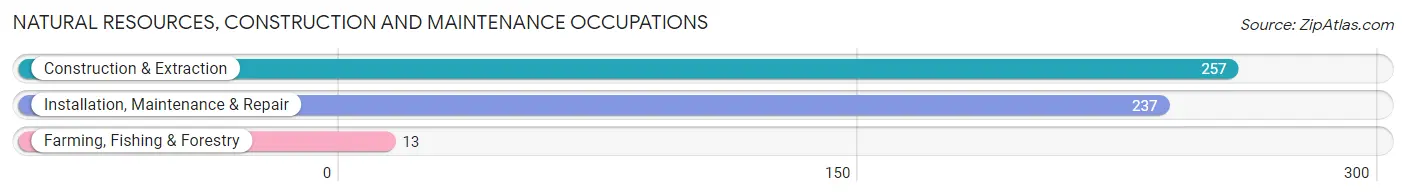
Natural Resources, Construction and Maintenance Occupations
The most common Natural Resources, Construction and Maintenance occupations in Clover Creek are Construction & Extraction (257 | 6.4%), Installation, Maintenance & Repair (237 | 5.9%), and Farming, Fishing & Forestry (13 | 0.3%).
Natural Resources, Construction and Maintenance Occupations by Sex
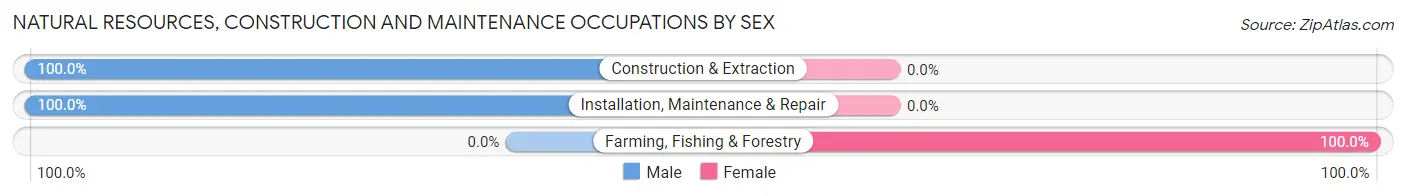
| Occupation | Male | Female |
| Farming, Fishing & Forestry | 0 (0.0%) | 13 (100.0%) |
| Construction & Extraction | 257 (100.0%) | 0 (0.0%) |
| Installation, Maintenance & Repair | 237 (100.0%) | 0 (0.0%) |
| Total (Category) | 494 (97.4%) | 13 (2.6%) |
| Total (Overall) | 1,983 (49.5%) | 2,020 (50.5%) |
Production, Transportation and Moving Occupations
The most common Production, Transportation and Moving occupations in Clover Creek are Transportation (313 | 7.8%), Production (292 | 7.3%), and Material Moving (89 | 2.2%).
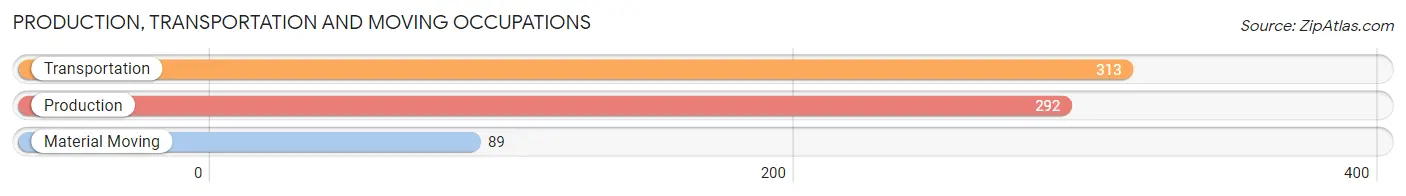
Production, Transportation and Moving Occupations by Sex
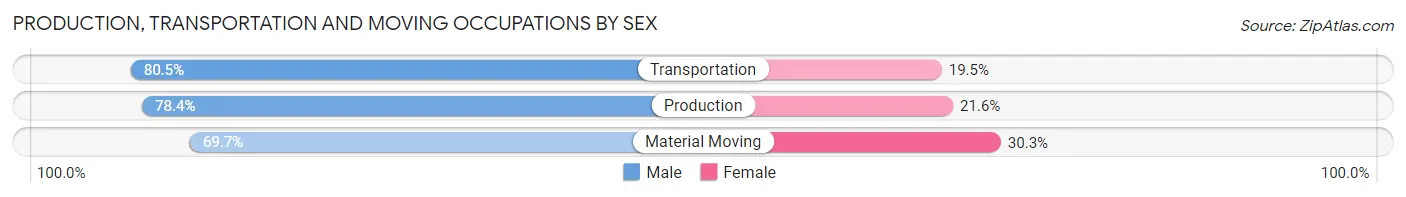
| Occupation | Male | Female |
| Production | 229 (78.4%) | 63 (21.6%) |
| Transportation | 252 (80.5%) | 61 (19.5%) |
| Material Moving | 62 (69.7%) | 27 (30.3%) |
| Total (Category) | 543 (78.2%) | 151 (21.8%) |
| Total (Overall) | 1,983 (49.5%) | 2,020 (50.5%) |
Employment Industries by Sex in Clover Creek
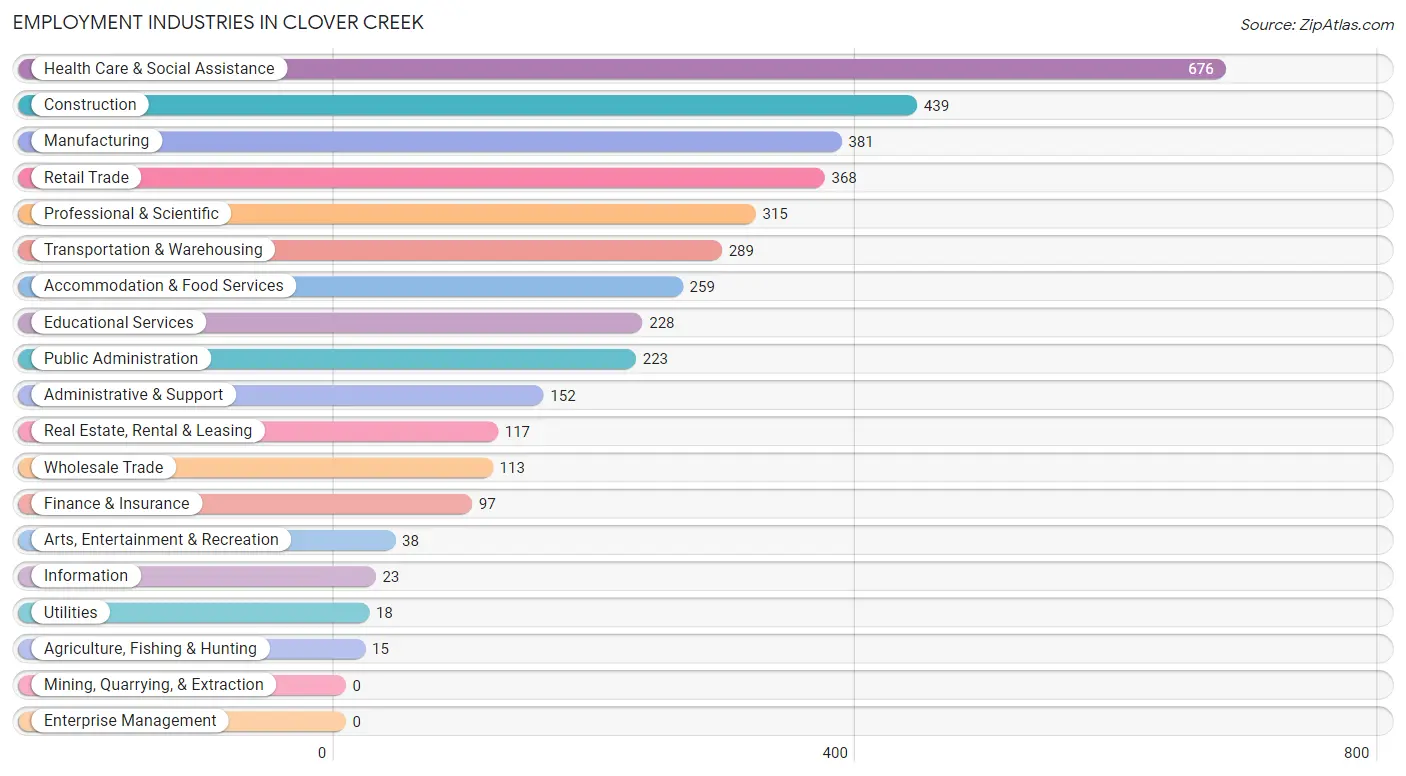
Employment Industries in Clover Creek
The major employment industries in Clover Creek include Health Care & Social Assistance (676 | 16.9%), Construction (439 | 11.0%), Manufacturing (381 | 9.5%), Retail Trade (368 | 9.2%), and Professional & Scientific (315 | 7.9%).
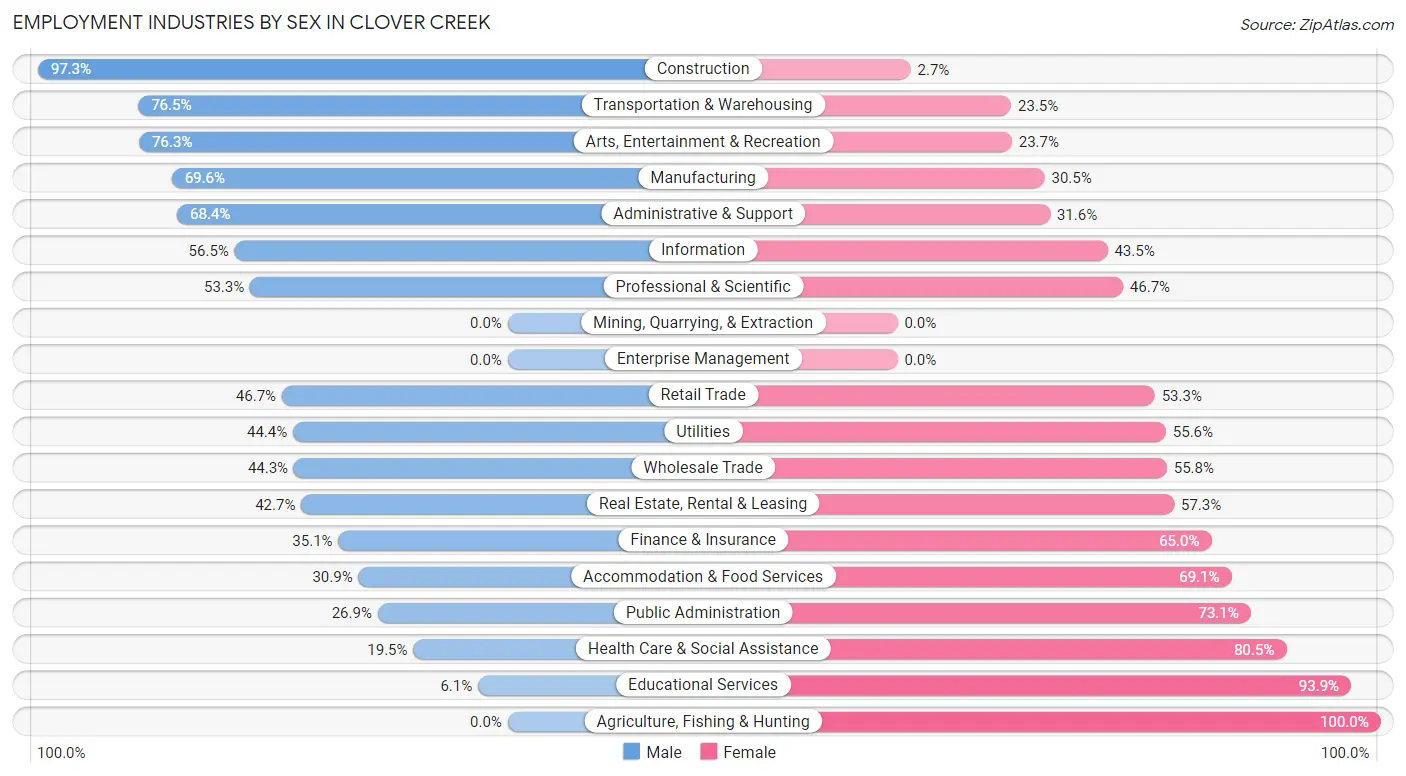
Employment Industries by Sex in Clover Creek
The Clover Creek industries that see more men than women are Construction (97.3%), Transportation & Warehousing (76.5%), and Arts, Entertainment & Recreation (76.3%), whereas the industries that tend to have a higher number of women are Agriculture, Fishing & Hunting (100.0%), Educational Services (93.9%), and Health Care & Social Assistance (80.5%).
| Industry | Male | Female |
| Agriculture, Fishing & Hunting | 0 (0.0%) | 15 (100.0%) |
| Mining, Quarrying, & Extraction | 0 (0.0%) | 0 (0.0%) |
| Construction | 427 (97.3%) | 12 (2.7%) |
| Manufacturing | 265 (69.6%) | 116 (30.4%) |
| Wholesale Trade | 50 (44.3%) | 63 (55.7%) |
| Retail Trade | 172 (46.7%) | 196 (53.3%) |
| Transportation & Warehousing | 221 (76.5%) | 68 (23.5%) |
| Utilities | 8 (44.4%) | 10 (55.6%) |
| Information | 13 (56.5%) | 10 (43.5%) |
| Finance & Insurance | 34 (35.0%) | 63 (64.9%) |
| Real Estate, Rental & Leasing | 50 (42.7%) | 67 (57.3%) |
| Professional & Scientific | 168 (53.3%) | 147 (46.7%) |
| Enterprise Management | 0 (0.0%) | 0 (0.0%) |
| Administrative & Support | 104 (68.4%) | 48 (31.6%) |
| Educational Services | 14 (6.1%) | 214 (93.9%) |
| Health Care & Social Assistance | 132 (19.5%) | 544 (80.5%) |
| Arts, Entertainment & Recreation | 29 (76.3%) | 9 (23.7%) |
| Accommodation & Food Services | 80 (30.9%) | 179 (69.1%) |
| Public Administration | 60 (26.9%) | 163 (73.1%) |
| Total | 1,983 (49.5%) | 2,020 (50.5%) |
Education in Clover Creek
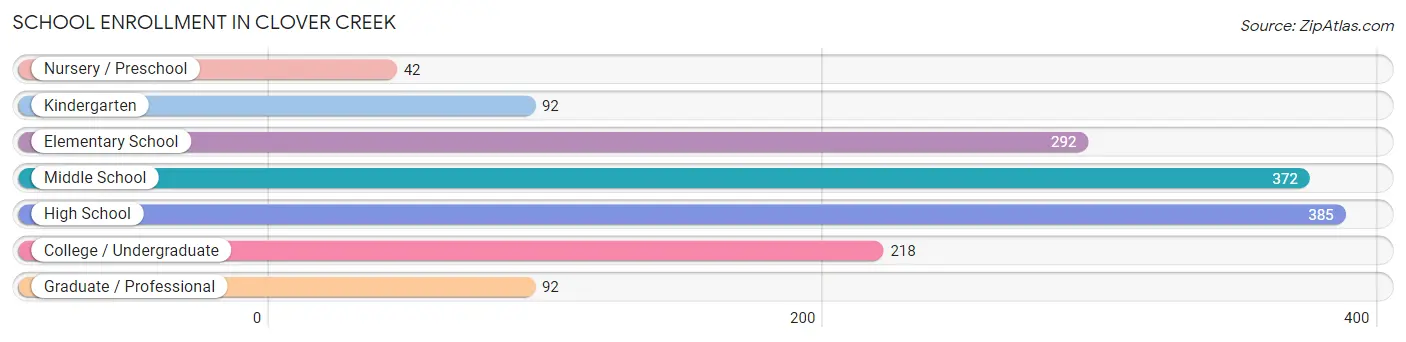
School Enrollment in Clover Creek
The most common levels of schooling among the 1,493 students in Clover Creek are high school (385 | 25.8%), middle school (372 | 24.9%), and elementary school (292 | 19.6%).
| School Level | # Students | % Students |
| Nursery / Preschool | 42 | 2.8% |
| Kindergarten | 92 | 6.2% |
| Elementary School | 292 | 19.6% |
| Middle School | 372 | 24.9% |
| High School | 385 | 25.8% |
| College / Undergraduate | 218 | 14.6% |
| Graduate / Professional | 92 | 6.2% |
| Total | 1,493 | 100.0% |
School Enrollment by Age by Funding Source in Clover Creek
Out of a total of 1,493 students who are enrolled in schools in Clover Creek, 325 (21.8%) attend a private institution, while the remaining 1,168 (78.2%) are enrolled in public schools. The age group of 3 to 4 year olds has the highest likelihood of being enrolled in private schools, with 19 (70.4% in the age bracket) enrolled. Conversely, the age group of 18 to 19 year olds has the lowest likelihood of being enrolled in a private school, with 110 (100.0% in the age bracket) attending a public institution.
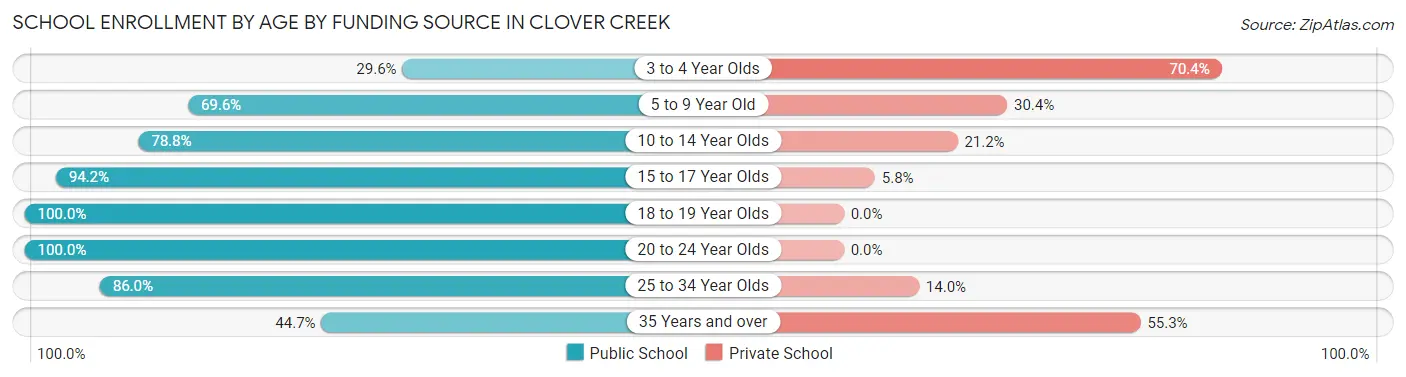
| Age Bracket | Public School | Private School |
| 3 to 4 Year Olds | 8 (29.6%) | 19 (70.4%) |
| 5 to 9 Year Old | 256 (69.6%) | 112 (30.4%) |
| 10 to 14 Year Olds | 331 (78.8%) | 89 (21.2%) |
| 15 to 17 Year Olds | 243 (94.2%) | 15 (5.8%) |
| 18 to 19 Year Olds | 110 (100.0%) | 0 (0.0%) |
| 20 to 24 Year Olds | 30 (100.0%) | 0 (0.0%) |
| 25 to 34 Year Olds | 135 (86.0%) | 22 (14.0%) |
| 35 Years and over | 55 (44.7%) | 68 (55.3%) |
| Total | 1,168 (78.2%) | 325 (21.8%) |
Educational Attainment by Field of Study in Clover Creek
Social sciences (247 | 19.2%), business (215 | 16.7%), arts & humanities (204 | 15.9%), science & technology (127 | 9.9%), and psychology (113 | 8.8%) are the most common fields of study among 1,284 individuals in Clover Creek who have obtained a bachelor's degree or higher.
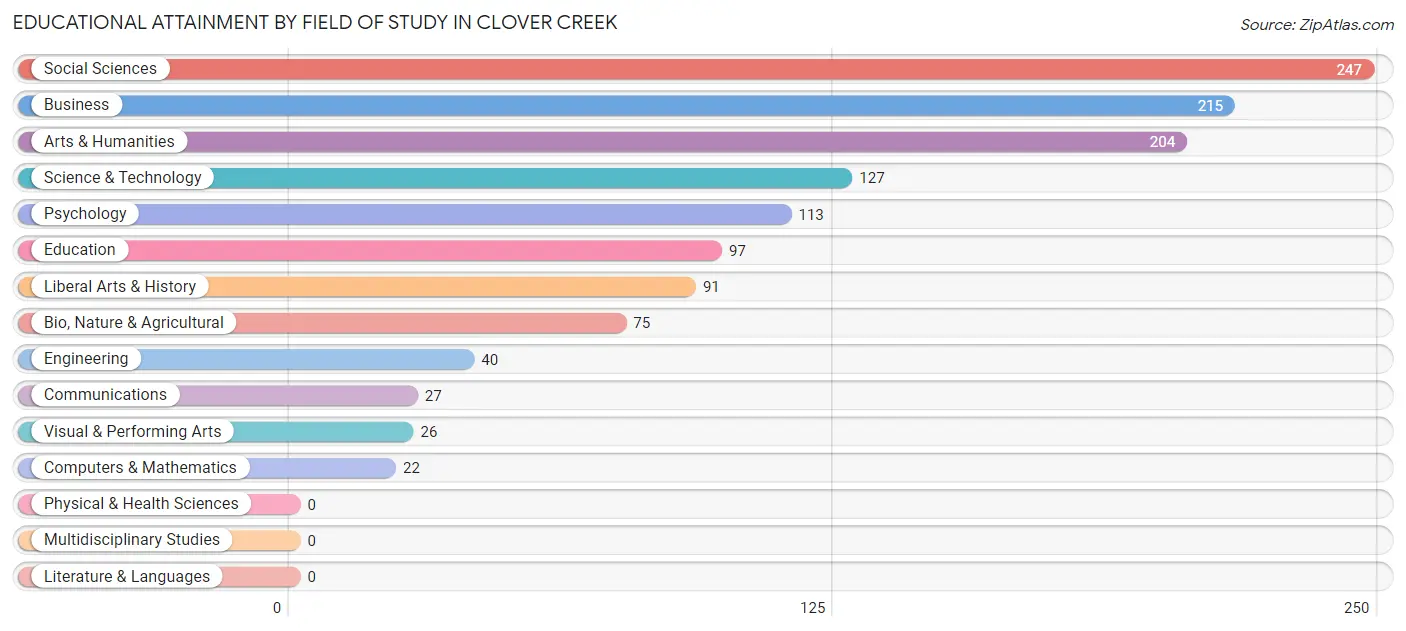
| Field of Study | # Graduates | % Graduates |
| Computers & Mathematics | 22 | 1.7% |
| Bio, Nature & Agricultural | 75 | 5.8% |
| Physical & Health Sciences | 0 | 0.0% |
| Psychology | 113 | 8.8% |
| Social Sciences | 247 | 19.2% |
| Engineering | 40 | 3.1% |
| Multidisciplinary Studies | 0 | 0.0% |
| Science & Technology | 127 | 9.9% |
| Business | 215 | 16.7% |
| Education | 97 | 7.5% |
| Literature & Languages | 0 | 0.0% |
| Liberal Arts & History | 91 | 7.1% |
| Visual & Performing Arts | 26 | 2.0% |
| Communications | 27 | 2.1% |
| Arts & Humanities | 204 | 15.9% |
| Total | 1,284 | 100.0% |
Transportation & Commute in Clover Creek
Vehicle Availability by Sex in Clover Creek
The most prevalent vehicle ownership categories in Clover Creek are males with 2 vehicles (889, accounting for 45.2%) and females with 2 vehicles (702, making up 49.0%).
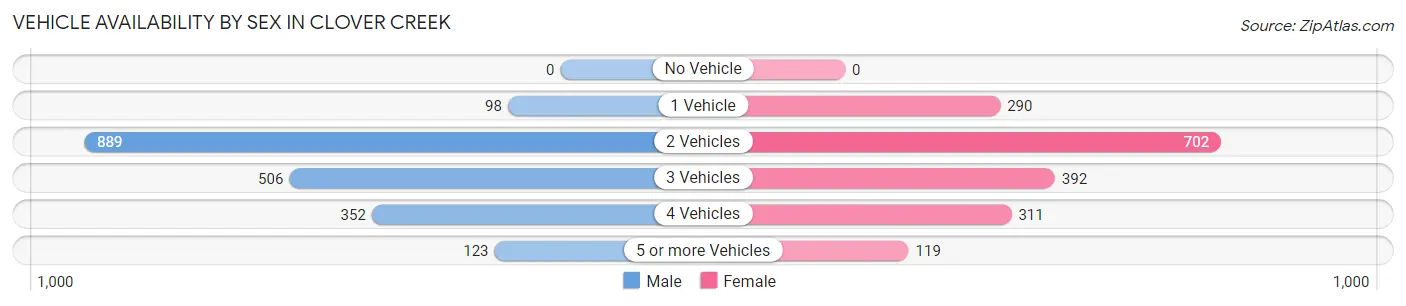
| Vehicles Available | Male | Female |
| No Vehicle | 0 (0.0%) | 0 (0.0%) |
| 1 Vehicle | 98 (5.0%) | 290 (16.0%) |
| 2 Vehicles | 889 (45.2%) | 702 (38.7%) |
| 3 Vehicles | 506 (25.7%) | 392 (21.6%) |
| 4 Vehicles | 352 (17.9%) | 311 (17.1%) |
| 5 or more Vehicles | 123 (6.2%) | 119 (6.6%) |
| Total | 1,968 (100.0%) | 1,814 (100.0%) |
Commute Time in Clover Creek
The most frequently occuring commute durations in Clover Creek are 20 to 24 minutes (676 commuters, 19.5%), 15 to 19 minutes (549 commuters, 15.8%), and 25 to 29 minutes (425 commuters, 12.3%).
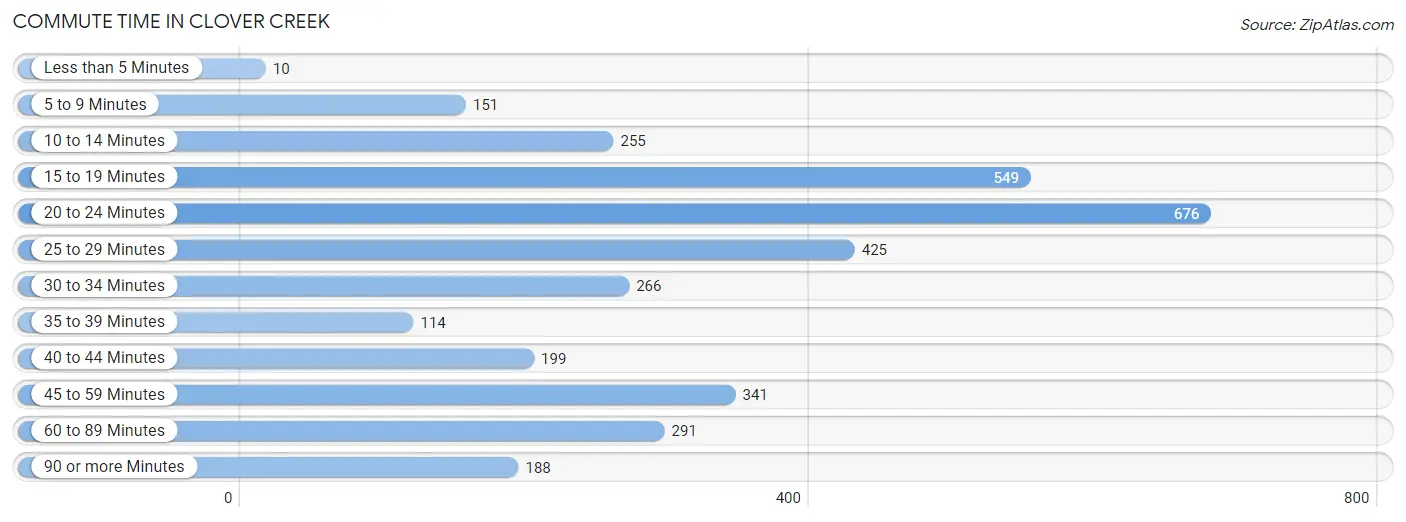
| Commute Time | # Commuters | % Commuters |
| Less than 5 Minutes | 10 | 0.3% |
| 5 to 9 Minutes | 151 | 4.4% |
| 10 to 14 Minutes | 255 | 7.4% |
| 15 to 19 Minutes | 549 | 15.8% |
| 20 to 24 Minutes | 676 | 19.5% |
| 25 to 29 Minutes | 425 | 12.3% |
| 30 to 34 Minutes | 266 | 7.7% |
| 35 to 39 Minutes | 114 | 3.3% |
| 40 to 44 Minutes | 199 | 5.7% |
| 45 to 59 Minutes | 341 | 9.8% |
| 60 to 89 Minutes | 291 | 8.4% |
| 90 or more Minutes | 188 | 5.4% |
Commute Time by Sex in Clover Creek
The most common commute times in Clover Creek are 15 to 19 minutes (304 commuters, 15.8%) for males and 20 to 24 minutes (398 commuters, 25.8%) for females.
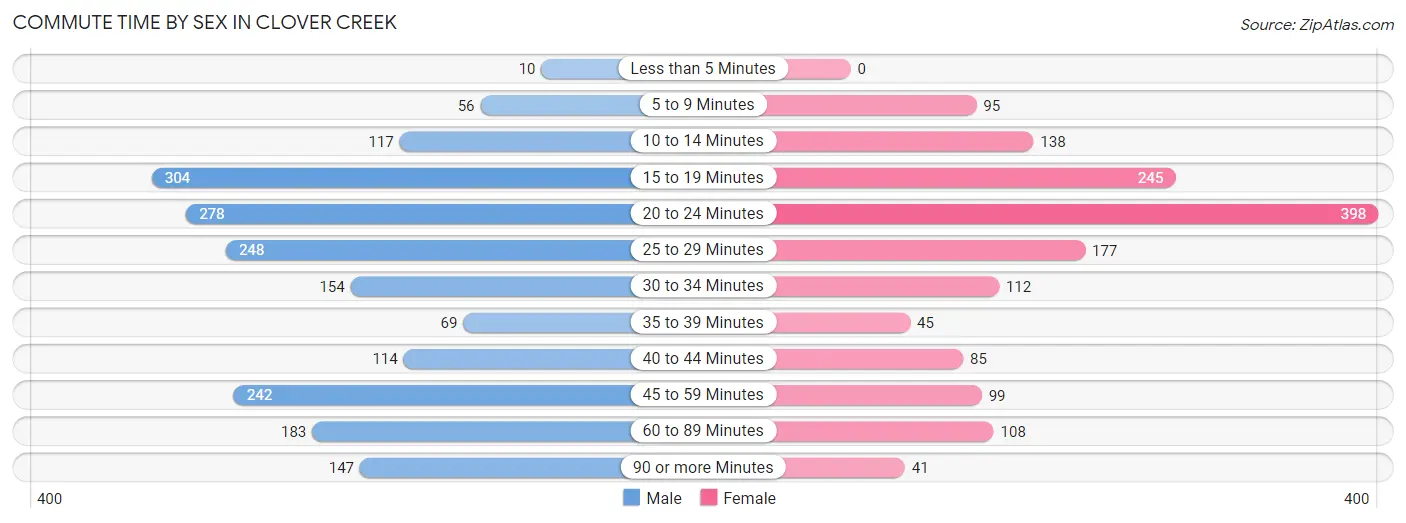
| Commute Time | Male | Female |
| Less than 5 Minutes | 10 (0.5%) | 0 (0.0%) |
| 5 to 9 Minutes | 56 (2.9%) | 95 (6.2%) |
| 10 to 14 Minutes | 117 (6.1%) | 138 (8.9%) |
| 15 to 19 Minutes | 304 (15.8%) | 245 (15.9%) |
| 20 to 24 Minutes | 278 (14.5%) | 398 (25.8%) |
| 25 to 29 Minutes | 248 (12.9%) | 177 (11.5%) |
| 30 to 34 Minutes | 154 (8.0%) | 112 (7.3%) |
| 35 to 39 Minutes | 69 (3.6%) | 45 (2.9%) |
| 40 to 44 Minutes | 114 (5.9%) | 85 (5.5%) |
| 45 to 59 Minutes | 242 (12.6%) | 99 (6.4%) |
| 60 to 89 Minutes | 183 (9.5%) | 108 (7.0%) |
| 90 or more Minutes | 147 (7.6%) | 41 (2.7%) |
Time of Departure to Work by Sex in Clover Creek
The most frequent times of departure to work in Clover Creek are 12:00 AM to 4:59 AM (267, 13.9%) for males and 6:00 AM to 6:29 AM (263, 17.0%) for females.
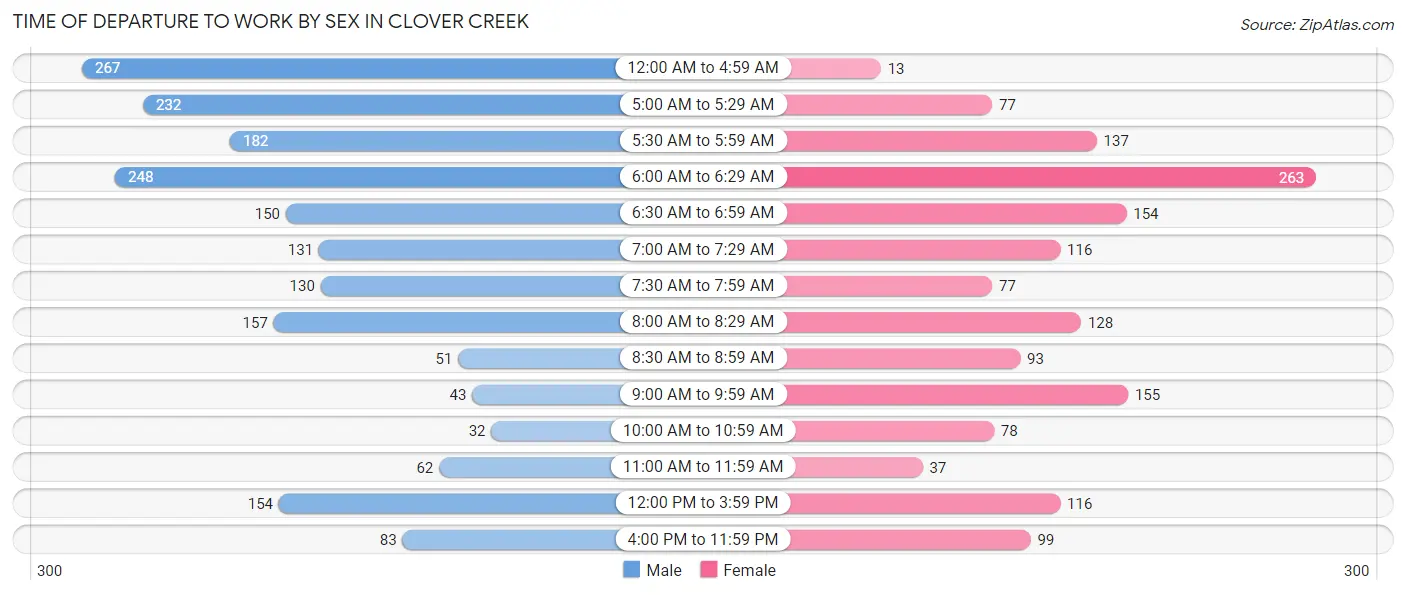
| Time of Departure | Male | Female |
| 12:00 AM to 4:59 AM | 267 (13.9%) | 13 (0.8%) |
| 5:00 AM to 5:29 AM | 232 (12.1%) | 77 (5.0%) |
| 5:30 AM to 5:59 AM | 182 (9.5%) | 137 (8.9%) |
| 6:00 AM to 6:29 AM | 248 (12.9%) | 263 (17.0%) |
| 6:30 AM to 6:59 AM | 150 (7.8%) | 154 (10.0%) |
| 7:00 AM to 7:29 AM | 131 (6.8%) | 116 (7.5%) |
| 7:30 AM to 7:59 AM | 130 (6.8%) | 77 (5.0%) |
| 8:00 AM to 8:29 AM | 157 (8.2%) | 128 (8.3%) |
| 8:30 AM to 8:59 AM | 51 (2.6%) | 93 (6.0%) |
| 9:00 AM to 9:59 AM | 43 (2.2%) | 155 (10.1%) |
| 10:00 AM to 10:59 AM | 32 (1.7%) | 78 (5.1%) |
| 11:00 AM to 11:59 AM | 62 (3.2%) | 37 (2.4%) |
| 12:00 PM to 3:59 PM | 154 (8.0%) | 116 (7.5%) |
| 4:00 PM to 11:59 PM | 83 (4.3%) | 99 (6.4%) |
| Total | 1,922 (100.0%) | 1,543 (100.0%) |
Housing Occupancy in Clover Creek
Occupancy by Ownership in Clover Creek
Of the total 2,811 dwellings in Clover Creek, owner-occupied units account for 1,917 (68.2%), while renter-occupied units make up 894 (31.8%).
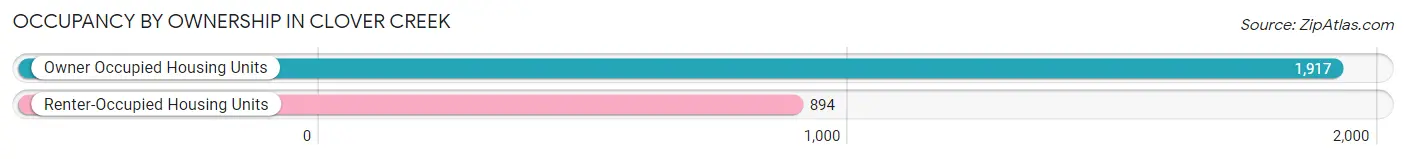
| Occupancy | # Housing Units | % Housing Units |
| Owner Occupied Housing Units | 1,917 | 68.2% |
| Renter-Occupied Housing Units | 894 | 31.8% |
| Total Occupied Housing Units | 2,811 | 100.0% |
Occupancy by Household Size in Clover Creek
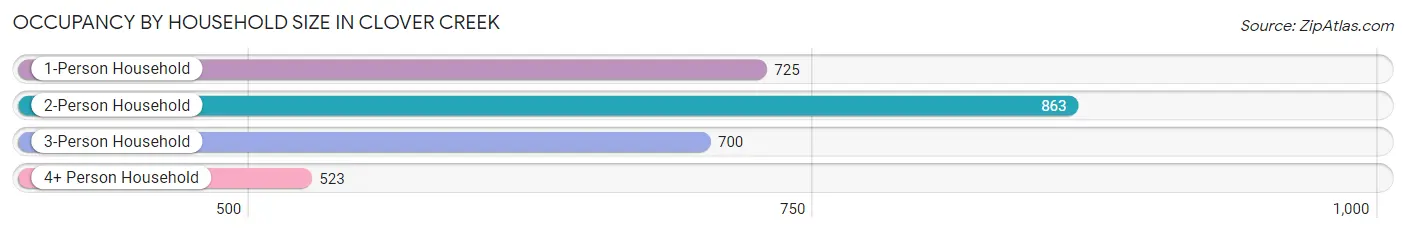
| Household Size | # Housing Units | % Housing Units |
| 1-Person Household | 725 | 25.8% |
| 2-Person Household | 863 | 30.7% |
| 3-Person Household | 700 | 24.9% |
| 4+ Person Household | 523 | 18.6% |
| Total Housing Units | 2,811 | 100.0% |
Occupancy by Ownership by Household Size in Clover Creek
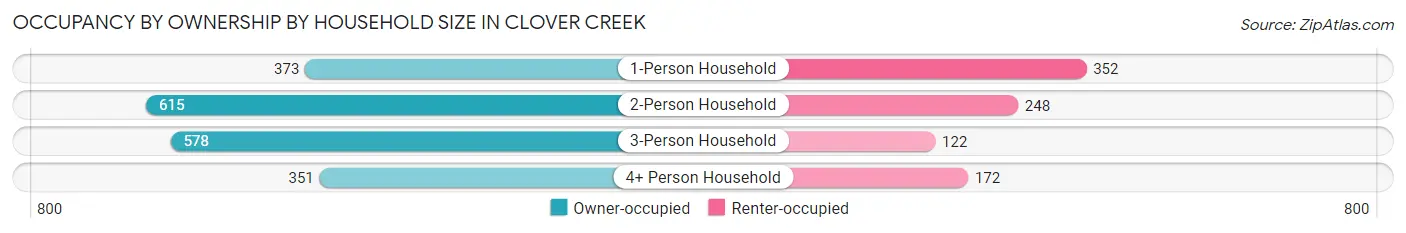
| Household Size | Owner-occupied | Renter-occupied |
| 1-Person Household | 373 (51.4%) | 352 (48.5%) |
| 2-Person Household | 615 (71.3%) | 248 (28.7%) |
| 3-Person Household | 578 (82.6%) | 122 (17.4%) |
| 4+ Person Household | 351 (67.1%) | 172 (32.9%) |
| Total Housing Units | 1,917 (68.2%) | 894 (31.8%) |
Occupancy by Educational Attainment in Clover Creek
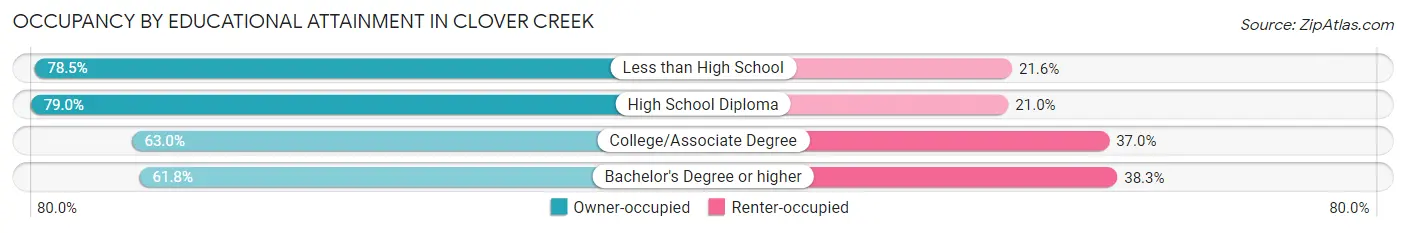
| Household Size | Owner-occupied | Renter-occupied |
| Less than High School | 91 (78.4%) | 25 (21.5%) |
| High School Diploma | 671 (79.0%) | 178 (21.0%) |
| College/Associate Degree | 745 (63.0%) | 437 (37.0%) |
| Bachelor's Degree or higher | 410 (61.8%) | 254 (38.3%) |
Occupancy by Age of Householder in Clover Creek
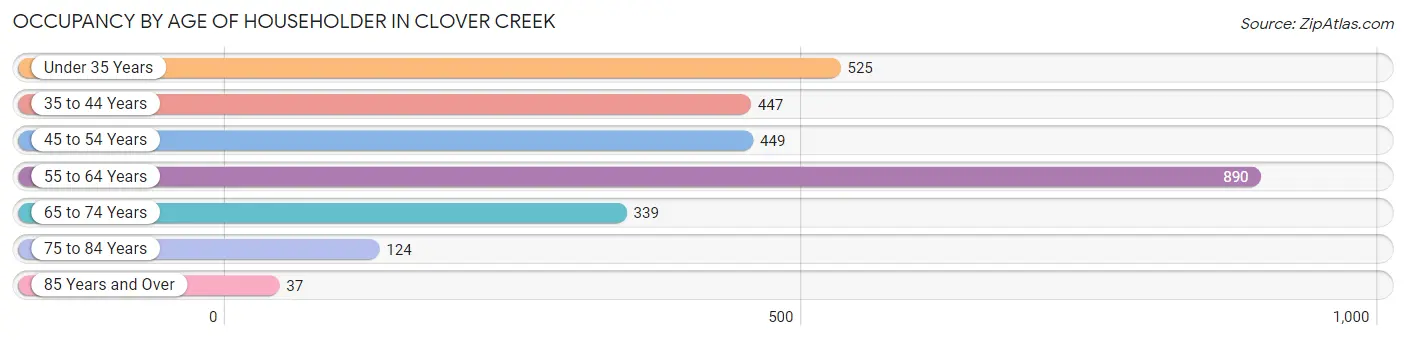
| Age Bracket | # Households | % Households |
| Under 35 Years | 525 | 18.7% |
| 35 to 44 Years | 447 | 15.9% |
| 45 to 54 Years | 449 | 16.0% |
| 55 to 64 Years | 890 | 31.7% |
| 65 to 74 Years | 339 | 12.1% |
| 75 to 84 Years | 124 | 4.4% |
| 85 Years and Over | 37 | 1.3% |
| Total | 2,811 | 100.0% |
Housing Finances in Clover Creek
Median Income by Occupancy in Clover Creek
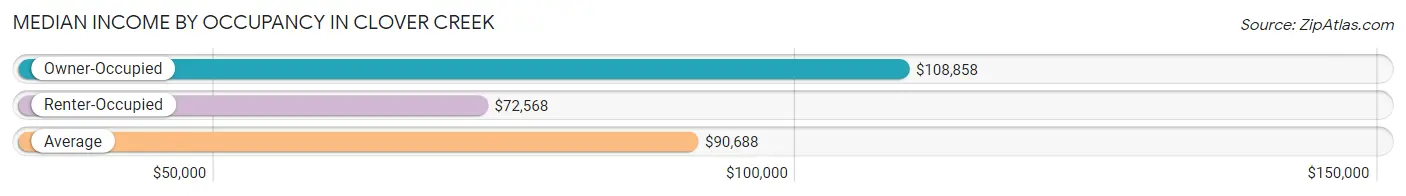
| Occupancy Type | # Households | Median Income |
| Owner-Occupied | 1,917 (68.2%) | $108,858 |
| Renter-Occupied | 894 (31.8%) | $72,568 |
| Average | 2,811 (100.0%) | $90,688 |
Occupancy by Householder Income Bracket in Clover Creek
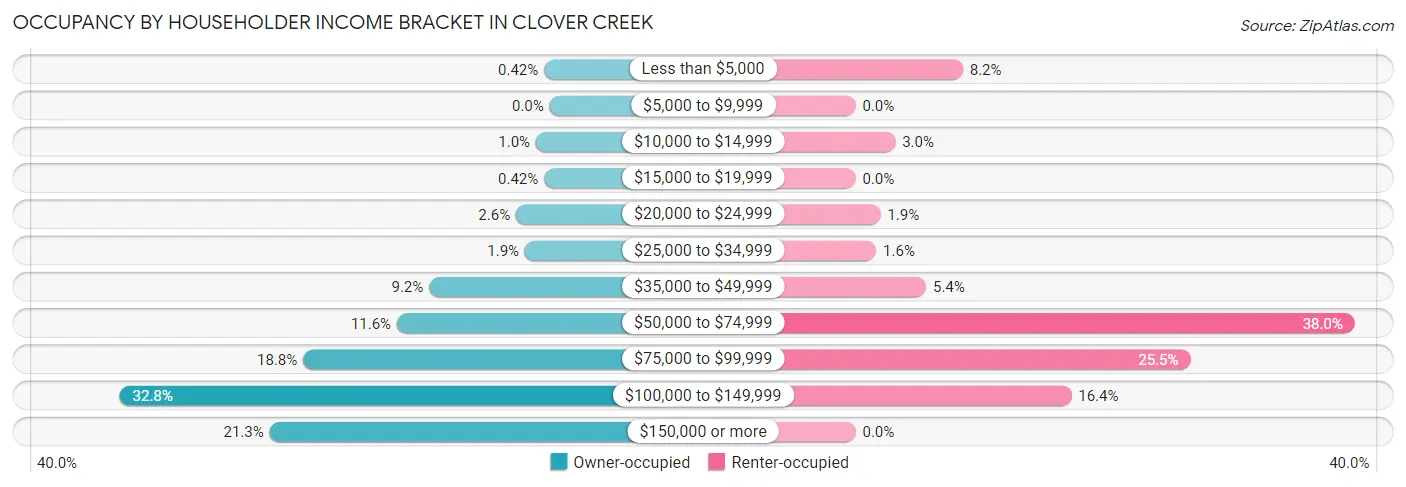
| Income Bracket | Owner-occupied | Renter-occupied |
| Less than $5,000 | 8 (0.4%) | 73 (8.2%) |
| $5,000 to $9,999 | 0 (0.0%) | 0 (0.0%) |
| $10,000 to $14,999 | 20 (1.0%) | 27 (3.0%) |
| $15,000 to $19,999 | 8 (0.4%) | 0 (0.0%) |
| $20,000 to $24,999 | 49 (2.6%) | 17 (1.9%) |
| $25,000 to $34,999 | 36 (1.9%) | 14 (1.6%) |
| $35,000 to $49,999 | 176 (9.2%) | 48 (5.4%) |
| $50,000 to $74,999 | 223 (11.6%) | 340 (38.0%) |
| $75,000 to $99,999 | 360 (18.8%) | 228 (25.5%) |
| $100,000 to $149,999 | 628 (32.8%) | 147 (16.4%) |
| $150,000 or more | 409 (21.3%) | 0 (0.0%) |
| Total | 1,917 (100.0%) | 894 (100.0%) |
Monthly Housing Cost Tiers in Clover Creek
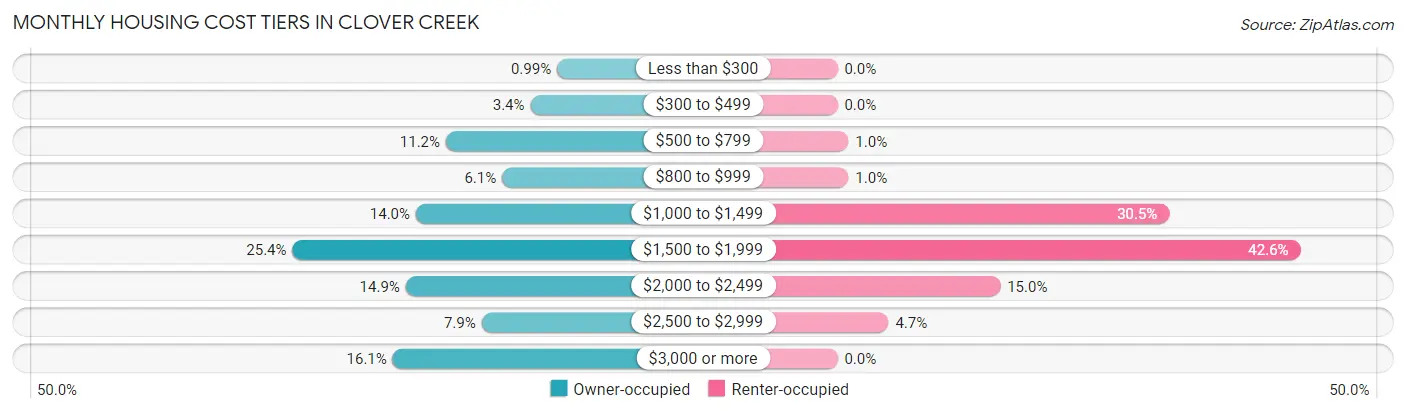
| Monthly Cost | Owner-occupied | Renter-occupied |
| Less than $300 | 19 (1.0%) | 0 (0.0%) |
| $300 to $499 | 66 (3.4%) | 0 (0.0%) |
| $500 to $799 | 215 (11.2%) | 9 (1.0%) |
| $800 to $999 | 116 (6.0%) | 9 (1.0%) |
| $1,000 to $1,499 | 268 (14.0%) | 273 (30.5%) |
| $1,500 to $1,999 | 486 (25.4%) | 381 (42.6%) |
| $2,000 to $2,499 | 286 (14.9%) | 134 (15.0%) |
| $2,500 to $2,999 | 152 (7.9%) | 42 (4.7%) |
| $3,000 or more | 309 (16.1%) | 0 (0.0%) |
| Total | 1,917 (100.0%) | 894 (100.0%) |
Physical Housing Characteristics in Clover Creek
Housing Structures in Clover Creek
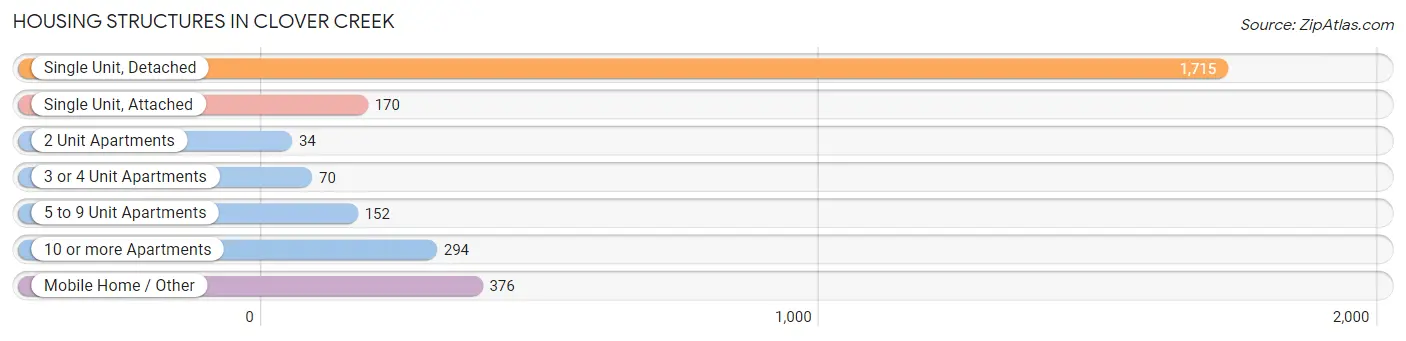
| Structure Type | # Housing Units | % Housing Units |
| Single Unit, Detached | 1,715 | 61.0% |
| Single Unit, Attached | 170 | 6.0% |
| 2 Unit Apartments | 34 | 1.2% |
| 3 or 4 Unit Apartments | 70 | 2.5% |
| 5 to 9 Unit Apartments | 152 | 5.4% |
| 10 or more Apartments | 294 | 10.5% |
| Mobile Home / Other | 376 | 13.4% |
| Total | 2,811 | 100.0% |
Housing Structures by Occupancy in Clover Creek
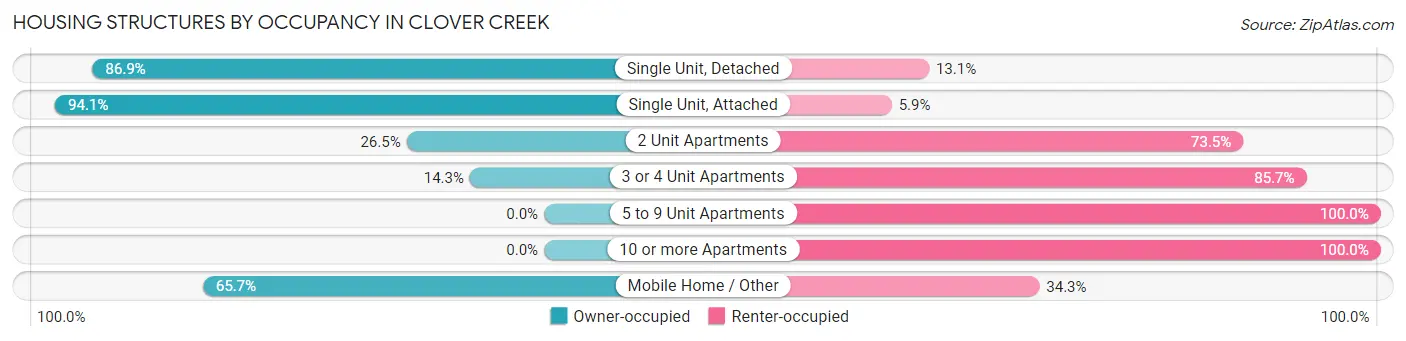
| Structure Type | Owner-occupied | Renter-occupied |
| Single Unit, Detached | 1,491 (86.9%) | 224 (13.1%) |
| Single Unit, Attached | 160 (94.1%) | 10 (5.9%) |
| 2 Unit Apartments | 9 (26.5%) | 25 (73.5%) |
| 3 or 4 Unit Apartments | 10 (14.3%) | 60 (85.7%) |
| 5 to 9 Unit Apartments | 0 (0.0%) | 152 (100.0%) |
| 10 or more Apartments | 0 (0.0%) | 294 (100.0%) |
| Mobile Home / Other | 247 (65.7%) | 129 (34.3%) |
| Total | 1,917 (68.2%) | 894 (31.8%) |
Housing Structures by Number of Rooms in Clover Creek
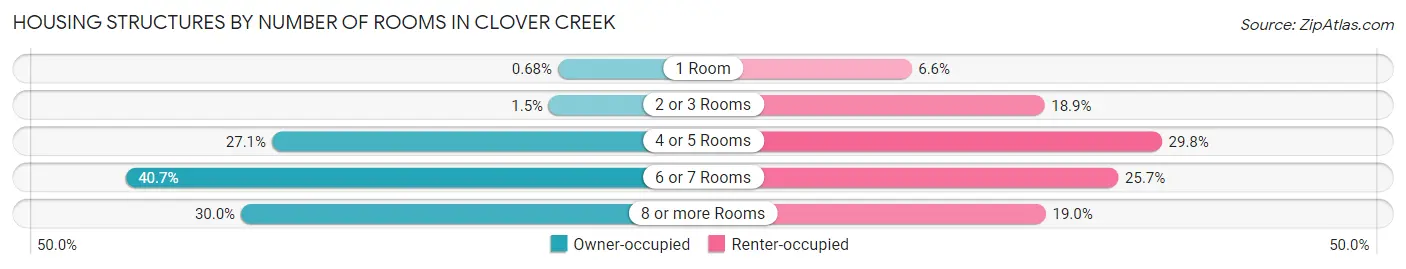
| Number of Rooms | Owner-occupied | Renter-occupied |
| 1 Room | 13 (0.7%) | 59 (6.6%) |
| 2 or 3 Rooms | 29 (1.5%) | 169 (18.9%) |
| 4 or 5 Rooms | 520 (27.1%) | 266 (29.7%) |
| 6 or 7 Rooms | 780 (40.7%) | 230 (25.7%) |
| 8 or more Rooms | 575 (30.0%) | 170 (19.0%) |
| Total | 1,917 (100.0%) | 894 (100.0%) |
Housing Structure by Heating Type in Clover Creek
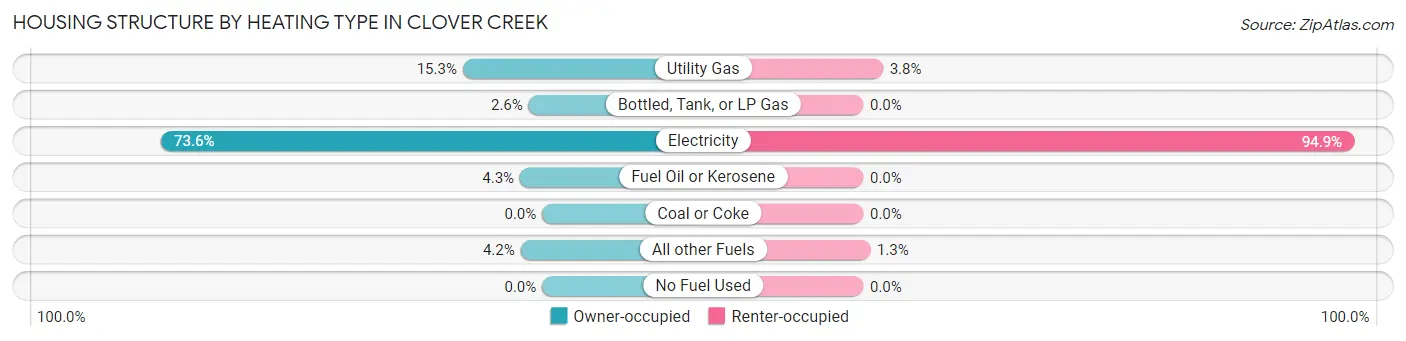
| Heating Type | Owner-occupied | Renter-occupied |
| Utility Gas | 294 (15.3%) | 34 (3.8%) |
| Bottled, Tank, or LP Gas | 50 (2.6%) | 0 (0.0%) |
| Electricity | 1,411 (73.6%) | 848 (94.9%) |
| Fuel Oil or Kerosene | 82 (4.3%) | 0 (0.0%) |
| Coal or Coke | 0 (0.0%) | 0 (0.0%) |
| All other Fuels | 80 (4.2%) | 12 (1.3%) |
| No Fuel Used | 0 (0.0%) | 0 (0.0%) |
| Total | 1,917 (100.0%) | 894 (100.0%) |
Household Vehicle Usage in Clover Creek
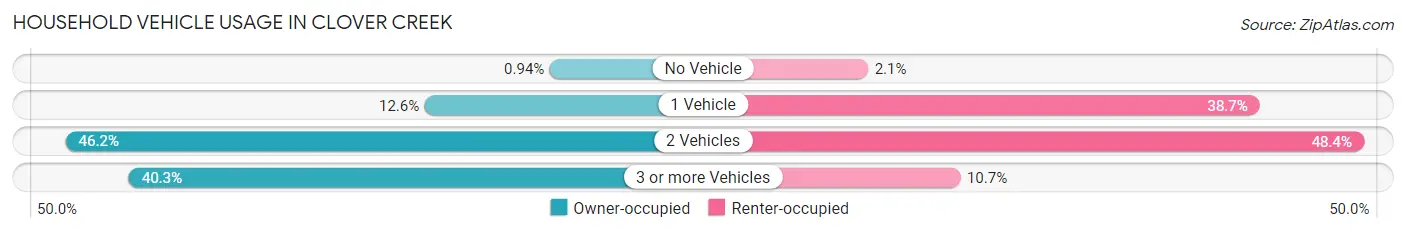
| Vehicles per Household | Owner-occupied | Renter-occupied |
| No Vehicle | 18 (0.9%) | 19 (2.1%) |
| 1 Vehicle | 242 (12.6%) | 346 (38.7%) |
| 2 Vehicles | 885 (46.2%) | 433 (48.4%) |
| 3 or more Vehicles | 772 (40.3%) | 96 (10.7%) |
| Total | 1,917 (100.0%) | 894 (100.0%) |
Real Estate & Mortgages in Clover Creek
Real Estate and Mortgage Overview in Clover Creek
| Characteristic | Without Mortgage | With Mortgage |
| Housing Units | 520 | 1,397 |
| Median Property Value | $359,500 | $415,200 |
| Median Household Income | $61,818 | $348 |
| Monthly Housing Costs | $709 | $309 |
| Real Estate Taxes | $4,132 | $0 |
Property Value by Mortgage Status in Clover Creek
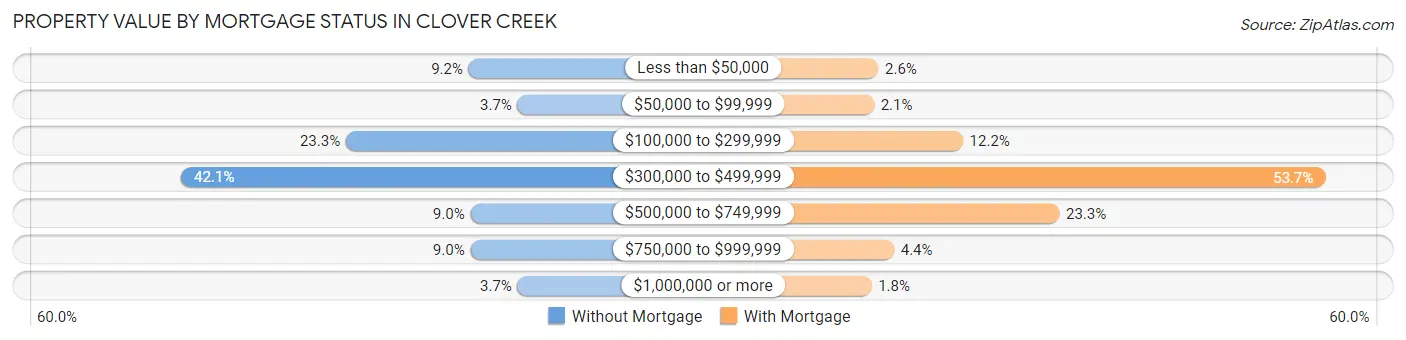
| Property Value | Without Mortgage | With Mortgage |
| Less than $50,000 | 48 (9.2%) | 36 (2.6%) |
| $50,000 to $99,999 | 19 (3.6%) | 29 (2.1%) |
| $100,000 to $299,999 | 121 (23.3%) | 171 (12.2%) |
| $300,000 to $499,999 | 219 (42.1%) | 750 (53.7%) |
| $500,000 to $749,999 | 47 (9.0%) | 325 (23.3%) |
| $750,000 to $999,999 | 47 (9.0%) | 61 (4.4%) |
| $1,000,000 or more | 19 (3.6%) | 25 (1.8%) |
| Total | 520 (100.0%) | 1,397 (100.0%) |
Household Income by Mortgage Status in Clover Creek
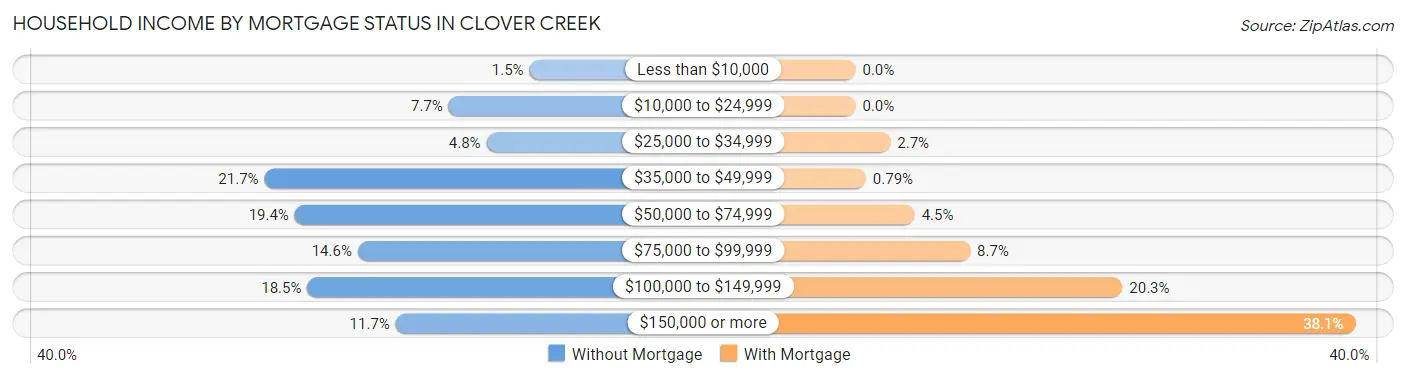
| Household Income | Without Mortgage | With Mortgage |
| Less than $10,000 | 8 (1.5%) | 0 (0.0%) |
| $10,000 to $24,999 | 40 (7.7%) | 0 (0.0%) |
| $25,000 to $34,999 | 25 (4.8%) | 37 (2.6%) |
| $35,000 to $49,999 | 113 (21.7%) | 11 (0.8%) |
| $50,000 to $74,999 | 101 (19.4%) | 63 (4.5%) |
| $75,000 to $99,999 | 76 (14.6%) | 122 (8.7%) |
| $100,000 to $149,999 | 96 (18.5%) | 284 (20.3%) |
| $150,000 or more | 61 (11.7%) | 532 (38.1%) |
| Total | 520 (100.0%) | 1,397 (100.0%) |
Property Value to Household Income Ratio in Clover Creek
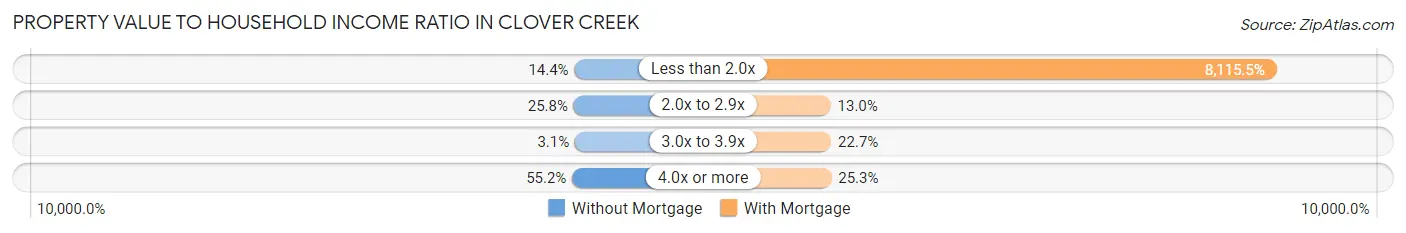
| Value-to-Income Ratio | Without Mortgage | With Mortgage |
| Less than 2.0x | 75 (14.4%) | 113,374 (8,115.5%) |
| 2.0x to 2.9x | 134 (25.8%) | 182 (13.0%) |
| 3.0x to 3.9x | 16 (3.1%) | 317 (22.7%) |
| 4.0x or more | 287 (55.2%) | 354 (25.3%) |
| Total | 520 (100.0%) | 1,397 (100.0%) |
Real Estate Taxes by Mortgage Status in Clover Creek
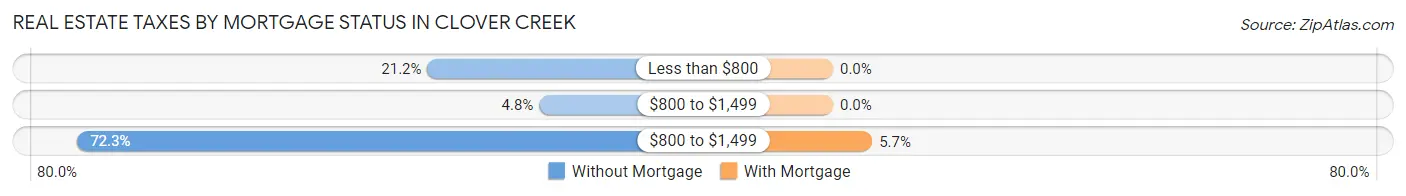
| Property Taxes | Without Mortgage | With Mortgage |
| Less than $800 | 110 (21.1%) | 0 (0.0%) |
| $800 to $1,499 | 25 (4.8%) | 0 (0.0%) |
| $800 to $1,499 | 376 (72.3%) | 80 (5.7%) |
| Total | 520 (100.0%) | 1,397 (100.0%) |
Health & Disability in Clover Creek
Health Insurance Coverage by Age in Clover Creek
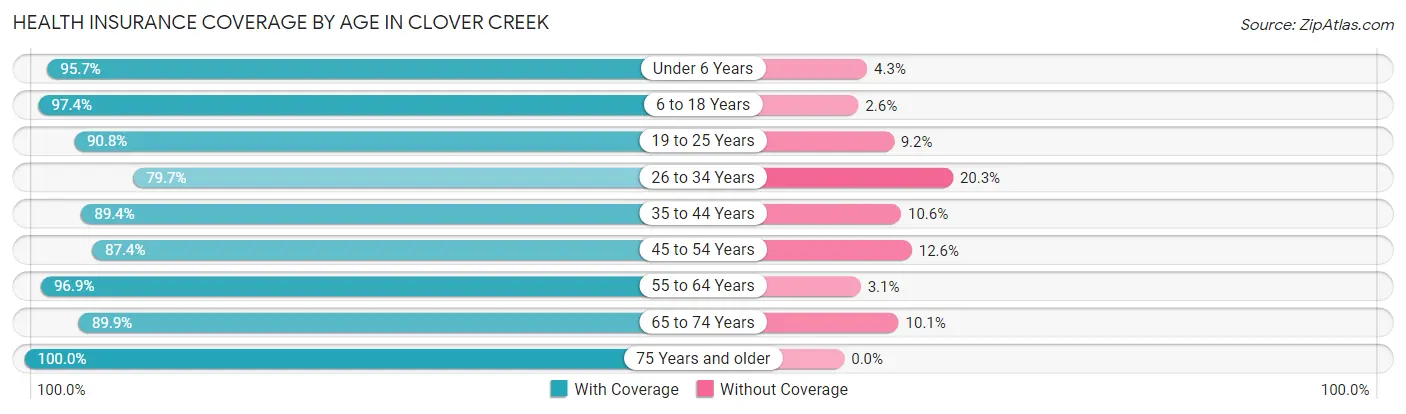
| Age Bracket | With Coverage | Without Coverage |
| Under 6 Years | 337 (95.7%) | 15 (4.3%) |
| 6 to 18 Years | 1,111 (97.4%) | 30 (2.6%) |
| 19 to 25 Years | 414 (90.8%) | 42 (9.2%) |
| 26 to 34 Years | 929 (79.7%) | 236 (20.3%) |
| 35 to 44 Years | 768 (89.4%) | 91 (10.6%) |
| 45 to 54 Years | 868 (87.4%) | 125 (12.6%) |
| 55 to 64 Years | 1,392 (96.9%) | 44 (3.1%) |
| 65 to 74 Years | 559 (89.9%) | 63 (10.1%) |
| 75 Years and older | 263 (100.0%) | 0 (0.0%) |
| Total | 6,641 (91.1%) | 646 (8.9%) |
Health Insurance Coverage by Citizenship Status in Clover Creek
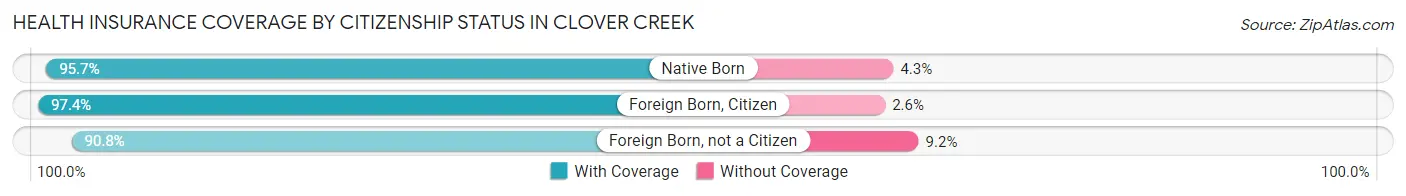
| Citizenship Status | With Coverage | Without Coverage |
| Native Born | 337 (95.7%) | 15 (4.3%) |
| Foreign Born, Citizen | 1,111 (97.4%) | 30 (2.6%) |
| Foreign Born, not a Citizen | 414 (90.8%) | 42 (9.2%) |
Health Insurance Coverage by Household Income in Clover Creek
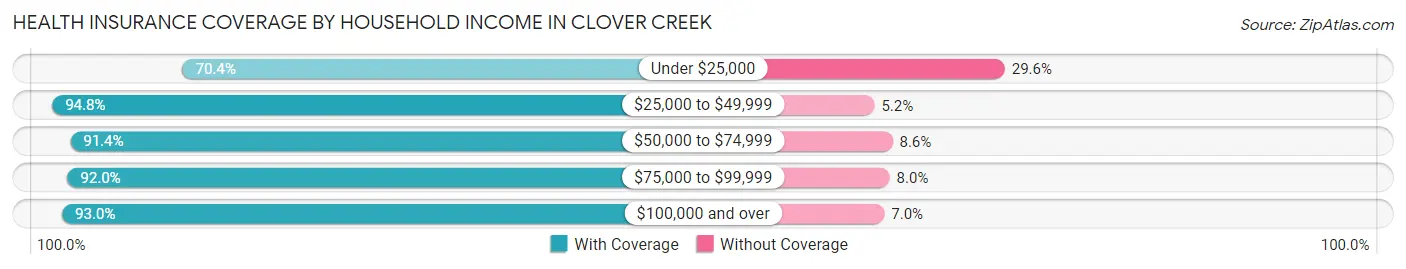
| Household Income | With Coverage | Without Coverage |
| Under $25,000 | 245 (70.4%) | 103 (29.6%) |
| $25,000 to $49,999 | 549 (94.8%) | 30 (5.2%) |
| $50,000 to $74,999 | 1,045 (91.4%) | 98 (8.6%) |
| $75,000 to $99,999 | 1,593 (92.0%) | 139 (8.0%) |
| $100,000 and over | 3,143 (93.0%) | 238 (7.0%) |
Public vs Private Health Insurance Coverage by Age in Clover Creek
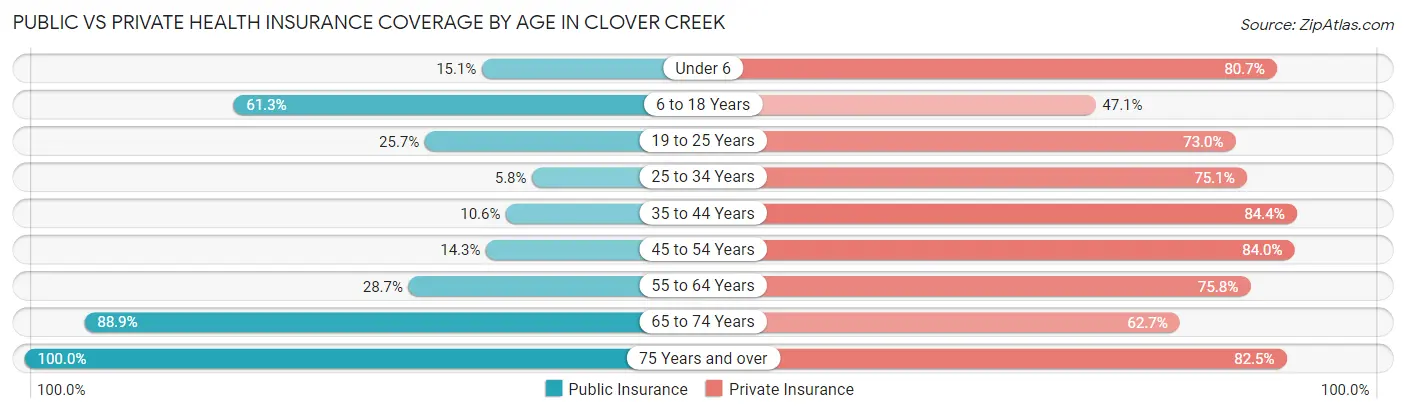
| Age Bracket | Public Insurance | Private Insurance |
| Under 6 | 53 (15.1%) | 284 (80.7%) |
| 6 to 18 Years | 699 (61.3%) | 537 (47.1%) |
| 19 to 25 Years | 117 (25.7%) | 333 (73.0%) |
| 25 to 34 Years | 67 (5.8%) | 875 (75.1%) |
| 35 to 44 Years | 91 (10.6%) | 725 (84.4%) |
| 45 to 54 Years | 142 (14.3%) | 834 (84.0%) |
| 55 to 64 Years | 412 (28.7%) | 1,088 (75.8%) |
| 65 to 74 Years | 553 (88.9%) | 390 (62.7%) |
| 75 Years and over | 263 (100.0%) | 217 (82.5%) |
| Total | 2,397 (32.9%) | 5,283 (72.5%) |
Disability Status by Sex by Age in Clover Creek
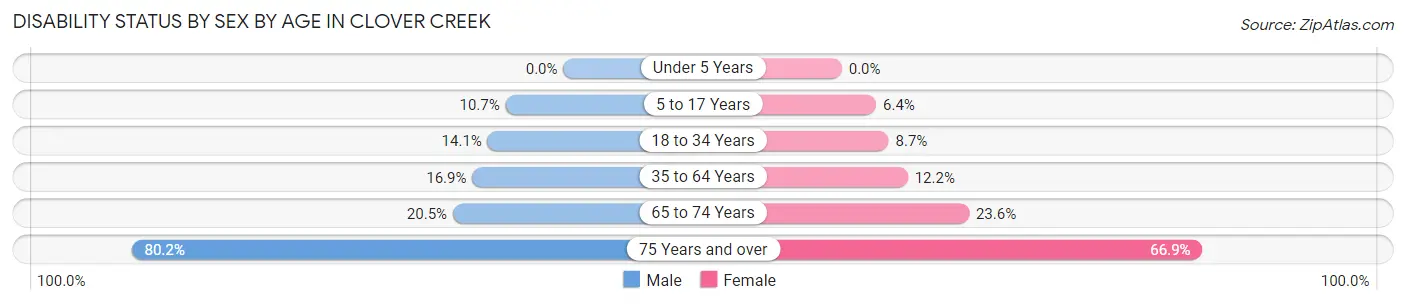
| Age Bracket | Male | Female |
| Under 5 Years | 0 (0.0%) | 0 (0.0%) |
| 5 to 17 Years | 57 (10.7%) | 34 (6.4%) |
| 18 to 34 Years | 145 (14.1%) | 65 (8.7%) |
| 35 to 64 Years | 263 (16.9%) | 212 (12.2%) |
| 65 to 74 Years | 65 (20.5%) | 72 (23.6%) |
| 75 Years and over | 109 (80.1%) | 85 (66.9%) |
Disability Class by Sex by Age in Clover Creek
Disability Class: Hearing Difficulty
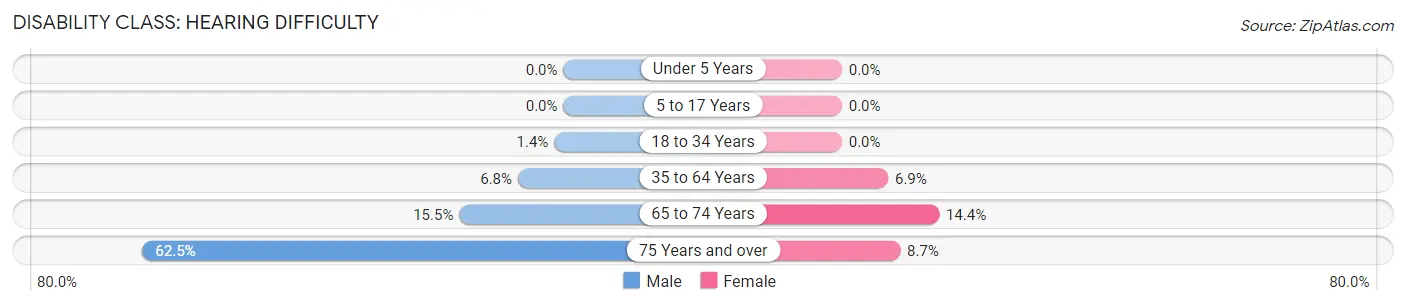
| Age Bracket | Male | Female |
| Under 5 Years | 0 (0.0%) | 0 (0.0%) |
| 5 to 17 Years | 0 (0.0%) | 0 (0.0%) |
| 18 to 34 Years | 14 (1.4%) | 0 (0.0%) |
| 35 to 64 Years | 105 (6.8%) | 119 (6.9%) |
| 65 to 74 Years | 49 (15.5%) | 44 (14.4%) |
| 75 Years and over | 85 (62.5%) | 11 (8.7%) |
Disability Class: Vision Difficulty
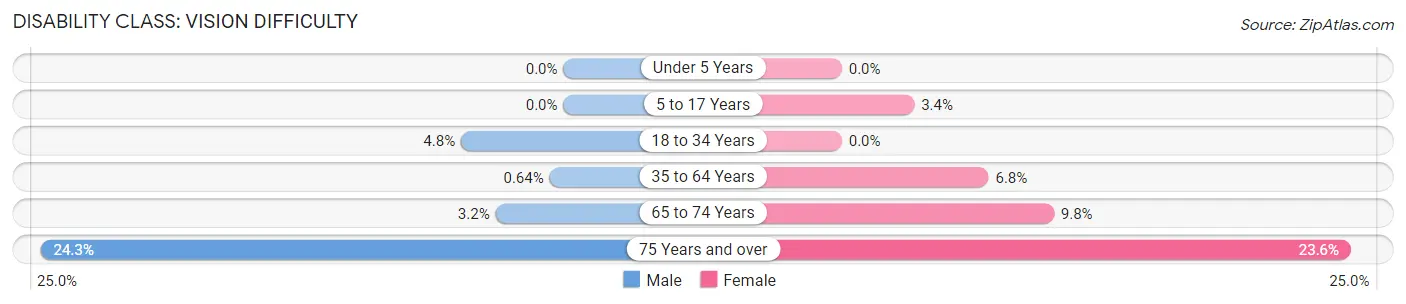
| Age Bracket | Male | Female |
| Under 5 Years | 0 (0.0%) | 0 (0.0%) |
| 5 to 17 Years | 0 (0.0%) | 18 (3.4%) |
| 18 to 34 Years | 49 (4.8%) | 0 (0.0%) |
| 35 to 64 Years | 10 (0.6%) | 118 (6.8%) |
| 65 to 74 Years | 10 (3.2%) | 30 (9.8%) |
| 75 Years and over | 33 (24.3%) | 30 (23.6%) |
Disability Class: Cognitive Difficulty
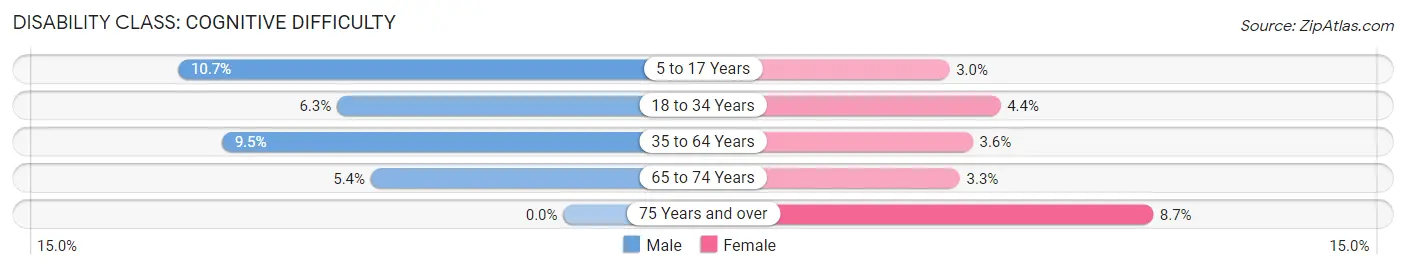
| Age Bracket | Male | Female |
| 5 to 17 Years | 57 (10.7%) | 16 (3.0%) |
| 18 to 34 Years | 65 (6.3%) | 33 (4.4%) |
| 35 to 64 Years | 148 (9.5%) | 63 (3.6%) |
| 65 to 74 Years | 17 (5.4%) | 10 (3.3%) |
| 75 Years and over | 0 (0.0%) | 11 (8.7%) |
Disability Class: Ambulatory Difficulty
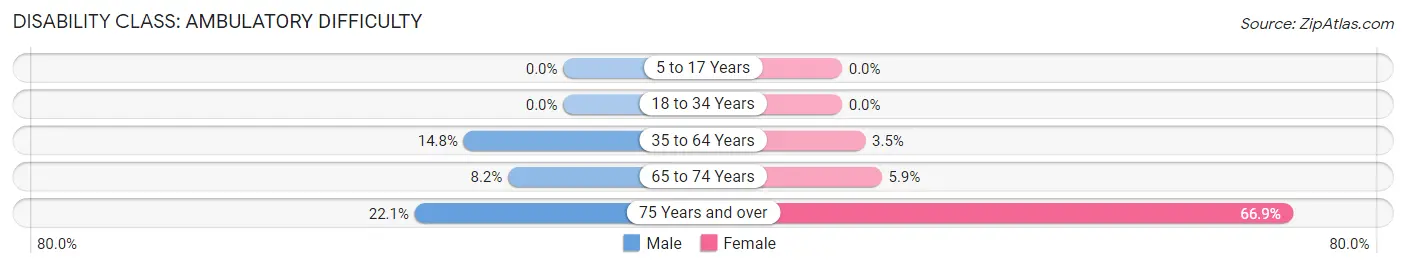
| Age Bracket | Male | Female |
| 5 to 17 Years | 0 (0.0%) | 0 (0.0%) |
| 18 to 34 Years | 0 (0.0%) | 0 (0.0%) |
| 35 to 64 Years | 230 (14.8%) | 60 (3.5%) |
| 65 to 74 Years | 26 (8.2%) | 18 (5.9%) |
| 75 Years and over | 30 (22.1%) | 85 (66.9%) |
Disability Class: Self-Care Difficulty
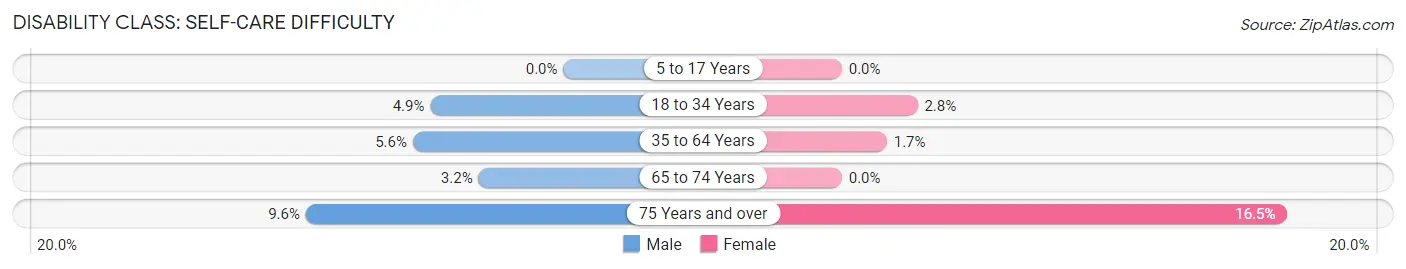
| Age Bracket | Male | Female |
| 5 to 17 Years | 0 (0.0%) | 0 (0.0%) |
| 18 to 34 Years | 51 (4.9%) | 21 (2.8%) |
| 35 to 64 Years | 87 (5.6%) | 29 (1.7%) |
| 65 to 74 Years | 10 (3.2%) | 0 (0.0%) |
| 75 Years and over | 13 (9.6%) | 21 (16.5%) |
Technology Access in Clover Creek
Computing Device Access in Clover Creek
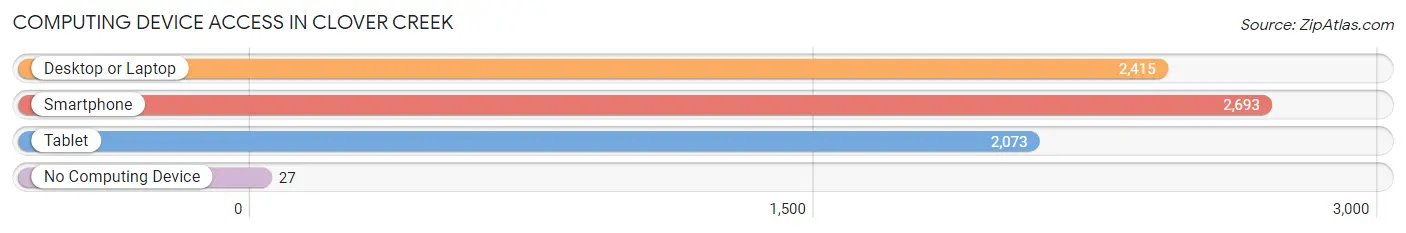
| Device Type | # Households | % Households |
| Desktop or Laptop | 2,415 | 85.9% |
| Smartphone | 2,693 | 95.8% |
| Tablet | 2,073 | 73.8% |
| No Computing Device | 27 | 1.0% |
| Total | 2,811 | 100.0% |
Internet Access in Clover Creek
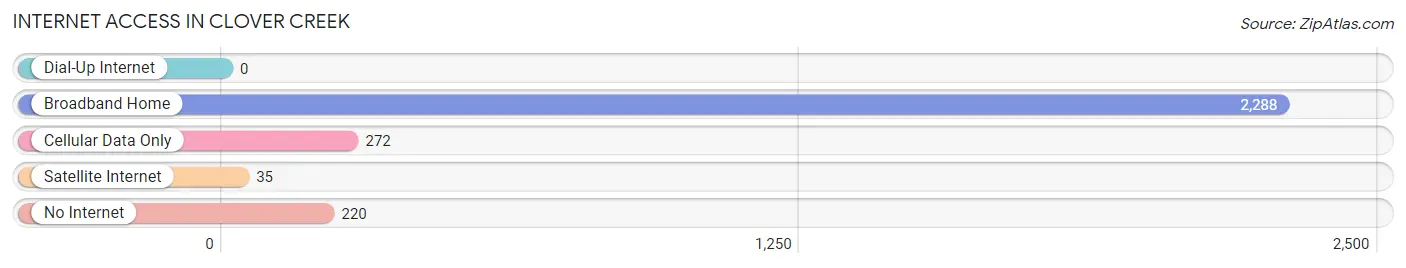
| Internet Type | # Households | % Households |
| Dial-Up Internet | 0 | 0.0% |
| Broadband Home | 2,288 | 81.4% |
| Cellular Data Only | 272 | 9.7% |
| Satellite Internet | 35 | 1.3% |
| No Internet | 220 | 7.8% |
| Total | 2,811 | 100.0% |
Clover Creek Summary
Clover Creek is a small unincorporated community located in Pierce County, Washington, United States. It is situated in the foothills of the Cascade Mountains, approximately 25 miles east of Tacoma and 40 miles south of Seattle. The population of Clover Creek was estimated to be around 1,000 in 2020.
History
Clover Creek was first settled in the late 1800s by homesteaders who were attracted to the area by its abundant natural resources. The first settlers were mostly of Scandinavian descent, and the community was named after the clover that grew in abundance in the area. The first post office was established in 1891, and the town was officially incorporated in 1895.
The early settlers of Clover Creek were primarily farmers and loggers, and the town quickly grew to become a thriving agricultural and logging community. The town was also home to several sawmills, which provided employment for many of the residents. In the early 1900s, the town was also home to a number of small businesses, including a general store, a blacksmith shop, and a hotel.
Geography
Clover Creek is located in the foothills of the Cascade Mountains, approximately 25 miles east of Tacoma and 40 miles south of Seattle. The town is situated at an elevation of 1,000 feet, and is surrounded by lush forests and rolling hills. The nearby White River provides a source of recreation for the residents of Clover Creek, and the town is also home to several small lakes and ponds.
The climate in Clover Creek is mild and temperate, with warm summers and cool winters. The average annual temperature is around 50 degrees Fahrenheit, and the average annual precipitation is around 40 inches.
Economy
The economy of Clover Creek is largely based on agriculture and logging. The town is home to several small farms, which produce a variety of crops, including apples, cherries, and hay. The nearby forests provide a source of timber for the local logging industry, and the town is also home to several sawmills.
In addition to agriculture and logging, Clover Creek is also home to a number of small businesses, including a general store, a hardware store, and a restaurant. The town is also home to a number of small manufacturing companies, which produce a variety of products, including furniture and clothing.
Demographics
As of 2020, the population of Clover Creek was estimated to be around 1,000. The town is predominantly white, with a small minority population. The median household income in Clover Creek is around $50,000, and the median home value is around $200,000. The town is served by the Clover Creek School District, which provides education for students in grades K-12.
Common Questions
What is Per Capita Income in Clover Creek?
Per Capita income in Clover Creek is $40,625.
What is the Median Family Income in Clover Creek?
Median Family Income in Clover Creek is $94,922.
What is the Median Household income in Clover Creek?
Median Household Income in Clover Creek is $90,688.
What is Income or Wage Gap in Clover Creek?
Income or Wage Gap in Clover Creek is 27.3%.
Women in Clover Creek earn 72.7 cents for every dollar earned by a man.
What is Inequality or Gini Index in Clover Creek?
Inequality or Gini Index in Clover Creek is 0.34.
What is the Total Population of Clover Creek?
Total Population of Clover Creek is 7,354.
What is the Total Male Population of Clover Creek?
Total Male Population of Clover Creek is 3,759.
What is the Total Female Population of Clover Creek?
Total Female Population of Clover Creek is 3,595.
What is the Ratio of Males per 100 Females in Clover Creek?
There are 104.56 Males per 100 Females in Clover Creek.
What is the Ratio of Females per 100 Males in Clover Creek?
There are 95.64 Females per 100 Males in Clover Creek.
What is the Median Population Age in Clover Creek?
Median Population Age in Clover Creek is 41.0 Years.
What is the Average Family Size in Clover Creek
Average Family Size in Clover Creek is 3.0 People.
What is the Average Household Size in Clover Creek
Average Household Size in Clover Creek is 2.6 People.
How Large is the Labor Force in Clover Creek?
There are 4,355 People in the Labor Forcein in Clover Creek.
What is the Percentage of People in the Labor Force in Clover Creek?
70.6% of People are in the Labor Force in Clover Creek.
What is the Unemployment Rate in Clover Creek?
Unemployment Rate in Clover Creek is 7.1%.