Cities with the Lowest Poverty Level Among Children Under the Age of 5 in South Dakota
RELATED REPORTS & OPTIONS
Lowest Poverty | Child 0-5
South Dakota
Compare Cities
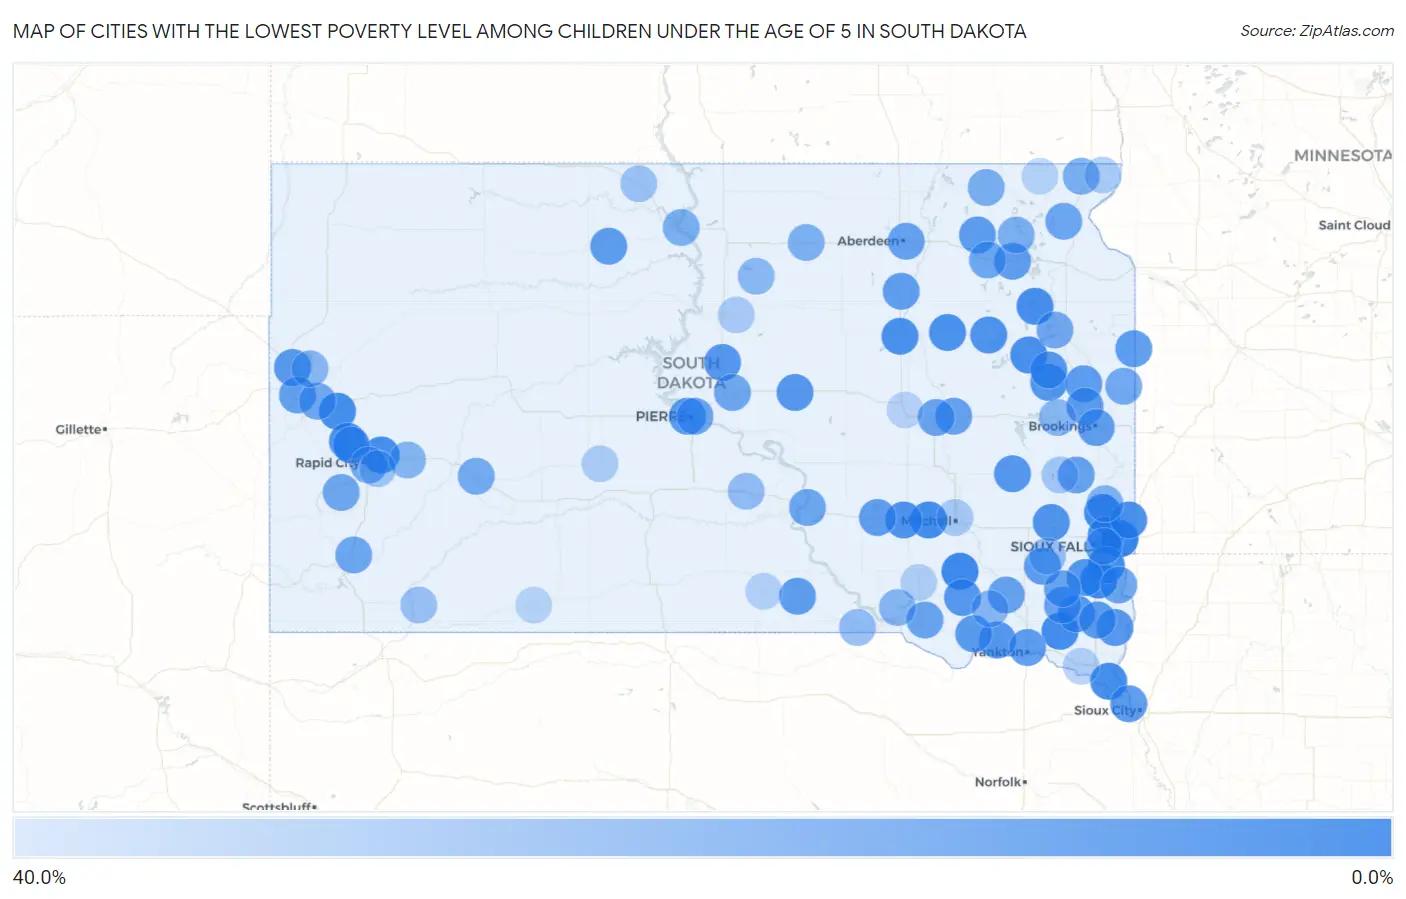
Map of Cities with the Lowest Poverty Level Among Children Under the Age of 5 in South Dakota
40.0%
0.0%
Cities with the Lowest Poverty Level Among Children Under the Age of 5 in South Dakota
| City | Child Poverty | vs State | vs National | |
| 1. | Brandon | 0.85% | 17.4%(-16.6)#1 | 18.1%(-17.2)#72 |
| 2. | Worthing | 1.6% | 17.4%(-15.8)#2 | 18.1%(-16.4)#229 |
| 3. | Parkston | 2.1% | 17.4%(-15.3)#3 | 18.1%(-16.0)#380 |
| 4. | Baltic | 3.1% | 17.4%(-14.3)#4 | 18.1%(-14.9)#763 |
| 5. | Mount Vernon | 3.3% | 17.4%(-14.1)#5 | 18.1%(-14.7)#845 |
| 6. | Wakonda | 3.7% | 17.4%(-13.7)#6 | 18.1%(-14.4)#1,007 |
| 7. | Sturgis | 3.9% | 17.4%(-13.6)#7 | 18.1%(-14.2)#1,068 |
| 8. | Elk Point | 3.9% | 17.4%(-13.6)#8 | 18.1%(-14.2)#1,070 |
| 9. | Box Elder | 4.3% | 17.4%(-13.1)#9 | 18.1%(-13.7)#1,265 |
| 10. | Hazel | 4.5% | 17.4%(-12.9)#10 | 18.1%(-13.5)#1,365 |
| 11. | Florence | 4.8% | 17.4%(-12.7)#11 | 18.1%(-13.3)#1,465 |
| 12. | Meadow View Addition | 5.2% | 17.4%(-12.3)#12 | 18.1%(-12.9)#1,641 |
| 13. | Garretson | 5.6% | 17.4%(-11.9)#13 | 18.1%(-12.5)#1,802 |
| 14. | Redfield | 5.6% | 17.4%(-11.8)#14 | 18.1%(-12.5)#1,837 |
| 15. | Harrisburg | 5.6% | 17.4%(-11.8)#15 | 18.1%(-12.4)#1,843 |
| 16. | Doland | 5.9% | 17.4%(-11.6)#16 | 18.1%(-12.2)#1,948 |
| 17. | Piedmont | 6.0% | 17.4%(-11.5)#17 | 18.1%(-12.1)#1,976 |
| 18. | Clark | 6.5% | 17.4%(-11.0)#18 | 18.1%(-11.6)#2,170 |
| 19. | Plankinton | 6.5% | 17.4%(-10.9)#19 | 18.1%(-11.5)#2,202 |
| 20. | Montrose | 6.7% | 17.4%(-10.8)#20 | 18.1%(-11.4)#2,262 |
| 21. | Centerville | 7.4% | 17.4%(-10.0)#21 | 18.1%(-10.7)#2,597 |
| 22. | Lake Norden | 7.6% | 17.4%(-9.81)#22 | 18.1%(-10.4)#2,680 |
| 23. | Lennox | 8.0% | 17.4%(-9.41)#23 | 18.1%(-10.0)#2,846 |
| 24. | Tabor | 8.3% | 17.4%(-9.11)#24 | 18.1%(-9.73)#2,977 |
| 25. | Hayti | 8.3% | 17.4%(-9.11)#25 | 18.1%(-9.73)#2,979 |
| 26. | Summerset | 8.4% | 17.4%(-9.07)#26 | 18.1%(-9.69)#2,996 |
| 27. | Onida | 8.5% | 17.4%(-8.93)#27 | 18.1%(-9.55)#3,049 |
| 28. | Highmore | 8.6% | 17.4%(-8.87)#28 | 18.1%(-9.49)#3,074 |
| 29. | Howard | 8.7% | 17.4%(-8.75)#29 | 18.1%(-9.37)#3,125 |
| 30. | Tripp | 8.7% | 17.4%(-8.75)#30 | 18.1%(-9.37)#3,133 |
| 31. | Alcester | 8.8% | 17.4%(-8.67)#31 | 18.1%(-9.29)#3,160 |
| 32. | Fort Pierre | 9.2% | 17.4%(-8.27)#32 | 18.1%(-8.89)#3,342 |
| 33. | Belle Fourche | 9.2% | 17.4%(-8.26)#33 | 18.1%(-8.89)#3,344 |
| 34. | Beresford | 9.5% | 17.4%(-7.96)#34 | 18.1%(-8.58)#3,447 |
| 35. | Tyndall | 9.6% | 17.4%(-7.83)#35 | 18.1%(-8.45)#3,512 |
| 36. | North Sioux City | 9.6% | 17.4%(-7.80)#36 | 18.1%(-8.42)#3,519 |
| 37. | Marion | 10.0% | 17.4%(-7.44)#37 | 18.1%(-8.06)#3,642 |
| 38. | Gary | 10.0% | 17.4%(-7.44)#38 | 18.1%(-8.06)#3,673 |
| 39. | Pierpont | 10.0% | 17.4%(-7.44)#39 | 18.1%(-8.06)#3,678 |
| 40. | Yankton | 10.0% | 17.4%(-7.43)#40 | 18.1%(-8.05)#3,681 |
| 41. | Estelline | 10.2% | 17.4%(-7.24)#41 | 18.1%(-7.86)#3,737 |
| 42. | Timber Lake | 10.5% | 17.4%(-6.92)#42 | 18.1%(-7.54)#3,875 |
| 43. | Bruce | 10.5% | 17.4%(-6.92)#43 | 18.1%(-7.54)#3,886 |
| 44. | Gregory | 10.8% | 17.4%(-6.63)#44 | 18.1%(-7.25)#3,975 |
| 45. | Webster | 11.0% | 17.4%(-6.44)#45 | 18.1%(-7.06)#4,038 |
| 46. | Brookings | 11.1% | 17.4%(-6.34)#46 | 18.1%(-6.96)#4,066 |
| 47. | White Lake | 11.1% | 17.4%(-6.33)#47 | 18.1%(-6.95)#4,115 |
| 48. | Mellette | 11.1% | 17.4%(-6.33)#48 | 18.1%(-6.95)#4,130 |
| 49. | Spearfish | 11.6% | 17.4%(-5.89)#49 | 18.1%(-6.51)#4,288 |
| 50. | Aberdeen | 12.1% | 17.4%(-5.35)#50 | 18.1%(-5.97)#4,489 |
| 51. | Viborg | 12.5% | 17.4%(-4.94)#51 | 18.1%(-5.56)#4,618 |
| 52. | Cavour | 12.5% | 17.4%(-4.94)#52 | 18.1%(-5.56)#4,658 |
| 53. | Wentworth | 12.5% | 17.4%(-4.94)#53 | 18.1%(-5.56)#4,664 |
| 54. | Menno | 13.0% | 17.4%(-4.45)#54 | 18.1%(-5.08)#4,832 |
| 55. | Huron | 13.2% | 17.4%(-4.23)#55 | 18.1%(-4.85)#4,914 |
| 56. | Wagner | 13.3% | 17.4%(-4.11)#56 | 18.1%(-4.73)#4,946 |
| 57. | Hurley | 13.3% | 17.4%(-4.11)#57 | 18.1%(-4.73)#4,970 |
| 58. | Pierre | 13.6% | 17.4%(-3.82)#58 | 18.1%(-4.44)#5,053 |
| 59. | Sioux Falls | 14.0% | 17.4%(-3.44)#59 | 18.1%(-4.06)#5,219 |
| 60. | Canton | 14.0% | 17.4%(-3.42)#60 | 18.1%(-4.04)#5,226 |
| 61. | Agency Village | 14.3% | 17.4%(-3.16)#61 | 18.1%(-3.78)#5,320 |
| 62. | Bristol | 14.3% | 17.4%(-3.16)#62 | 18.1%(-3.78)#5,356 |
| 63. | Buffalo Gap | 14.3% | 17.4%(-3.16)#63 | 18.1%(-3.78)#5,369 |
| 64. | Chamberlain | 14.5% | 17.4%(-2.94)#64 | 18.1%(-3.56)#5,416 |
| 65. | Keystone | 14.8% | 17.4%(-2.63)#65 | 18.1%(-3.25)#5,527 |
| 66. | Blunt | 15.0% | 17.4%(-2.44)#66 | 18.1%(-3.06)#5,604 |
| 67. | Watertown | 15.3% | 17.4%(-2.13)#67 | 18.1%(-2.75)#5,682 |
| 68. | Astoria | 15.4% | 17.4%(-2.06)#68 | 18.1%(-2.68)#5,752 |
| 69. | Whitewood | 15.6% | 17.4%(-1.82)#69 | 18.1%(-2.44)#5,810 |
| 70. | Wall | 16.0% | 17.4%(-1.44)#70 | 18.1%(-2.06)#5,937 |
| 71. | Rapid City | 16.9% | 17.4%(-0.544)#71 | 18.1%(-1.17)#6,256 |
| 72. | Britton | 17.4% | 17.4%(-0.050)#72 | 18.1%(-0.671)#6,402 |
| 73. | New Effington | 17.6% | 17.4%(+0.206)#73 | 18.1%(-0.416)#6,510 |
| 74. | Mobridge | 18.0% | 17.4%(+0.548)#74 | 18.1%(-0.073)#6,614 |
| 75. | Roslyn | 18.2% | 17.4%(+0.740)#75 | 18.1%(+0.119)#6,695 |
| 76. | Roscoe | 18.8% | 17.4%(+1.31)#76 | 18.1%(+0.687)#6,875 |
| 77. | Dell Rapids | 19.2% | 17.4%(+1.81)#77 | 18.1%(+1.19)#7,018 |
| 78. | Lake Andes | 20.9% | 17.4%(+3.49)#78 | 18.1%(+2.87)#7,540 |
| 79. | New Underwood | 21.1% | 17.4%(+3.61)#79 | 18.1%(+2.99)#7,580 |
| 80. | Arlington | 21.2% | 17.4%(+3.71)#80 | 18.1%(+3.09)#7,613 |
| 81. | Scotland | 21.3% | 17.4%(+3.87)#81 | 18.1%(+3.25)#7,664 |
| 82. | Fruitdale | 21.4% | 17.4%(+3.99)#82 | 18.1%(+3.37)#7,716 |
| 83. | Hoven | 22.2% | 17.4%(+4.78)#83 | 18.1%(+4.16)#7,972 |
| 84. | Fairfax | 23.5% | 17.4%(+6.09)#84 | 18.1%(+5.47)#8,357 |
| 85. | Kennebec | 23.8% | 17.4%(+6.37)#85 | 18.1%(+5.75)#8,436 |
| 86. | Monroe | 25.0% | 17.4%(+7.56)#86 | 18.1%(+6.94)#8,805 |
| 87. | Oglala | 26.0% | 17.4%(+8.57)#87 | 18.1%(+7.95)#9,031 |
| 88. | Mclaughlin | 26.6% | 17.4%(+9.12)#88 | 18.1%(+8.50)#9,150 |
| 89. | Green Valley | 26.7% | 17.4%(+9.23)#89 | 18.1%(+8.60)#9,173 |
| 90. | Madison | 27.9% | 17.4%(+10.4)#90 | 18.1%(+9.80)#9,491 |
| 91. | Mitchell | 29.6% | 17.4%(+12.2)#91 | 18.1%(+11.6)#9,931 |
| 92. | Gettysburg | 29.9% | 17.4%(+12.4)#92 | 18.1%(+11.8)#9,976 |
| 93. | Rosholt | 30.0% | 17.4%(+12.6)#93 | 18.1%(+11.9)#10,024 |
| 94. | Midland | 30.8% | 17.4%(+13.3)#94 | 18.1%(+12.7)#10,207 |
| 95. | Armour | 31.1% | 17.4%(+13.7)#95 | 18.1%(+13.1)#10,277 |
| 96. | Vermillion | 31.4% | 17.4%(+14.0)#96 | 18.1%(+13.4)#10,334 |
| 97. | Colome | 32.4% | 17.4%(+15.0)#97 | 18.1%(+14.4)#10,519 |
| 98. | Veblen | 32.6% | 17.4%(+15.1)#98 | 18.1%(+14.5)#10,536 |
| 99. | Martin | 33.0% | 17.4%(+15.5)#99 | 18.1%(+14.9)#10,604 |
| 100. | Wolsey | 33.3% | 17.4%(+15.9)#100 | 18.1%(+15.3)#10,686 |
Common Questions
What are the Top 10 Cities with the Lowest Poverty Level Among Children Under the Age of 5 in South Dakota?
Top 10 Cities with the Lowest Poverty Level Among Children Under the Age of 5 in South Dakota are:
What city has the Lowest Poverty Level Among Children Under the Age of 5 in South Dakota?
Brandon has the Lowest Poverty Level Among Children Under the Age of 5 in South Dakota with 0.85%.
What is the Poverty Level Among Children Under the Age of 5 in the State of South Dakota?
Poverty Level Among Children Under the Age of 5 in South Dakota is 17.4%.
What is the Poverty Level Among Children Under the Age of 5 in the United States?
Poverty Level Among Children Under the Age of 5 in the United States is 18.1%.