Cities with the Lowest Poverty Level Among Children Under the Age of 5 in Tennessee
RELATED REPORTS & OPTIONS
Lowest Poverty | Child 0-5
Tennessee
Compare Cities
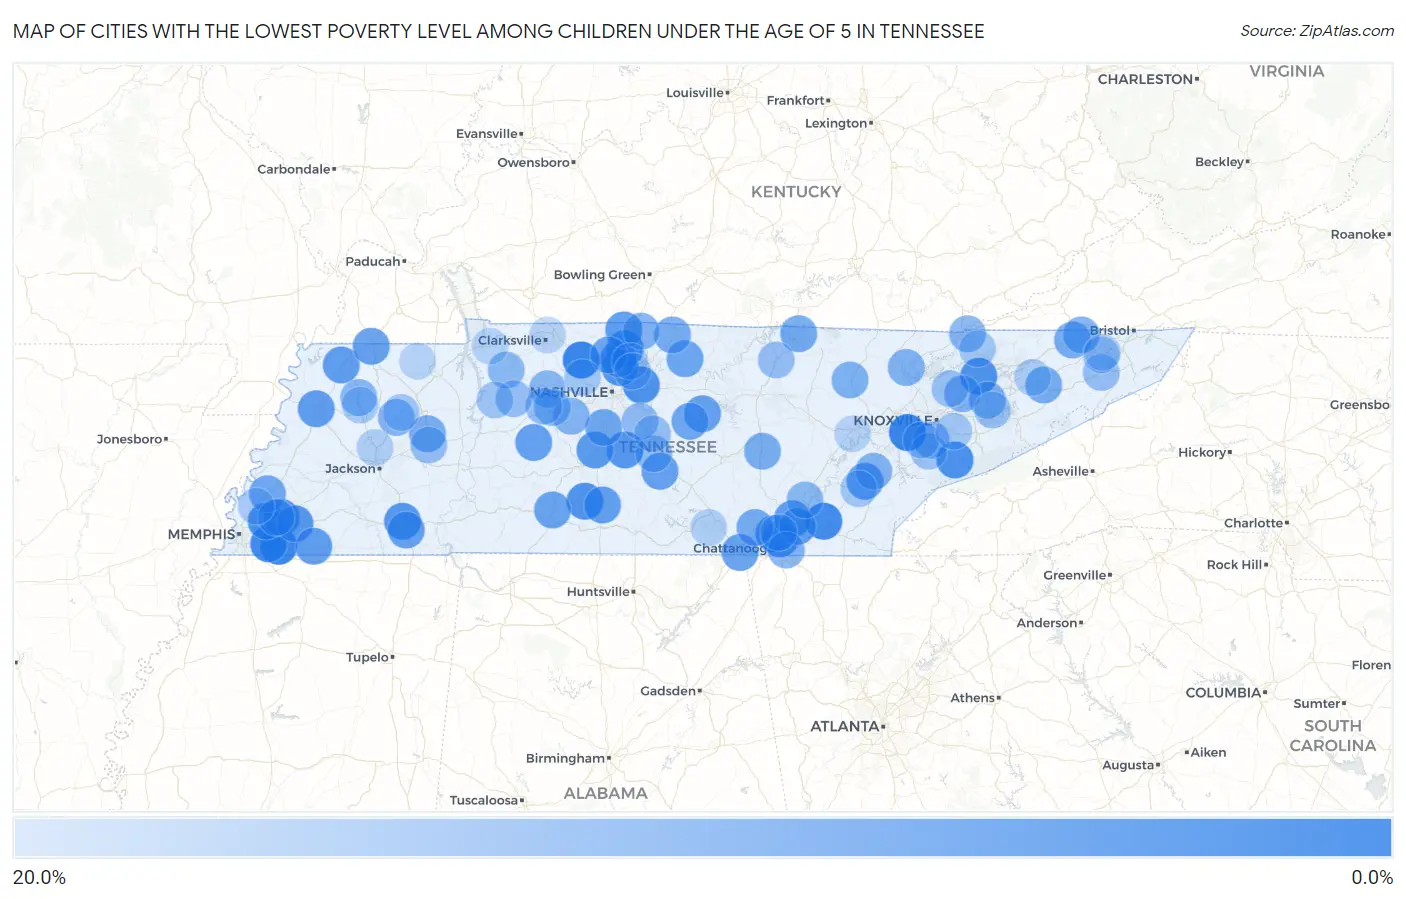
Map of Cities with the Lowest Poverty Level Among Children Under the Age of 5 in Tennessee
20.0%
0.0%
Cities with the Lowest Poverty Level Among Children Under the Age of 5 in Tennessee
| City | Child Poverty | vs State | vs National | |
| 1. | Farragut | 0.29% | 21.4%(-21.1)#1 | 18.1%(-17.8)#5 |
| 2. | Pleasant View | 0.44% | 21.4%(-21.0)#2 | 18.1%(-17.6)#18 |
| 3. | Collierville | 0.60% | 21.4%(-20.8)#3 | 18.1%(-17.5)#31 |
| 4. | Germantown | 1.6% | 21.4%(-19.8)#4 | 18.1%(-16.5)#228 |
| 5. | Hopewell | 1.6% | 21.4%(-19.8)#5 | 18.1%(-16.4)#236 |
| 6. | Bartlett | 2.7% | 21.4%(-18.7)#6 | 18.1%(-15.3)#591 |
| 7. | White House | 2.7% | 21.4%(-18.6)#7 | 18.1%(-15.3)#597 |
| 8. | Mount Juliet | 2.9% | 21.4%(-18.5)#8 | 18.1%(-15.1)#680 |
| 9. | Karns | 2.9% | 21.4%(-18.4)#9 | 18.1%(-15.1)#691 |
| 10. | Townsend | 3.0% | 21.4%(-18.4)#10 | 18.1%(-15.0)#722 |
| 11. | Lynnville | 3.3% | 21.4%(-18.1)#11 | 18.1%(-14.8)#824 |
| 12. | Arlington | 3.3% | 21.4%(-18.1)#12 | 18.1%(-14.8)#831 |
| 13. | Rutledge | 3.4% | 21.4%(-18.0)#13 | 18.1%(-14.7)#865 |
| 14. | Signal Mountain | 3.8% | 21.4%(-17.6)#14 | 18.1%(-14.3)#1,037 |
| 15. | Goodlettsville | 4.0% | 21.4%(-17.4)#15 | 18.1%(-14.1)#1,119 |
| 16. | Eagleville | 4.2% | 21.4%(-17.2)#16 | 18.1%(-13.9)#1,196 |
| 17. | Bethel Springs | 4.2% | 21.4%(-17.2)#17 | 18.1%(-13.9)#1,198 |
| 18. | Oakland | 4.3% | 21.4%(-17.1)#18 | 18.1%(-13.8)#1,243 |
| 19. | Red Bank | 4.4% | 21.4%(-17.0)#19 | 18.1%(-13.7)#1,293 |
| 20. | Spring Hill | 4.7% | 21.4%(-16.6)#20 | 18.1%(-13.3)#1,436 |
| 21. | Millersville | 4.8% | 21.4%(-16.6)#21 | 18.1%(-13.3)#1,440 |
| 22. | Orlinda | 4.9% | 21.4%(-16.5)#22 | 18.1%(-13.2)#1,516 |
| 23. | Soddy Daisy | 5.0% | 21.4%(-16.4)#23 | 18.1%(-13.0)#1,583 |
| 24. | Lakesite | 5.3% | 21.4%(-16.1)#24 | 18.1%(-12.8)#1,706 |
| 25. | Niota | 5.4% | 21.4%(-16.0)#25 | 18.1%(-12.7)#1,752 |
| 26. | Dyersburg | 5.5% | 21.4%(-15.9)#26 | 18.1%(-12.5)#1,792 |
| 27. | Moscow | 5.6% | 21.4%(-15.8)#27 | 18.1%(-12.5)#1,807 |
| 28. | Troy | 5.6% | 21.4%(-15.8)#28 | 18.1%(-12.4)#1,844 |
| 29. | Cornersville | 5.9% | 21.4%(-15.5)#29 | 18.1%(-12.2)#1,936 |
| 30. | Centerville | 6.1% | 21.4%(-15.3)#30 | 18.1%(-11.9)#2,027 |
| 31. | Bell Buckle | 6.1% | 21.4%(-15.3)#31 | 18.1%(-11.9)#2,033 |
| 32. | New Hope | 6.2% | 21.4%(-15.1)#32 | 18.1%(-11.8)#2,094 |
| 33. | Liberty | 6.2% | 21.4%(-15.1)#33 | 18.1%(-11.8)#2,106 |
| 34. | Selmer | 6.4% | 21.4%(-15.0)#34 | 18.1%(-11.6)#2,163 |
| 35. | South Fulton | 6.5% | 21.4%(-14.9)#35 | 18.1%(-11.6)#2,181 |
| 36. | Ethridge | 6.6% | 21.4%(-14.8)#36 | 18.1%(-11.5)#2,232 |
| 37. | Greenbrier | 7.1% | 21.4%(-14.3)#37 | 18.1%(-10.9)#2,470 |
| 38. | Hartsville Trousdale County | 7.3% | 21.4%(-14.1)#38 | 18.1%(-10.8)#2,545 |
| 39. | Auburntown | 7.4% | 21.4%(-14.0)#39 | 18.1%(-10.7)#2,604 |
| 40. | Franklin | 7.4% | 21.4%(-14.0)#40 | 18.1%(-10.7)#2,606 |
| 41. | Atoka | 7.7% | 21.4%(-13.7)#41 | 18.1%(-10.3)#2,735 |
| 42. | Byrdstown | 8.1% | 21.4%(-13.3)#42 | 18.1%(-9.95)#2,871 |
| 43. | Church Hill | 8.3% | 21.4%(-13.1)#43 | 18.1%(-9.73)#2,947 |
| 44. | Whitwell | 8.3% | 21.4%(-13.1)#44 | 18.1%(-9.73)#2,956 |
| 45. | Mosheim | 8.5% | 21.4%(-12.9)#45 | 18.1%(-9.59)#3,028 |
| 46. | Westmoreland | 8.7% | 21.4%(-12.7)#46 | 18.1%(-9.41)#3,105 |
| 47. | Clarksburg | 8.7% | 21.4%(-12.7)#47 | 18.1%(-9.37)#3,124 |
| 48. | Spencer | 8.9% | 21.4%(-12.5)#48 | 18.1%(-9.17)#3,204 |
| 49. | Mount Carmel | 9.4% | 21.4%(-12.0)#49 | 18.1%(-8.66)#3,426 |
| 50. | Sunbright | 9.5% | 21.4%(-11.9)#50 | 18.1%(-8.58)#3,449 |
| 51. | Jefferson City | 9.5% | 21.4%(-11.9)#51 | 18.1%(-8.56)#3,457 |
| 52. | Blaine | 9.6% | 21.4%(-11.8)#52 | 18.1%(-8.50)#3,499 |
| 53. | Jacksboro | 9.8% | 21.4%(-11.6)#53 | 18.1%(-8.28)#3,573 |
| 54. | Portland | 9.8% | 21.4%(-11.6)#54 | 18.1%(-8.27)#3,576 |
| 55. | Sweetwater | 10.0% | 21.4%(-11.4)#55 | 18.1%(-8.10)#3,616 |
| 56. | Alcoa | 10.0% | 21.4%(-11.4)#56 | 18.1%(-8.06)#3,621 |
| 57. | Powell | 10.1% | 21.4%(-11.3)#57 | 18.1%(-7.95)#3,707 |
| 58. | Fairview | 10.1% | 21.4%(-11.2)#58 | 18.1%(-7.92)#3,716 |
| 59. | Ridgeside | 10.1% | 21.4%(-11.2)#59 | 18.1%(-7.92)#3,719 |
| 60. | Harrogate | 10.2% | 21.4%(-11.2)#60 | 18.1%(-7.83)#3,746 |
| 61. | Atwood | 10.3% | 21.4%(-11.1)#61 | 18.1%(-7.78)#3,770 |
| 62. | Lakeland | 10.3% | 21.4%(-11.1)#62 | 18.1%(-7.73)#3,787 |
| 63. | Rutherford | 10.6% | 21.4%(-10.8)#63 | 18.1%(-7.49)#3,898 |
| 64. | Charlotte | 10.8% | 21.4%(-10.6)#64 | 18.1%(-7.23)#3,983 |
| 65. | Sale Creek | 11.1% | 21.4%(-10.3)#65 | 18.1%(-6.95)#4,071 |
| 66. | Erin | 11.1% | 21.4%(-10.3)#66 | 18.1%(-6.95)#4,077 |
| 67. | Burns | 11.6% | 21.4%(-9.78)#67 | 18.1%(-6.45)#4,307 |
| 68. | Christiana | 11.8% | 21.4%(-9.58)#68 | 18.1%(-6.26)#4,387 |
| 69. | Smyrna | 11.9% | 21.4%(-9.48)#69 | 18.1%(-6.15)#4,420 |
| 70. | Jonesborough | 12.3% | 21.4%(-9.08)#70 | 18.1%(-5.76)#4,551 |
| 71. | Dickson | 12.4% | 21.4%(-8.99)#71 | 18.1%(-5.66)#4,578 |
| 72. | Livingston | 12.5% | 21.4%(-8.89)#72 | 18.1%(-5.56)#4,597 |
| 73. | Mcewen | 12.5% | 21.4%(-8.89)#73 | 18.1%(-5.56)#4,601 |
| 74. | Parker S Crossroads | 12.5% | 21.4%(-8.89)#74 | 18.1%(-5.56)#4,628 |
| 75. | Murfreesboro | 12.8% | 21.4%(-8.62)#75 | 18.1%(-5.30)#4,736 |
| 76. | Plainview | 12.9% | 21.4%(-8.53)#76 | 18.1%(-5.21)#4,781 |
| 77. | Maryville | 13.2% | 21.4%(-8.22)#77 | 18.1%(-4.89)#4,904 |
| 78. | Dandridge | 13.6% | 21.4%(-7.75)#78 | 18.1%(-4.43)#5,059 |
| 79. | Louisville | 13.8% | 21.4%(-7.63)#79 | 18.1%(-4.31)#5,115 |
| 80. | Waverly | 13.9% | 21.4%(-7.49)#80 | 18.1%(-4.16)#5,175 |
| 81. | Athens | 14.0% | 21.4%(-7.43)#81 | 18.1%(-4.10)#5,204 |
| 82. | Trezevant | 14.2% | 21.4%(-7.20)#82 | 18.1%(-3.87)#5,275 |
| 83. | Seymour | 14.2% | 21.4%(-7.17)#83 | 18.1%(-3.85)#5,286 |
| 84. | Gray | 14.3% | 21.4%(-7.10)#84 | 18.1%(-3.78)#5,311 |
| 85. | Ashland City | 14.4% | 21.4%(-7.00)#85 | 18.1%(-3.67)#5,389 |
| 86. | Tazewell | 14.4% | 21.4%(-6.99)#86 | 18.1%(-3.66)#5,391 |
| 87. | Dyer | 15.0% | 21.4%(-6.42)#87 | 18.1%(-3.09)#5,571 |
| 88. | Millington | 15.1% | 21.4%(-6.26)#88 | 18.1%(-2.94)#5,634 |
| 89. | Bulls Gap | 15.4% | 21.4%(-6.01)#89 | 18.1%(-2.68)#5,716 |
| 90. | Sewanee | 15.8% | 21.4%(-5.60)#90 | 18.1%(-2.27)#5,853 |
| 91. | Three Way | 15.8% | 21.4%(-5.60)#91 | 18.1%(-2.27)#5,855 |
| 92. | Shackle Island | 16.0% | 21.4%(-5.35)#92 | 18.1%(-2.03)#5,948 |
| 93. | Hendersonville | 16.1% | 21.4%(-5.33)#93 | 18.1%(-2.00)#5,955 |
| 94. | Walden | 16.1% | 21.4%(-5.32)#94 | 18.1%(-1.99)#5,957 |
| 95. | Lynchburg | 16.3% | 21.4%(-5.08)#95 | 18.1%(-1.75)#6,028 |
| 96. | Spurgeon | 16.4% | 21.4%(-4.96)#96 | 18.1%(-1.63)#6,070 |
| 97. | Dover | 16.7% | 21.4%(-4.72)#97 | 18.1%(-1.40)#6,137 |
| 98. | Cottage Grove | 16.7% | 21.4%(-4.72)#98 | 18.1%(-1.40)#6,205 |
| 99. | Rockwood | 16.8% | 21.4%(-4.59)#99 | 18.1%(-1.26)#6,233 |
| 100. | Clarksville | 16.9% | 21.4%(-4.53)#100 | 18.1%(-1.21)#6,245 |
Common Questions
What are the Top 10 Cities with the Lowest Poverty Level Among Children Under the Age of 5 in Tennessee?
Top 10 Cities with the Lowest Poverty Level Among Children Under the Age of 5 in Tennessee are:
#1
0.29%
#2
0.44%
#3
0.60%
#4
1.6%
#5
1.6%
#6
2.7%
#7
2.7%
#8
2.9%
#9
3.0%
#10
3.3%
What city has the Lowest Poverty Level Among Children Under the Age of 5 in Tennessee?
Farragut has the Lowest Poverty Level Among Children Under the Age of 5 in Tennessee with 0.29%.
What is the Poverty Level Among Children Under the Age of 5 in the State of Tennessee?
Poverty Level Among Children Under the Age of 5 in Tennessee is 21.4%.
What is the Poverty Level Among Children Under the Age of 5 in the United States?
Poverty Level Among Children Under the Age of 5 in the United States is 18.1%.