Cities with the Lowest Poverty Level Among Children Under the Age of 5 in Montana
RELATED REPORTS & OPTIONS
Lowest Poverty | Child 0-5
Montana
Compare Cities
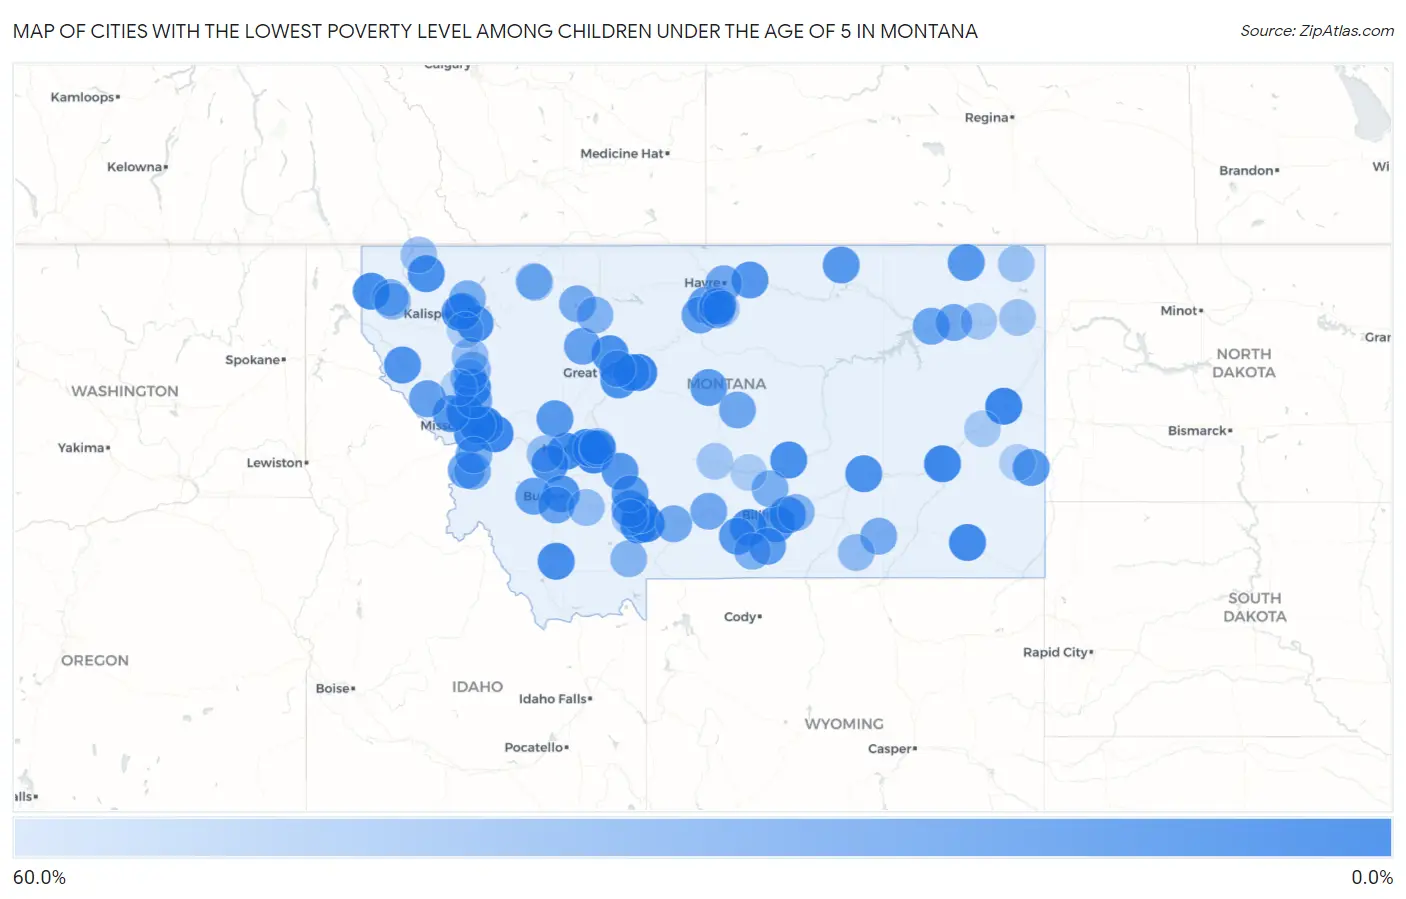
Map of Cities with the Lowest Poverty Level Among Children Under the Age of 5 in Montana
60.0%
0.0%
Cities with the Lowest Poverty Level Among Children Under the Age of 5 in Montana
| City | Child Poverty | vs State | vs National | |
| 1. | Four Corners | 4.0% | 16.3%(-12.3)#1 | 18.1%(-14.1)#1,116 |
| 2. | Montana City | 4.2% | 16.3%(-12.1)#2 | 18.1%(-13.9)#1,219 |
| 3. | St Ignatius | 5.6% | 16.3%(-10.7)#3 | 18.1%(-12.5)#1,805 |
| 4. | West Glendive | 5.6% | 16.3%(-10.7)#4 | 18.1%(-12.5)#1,833 |
| 5. | Frenchtown | 5.6% | 16.3%(-10.6)#5 | 18.1%(-12.4)#1,852 |
| 6. | Clinton | 6.0% | 16.3%(-10.3)#6 | 18.1%(-12.1)#1,984 |
| 7. | Malmstrom Afb | 6.2% | 16.3%(-10.1)#7 | 18.1%(-11.8)#2,071 |
| 8. | Miles City | 7.1% | 16.3%(-9.21)#8 | 18.1%(-11.0)#2,448 |
| 9. | Bozeman | 7.7% | 16.3%(-8.53)#9 | 18.1%(-10.3)#2,741 |
| 10. | Helena West Side | 8.3% | 16.3%(-7.94)#10 | 18.1%(-9.73)#2,958 |
| 11. | Broadus | 8.7% | 16.3%(-7.58)#11 | 18.1%(-9.37)#3,134 |
| 12. | East Missoula | 9.0% | 16.3%(-7.32)#12 | 18.1%(-9.11)#3,229 |
| 13. | Elliston | 9.1% | 16.3%(-7.18)#13 | 18.1%(-8.97)#3,313 |
| 14. | Lolo | 9.7% | 16.3%(-6.54)#14 | 18.1%(-8.33)#3,555 |
| 15. | Dillon | 10.2% | 16.3%(-6.06)#15 | 18.1%(-7.84)#3,742 |
| 16. | Kalispell | 10.3% | 16.3%(-5.94)#16 | 18.1%(-7.73)#3,786 |
| 17. | Troy | 10.3% | 16.3%(-5.93)#17 | 18.1%(-7.72)#3,793 |
| 18. | Helena | 10.4% | 16.3%(-5.84)#18 | 18.1%(-7.62)#3,823 |
| 19. | Bigfork | 10.5% | 16.3%(-5.75)#19 | 18.1%(-7.54)#3,855 |
| 20. | Bonner West Riverside | 10.8% | 16.3%(-5.49)#20 | 18.1%(-7.28)#3,970 |
| 21. | Roundup | 10.9% | 16.3%(-5.34)#21 | 18.1%(-7.13)#4,016 |
| 22. | Belgrade | 11.1% | 16.3%(-5.16)#22 | 18.1%(-6.95)#4,067 |
| 23. | Trego | 11.1% | 16.3%(-5.16)#23 | 18.1%(-6.95)#4,092 |
| 24. | Laurel | 11.3% | 16.3%(-4.96)#24 | 18.1%(-6.75)#4,189 |
| 25. | Power | 12.5% | 16.3%(-3.78)#25 | 18.1%(-5.56)#4,657 |
| 26. | Columbus | 12.9% | 16.3%(-3.37)#26 | 18.1%(-5.16)#4,801 |
| 27. | Deer Lodge | 12.9% | 16.3%(-3.33)#27 | 18.1%(-5.12)#4,819 |
| 28. | Ulm | 13.3% | 16.3%(-2.94)#28 | 18.1%(-4.73)#4,953 |
| 29. | Hysham | 13.3% | 16.3%(-2.94)#29 | 18.1%(-4.73)#4,975 |
| 30. | Thompson Falls | 13.9% | 16.3%(-2.39)#30 | 18.1%(-4.17)#5,162 |
| 31. | East Helena | 13.9% | 16.3%(-2.37)#31 | 18.1%(-4.16)#5,177 |
| 32. | Missoula | 14.6% | 16.3%(-1.72)#32 | 18.1%(-3.51)#5,433 |
| 33. | Walkerville | 15.4% | 16.3%(-0.891)#33 | 18.1%(-2.68)#5,725 |
| 34. | Billings | 15.4% | 16.3%(-0.846)#34 | 18.1%(-2.63)#5,759 |
| 35. | Manhattan | 16.3% | 16.3%(+0.029)#35 | 18.1%(-1.76)#6,027 |
| 36. | Chinook | 17.1% | 16.3%(+0.867)#36 | 18.1%(-0.920)#6,324 |
| 37. | Townsend | 17.2% | 16.3%(+0.966)#37 | 18.1%(-0.821)#6,350 |
| 38. | Lincoln | 17.2% | 16.3%(+0.966)#38 | 18.1%(-0.821)#6,352 |
| 39. | Absarokee | 17.4% | 16.3%(+1.12)#39 | 18.1%(-0.671)#6,405 |
| 40. | Scobey | 17.6% | 16.3%(+1.37)#40 | 18.1%(-0.416)#6,493 |
| 41. | Whitewater | 17.6% | 16.3%(+1.37)#41 | 18.1%(-0.416)#6,512 |
| 42. | Alberton | 17.9% | 16.3%(+1.67)#42 | 18.1%(-0.114)#6,599 |
| 43. | Baker | 19.0% | 16.3%(+2.71)#43 | 18.1%(+0.925)#6,930 |
| 44. | Ponderosa Pines | 19.4% | 16.3%(+3.08)#44 | 18.1%(+1.29)#7,045 |
| 45. | Denton | 20.0% | 16.3%(+3.72)#45 | 18.1%(+1.94)#7,291 |
| 46. | Great Falls | 20.4% | 16.3%(+4.15)#46 | 18.1%(+2.36)#7,397 |
| 47. | Fromberg | 20.8% | 16.3%(+4.56)#47 | 18.1%(+2.77)#7,520 |
| 48. | Rocky Boy West | 21.0% | 16.3%(+4.71)#48 | 18.1%(+2.92)#7,557 |
| 49. | Anaconda Deer Lodge County | 22.7% | 16.3%(+6.40)#49 | 18.1%(+4.61)#8,111 |
| 50. | Azure | 22.9% | 16.3%(+6.58)#50 | 18.1%(+4.79)#8,157 |
| 51. | Choteau | 24.0% | 16.3%(+7.69)#51 | 18.1%(+5.90)#8,466 |
| 52. | Superior | 24.1% | 16.3%(+7.80)#52 | 18.1%(+6.01)#8,505 |
| 53. | Big Sandy | 24.2% | 16.3%(+7.97)#53 | 18.1%(+6.18)#8,551 |
| 54. | Butte Silver Bow Balance | 25.7% | 16.3%(+9.43)#54 | 18.1%(+7.64)#8,956 |
| 55. | Pinesdale | 25.9% | 16.3%(+9.61)#55 | 18.1%(+7.82)#8,999 |
| 56. | Frazer | 27.1% | 16.3%(+10.8)#56 | 18.1%(+9.06)#9,291 |
| 57. | Lewistown | 27.3% | 16.3%(+11.0)#57 | 18.1%(+9.21)#9,309 |
| 58. | Vaughn | 27.3% | 16.3%(+11.0)#58 | 18.1%(+9.21)#9,321 |
| 59. | Havre | 27.8% | 16.3%(+11.5)#59 | 18.1%(+9.69)#9,453 |
| 60. | St Pierre | 27.9% | 16.3%(+11.6)#60 | 18.1%(+9.84)#9,505 |
| 61. | Wolf Point | 28.5% | 16.3%(+12.2)#61 | 18.1%(+10.5)#9,631 |
| 62. | Big Timber | 28.9% | 16.3%(+12.6)#62 | 18.1%(+10.8)#9,753 |
| 63. | Arlee | 29.7% | 16.3%(+13.5)#63 | 18.1%(+11.7)#9,951 |
| 64. | Livingston | 30.0% | 16.3%(+13.7)#64 | 18.1%(+11.9)#10,001 |
| 65. | Evergreen | 30.2% | 16.3%(+13.9)#65 | 18.1%(+12.2)#10,074 |
| 66. | Corvallis | 30.5% | 16.3%(+14.2)#66 | 18.1%(+12.4)#10,137 |
| 67. | Valier | 31.2% | 16.3%(+15.0)#67 | 18.1%(+13.2)#10,296 |
| 68. | Busby | 31.2% | 16.3%(+15.0)#68 | 18.1%(+13.2)#10,297 |
| 69. | Broadview | 33.3% | 16.3%(+17.1)#69 | 18.1%(+15.3)#10,762 |
| 70. | Columbia Falls | 33.6% | 16.3%(+17.3)#70 | 18.1%(+15.5)#10,811 |
| 71. | Stevensville | 34.6% | 16.3%(+18.3)#71 | 18.1%(+16.5)#10,975 |
| 72. | Libby | 35.1% | 16.3%(+18.8)#72 | 18.1%(+17.0)#11,061 |
| 73. | Roberts | 35.3% | 16.3%(+19.0)#73 | 18.1%(+17.2)#11,104 |
| 74. | Sangrey | 35.4% | 16.3%(+19.1)#74 | 18.1%(+17.4)#11,132 |
| 75. | Ronan | 36.4% | 16.3%(+20.2)#75 | 18.1%(+18.4)#11,340 |
| 76. | Lockwood | 36.7% | 16.3%(+20.4)#76 | 18.1%(+18.6)#11,377 |
| 77. | Conrad | 37.0% | 16.3%(+20.7)#77 | 18.1%(+18.9)#11,423 |
| 78. | Big Sky | 37.8% | 16.3%(+21.5)#78 | 18.1%(+19.7)#11,569 |
| 79. | White Haven | 39.2% | 16.3%(+22.9)#79 | 18.1%(+21.2)#11,801 |
| 80. | Charlo | 41.2% | 16.3%(+24.9)#80 | 18.1%(+23.1)#12,133 |
| 81. | Lodge Grass | 41.9% | 16.3%(+25.7)#81 | 18.1%(+23.9)#12,238 |
| 82. | Whitehall | 43.1% | 16.3%(+26.9)#82 | 18.1%(+25.1)#12,419 |
| 83. | Browning | 43.5% | 16.3%(+27.2)#83 | 18.1%(+25.4)#12,456 |
| 84. | Garrison | 43.8% | 16.3%(+27.5)#84 | 18.1%(+25.7)#12,513 |
| 85. | Polson | 44.9% | 16.3%(+28.6)#85 | 18.1%(+26.8)#12,675 |
| 86. | Eureka | 46.1% | 16.3%(+29.8)#86 | 18.1%(+28.0)#12,818 |
| 87. | Helena Valley Southeast | 46.4% | 16.3%(+30.1)#87 | 18.1%(+28.3)#12,871 |
| 88. | Plentywood | 46.8% | 16.3%(+30.5)#88 | 18.1%(+28.7)#12,930 |
| 89. | Parker School | 48.4% | 16.3%(+32.2)#89 | 18.1%(+30.4)#13,127 |
| 90. | Culbertson | 48.8% | 16.3%(+32.5)#90 | 18.1%(+30.7)#13,162 |
| 91. | North Browning | 49.6% | 16.3%(+33.3)#91 | 18.1%(+31.5)#13,226 |
| 92. | Harlowton | 50.0% | 16.3%(+33.7)#92 | 18.1%(+31.9)#13,283 |
| 93. | Poplar | 50.0% | 16.3%(+33.7)#93 | 18.1%(+31.9)#13,291 |
| 94. | Amsterdam | 50.0% | 16.3%(+33.7)#94 | 18.1%(+31.9)#13,404 |
| 95. | Fallon | 52.3% | 16.3%(+36.0)#95 | 18.1%(+34.2)#13,621 |
| 96. | Ryegate | 54.5% | 16.3%(+38.3)#96 | 18.1%(+36.5)#13,830 |
| 97. | Lakeside | 54.8% | 16.3%(+38.5)#97 | 18.1%(+36.7)#13,846 |
| 98. | Plevna | 55.6% | 16.3%(+39.3)#98 | 18.1%(+37.5)#13,919 |
| 99. | Dixon | 56.2% | 16.3%(+40.0)#99 | 18.1%(+38.2)#13,988 |
| 100. | Pine Creek | 58.8% | 16.3%(+42.5)#100 | 18.1%(+40.8)#14,215 |
Common Questions
What are the Top 10 Cities with the Lowest Poverty Level Among Children Under the Age of 5 in Montana?
Top 10 Cities with the Lowest Poverty Level Among Children Under the Age of 5 in Montana are:
#1
4.0%
#2
4.2%
#3
5.6%
#4
5.6%
#5
5.6%
#6
6.0%
#7
6.2%
#8
7.1%
#9
7.7%
#10
8.3%
What city has the Lowest Poverty Level Among Children Under the Age of 5 in Montana?
Four Corners has the Lowest Poverty Level Among Children Under the Age of 5 in Montana with 4.0%.
What is the Poverty Level Among Children Under the Age of 5 in the State of Montana?
Poverty Level Among Children Under the Age of 5 in Montana is 16.3%.
What is the Poverty Level Among Children Under the Age of 5 in the United States?
Poverty Level Among Children Under the Age of 5 in the United States is 18.1%.