Cities with the Lowest Poverty Level Among Children Under the Age of 5 in Missouri
RELATED REPORTS & OPTIONS
Lowest Poverty | Child 0-5
Missouri
Compare Cities
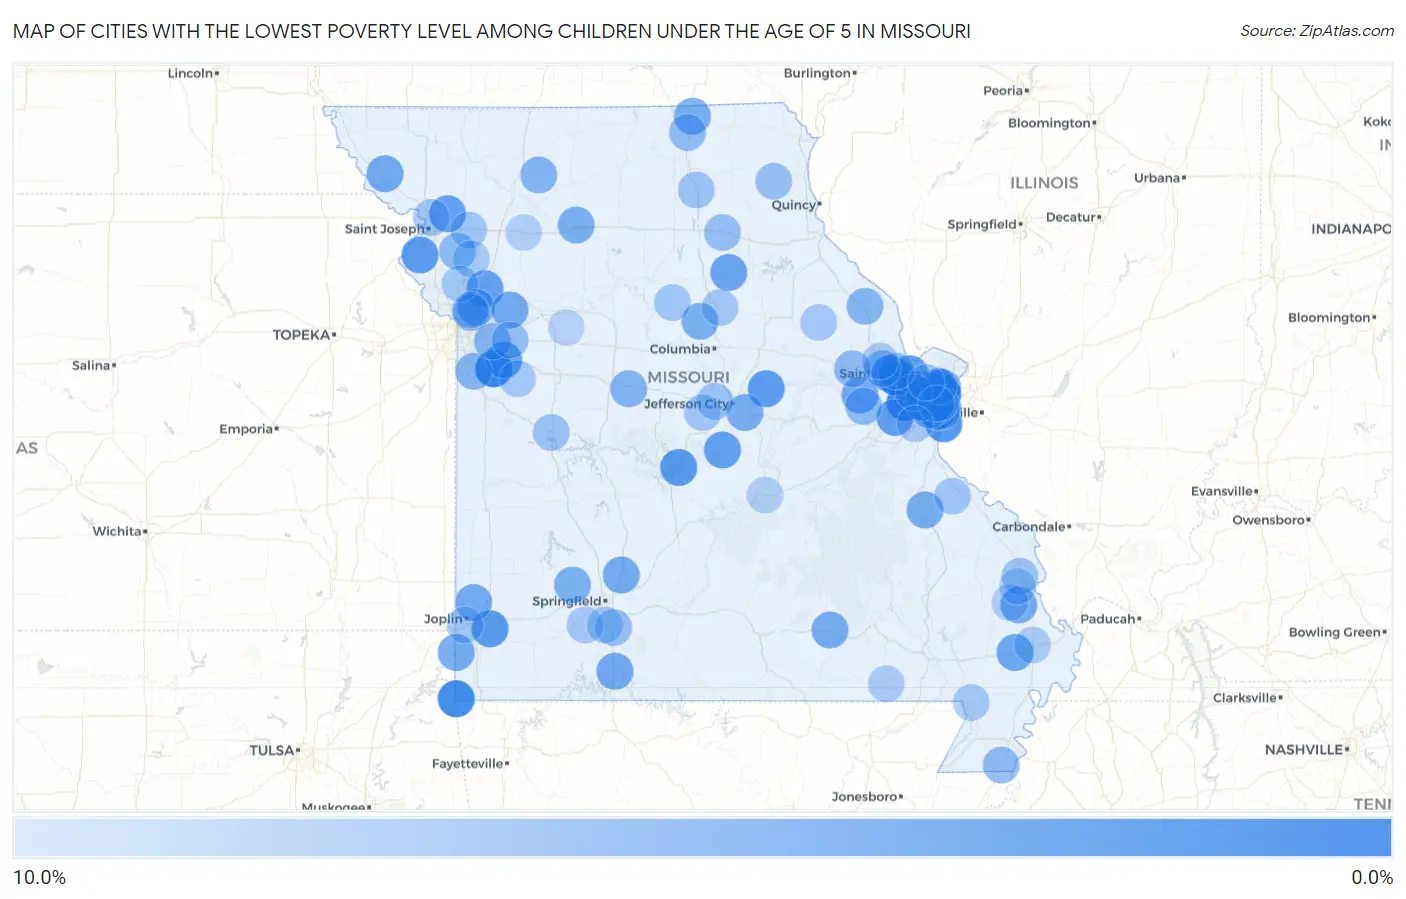
Map of Cities with the Lowest Poverty Level Among Children Under the Age of 5 in Missouri
10.0%
0.0%
Cities with the Lowest Poverty Level Among Children Under the Age of 5 in Missouri
| City | Child Poverty | vs State | vs National | |
| 1. | Wildwood | 0.60% | 18.4%(-17.8)#1 | 18.1%(-17.5)#30 |
| 2. | Pleasant Hill | 0.65% | 18.4%(-17.8)#2 | 18.1%(-17.4)#36 |
| 3. | Richmond Heights | 0.82% | 18.4%(-17.6)#3 | 18.1%(-17.2)#66 |
| 4. | Affton | 1.3% | 18.4%(-17.1)#4 | 18.1%(-16.8)#155 |
| 5. | Southwest City | 1.4% | 18.4%(-17.1)#5 | 18.1%(-16.7)#170 |
| 6. | Kirkwood | 1.4% | 18.4%(-17.0)#6 | 18.1%(-16.7)#176 |
| 7. | Ballwin | 1.4% | 18.4%(-17.0)#7 | 18.1%(-16.7)#179 |
| 8. | Lake St Louis | 1.7% | 18.4%(-16.7)#8 | 18.1%(-16.3)#257 |
| 9. | Ellisville | 1.8% | 18.4%(-16.7)#9 | 18.1%(-16.3)#276 |
| 10. | Dardenne Prairie | 1.9% | 18.4%(-16.5)#10 | 18.1%(-16.2)#302 |
| 11. | Clayton | 2.0% | 18.4%(-16.4)#11 | 18.1%(-16.0)#352 |
| 12. | Olivette | 2.1% | 18.4%(-16.3)#12 | 18.1%(-16.0)#382 |
| 13. | Oakville | 2.3% | 18.4%(-16.1)#13 | 18.1%(-15.8)#445 |
| 14. | Concord | 2.4% | 18.4%(-16.1)#14 | 18.1%(-15.7)#463 |
| 15. | Creve Coeur | 2.8% | 18.4%(-15.6)#15 | 18.1%(-15.3)#616 |
| 16. | Osage Beach | 2.8% | 18.4%(-15.6)#16 | 18.1%(-15.3)#621 |
| 17. | Diamond | 2.8% | 18.4%(-15.6)#17 | 18.1%(-15.2)#630 |
| 18. | De Kalb | 2.9% | 18.4%(-15.5)#18 | 18.1%(-15.2)#670 |
| 19. | Mokane | 2.9% | 18.4%(-15.5)#19 | 18.1%(-15.1)#686 |
| 20. | Pacific | 3.3% | 18.4%(-15.1)#20 | 18.1%(-14.8)#832 |
| 21. | Green Park | 3.3% | 18.4%(-15.1)#21 | 18.1%(-14.8)#833 |
| 22. | Lone Jack | 3.4% | 18.4%(-15.1)#22 | 18.1%(-14.7)#856 |
| 23. | Sappington | 3.4% | 18.4%(-15.0)#23 | 18.1%(-14.7)#857 |
| 24. | St Elizabeth | 3.4% | 18.4%(-15.0)#24 | 18.1%(-14.7)#870 |
| 25. | St Peters | 3.4% | 18.4%(-15.0)#25 | 18.1%(-14.6)#879 |
| 26. | Cosby | 3.4% | 18.4%(-15.0)#26 | 18.1%(-14.6)#894 |
| 27. | Kearney | 3.5% | 18.4%(-14.9)#27 | 18.1%(-14.6)#904 |
| 28. | Madison | 3.7% | 18.4%(-14.7)#28 | 18.1%(-14.4)#1,006 |
| 29. | Crestwood | 3.8% | 18.4%(-14.6)#29 | 18.1%(-14.3)#1,046 |
| 30. | Liberty | 4.0% | 18.4%(-14.4)#30 | 18.1%(-14.1)#1,138 |
| 31. | Town And Country | 4.0% | 18.4%(-14.4)#31 | 18.1%(-14.0)#1,144 |
| 32. | Morehouse | 4.1% | 18.4%(-14.3)#32 | 18.1%(-14.0)#1,156 |
| 33. | Bull Creek | 4.3% | 18.4%(-14.2)#33 | 18.1%(-13.8)#1,238 |
| 34. | Mound City | 4.3% | 18.4%(-14.1)#34 | 18.1%(-13.8)#1,248 |
| 35. | Marthasville | 4.3% | 18.4%(-14.1)#35 | 18.1%(-13.8)#1,255 |
| 36. | Orrick | 4.4% | 18.4%(-14.0)#36 | 18.1%(-13.7)#1,295 |
| 37. | Seneca | 4.5% | 18.4%(-14.0)#37 | 18.1%(-13.6)#1,319 |
| 38. | Fair Grove | 4.5% | 18.4%(-13.9)#38 | 18.1%(-13.6)#1,330 |
| 39. | Chaffee | 4.5% | 18.4%(-13.9)#39 | 18.1%(-13.5)#1,339 |
| 40. | Oronogo | 4.5% | 18.4%(-13.9)#40 | 18.1%(-13.5)#1,349 |
| 41. | Fenton | 4.6% | 18.4%(-13.8)#41 | 18.1%(-13.5)#1,382 |
| 42. | Leadington | 4.8% | 18.4%(-13.7)#42 | 18.1%(-13.3)#1,448 |
| 43. | Winona | 4.8% | 18.4%(-13.7)#43 | 18.1%(-13.3)#1,450 |
| 44. | Hanley Hills | 4.8% | 18.4%(-13.6)#44 | 18.1%(-13.2)#1,496 |
| 45. | Taos | 4.9% | 18.4%(-13.5)#45 | 18.1%(-13.2)#1,515 |
| 46. | Lancaster | 4.9% | 18.4%(-13.5)#46 | 18.1%(-13.2)#1,521 |
| 47. | Manchester | 5.0% | 18.4%(-13.5)#47 | 18.1%(-13.1)#1,554 |
| 48. | Chillicothe | 5.0% | 18.4%(-13.4)#48 | 18.1%(-13.1)#1,558 |
| 49. | Harrisburg | 5.0% | 18.4%(-13.4)#49 | 18.1%(-13.1)#1,575 |
| 50. | Ash Grove | 5.1% | 18.4%(-13.3)#50 | 18.1%(-12.9)#1,638 |
| 51. | Webster Groves | 5.2% | 18.4%(-13.2)#51 | 18.1%(-12.9)#1,660 |
| 52. | Overland | 5.4% | 18.4%(-13.1)#52 | 18.1%(-12.7)#1,731 |
| 53. | Claycomo | 5.4% | 18.4%(-13.0)#53 | 18.1%(-12.7)#1,734 |
| 54. | Chesterfield | 5.5% | 18.4%(-13.0)#54 | 18.1%(-12.6)#1,766 |
| 55. | Smithton | 5.6% | 18.4%(-12.9)#55 | 18.1%(-12.5)#1,812 |
| 56. | Gilman City | 5.6% | 18.4%(-12.9)#56 | 18.1%(-12.5)#1,815 |
| 57. | Raymore | 5.7% | 18.4%(-12.7)#57 | 18.1%(-12.4)#1,883 |
| 58. | Eolia | 5.7% | 18.4%(-12.7)#58 | 18.1%(-12.3)#1,893 |
| 59. | Blue Springs | 5.8% | 18.4%(-12.6)#59 | 18.1%(-12.2)#1,920 |
| 60. | O Fallon | 5.9% | 18.4%(-12.5)#60 | 18.1%(-12.1)#1,959 |
| 61. | Oakland | 6.0% | 18.4%(-12.4)#61 | 18.1%(-12.1)#1,983 |
| 62. | Wentzville | 6.0% | 18.4%(-12.4)#62 | 18.1%(-12.0)#1,999 |
| 63. | Gower | 6.1% | 18.4%(-12.3)#63 | 18.1%(-12.0)#2,015 |
| 64. | Washington | 6.1% | 18.4%(-12.3)#64 | 18.1%(-11.9)#2,038 |
| 65. | Truesdale | 6.2% | 18.4%(-12.2)#65 | 18.1%(-11.8)#2,093 |
| 66. | Cooter | 6.2% | 18.4%(-12.2)#66 | 18.1%(-11.8)#2,107 |
| 67. | Queen City | 6.4% | 18.4%(-12.1)#67 | 18.1%(-11.7)#2,141 |
| 68. | Ozark | 6.8% | 18.4%(-11.6)#68 | 18.1%(-11.3)#2,327 |
| 69. | Clarence | 6.8% | 18.4%(-11.6)#69 | 18.1%(-11.2)#2,337 |
| 70. | Oak Grove | 6.8% | 18.4%(-11.6)#70 | 18.1%(-11.2)#2,339 |
| 71. | Lewistown | 6.9% | 18.4%(-11.5)#71 | 18.1%(-11.2)#2,378 |
| 72. | Jackson | 7.1% | 18.4%(-11.3)#72 | 18.1%(-11.0)#2,461 |
| 73. | Clinton | 7.1% | 18.4%(-11.3)#73 | 18.1%(-11.0)#2,464 |
| 74. | La Plata | 7.2% | 18.4%(-11.2)#74 | 18.1%(-10.8)#2,528 |
| 75. | St Martins | 7.3% | 18.4%(-11.1)#75 | 18.1%(-10.7)#2,554 |
| 76. | Russellville | 7.5% | 18.4%(-11.0)#76 | 18.1%(-10.6)#2,617 |
| 77. | Stewartsville | 7.5% | 18.4%(-11.0)#77 | 18.1%(-10.6)#2,619 |
| 78. | Grayhawk | 7.5% | 18.4%(-10.9)#78 | 18.1%(-10.6)#2,635 |
| 79. | Armstrong | 7.5% | 18.4%(-10.9)#79 | 18.1%(-10.6)#2,640 |
| 80. | Country Club | 7.5% | 18.4%(-10.9)#80 | 18.1%(-10.6)#2,642 |
| 81. | Shoal Creek Drive | 7.5% | 18.4%(-10.9)#81 | 18.1%(-10.5)#2,651 |
| 82. | Plattsburg | 7.7% | 18.4%(-10.7)#82 | 18.1%(-10.4)#2,703 |
| 83. | Campbell | 7.7% | 18.4%(-10.7)#83 | 18.1%(-10.4)#2,707 |
| 84. | Kingsville | 7.7% | 18.4%(-10.7)#84 | 18.1%(-10.4)#2,726 |
| 85. | Middletown | 7.7% | 18.4%(-10.7)#85 | 18.1%(-10.4)#2,730 |
| 86. | Sturgeon | 7.8% | 18.4%(-10.6)#86 | 18.1%(-10.3)#2,754 |
| 87. | Clever | 7.8% | 18.4%(-10.6)#87 | 18.1%(-10.3)#2,755 |
| 88. | Smithville | 7.8% | 18.4%(-10.6)#88 | 18.1%(-10.3)#2,765 |
| 89. | Nixa | 7.8% | 18.4%(-10.6)#89 | 18.1%(-10.2)#2,776 |
| 90. | Flint Hill | 7.9% | 18.4%(-10.5)#90 | 18.1%(-10.2)#2,796 |
| 91. | Maryland Heights | 7.9% | 18.4%(-10.5)#91 | 18.1%(-10.1)#2,805 |
| 92. | Byrnes Mill | 8.0% | 18.4%(-10.4)#92 | 18.1%(-10.1)#2,815 |
| 93. | Doniphan | 8.0% | 18.4%(-10.4)#93 | 18.1%(-10.1)#2,830 |
| 94. | Miner | 8.1% | 18.4%(-10.3)#94 | 18.1%(-9.95)#2,874 |
| 95. | Delta | 8.2% | 18.4%(-10.3)#95 | 18.1%(-9.90)#2,897 |
| 96. | Pleasant Valley | 8.3% | 18.4%(-10.1)#96 | 18.1%(-9.73)#2,952 |
| 97. | Gordonville | 8.3% | 18.4%(-10.1)#97 | 18.1%(-9.73)#2,968 |
| 98. | Hamilton | 8.4% | 18.4%(-10.0)#98 | 18.1%(-9.66)#3,005 |
| 99. | Doolittle | 8.5% | 18.4%(-9.90)#99 | 18.1%(-9.55)#3,045 |
| 100. | Corder | 8.9% | 18.4%(-9.55)#100 | 18.1%(-9.20)#3,192 |
Common Questions
What are the Top 10 Cities with the Lowest Poverty Level Among Children Under the Age of 5 in Missouri?
Top 10 Cities with the Lowest Poverty Level Among Children Under the Age of 5 in Missouri are:
#1
0.60%
#2
0.65%
#3
0.82%
#4
1.3%
#5
1.4%
#6
1.4%
#7
1.4%
#8
1.7%
#9
1.8%
#10
1.9%
What city has the Lowest Poverty Level Among Children Under the Age of 5 in Missouri?
Wildwood has the Lowest Poverty Level Among Children Under the Age of 5 in Missouri with 0.60%.
What is the Poverty Level Among Children Under the Age of 5 in the State of Missouri?
Poverty Level Among Children Under the Age of 5 in Missouri is 18.4%.
What is the Poverty Level Among Children Under the Age of 5 in the United States?
Poverty Level Among Children Under the Age of 5 in the United States is 18.1%.