Cities with the Lowest Poverty Level Among Children Under the Age of 5 in Pennsylvania
RELATED REPORTS & OPTIONS
Lowest Poverty | Child 0-5
Pennsylvania
Compare Cities
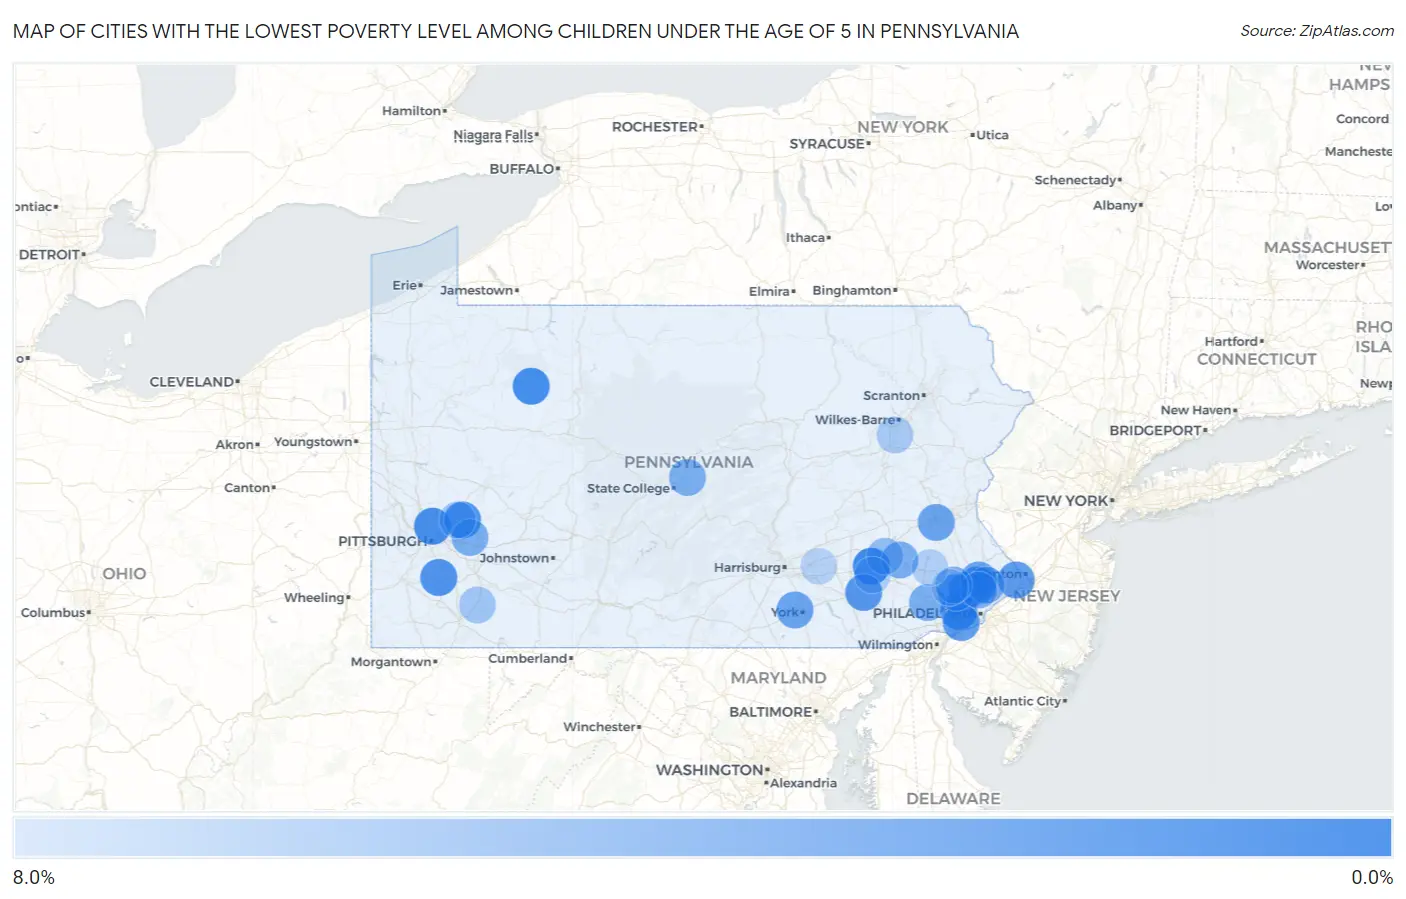
Map of Cities with the Lowest Poverty Level Among Children Under the Age of 5 in Pennsylvania
8.0%
0.0%
Cities with the Lowest Poverty Level Among Children Under the Age of 5 in Pennsylvania
| City | Child Poverty | vs State | vs National | |
| 1. | Sewickley Borough | 0.41% | 17.3%(-16.8)#1 | 18.1%(-17.6)#15 |
| 2. | Reinholds | 0.77% | 17.3%(-16.5)#2 | 18.1%(-17.3)#59 |
| 3. | Marienville | 1.0% | 17.3%(-16.2)#3 | 18.1%(-17.0)#106 |
| 4. | Dunmore Borough | 1.1% | 17.3%(-16.2)#4 | 18.1%(-17.0)#115 |
| 5. | Glenshaw | 1.1% | 17.3%(-16.1)#5 | 18.1%(-16.9)#125 |
| 6. | Lower Burrell | 1.4% | 17.3%(-15.9)#6 | 18.1%(-16.7)#183 |
| 7. | Broomall | 1.5% | 17.3%(-15.8)#7 | 18.1%(-16.6)#199 |
| 8. | Conshohocken Borough | 1.5% | 17.3%(-15.8)#8 | 18.1%(-16.6)#200 |
| 9. | Monongahela | 1.5% | 17.3%(-15.7)#9 | 18.1%(-16.5)#208 |
| 10. | Freeland Borough | 1.7% | 17.3%(-15.6)#10 | 18.1%(-16.4)#250 |
| 11. | Fort Washington | 1.7% | 17.3%(-15.5)#11 | 18.1%(-16.3)#262 |
| 12. | Leola | 1.8% | 17.3%(-15.5)#12 | 18.1%(-16.3)#277 |
| 13. | Oakmont Borough | 1.8% | 17.3%(-15.5)#13 | 18.1%(-16.3)#283 |
| 14. | Dormont Borough | 1.9% | 17.3%(-15.4)#14 | 18.1%(-16.2)#299 |
| 15. | Emmaus Borough | 1.9% | 17.3%(-15.3)#15 | 18.1%(-16.2)#314 |
| 16. | Plymouth Meeting | 1.9% | 17.3%(-15.3)#16 | 18.1%(-16.1)#321 |
| 17. | West Kittanning Borough | 2.0% | 17.3%(-15.3)#17 | 18.1%(-16.1)#340 |
| 18. | Waymart Borough | 2.1% | 17.3%(-15.2)#18 | 18.1%(-16.0)#365 |
| 19. | Folsom | 2.1% | 17.3%(-15.1)#19 | 18.1%(-15.9)#385 |
| 20. | Fairless Hills | 2.2% | 17.3%(-15.1)#20 | 18.1%(-15.9)#404 |
| 21. | Ashland Borough | 2.2% | 17.3%(-15.1)#21 | 18.1%(-15.9)#407 |
| 22. | Flemington Borough | 2.2% | 17.3%(-15.0)#22 | 18.1%(-15.8)#425 |
| 23. | Boyertown Borough | 2.5% | 17.3%(-14.8)#23 | 18.1%(-15.6)#492 |
| 24. | Port Carbon Borough | 2.5% | 17.3%(-14.8)#24 | 18.1%(-15.6)#495 |
| 25. | Pleasant Hills Borough | 2.6% | 17.3%(-14.6)#25 | 18.1%(-15.4)#550 |
| 26. | Ben Avon Borough | 2.7% | 17.3%(-14.6)#26 | 18.1%(-15.4)#558 |
| 27. | King Of Prussia | 2.7% | 17.3%(-14.6)#27 | 18.1%(-15.4)#568 |
| 28. | Hellertown Borough | 2.7% | 17.3%(-14.5)#28 | 18.1%(-15.3)#596 |
| 29. | Trafford Borough | 2.8% | 17.3%(-14.5)#29 | 18.1%(-15.3)#607 |
| 30. | Hulmeville Borough | 2.8% | 17.3%(-14.5)#30 | 18.1%(-15.3)#612 |
| 31. | Shiloh | 2.8% | 17.3%(-14.5)#31 | 18.1%(-15.3)#623 |
| 32. | Wescosville | 2.8% | 17.3%(-14.4)#32 | 18.1%(-15.2)#645 |
| 33. | Maple Glen | 2.8% | 17.3%(-14.4)#33 | 18.1%(-15.2)#646 |
| 34. | Castle Shannon Borough | 3.1% | 17.3%(-14.1)#34 | 18.1%(-14.9)#747 |
| 35. | Emsworth Borough | 3.2% | 17.3%(-14.1)#35 | 18.1%(-14.9)#782 |
| 36. | Seven Fields Borough | 3.2% | 17.3%(-14.1)#36 | 18.1%(-14.9)#788 |
| 37. | Trappe Borough | 3.2% | 17.3%(-14.1)#37 | 18.1%(-14.9)#792 |
| 38. | West View Borough | 3.3% | 17.3%(-14.0)#38 | 18.1%(-14.8)#815 |
| 39. | Willow Grove | 3.3% | 17.3%(-14.0)#39 | 18.1%(-14.8)#816 |
| 40. | Burgettstown Borough | 3.5% | 17.3%(-13.8)#40 | 18.1%(-14.6)#911 |
| 41. | Harrisville Borough | 3.5% | 17.3%(-13.8)#41 | 18.1%(-14.6)#913 |
| 42. | Downingtown Borough | 3.5% | 17.3%(-13.7)#42 | 18.1%(-14.5)#924 |
| 43. | Reiffton | 3.5% | 17.3%(-13.7)#43 | 18.1%(-14.5)#933 |
| 44. | Murrysville | 3.6% | 17.3%(-13.7)#44 | 18.1%(-14.5)#940 |
| 45. | Exton | 3.6% | 17.3%(-13.7)#45 | 18.1%(-14.5)#953 |
| 46. | Phoenixville Borough | 3.6% | 17.3%(-13.6)#46 | 18.1%(-14.4)#968 |
| 47. | Lilly Borough | 3.6% | 17.3%(-13.6)#47 | 18.1%(-14.4)#977 |
| 48. | Pleasant Gap | 3.6% | 17.3%(-13.6)#48 | 18.1%(-14.4)#978 |
| 49. | Mill Hall Borough | 3.7% | 17.3%(-13.6)#49 | 18.1%(-14.4)#996 |
| 50. | Jermyn Borough | 3.8% | 17.3%(-13.5)#50 | 18.1%(-14.3)#1,040 |
| 51. | Oreland | 3.9% | 17.3%(-13.4)#51 | 18.1%(-14.2)#1,066 |
| 52. | Loganville Borough | 3.9% | 17.3%(-13.3)#52 | 18.1%(-14.1)#1,096 |
| 53. | Lansdale Borough | 3.9% | 17.3%(-13.3)#53 | 18.1%(-14.1)#1,104 |
| 54. | Trooper | 4.0% | 17.3%(-13.3)#54 | 18.1%(-14.1)#1,126 |
| 55. | Catasauqua Borough | 4.1% | 17.3%(-13.2)#55 | 18.1%(-14.0)#1,162 |
| 56. | Tremont Borough | 4.2% | 17.3%(-13.1)#56 | 18.1%(-13.9)#1,191 |
| 57. | Summerhill Borough | 4.2% | 17.3%(-13.1)#57 | 18.1%(-13.9)#1,205 |
| 58. | Hyndman Borough | 4.3% | 17.3%(-12.9)#58 | 18.1%(-13.7)#1,273 |
| 59. | Ambler Borough | 4.5% | 17.3%(-12.8)#59 | 18.1%(-13.6)#1,325 |
| 60. | Bowmanstown Borough | 4.5% | 17.3%(-12.7)#60 | 18.1%(-13.5)#1,354 |
| 61. | Brookhaven Borough | 4.7% | 17.3%(-12.6)#61 | 18.1%(-13.4)#1,397 |
| 62. | Kenhorst Borough | 4.7% | 17.3%(-12.6)#62 | 18.1%(-13.4)#1,398 |
| 63. | Hatboro Borough | 4.7% | 17.3%(-12.5)#63 | 18.1%(-13.3)#1,432 |
| 64. | Leesport Borough | 4.8% | 17.3%(-12.5)#64 | 18.1%(-13.3)#1,443 |
| 65. | Richland Borough | 4.8% | 17.3%(-12.5)#65 | 18.1%(-13.3)#1,446 |
| 66. | Duncannon Borough | 4.8% | 17.3%(-12.5)#66 | 18.1%(-13.3)#1,447 |
| 67. | Greensboro Borough | 4.8% | 17.3%(-12.5)#67 | 18.1%(-13.3)#1,459 |
| 68. | Ridley Park Borough | 4.8% | 17.3%(-12.5)#68 | 18.1%(-13.3)#1,483 |
| 69. | Bell Acres Borough | 4.8% | 17.3%(-12.4)#69 | 18.1%(-13.2)#1,495 |
| 70. | Montgomery Borough | 4.9% | 17.3%(-12.4)#70 | 18.1%(-13.2)#1,511 |
| 71. | Jefferson Hills Borough | 4.9% | 17.3%(-12.4)#71 | 18.1%(-13.2)#1,513 |
| 72. | Whitfield | 4.9% | 17.3%(-12.3)#72 | 18.1%(-13.1)#1,538 |
| 73. | West York Borough | 4.9% | 17.3%(-12.3)#73 | 18.1%(-13.1)#1,539 |
| 74. | North Irwin Borough | 5.0% | 17.3%(-12.3)#74 | 18.1%(-13.1)#1,567 |
| 75. | Rices Landing Borough | 5.0% | 17.3%(-12.3)#75 | 18.1%(-13.1)#1,570 |
| 76. | Swarthmore Borough | 5.0% | 17.3%(-12.2)#76 | 18.1%(-13.0)#1,585 |
| 77. | Green Tree Borough | 5.0% | 17.3%(-12.2)#77 | 18.1%(-13.0)#1,590 |
| 78. | Fredericksburg Cdp Lebanon County | 5.2% | 17.3%(-12.1)#78 | 18.1%(-12.9)#1,640 |
| 79. | Shamokin Dam Borough | 5.2% | 17.3%(-12.1)#79 | 18.1%(-12.9)#1,650 |
| 80. | Laureldale Borough | 5.2% | 17.3%(-12.0)#80 | 18.1%(-12.8)#1,671 |
| 81. | Loganton Borough | 5.3% | 17.3%(-12.0)#81 | 18.1%(-12.8)#1,693 |
| 82. | Eau Claire Borough | 5.3% | 17.3%(-12.0)#82 | 18.1%(-12.8)#1,697 |
| 83. | Connellsville | 5.3% | 17.3%(-11.9)#83 | 18.1%(-12.7)#1,723 |
| 84. | Arnold | 5.4% | 17.3%(-11.8)#84 | 18.1%(-12.6)#1,761 |
| 85. | Collegeville Borough | 5.6% | 17.3%(-11.7)#85 | 18.1%(-12.5)#1,830 |
| 86. | New Cumberland Borough | 5.6% | 17.3%(-11.6)#86 | 18.1%(-12.4)#1,851 |
| 87. | Ebensburg Borough | 5.7% | 17.3%(-11.6)#87 | 18.1%(-12.4)#1,876 |
| 88. | Mountain Top | 5.7% | 17.3%(-11.5)#88 | 18.1%(-12.3)#1,900 |
| 89. | Northumberland Borough | 5.7% | 17.3%(-11.5)#89 | 18.1%(-12.3)#1,901 |
| 90. | Chester Heights Borough | 5.7% | 17.3%(-11.5)#90 | 18.1%(-12.3)#1,902 |
| 91. | Lake City Borough | 5.8% | 17.3%(-11.5)#91 | 18.1%(-12.3)#1,914 |
| 92. | West Chester Borough | 6.1% | 17.3%(-11.2)#92 | 18.1%(-12.0)#2,021 |
| 93. | Audubon | 6.1% | 17.3%(-11.2)#93 | 18.1%(-12.0)#2,024 |
| 94. | Pottsgrove | 6.1% | 17.3%(-11.1)#94 | 18.1%(-11.9)#2,036 |
| 95. | Greencastle Borough | 6.2% | 17.3%(-11.1)#95 | 18.1%(-11.9)#2,055 |
| 96. | Reamstown | 6.2% | 17.3%(-11.1)#96 | 18.1%(-11.9)#2,069 |
| 97. | Wernersville Borough | 6.2% | 17.3%(-11.0)#97 | 18.1%(-11.8)#2,089 |
| 98. | South Renovo Borough | 6.2% | 17.3%(-11.0)#98 | 18.1%(-11.8)#2,102 |
| 99. | Ephrata Borough | 6.3% | 17.3%(-10.9)#99 | 18.1%(-11.7)#2,135 |
| 100. | Campbelltown | 6.4% | 17.3%(-10.9)#100 | 18.1%(-11.7)#2,145 |
Common Questions
What are the Top 10 Cities with the Lowest Poverty Level Among Children Under the Age of 5 in Pennsylvania?
Top 10 Cities with the Lowest Poverty Level Among Children Under the Age of 5 in Pennsylvania are:
#1
0.77%
#2
1.0%
#3
1.1%
#4
1.4%
#5
1.5%
#6
1.5%
#7
1.7%
#8
1.8%
#9
1.9%
#10
2.1%
What city has the Lowest Poverty Level Among Children Under the Age of 5 in Pennsylvania?
Reinholds has the Lowest Poverty Level Among Children Under the Age of 5 in Pennsylvania with 0.77%.
What is the Poverty Level Among Children Under the Age of 5 in the State of Pennsylvania?
Poverty Level Among Children Under the Age of 5 in Pennsylvania is 17.3%.
What is the Poverty Level Among Children Under the Age of 5 in the United States?
Poverty Level Among Children Under the Age of 5 in the United States is 18.1%.