Cities with the Lowest Poverty Level Among Children Under the Age of 5 in Illinois
RELATED REPORTS & OPTIONS
Lowest Poverty | Child 0-5
Illinois
Compare Cities
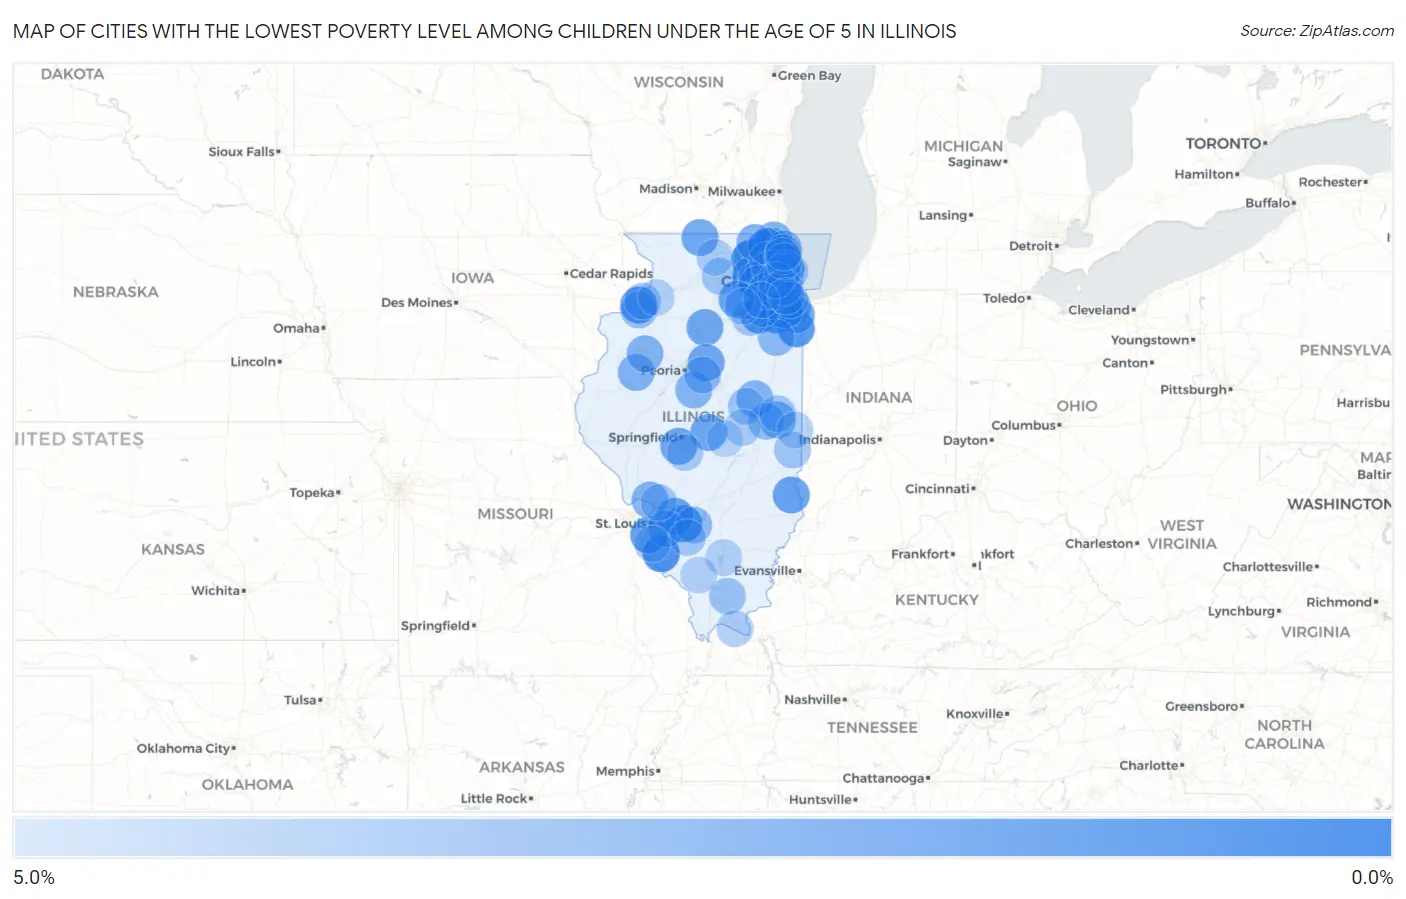
Map of Cities with the Lowest Poverty Level Among Children Under the Age of 5 in Illinois
5.0%
0.0%
Cities with the Lowest Poverty Level Among Children Under the Age of 5 in Illinois
| City | Child Poverty | vs State | vs National | |
| 1. | Huntley | 0.17% | 16.9%(-16.7)#1 | 18.1%(-17.9)#1 |
| 2. | Libertyville | 0.80% | 16.9%(-16.1)#2 | 18.1%(-17.3)#61 |
| 3. | Mount Prospect | 0.86% | 16.9%(-16.1)#3 | 18.1%(-17.2)#75 |
| 4. | Red Bud | 1.0% | 16.9%(-15.9)#4 | 18.1%(-17.1)#104 |
| 5. | Manhattan | 1.0% | 16.9%(-15.9)#5 | 18.1%(-17.0)#108 |
| 6. | St Charles | 1.0% | 16.9%(-15.9)#6 | 18.1%(-17.0)#109 |
| 7. | La Grange | 1.0% | 16.9%(-15.9)#7 | 18.1%(-17.0)#111 |
| 8. | Elmhurst | 1.1% | 16.9%(-15.8)#8 | 18.1%(-16.9)#120 |
| 9. | Cary | 1.1% | 16.9%(-15.8)#9 | 18.1%(-16.9)#126 |
| 10. | Campton Hills | 1.2% | 16.9%(-15.8)#10 | 18.1%(-16.9)#130 |
| 11. | Deerfield | 1.2% | 16.9%(-15.7)#11 | 18.1%(-16.9)#138 |
| 12. | Grant Park | 1.3% | 16.9%(-15.7)#12 | 18.1%(-16.8)#154 |
| 13. | Hampton | 1.3% | 16.9%(-15.6)#13 | 18.1%(-16.8)#158 |
| 14. | Aviston | 1.3% | 16.9%(-15.6)#14 | 18.1%(-16.7)#161 |
| 15. | Channahon | 1.3% | 16.9%(-15.6)#15 | 18.1%(-16.7)#167 |
| 16. | Downers Grove | 1.4% | 16.9%(-15.6)#16 | 18.1%(-16.7)#168 |
| 17. | La Grange Park | 1.4% | 16.9%(-15.5)#17 | 18.1%(-16.6)#185 |
| 18. | Columbia | 1.5% | 16.9%(-15.5)#18 | 18.1%(-16.6)#201 |
| 19. | Geneva | 1.7% | 16.9%(-15.3)#19 | 18.1%(-16.4)#243 |
| 20. | Island Lake | 1.7% | 16.9%(-15.2)#20 | 18.1%(-16.3)#267 |
| 21. | St Jacob | 1.7% | 16.9%(-15.2)#21 | 18.1%(-16.3)#269 |
| 22. | Mokena | 1.7% | 16.9%(-15.2)#22 | 18.1%(-16.3)#271 |
| 23. | Robinson | 1.8% | 16.9%(-15.1)#23 | 18.1%(-16.3)#280 |
| 24. | Round Lake Park | 1.9% | 16.9%(-15.0)#24 | 18.1%(-16.2)#310 |
| 25. | Forest Park | 1.9% | 16.9%(-15.0)#25 | 18.1%(-16.2)#312 |
| 26. | Flossmoor | 2.0% | 16.9%(-15.0)#26 | 18.1%(-16.1)#333 |
| 27. | Niantic | 2.0% | 16.9%(-14.9)#27 | 18.1%(-16.1)#341 |
| 28. | Woodridge | 2.0% | 16.9%(-14.9)#28 | 18.1%(-16.0)#349 |
| 29. | Granville | 2.0% | 16.9%(-14.9)#29 | 18.1%(-16.0)#354 |
| 30. | New Lenox | 2.1% | 16.9%(-14.9)#30 | 18.1%(-16.0)#369 |
| 31. | Chatham | 2.1% | 16.9%(-14.8)#31 | 18.1%(-16.0)#376 |
| 32. | Roanoke | 2.1% | 16.9%(-14.8)#32 | 18.1%(-16.0)#378 |
| 33. | Durand | 2.1% | 16.9%(-14.8)#33 | 18.1%(-16.0)#383 |
| 34. | Crete | 2.1% | 16.9%(-14.8)#34 | 18.1%(-15.9)#395 |
| 35. | Bartlett | 2.2% | 16.9%(-14.8)#35 | 18.1%(-15.9)#398 |
| 36. | Elmwood Park | 2.3% | 16.9%(-14.7)#36 | 18.1%(-15.8)#432 |
| 37. | Glen Ellyn | 2.3% | 16.9%(-14.6)#37 | 18.1%(-15.7)#455 |
| 38. | Frankfort | 2.4% | 16.9%(-14.5)#38 | 18.1%(-15.7)#477 |
| 39. | Lindenhurst | 2.5% | 16.9%(-14.4)#39 | 18.1%(-15.5)#517 |
| 40. | Niles | 2.6% | 16.9%(-14.4)#40 | 18.1%(-15.5)#537 |
| 41. | Wonder Lake | 2.6% | 16.9%(-14.3)#41 | 18.1%(-15.4)#552 |
| 42. | Avon | 2.6% | 16.9%(-14.3)#42 | 18.1%(-15.4)#555 |
| 43. | Godfrey | 2.7% | 16.9%(-14.3)#43 | 18.1%(-15.4)#566 |
| 44. | Homer | 2.7% | 16.9%(-14.2)#44 | 18.1%(-15.4)#580 |
| 45. | Knoxville | 2.7% | 16.9%(-14.2)#45 | 18.1%(-15.3)#584 |
| 46. | Westchester | 2.8% | 16.9%(-14.1)#46 | 18.1%(-15.2)#625 |
| 47. | Fisher | 2.8% | 16.9%(-14.1)#47 | 18.1%(-15.2)#627 |
| 48. | Shiloh | 2.8% | 16.9%(-14.1)#48 | 18.1%(-15.2)#634 |
| 49. | Buffalo Grove | 2.8% | 16.9%(-14.1)#49 | 18.1%(-15.2)#635 |
| 50. | Lake Bluff | 2.8% | 16.9%(-14.1)#50 | 18.1%(-15.2)#637 |
| 51. | Lake Holiday | 2.8% | 16.9%(-14.1)#51 | 18.1%(-15.2)#643 |
| 52. | Hopedale | 2.9% | 16.9%(-14.1)#52 | 18.1%(-15.2)#654 |
| 53. | Barrington | 2.9% | 16.9%(-14.0)#53 | 18.1%(-15.2)#673 |
| 54. | Park Ridge | 3.0% | 16.9%(-14.0)#54 | 18.1%(-15.1)#693 |
| 55. | Limestone | 3.1% | 16.9%(-13.9)#55 | 18.1%(-15.0)#731 |
| 56. | Goodfield | 3.1% | 16.9%(-13.8)#56 | 18.1%(-14.9)#754 |
| 57. | Beckemeyer | 3.2% | 16.9%(-13.7)#57 | 18.1%(-14.9)#778 |
| 58. | Wheaton | 3.3% | 16.9%(-13.7)#58 | 18.1%(-14.8)#819 |
| 59. | Philo | 3.3% | 16.9%(-13.6)#59 | 18.1%(-14.7)#843 |
| 60. | Silvis | 3.5% | 16.9%(-13.5)#60 | 18.1%(-14.6)#895 |
| 61. | Batavia | 3.5% | 16.9%(-13.5)#61 | 18.1%(-14.6)#898 |
| 62. | Shorewood | 3.5% | 16.9%(-13.4)#62 | 18.1%(-14.6)#901 |
| 63. | Schaumburg | 3.5% | 16.9%(-13.4)#63 | 18.1%(-14.5)#927 |
| 64. | Creal Springs | 3.6% | 16.9%(-13.4)#64 | 18.1%(-14.5)#945 |
| 65. | Naperville | 3.6% | 16.9%(-13.3)#65 | 18.1%(-14.5)#951 |
| 66. | Mansfield | 3.7% | 16.9%(-13.2)#66 | 18.1%(-14.4)#999 |
| 67. | Creston | 3.7% | 16.9%(-13.2)#67 | 18.1%(-14.4)#1,003 |
| 68. | Paris | 3.7% | 16.9%(-13.2)#68 | 18.1%(-14.3)#1,011 |
| 69. | Lincolnwood | 3.7% | 16.9%(-13.2)#69 | 18.1%(-14.3)#1,015 |
| 70. | Lyons | 3.7% | 16.9%(-13.2)#70 | 18.1%(-14.3)#1,016 |
| 71. | Morton Grove | 3.7% | 16.9%(-13.2)#71 | 18.1%(-14.3)#1,020 |
| 72. | Volo | 3.8% | 16.9%(-13.1)#72 | 18.1%(-14.3)#1,041 |
| 73. | Darien | 3.8% | 16.9%(-13.1)#73 | 18.1%(-14.2)#1,052 |
| 74. | Ogden | 3.8% | 16.9%(-13.1)#74 | 18.1%(-14.2)#1,059 |
| 75. | Port Byron | 3.9% | 16.9%(-13.0)#75 | 18.1%(-14.2)#1,081 |
| 76. | Okawville | 3.9% | 16.9%(-13.0)#76 | 18.1%(-14.2)#1,086 |
| 77. | Morris | 3.9% | 16.9%(-13.0)#77 | 18.1%(-14.1)#1,092 |
| 78. | Bethalto | 3.9% | 16.9%(-13.0)#78 | 18.1%(-14.1)#1,100 |
| 79. | Rosemont | 4.0% | 16.9%(-13.0)#79 | 18.1%(-14.1)#1,115 |
| 80. | Mccook | 4.0% | 16.9%(-12.9)#80 | 18.1%(-14.1)#1,136 |
| 81. | Pawnee | 4.0% | 16.9%(-12.9)#81 | 18.1%(-14.0)#1,146 |
| 82. | Bement | 4.1% | 16.9%(-12.8)#82 | 18.1%(-14.0)#1,165 |
| 83. | Metropolis | 4.1% | 16.9%(-12.8)#83 | 18.1%(-13.9)#1,174 |
| 84. | Midlothian | 4.1% | 16.9%(-12.8)#84 | 18.1%(-13.9)#1,177 |
| 85. | New Milford | 4.2% | 16.9%(-12.8)#85 | 18.1%(-13.9)#1,193 |
| 86. | Bannockburn | 4.2% | 16.9%(-12.8)#86 | 18.1%(-13.9)#1,195 |
| 87. | Millbrook | 4.2% | 16.9%(-12.8)#87 | 18.1%(-13.9)#1,212 |
| 88. | Somonauk | 4.2% | 16.9%(-12.7)#88 | 18.1%(-13.9)#1,224 |
| 89. | Waterloo | 4.3% | 16.9%(-12.7)#89 | 18.1%(-13.8)#1,235 |
| 90. | Villa Park | 4.3% | 16.9%(-12.7)#90 | 18.1%(-13.8)#1,240 |
| 91. | Ridge Farm | 4.3% | 16.9%(-12.6)#91 | 18.1%(-13.8)#1,250 |
| 92. | Ina | 4.3% | 16.9%(-12.6)#92 | 18.1%(-13.7)#1,270 |
| 93. | Newark | 4.3% | 16.9%(-12.6)#93 | 18.1%(-13.7)#1,271 |
| 94. | Vergennes | 4.3% | 16.9%(-12.6)#94 | 18.1%(-13.7)#1,278 |
| 95. | Erie | 4.4% | 16.9%(-12.5)#95 | 18.1%(-13.6)#1,300 |
| 96. | Northbrook | 4.4% | 16.9%(-12.5)#96 | 18.1%(-13.6)#1,304 |
| 97. | Plainfield | 4.4% | 16.9%(-12.5)#97 | 18.1%(-13.6)#1,309 |
| 98. | Palos Heights | 4.4% | 16.9%(-12.5)#98 | 18.1%(-13.6)#1,315 |
| 99. | Lake Forest | 4.5% | 16.9%(-12.4)#99 | 18.1%(-13.6)#1,329 |
| 100. | Mount Zion | 4.5% | 16.9%(-12.4)#100 | 18.1%(-13.5)#1,345 |
Common Questions
What are the Top 10 Cities with the Lowest Poverty Level Among Children Under the Age of 5 in Illinois?
Top 10 Cities with the Lowest Poverty Level Among Children Under the Age of 5 in Illinois are:
#1
0.17%
#2
0.80%
#3
0.86%
#4
1.0%
#5
1.0%
#6
1.0%
#7
1.0%
#8
1.1%
#9
1.1%
#10
1.2%
What city has the Lowest Poverty Level Among Children Under the Age of 5 in Illinois?
Huntley has the Lowest Poverty Level Among Children Under the Age of 5 in Illinois with 0.17%.
What is the Poverty Level Among Children Under the Age of 5 in the State of Illinois?
Poverty Level Among Children Under the Age of 5 in Illinois is 16.9%.
What is the Poverty Level Among Children Under the Age of 5 in the United States?
Poverty Level Among Children Under the Age of 5 in the United States is 18.1%.