Cities with the Lowest Poverty Level Among Children Under the Age of 5 in Vermont

RELATED REPORTS & OPTIONS

Lowest Poverty | Child 0-5
Population
Families and Households
Female Fertility
Female Fertility (Unmarried)
Race (Community Size)
Race (Percentage)
Ancestry (Community Size)
AfghanAfricanAlaska NativeAlaskan AthabascanAlbanianAleutAlsatianAmericanApacheArabArapahoArgentineanArmenianAssyrian / Chaldean / SyriacAustralianAustrianBahamianBangladeshiBarbadianBasqueBelgianBelizeanBermudanBhutaneseBlackfeetBolivianBrazilianBritishBritish West IndianBulgarianBurmeseCajunCambodianCanadianCape VerdeanCarpatho RusynCelticCentral AmericanCentral American IndianCherokeeCheyenneChickasawChileanChineseChippewaChoctawColombianColvilleComancheCosta RicanCreeCreekCroatianCrowCubanCypriotCzechCzechoslovakianDanishDelawareDominicanDutchDutch West IndianEastern EuropeanEcuadorianEgyptianEnglishEstonianEthiopianEuropeanFijianFilipinoFinnishFrenchFrench American IndianFrench CanadianGermanGerman RussianGhanaianGreekGuamanian / ChamorroGuatemalanGuyaneseHaitianHmongHonduranHopiHoumaHungarianIcelanderIndian (Asian)IndonesianInupiatIranianIraqiIrishIroquoisIsraeliItalianJamaicanJapaneseJordanianKenyanKiowaKoreanLaotianLatvianLebaneseLiberianLithuanianLumbeeLuxembourgerMacedonianMalaysianMalteseMarshalleseMenomineeMexicanMexican American IndianMongolianMoroccanNative HawaiianNavajoNepaleseNew ZealanderNicaraguanNigerianNorthern EuropeanNorwegianOkinawanOsageOttawaPaiutePakistaniPalestinianPanamanianParaguayanPennsylvania GermanPeruvianPimaPolishPortuguesePotawatomiPuebloPuerto RicanPuget Sound SalishRomanianRussianSalvadoranSamoanScandinavianScotch-IrishScottishSeminoleSenegaleseSerbianShoshoneSierra LeoneanSiouxSlavicSlovakSloveneSomaliSouth AfricanSouth AmericanSouth American IndianSoviet UnionSpaniardSpanishSpanish AmericanSpanish American IndianSri LankanSubsaharan AfricanSudaneseSwedishSwissSyrianTaiwaneseThaiTlingit-HaidaTohono O'OdhamTonganTrinidadian and TobagonianTsimshianTurkishU.S. Virgin IslanderUgandanUkrainianUruguayanUteVenezuelanVietnameseWelshWest IndianYakamaYaquiYugoslavianYumanYup'ikZimbabwean
Ancestry (Percentage)
AfghanAfricanAlaska NativeAlaskan AthabascanAlbanianAleutAlsatianAmericanApacheArabArapahoArgentineanArmenianAssyrian / Chaldean / SyriacAustralianAustrianBahamianBangladeshiBarbadianBasqueBelgianBelizeanBermudanBhutaneseBlackfeetBolivianBrazilianBritishBritish West IndianBulgarianBurmeseCajunCambodianCanadianCape VerdeanCarpatho RusynCelticCentral AmericanCentral American IndianCherokeeCheyenneChickasawChileanChineseChippewaChoctawColombianColvilleComancheCosta RicanCreeCreekCroatianCrowCubanCypriotCzechCzechoslovakianDanishDelawareDominicanDutchDutch West IndianEastern EuropeanEcuadorianEgyptianEnglishEstonianEthiopianEuropeanFijianFilipinoFinnishFrenchFrench American IndianFrench CanadianGermanGerman RussianGhanaianGreekGuamanian / ChamorroGuatemalanGuyaneseHaitianHmongHonduranHopiHoumaHungarianIcelanderIndian (Asian)IndonesianInupiatIranianIraqiIrishIroquoisIsraeliItalianJamaicanJapaneseJordanianKenyanKiowaKoreanLaotianLatvianLebaneseLiberianLithuanianLumbeeLuxembourgerMacedonianMalaysianMalteseMarshalleseMenomineeMexicanMexican American IndianMongolianMoroccanNative HawaiianNavajoNepaleseNew ZealanderNicaraguanNigerianNorthern EuropeanNorwegianOkinawanOsageOttawaPaiutePakistaniPalestinianPanamanianParaguayanPennsylvania GermanPeruvianPimaPolishPortuguesePotawatomiPuebloPuerto RicanPuget Sound SalishRomanianRussianSalvadoranSamoanScandinavianScotch-IrishScottishSeminoleSenegaleseSerbianShoshoneSierra LeoneanSiouxSlavicSlovakSloveneSomaliSouth AfricanSouth AmericanSouth American IndianSoviet UnionSpaniardSpanishSpanish AmericanSpanish American IndianSri LankanSubsaharan AfricanSudaneseSwedishSwissSyrianTaiwaneseThaiTlingit-HaidaTohono O'OdhamTonganTrinidadian and TobagonianTsimshianTurkishU.S. Virgin IslanderUgandanUkrainianUruguayanUteVenezuelanVietnameseWelshWest IndianYakamaYaquiYugoslavianYumanYup'ikZimbabwean
Immigrant Origin (Total)
AfghanistanAfricaAlbaniaArgentinaArmeniaAsiaAustraliaAustriaAzoresBahamasBangladeshBarbadosBelarusBelgiumBelizeBoliviaBosnia and HerzegovinaBrazilBulgariaBurma / MyanmarCabo VerdeCambodiaCameroonCanadaCaribbeanCentral AmericaChileChinaColombiaCongoCosta RicaCroatiaCubaCzechoslovakiaDenmarkDominicaDominican RepublicEastern AfricaEastern AsiaEastern EuropeEcuadorEgyptEl SalvadorEnglandEritreaEthiopiaEuropeFijiFranceGermanyGhanaGreeceGrenadaGuatemalaGuyanaHaitiHondurasHong KongHungaryIndiaIndonesiaIranIraqIrelandIsraelItalyJamaicaJapanJordanKazakhstanKenyaKoreaKuwaitLaosLatin AmericaLatviaLebanonLiberiaLithuaniaMalaysiaMexicoMicronesiaMiddle AfricaMoldovaMoroccoNepalNetherlandsNicaraguaNigeriaNorth MacedoniaNorthern AfricaNorthern EuropeNorwayOceaniaPakistanPanamaPeruPhilippinesPolandPortugalRomaniaRussiaSaudi ArabiaScotlandSenegalSerbiaSierra LeoneSingaporeSomaliaSouth AfricaSouth AmericaSouth Central AsiaSouth Eastern AsiaSouthern EuropeSpainSri LankaSt. Vincent and the GrenadinesSudanSwedenSwitzerlandSyriaTaiwanThailandTrinidad and TobagoTurkeyUgandaUkraineUruguayUzbekistanVenezuelaVietnamWest IndiesWestern AfricaWestern AsiaWestern EuropeYemenZaireZimbabwe
Immigrant Origin (Percentage)
AfghanistanAfricaAlbaniaArgentinaArmeniaAsiaAustraliaAustriaAzoresBahamasBangladeshBarbadosBelarusBelgiumBelizeBoliviaBosnia and HerzegovinaBrazilBulgariaBurma / MyanmarCabo VerdeCambodiaCameroonCanadaCaribbeanCentral AmericaChileChinaColombiaCongoCosta RicaCroatiaCubaCzechoslovakiaDenmarkDominicaDominican RepublicEastern AfricaEastern AsiaEastern EuropeEcuadorEgyptEl SalvadorEnglandEritreaEthiopiaEuropeFijiFranceGermanyGhanaGreeceGrenadaGuatemalaGuyanaHaitiHondurasHong KongHungaryIndiaIndonesiaIranIraqIrelandIsraelItalyJamaicaJapanJordanKazakhstanKenyaKoreaKuwaitLaosLatin AmericaLatviaLebanonLiberiaLithuaniaMalaysiaMexicoMicronesiaMiddle AfricaMoldovaMoroccoNepalNetherlandsNicaraguaNigeriaNorth MacedoniaNorthern AfricaNorthern EuropeNorwayOceaniaPakistanPanamaPeruPhilippinesPolandPortugalRomaniaRussiaSaudi ArabiaScotlandSenegalSerbiaSierra LeoneSingaporeSomaliaSouth AfricaSouth AmericaSouth Central AsiaSouth Eastern AsiaSouthern EuropeSpainSri LankaSt. Vincent and the GrenadinesSudanSwedenSwitzerlandSyriaTaiwanThailandTrinidad and TobagoTurkeyUgandaUkraineUruguayUzbekistanVenezuelaVietnamWest IndiesWestern AfricaWestern AsiaWestern EuropeYemenZaireZimbabwe
Income
Income (Families)
Income (Households)
Poverty
Poverty (Families)
Unemployment
Employment Occupations
Employment Industries
Employer Class
Commute Time
Commute Means
School Enrollment
Education by Degree Field
Occupancy
Finances
Physical Characteristics
Vermont
Compare Cities
Comparison Subject

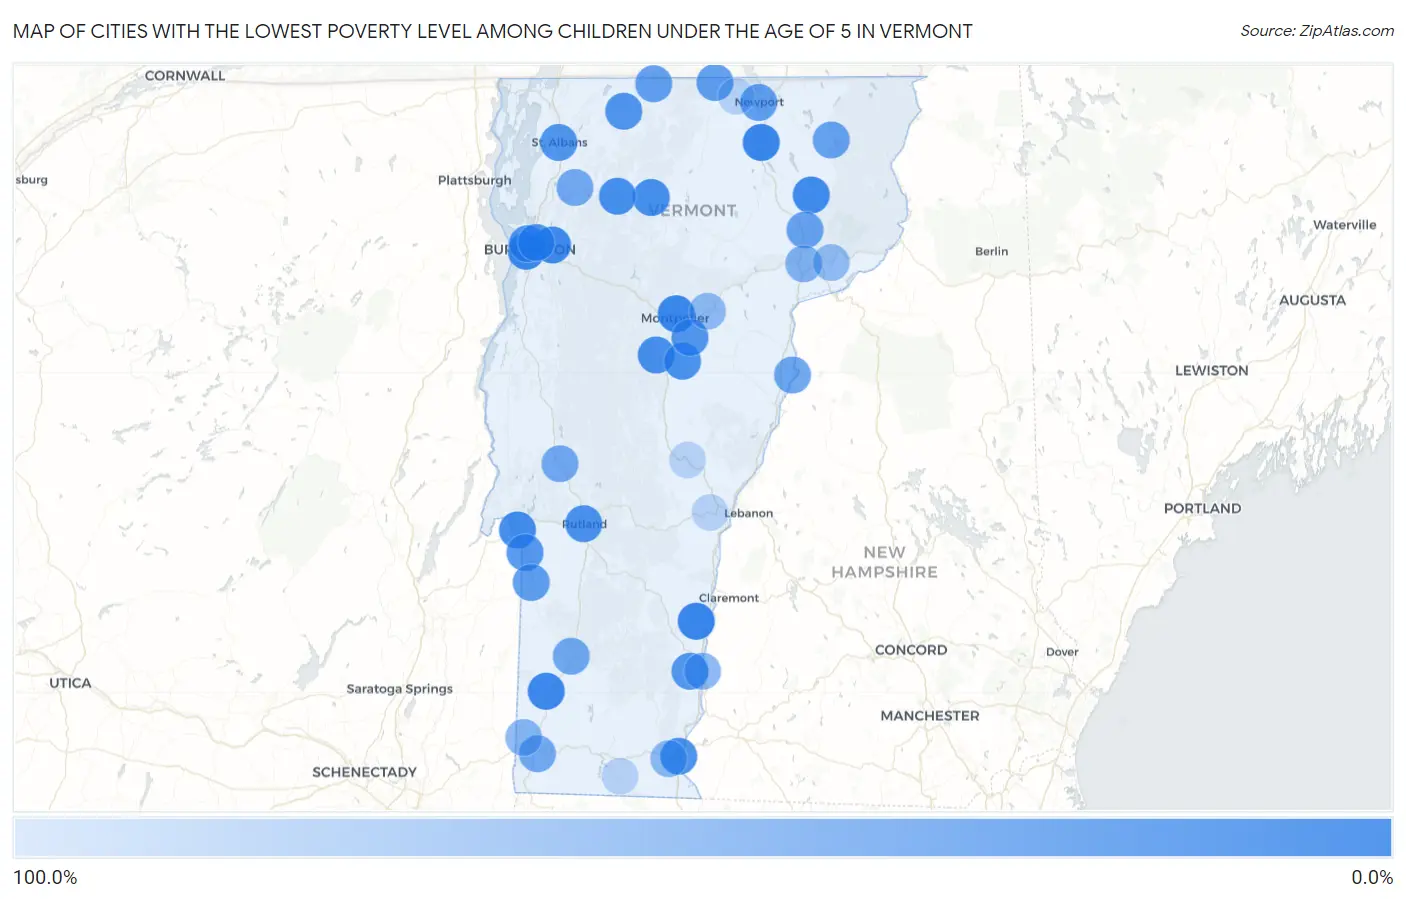
Map of Cities with the Lowest Poverty Level Among Children Under the Age of 5 in Vermont

100.0%
0.0%
Cities with the Lowest Poverty Level Among Children Under the Age of 5 in Vermont Map

Cities with the Lowest Poverty Level Among Children Under the Age of 5 in Vermont

City Child Poverty vs State vs National
1.Orleans5.9%11.5%(-5.64)#118.1%(-12.2)#1,939
2.Springfield5.9%11.5%(-5.61)#218.1%(-12.2)#1,956
3.Montpelier7.2%11.5%(-4.30)#318.1%(-10.8)#2,515
4.South Burlington8.7%11.5%(-2.77)#418.1%(-9.31)#3,151
5.Arlington8.8%11.5%(-2.67)#518.1%(-9.21)#3,187
6.Essex Junction10.5%11.5%(-0.975)#618.1%(-7.52)#3,890
7.Stamford12.5%11.5%(+0.983)#718.1%(-5.56)#4,630
8.West Burke12.5%11.5%(+0.983)#818.1%(-5.56)#4,663
9.Fair Haven14.2%11.5%(+2.67)#918.1%(-3.88)#5,271
10.Johnson14.5%11.5%(+3.03)#1018.1%(-3.52)#5,429
11.Jeffersonville15.4%11.5%(+3.87)#1118.1%(-2.68)#5,723
12.Northfield16.8%11.5%(+5.24)#1218.1%(-1.31)#6,220
13.Castleton Four Corners17.9%11.5%(+6.34)#1318.1%(-0.206)#6,569
14.Burlington18.5%11.5%(+6.96)#1418.1%(+0.415)#6,770
15.Rutland19.6%11.5%(+8.04)#1518.1%(+1.50)#7,122
16.Brattleboro19.7%11.5%(+8.14)#1618.1%(+1.60)#7,151
17.Williamstown20.0%11.5%(+8.48)#1718.1%(+1.94)#7,235
18.Enosburg Falls23.2%11.5%(+11.7)#1818.1%(+5.13)#8,259
19.Winooski24.8%11.5%(+13.3)#1918.1%(+6.78)#8,690
20.Barre25.1%11.5%(+13.6)#2018.1%(+7.02)#8,835
21.Saxtons River25.3%11.5%(+13.8)#2118.1%(+7.25)#8,864
22.St Albans25.3%11.5%(+13.8)#2218.1%(+7.26)#8,866
23.Poultney28.1%11.5%(+16.6)#2318.1%(+10.0)#9,542
24.North Troy33.3%11.5%(+21.8)#2418.1%(+15.3)#10,702
25.St. George33.3%11.5%(+21.8)#2518.1%(+15.3)#10,716
26.Wells33.3%11.5%(+21.8)#2618.1%(+15.3)#10,728
27.Pawlet33.3%11.5%(+21.8)#2718.1%(+15.3)#10,738
28.Newport35.5%11.5%(+24.0)#2818.1%(+17.5)#11,154
29.Richford36.4%11.5%(+24.8)#2918.1%(+18.3)#11,309
30.Island Pond40.0%11.5%(+28.5)#3018.1%(+21.9)#11,921
31.Lyndonville40.4%11.5%(+28.8)#3118.1%(+22.3)#12,017
32.Newbury42.9%11.5%(+31.3)#3218.1%(+24.8)#12,366
33.Manchester Center47.2%11.5%(+35.7)#3318.1%(+29.1)#12,978
34.Fairfax47.7%11.5%(+36.2)#3418.1%(+29.7)#13,046
35.Brandon48.0%11.5%(+36.5)#3518.1%(+29.9)#13,077
36.Bennington48.2%11.5%(+36.7)#3618.1%(+30.1)#13,099
37.St Johnsbury60.0%11.5%(+48.5)#3718.1%(+41.9)#14,278
38.Bellows Falls62.7%11.5%(+51.2)#3818.1%(+44.7)#14,556
39.North Bennington64.5%11.5%(+53.0)#3918.1%(+46.5)#14,677
40.West Brattleboro66.4%11.5%(+54.9)#4018.1%(+48.3)#14,789
41.Plainfield69.7%11.5%(+58.2)#4118.1%(+51.6)#15,032
42.Concord72.2%11.5%(+60.7)#4218.1%(+54.2)#15,165
43.Sheffield75.0%11.5%(+63.5)#4318.1%(+56.9)#15,304
44.South Royalton100.0%11.5%(+88.5)#4418.1%(+81.9)#16,247
45.Lunenburg100.0%11.5%(+88.5)#4518.1%(+81.9)#16,327
46.Quechee100.0%11.5%(+88.5)#4618.1%(+81.9)#16,328
47.Jacksonville100.0%11.5%(+88.5)#4718.1%(+81.9)#16,442
48.Algiers100.0%11.5%(+88.5)#4818.1%(+81.9)#16,457
49.Gilman100.0%11.5%(+88.5)#4918.1%(+81.9)#16,471
50.Newport Center100.0%11.5%(+88.5)#5018.1%(+81.9)#16,495

Common Questions

What are the Top 10 Cities with the Lowest Poverty Level Among Children Under the Age of 5 in Vermont?
Top 10 Cities with the Lowest Poverty Level Among Children Under the Age of 5 in Vermont are:
What city has the Lowest Poverty Level Among Children Under the Age of 5 in Vermont?
Orleans has the Lowest Poverty Level Among Children Under the Age of 5 in Vermont with 5.9%.
What is the Poverty Level Among Children Under the Age of 5 in the State of Vermont?
Poverty Level Among Children Under the Age of 5 in Vermont is 11.5%.
What is the Poverty Level Among Children Under the Age of 5 in the United States?
Poverty Level Among Children Under the Age of 5 in the United States is 18.1%.