Waller, WA Map & Demographics
Waller Map
Waller Overview
$48,533
PER CAPITA INCOME
$123,720
AVG FAMILY INCOME
$112,500
AVG HOUSEHOLD INCOME
47.6%
WAGE / INCOME GAP [ % ]
52.4¢/ $1
WAGE / INCOME GAP [ $ ]
0.41
INEQUALITY / GINI INDEX
7,991
TOTAL POPULATION
3,800
MALE POPULATION
4,191
FEMALE POPULATION
90.67
MALES / 100 FEMALES
110.29
FEMALES / 100 MALES
42.4
MEDIAN AGE
3.1
AVG FAMILY SIZE
2.7
AVG HOUSEHOLD SIZE
3,912
LABOR FORCE [ PEOPLE ]
61.4%
PERCENT IN LABOR FORCE
3.6%
UNEMPLOYMENT RATE
Income in Waller
Income Overview in Waller
Per Capita Income in Waller is $48,533, while median incomes of families and households are $123,720 and $112,500 respectively.
| Characteristic | Number | Measure |
| Per Capita Income | 7,991 | $48,533 |
| Median Family Income | 2,100 | $123,720 |
| Mean Family Income | 2,100 | $148,319 |
| Median Household Income | 2,986 | $112,500 |
| Mean Household Income | 2,986 | $128,440 |
| Income Deficit | 2,100 | $0 |
| Wage / Income Gap (%) | 7,991 | 47.59% |
| Wage / Income Gap ($) | 7,991 | 52.41¢ per $1 |
| Gini / Inequality Index | 7,991 | 0.41 |
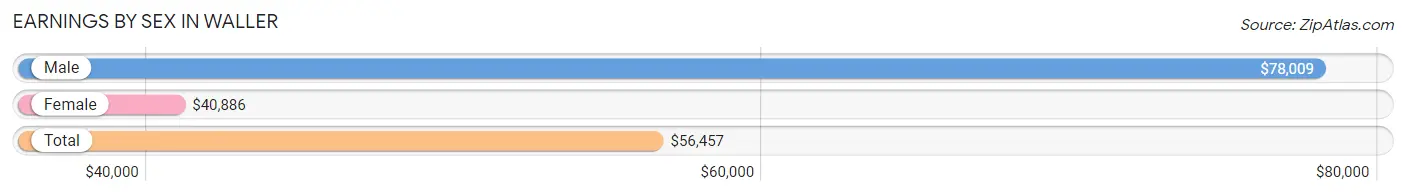
Earnings by Sex in Waller
Average Earnings in Waller are $56,457, $78,009 for men and $40,886 for women, a difference of 47.6%.
| Sex | Number | Average Earnings |
| Male | 2,132 (52.2%) | $78,009 |
| Female | 1,951 (47.8%) | $40,886 |
| Total | 4,083 (100.0%) | $56,457 |
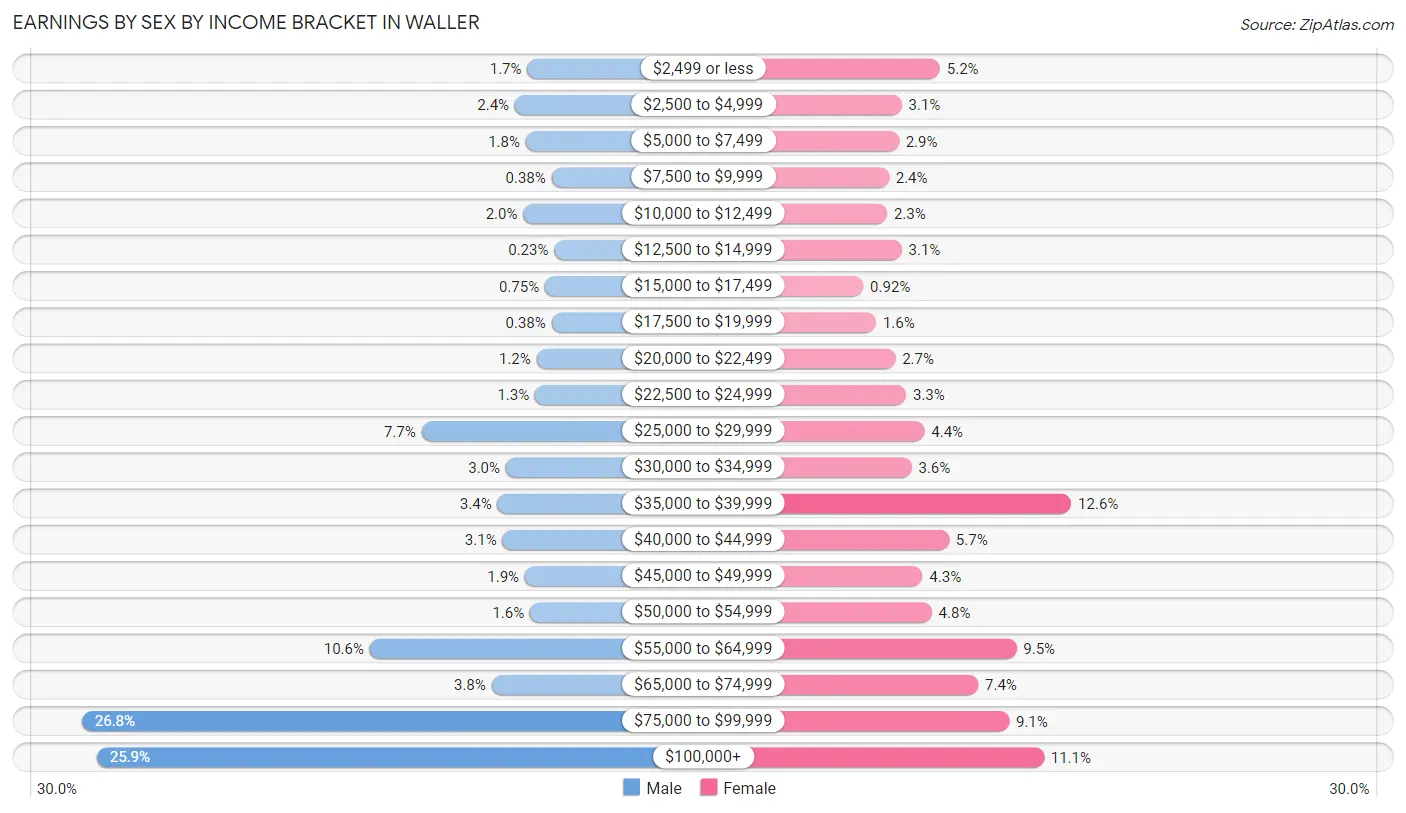
Earnings by Sex by Income Bracket in Waller
The most common earnings brackets in Waller are $75,000 to $99,999 for men (571 | 26.8%) and $35,000 to $39,999 for women (246 | 12.6%).
| Income | Male | Female |
| $2,499 or less | 37 (1.7%) | 102 (5.2%) |
| $2,500 to $4,999 | 52 (2.4%) | 60 (3.1%) |
| $5,000 to $7,499 | 39 (1.8%) | 57 (2.9%) |
| $7,500 to $9,999 | 8 (0.4%) | 46 (2.4%) |
| $10,000 to $12,499 | 42 (2.0%) | 44 (2.3%) |
| $12,500 to $14,999 | 5 (0.2%) | 60 (3.1%) |
| $15,000 to $17,499 | 16 (0.7%) | 18 (0.9%) |
| $17,500 to $19,999 | 8 (0.4%) | 32 (1.6%) |
| $20,000 to $22,499 | 26 (1.2%) | 53 (2.7%) |
| $22,500 to $24,999 | 28 (1.3%) | 65 (3.3%) |
| $25,000 to $29,999 | 164 (7.7%) | 85 (4.4%) |
| $30,000 to $34,999 | 63 (2.9%) | 71 (3.6%) |
| $35,000 to $39,999 | 73 (3.4%) | 246 (12.6%) |
| $40,000 to $44,999 | 67 (3.1%) | 112 (5.7%) |
| $45,000 to $49,999 | 40 (1.9%) | 83 (4.3%) |
| $50,000 to $54,999 | 34 (1.6%) | 93 (4.8%) |
| $55,000 to $64,999 | 226 (10.6%) | 186 (9.5%) |
| $65,000 to $74,999 | 80 (3.7%) | 144 (7.4%) |
| $75,000 to $99,999 | 571 (26.8%) | 178 (9.1%) |
| $100,000+ | 553 (25.9%) | 216 (11.1%) |
| Total | 2,132 (100.0%) | 1,951 (100.0%) |
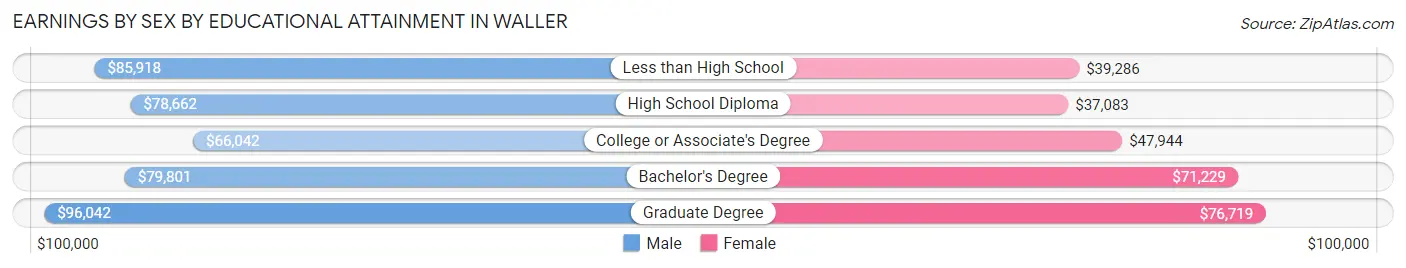
Earnings by Sex by Educational Attainment in Waller
Average earnings in Waller are $79,282 for men and $49,537 for women, a difference of 37.5%. Men with an educational attainment of graduate degree enjoy the highest average annual earnings of $96,042, while those with college or associate's degree education earn the least with $66,042. Women with an educational attainment of graduate degree earn the most with the average annual earnings of $76,719, while those with high school diploma education have the smallest earnings of $37,083.
| Educational Attainment | Male Income | Female Income |
| Less than High School | $85,918 | $39,286 |
| High School Diploma | $78,662 | $37,083 |
| College or Associate's Degree | $66,042 | $47,944 |
| Bachelor's Degree | $79,801 | $71,229 |
| Graduate Degree | $96,042 | $76,719 |
| Total | $79,282 | $49,537 |
Family Income in Waller
Family Income Brackets in Waller
According to the Waller family income data, there are 472 families falling into the $150,000 to $199,999 income range, which is the most common income bracket and makes up 22.5% of all families.
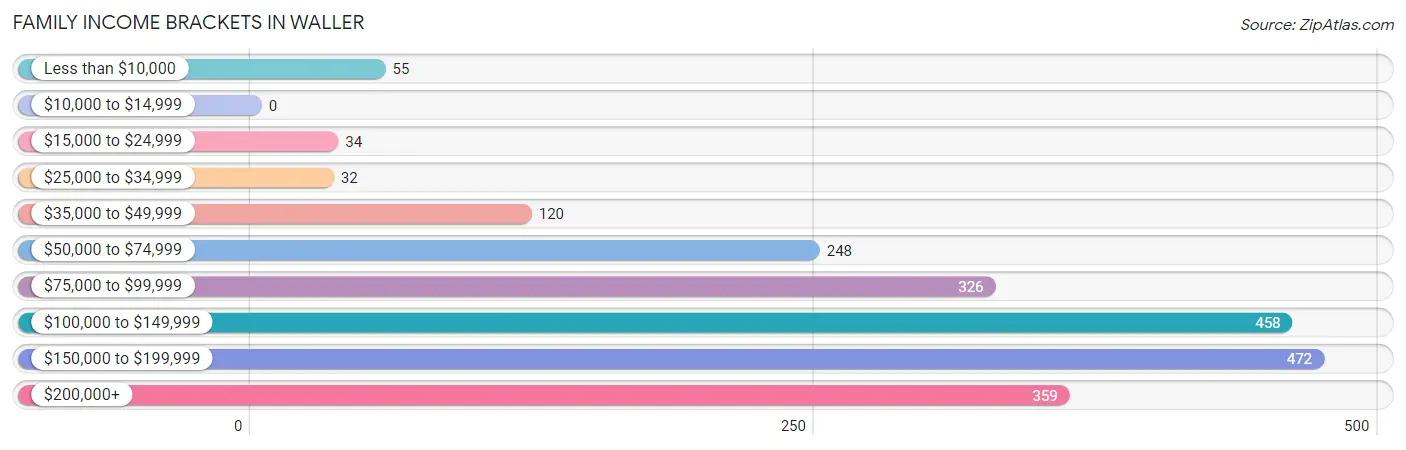
| Income Bracket | # Families | % Families |
| Less than $10,000 | 55 | 2.6% |
| $10,000 to $14,999 | 0 | 0.0% |
| $15,000 to $24,999 | 34 | 1.6% |
| $25,000 to $34,999 | 32 | 1.5% |
| $35,000 to $49,999 | 120 | 5.7% |
| $50,000 to $74,999 | 248 | 11.8% |
| $75,000 to $99,999 | 326 | 15.5% |
| $100,000 to $149,999 | 458 | 21.8% |
| $150,000 to $199,999 | 472 | 22.5% |
| $200,000+ | 359 | 17.1% |
Family Income by Famaliy Size in Waller
6-person families (54 | 2.6%) account for the highest median family income in Waller with $156,000 per family, while 2-person families (972 | 46.3%) have the highest median income of $62,361 per family member.
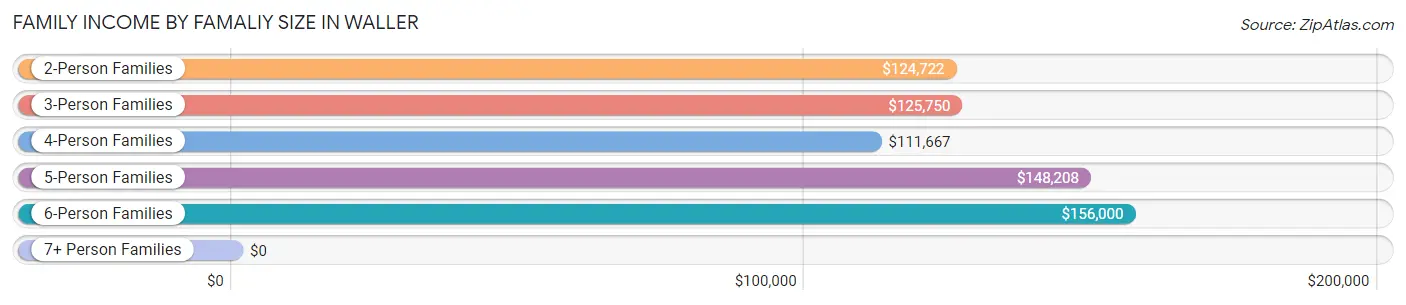
| Income Bracket | # Families | Median Income |
| 2-Person Families | 972 (46.3%) | $124,722 |
| 3-Person Families | 495 (23.6%) | $125,750 |
| 4-Person Families | 330 (15.7%) | $111,667 |
| 5-Person Families | 161 (7.7%) | $148,208 |
| 6-Person Families | 54 (2.6%) | $156,000 |
| 7+ Person Families | 88 (4.2%) | $0 |
| Total | 2,100 (100.0%) | $123,720 |
Family Income by Number of Earners in Waller
The median family income in Waller is $123,720, with families comprising 3+ earners (272) having the highest median family income of $175,750, while families with no earners (278) have the lowest median family income of $61,154, accounting for 13.0% and 13.2% of families, respectively.
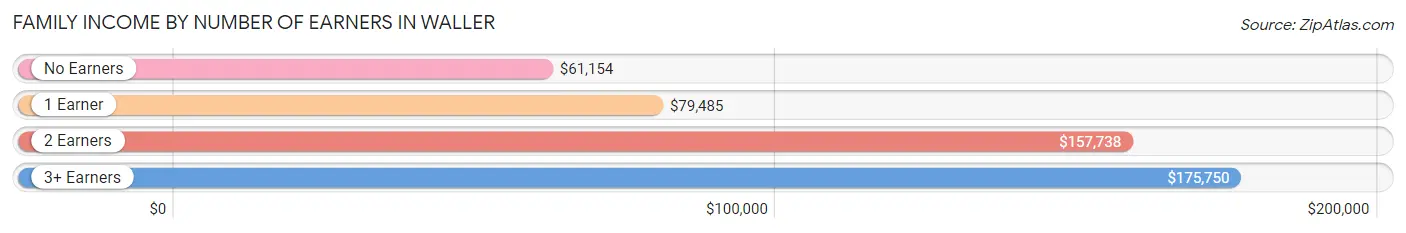
| Number of Earners | # Families | Median Income |
| No Earners | 278 (13.2%) | $61,154 |
| 1 Earner | 786 (37.4%) | $79,485 |
| 2 Earners | 764 (36.4%) | $157,738 |
| 3+ Earners | 272 (13.0%) | $175,750 |
| Total | 2,100 (100.0%) | $123,720 |
Household Income in Waller
Household Income Brackets in Waller
With 639 households falling in the category, the $100,000 to $149,999 income range is the most frequent in Waller, accounting for 21.4% of all households. In contrast, only 42 households (1.4%) fall into the $10,000 to $14,999 income bracket, making it the least populous group.
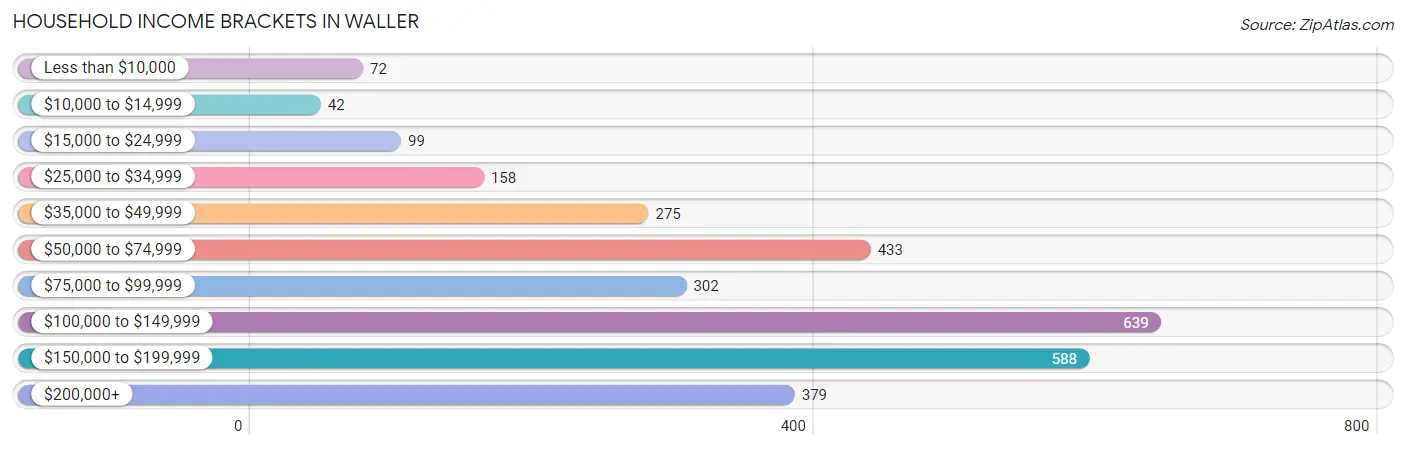
| Income Bracket | # Households | % Households |
| Less than $10,000 | 72 | 2.4% |
| $10,000 to $14,999 | 42 | 1.4% |
| $15,000 to $24,999 | 99 | 3.3% |
| $25,000 to $34,999 | 158 | 5.3% |
| $35,000 to $49,999 | 275 | 9.2% |
| $50,000 to $74,999 | 433 | 14.5% |
| $75,000 to $99,999 | 302 | 10.1% |
| $100,000 to $149,999 | 639 | 21.4% |
| $150,000 to $199,999 | 588 | 19.7% |
| $200,000+ | 379 | 12.7% |
Household Income by Householder Age in Waller
The median household income in Waller is $112,500, with the highest median household income of $124,338 found in the 25 to 44 years age bracket for the primary householder. A total of 785 households (26.3%) fall into this category. Meanwhile, the 15 to 24 years age bracket for the primary householder has the lowest median household income of $0, with 43 households (1.4%) in this group.
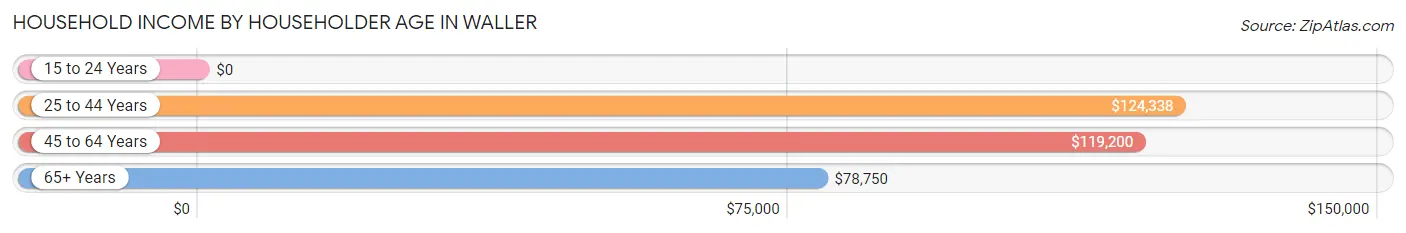
| Income Bracket | # Households | Median Income |
| 15 to 24 Years | 43 (1.4%) | $0 |
| 25 to 44 Years | 785 (26.3%) | $124,338 |
| 45 to 64 Years | 1,270 (42.5%) | $119,200 |
| 65+ Years | 888 (29.7%) | $78,750 |
| Total | 2,986 (100.0%) | $112,500 |
Poverty in Waller
Income Below Poverty by Sex and Age in Waller
With 6.7% poverty level for males and 8.6% for females among the residents of Waller, 15 year old males and 15 year old females are the most vulnerable to poverty, with 46 males (46.0%) and 8 females (40.0%) in their respective age groups living below the poverty level.
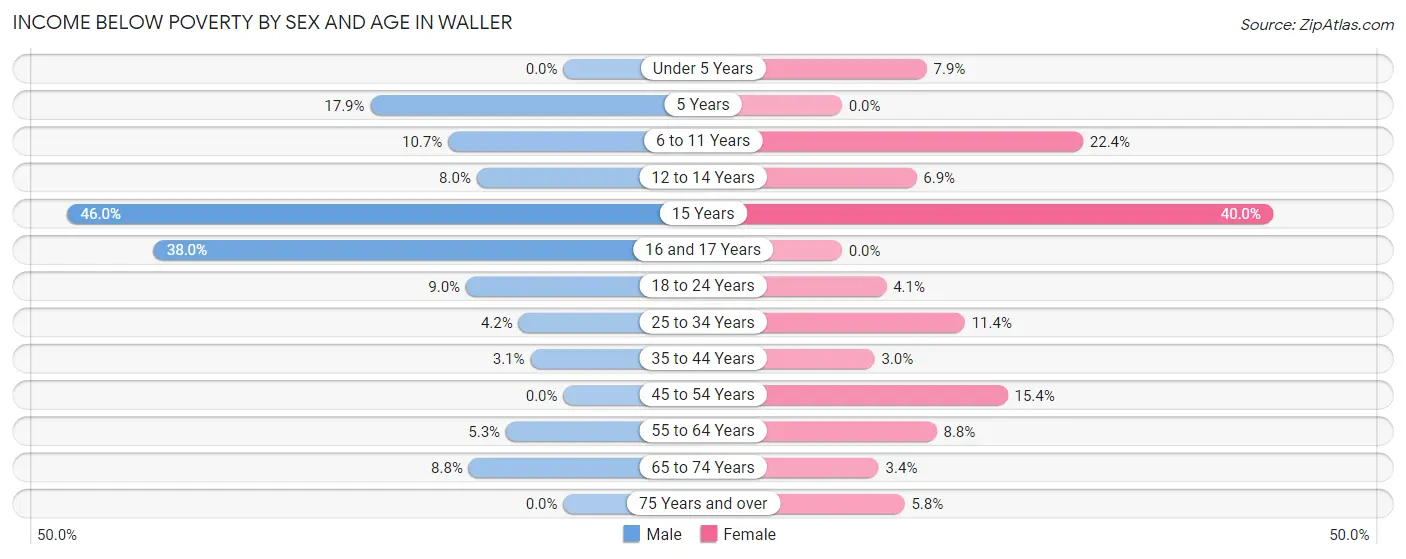
| Age Bracket | Male | Female |
| Under 5 Years | 0 (0.0%) | 31 (7.9%) |
| 5 Years | 12 (17.9%) | 0 (0.0%) |
| 6 to 11 Years | 32 (10.7%) | 66 (22.4%) |
| 12 to 14 Years | 9 (8.0%) | 9 (6.9%) |
| 15 Years | 46 (46.0%) | 8 (40.0%) |
| 16 and 17 Years | 38 (38.0%) | 0 (0.0%) |
| 18 to 24 Years | 17 (9.0%) | 14 (4.1%) |
| 25 to 34 Years | 21 (4.2%) | 43 (11.4%) |
| 35 to 44 Years | 14 (3.1%) | 16 (3.0%) |
| 45 to 54 Years | 0 (0.0%) | 74 (15.4%) |
| 55 to 64 Years | 30 (5.3%) | 61 (8.8%) |
| 65 to 74 Years | 36 (8.8%) | 15 (3.4%) |
| 75 Years and over | 0 (0.0%) | 21 (5.8%) |
| Total | 255 (6.7%) | 358 (8.6%) |
Income Above Poverty by Sex and Age in Waller
According to the poverty statistics in Waller, males aged under 5 years and females aged 5 years are the age groups that are most secure financially, with 100.0% of males and 100.0% of females in these age groups living above the poverty line.
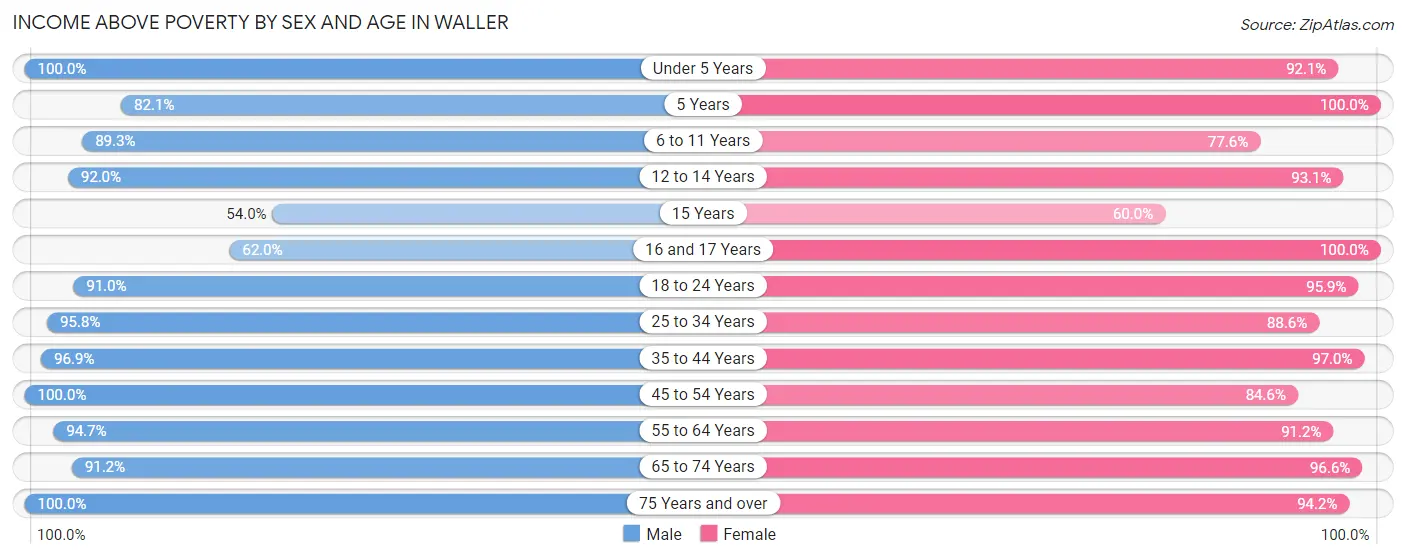
| Age Bracket | Male | Female |
| Under 5 Years | 191 (100.0%) | 363 (92.1%) |
| 5 Years | 55 (82.1%) | 6 (100.0%) |
| 6 to 11 Years | 267 (89.3%) | 229 (77.6%) |
| 12 to 14 Years | 103 (92.0%) | 121 (93.1%) |
| 15 Years | 54 (54.0%) | 12 (60.0%) |
| 16 and 17 Years | 62 (62.0%) | 121 (100.0%) |
| 18 to 24 Years | 171 (91.0%) | 326 (95.9%) |
| 25 to 34 Years | 484 (95.8%) | 334 (88.6%) |
| 35 to 44 Years | 443 (96.9%) | 512 (97.0%) |
| 45 to 54 Years | 546 (100.0%) | 407 (84.6%) |
| 55 to 64 Years | 533 (94.7%) | 633 (91.2%) |
| 65 to 74 Years | 374 (91.2%) | 423 (96.6%) |
| 75 Years and over | 262 (100.0%) | 340 (94.2%) |
| Total | 3,545 (93.3%) | 3,827 (91.4%) |
Income Below Poverty Among Married-Couple Families in Waller
The poverty statistics for married-couple families in Waller show that 0.6% or 9 of the total 1,594 families live below the poverty line. Families with 5 or more children have the highest poverty rate of 17.0%, comprising of 9 families. On the other hand, families with no children have the lowest poverty rate of 0.0%, which includes 0 families.
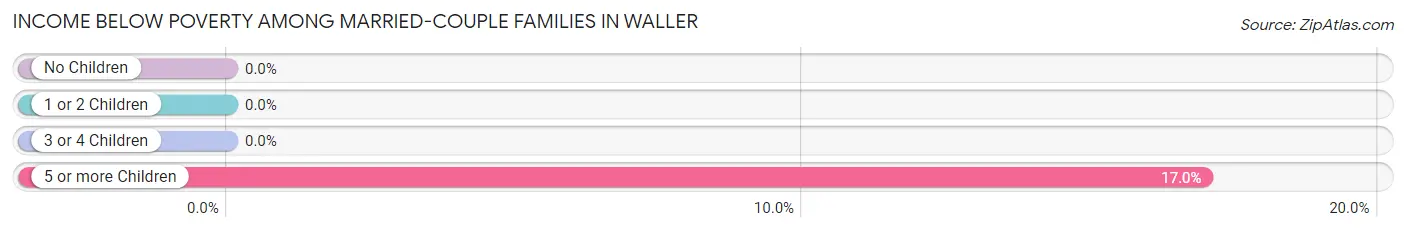
| Children | Above Poverty | Below Poverty |
| No Children | 990 (100.0%) | 0 (0.0%) |
| 1 or 2 Children | 442 (100.0%) | 0 (0.0%) |
| 3 or 4 Children | 109 (100.0%) | 0 (0.0%) |
| 5 or more Children | 44 (83.0%) | 9 (17.0%) |
| Total | 1,585 (99.4%) | 9 (0.6%) |
Income Below Poverty Among Single-Parent Households in Waller
According to the poverty data in Waller, 14.3% or 38 single-father households and 11.7% or 28 single-mother households are living below the poverty line. Among single-father households, those with 1 or 2 children have the highest poverty rate, with 38 households (23.6%) experiencing poverty. Likewise, among single-mother households, those with 5 or more children have the highest poverty rate, with 12 households (100.0%) falling below the poverty line.
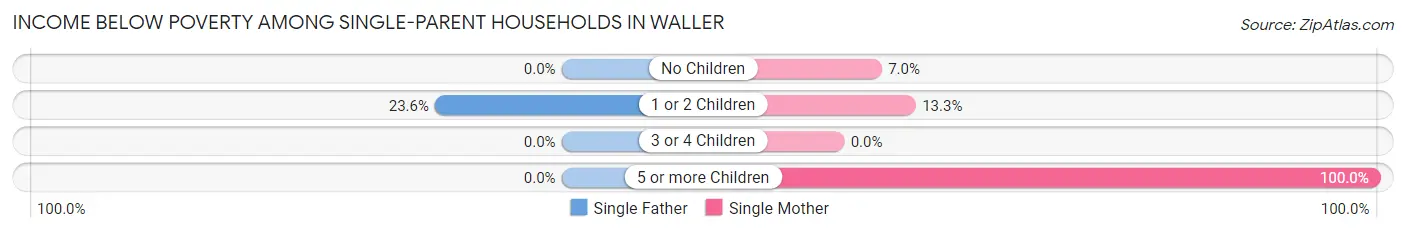
| Children | Single Father | Single Mother |
| No Children | 0 (0.0%) | 10 (7.0%) |
| 1 or 2 Children | 38 (23.6%) | 6 (13.3%) |
| 3 or 4 Children | 0 (0.0%) | 0 (0.0%) |
| 5 or more Children | 0 (0.0%) | 12 (100.0%) |
| Total | 38 (14.3%) | 28 (11.7%) |
Income Below Poverty Among Married-Couple vs Single-Parent Households in Waller
The poverty data for Waller shows that 9 of the married-couple family households (0.6%) and 66 of the single-parent households (13.0%) are living below the poverty level. Within the married-couple family households, those with 5 or more children have the highest poverty rate, with 9 households (17.0%) falling below the poverty line. Among the single-parent households, those with 5 or more children have the highest poverty rate, with 12 household (100.0%) living below poverty.
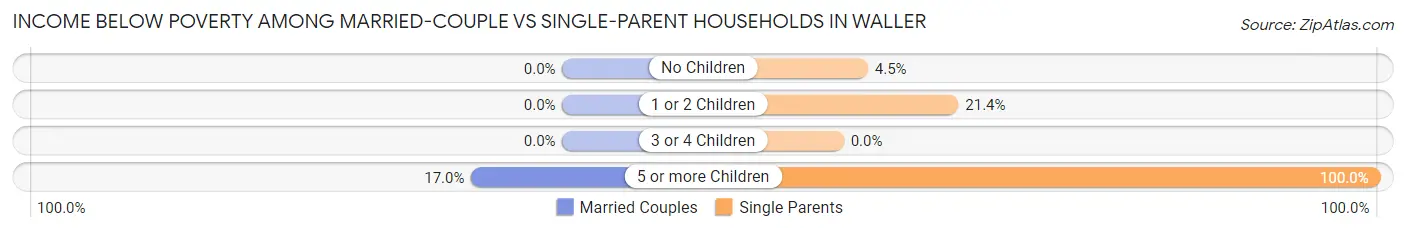
| Children | Married-Couple Families | Single-Parent Households |
| No Children | 0 (0.0%) | 10 (4.5%) |
| 1 or 2 Children | 0 (0.0%) | 44 (21.4%) |
| 3 or 4 Children | 0 (0.0%) | 0 (0.0%) |
| 5 or more Children | 9 (17.0%) | 12 (100.0%) |
| Total | 9 (0.6%) | 66 (13.0%) |
Race in Waller
The most populous races in Waller are White / Caucasian (6,341 | 79.3%), Two or more Races (825 | 10.3%), and Hispanic or Latino (803 | 10.1%).
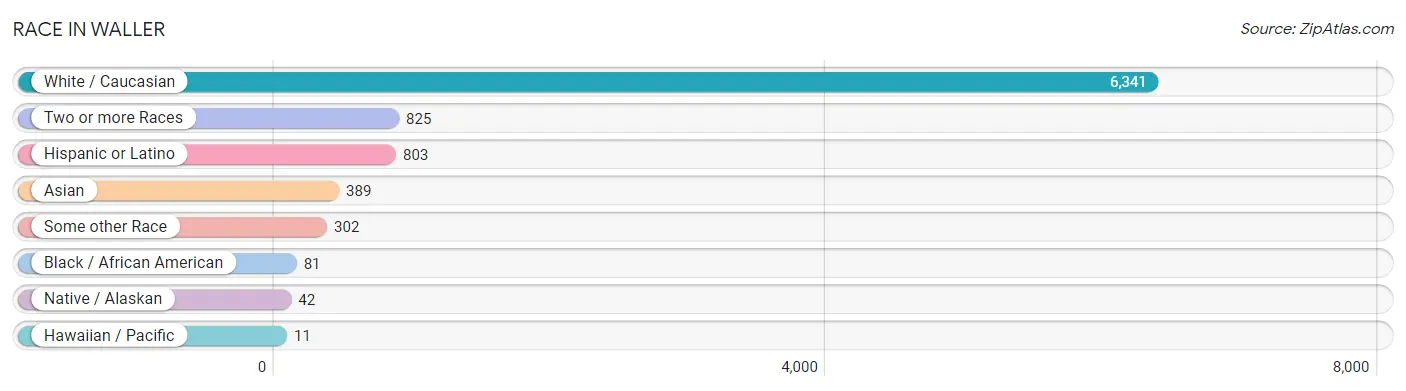
| Race | # Population | % Population |
| Asian | 389 | 4.9% |
| Black / African American | 81 | 1.0% |
| Hawaiian / Pacific | 11 | 0.1% |
| Hispanic or Latino | 803 | 10.1% |
| Native / Alaskan | 42 | 0.5% |
| White / Caucasian | 6,341 | 79.3% |
| Two or more Races | 825 | 10.3% |
| Some other Race | 302 | 3.8% |
| Total | 7,991 | 100.0% |
Ancestry in Waller
The most populous ancestries reported in Waller are German (1,326 | 16.6%), Irish (1,127 | 14.1%), English (1,027 | 12.9%), Mexican (663 | 8.3%), and Norwegian (523 | 6.5%), together accounting for 58.4% of all Waller residents.
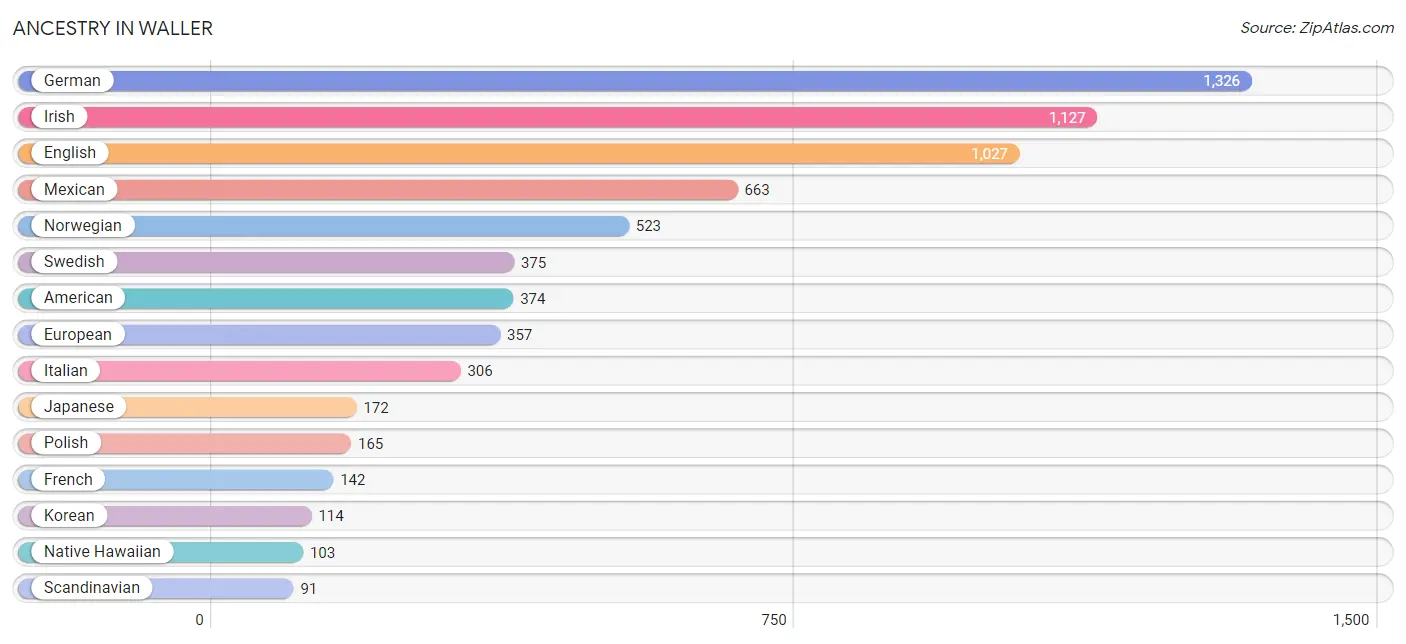
| Ancestry | # Population | % Population |
| American | 374 | 4.7% |
| Arab | 12 | 0.2% |
| Austrian | 6 | 0.1% |
| Bhutanese | 17 | 0.2% |
| British | 24 | 0.3% |
| Burmese | 84 | 1.1% |
| Canadian | 6 | 0.1% |
| Central American | 81 | 1.0% |
| Central American Indian | 24 | 0.3% |
| Cherokee | 18 | 0.2% |
| Chilean | 22 | 0.3% |
| Colville | 10 | 0.1% |
| Croatian | 8 | 0.1% |
| Cuban | 10 | 0.1% |
| Czech | 22 | 0.3% |
| Danish | 78 | 1.0% |
| Dutch | 63 | 0.8% |
| Eastern European | 55 | 0.7% |
| English | 1,027 | 12.9% |
| European | 357 | 4.5% |
| Fijian | 1 | 0.0% |
| Finnish | 12 | 0.2% |
| French | 142 | 1.8% |
| French Canadian | 60 | 0.7% |
| German | 1,326 | 16.6% |
| Greek | 8 | 0.1% |
| Hungarian | 9 | 0.1% |
| Indian (Asian) | 33 | 0.4% |
| Irish | 1,127 | 14.1% |
| Iroquois | 5 | 0.1% |
| Italian | 306 | 3.8% |
| Japanese | 172 | 2.1% |
| Korean | 114 | 1.4% |
| Lithuanian | 4 | 0.1% |
| Mexican | 663 | 8.3% |
| Native Hawaiian | 103 | 1.3% |
| Nicaraguan | 19 | 0.2% |
| Northern European | 24 | 0.3% |
| Norwegian | 523 | 6.5% |
| Pakistani | 18 | 0.2% |
| Palestinian | 7 | 0.1% |
| Pennsylvania German | 4 | 0.1% |
| Polish | 165 | 2.1% |
| Puerto Rican | 7 | 0.1% |
| Puget Sound Salish | 29 | 0.4% |
| Romanian | 4 | 0.1% |
| Russian | 9 | 0.1% |
| Salvadoran | 62 | 0.8% |
| Samoan | 11 | 0.1% |
| Scandinavian | 91 | 1.1% |
| Scotch-Irish | 52 | 0.6% |
| Scottish | 75 | 0.9% |
| Serbian | 13 | 0.2% |
| Slavic | 15 | 0.2% |
| Slovak | 19 | 0.2% |
| Slovene | 4 | 0.1% |
| South American | 23 | 0.3% |
| South American Indian | 1 | 0.0% |
| Sri Lankan | 28 | 0.4% |
| Swedish | 375 | 4.7% |
| Swiss | 16 | 0.2% |
| Syrian | 5 | 0.1% |
| Thai | 28 | 0.4% |
| Ukrainian | 9 | 0.1% |
| Venezuelan | 1 | 0.0% |
| Welsh | 27 | 0.3% |
| West Indian | 5 | 0.1% |
| Yugoslavian | 5 | 0.1% | View All 68 Rows |
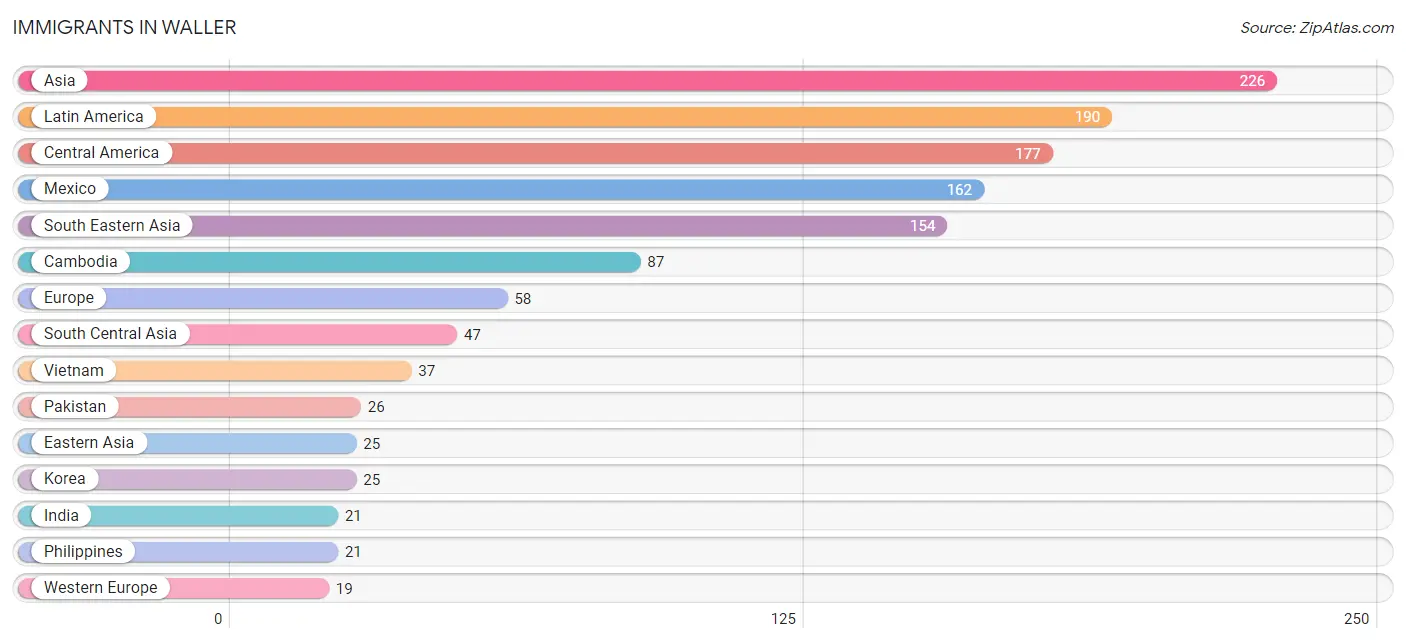
Immigrants in Waller
The most numerous immigrant groups reported in Waller came from Asia (226 | 2.8%), Latin America (190 | 2.4%), Central America (177 | 2.2%), Mexico (162 | 2.0%), and South Eastern Asia (154 | 1.9%), together accounting for 11.4% of all Waller residents.
| Immigration Origin | # Population | % Population |
| Asia | 226 | 2.8% |
| Cambodia | 87 | 1.1% |
| Canada | 5 | 0.1% |
| Caribbean | 7 | 0.1% |
| Central America | 177 | 2.2% |
| Chile | 5 | 0.1% |
| Cuba | 7 | 0.1% |
| Eastern Asia | 25 | 0.3% |
| Eastern Europe | 18 | 0.2% |
| El Salvador | 15 | 0.2% |
| England | 15 | 0.2% |
| Europe | 58 | 0.7% |
| Germany | 16 | 0.2% |
| India | 21 | 0.3% |
| Italy | 6 | 0.1% |
| Korea | 25 | 0.3% |
| Latin America | 190 | 2.4% |
| Mexico | 162 | 2.0% |
| Netherlands | 3 | 0.0% |
| Northern Europe | 15 | 0.2% |
| Oceania | 1 | 0.0% |
| Pakistan | 26 | 0.3% |
| Philippines | 21 | 0.3% |
| Russia | 6 | 0.1% |
| South America | 6 | 0.1% |
| South Central Asia | 47 | 0.6% |
| South Eastern Asia | 154 | 1.9% |
| Southern Europe | 6 | 0.1% |
| Thailand | 9 | 0.1% |
| Ukraine | 12 | 0.2% |
| Venezuela | 1 | 0.0% |
| Vietnam | 37 | 0.5% |
| Western Europe | 19 | 0.2% | View All 33 Rows |
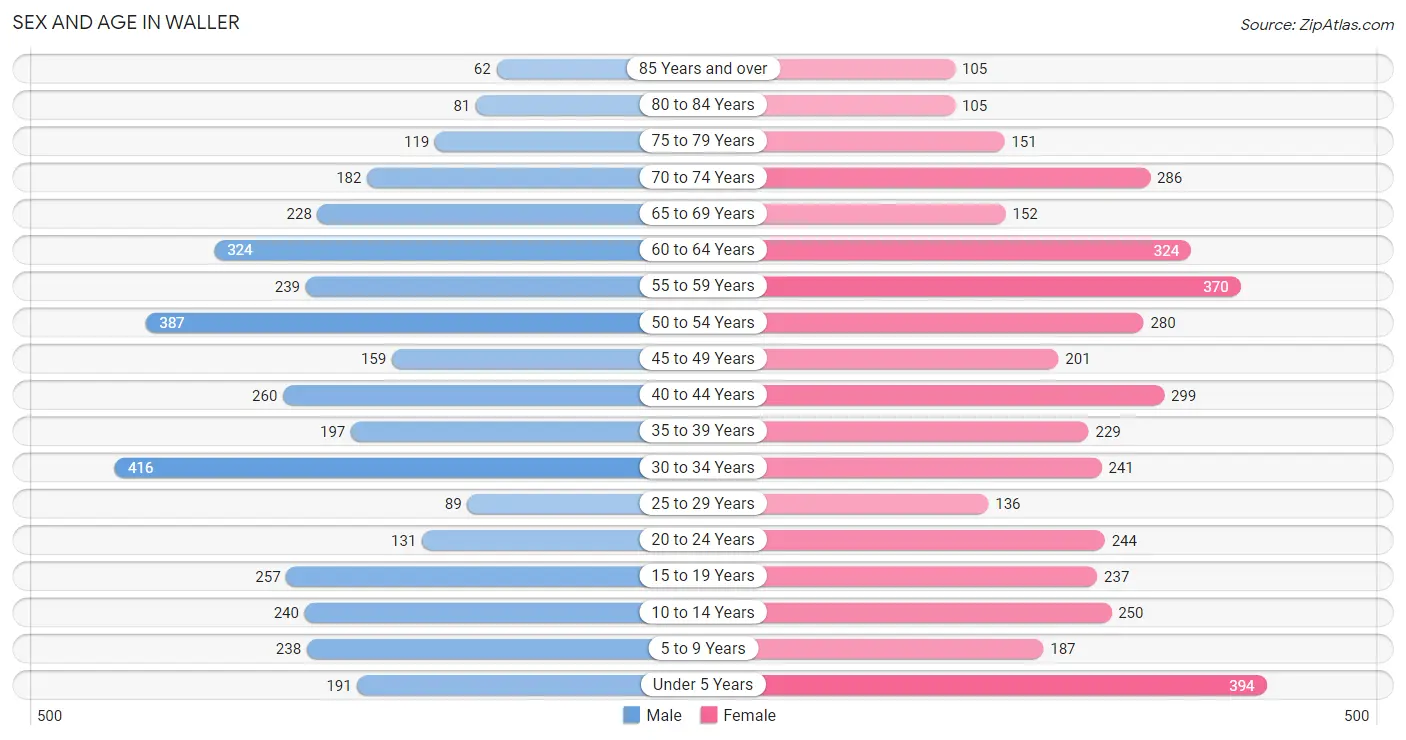
Sex and Age in Waller
Sex and Age in Waller
The most populous age groups in Waller are 30 to 34 Years (416 | 11.0%) for men and Under 5 Years (394 | 9.4%) for women.
| Age Bracket | Male | Female |
| Under 5 Years | 191 (5.0%) | 394 (9.4%) |
| 5 to 9 Years | 238 (6.3%) | 187 (4.5%) |
| 10 to 14 Years | 240 (6.3%) | 250 (6.0%) |
| 15 to 19 Years | 257 (6.8%) | 237 (5.7%) |
| 20 to 24 Years | 131 (3.5%) | 244 (5.8%) |
| 25 to 29 Years | 89 (2.3%) | 136 (3.3%) |
| 30 to 34 Years | 416 (11.0%) | 241 (5.8%) |
| 35 to 39 Years | 197 (5.2%) | 229 (5.5%) |
| 40 to 44 Years | 260 (6.8%) | 299 (7.1%) |
| 45 to 49 Years | 159 (4.2%) | 201 (4.8%) |
| 50 to 54 Years | 387 (10.2%) | 280 (6.7%) |
| 55 to 59 Years | 239 (6.3%) | 370 (8.8%) |
| 60 to 64 Years | 324 (8.5%) | 324 (7.7%) |
| 65 to 69 Years | 228 (6.0%) | 152 (3.6%) |
| 70 to 74 Years | 182 (4.8%) | 286 (6.8%) |
| 75 to 79 Years | 119 (3.1%) | 151 (3.6%) |
| 80 to 84 Years | 81 (2.1%) | 105 (2.5%) |
| 85 Years and over | 62 (1.6%) | 105 (2.5%) |
| Total | 3,800 (100.0%) | 4,191 (100.0%) |
Families and Households in Waller
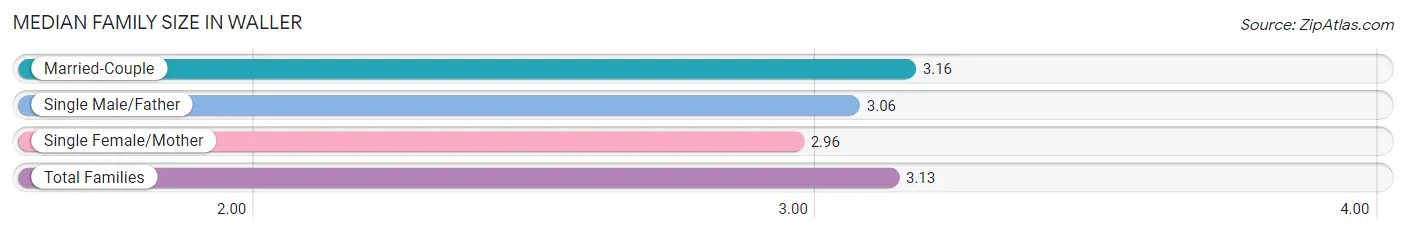
Median Family Size in Waller
The median family size in Waller is 3.13 persons per family, with married-couple families (1,594 | 75.9%) accounting for the largest median family size of 3.16 persons per family. On the other hand, single female/mother families (240 | 11.4%) represent the smallest median family size with 2.96 persons per family.
| Family Type | # Families | Family Size |
| Married-Couple | 1,594 (75.9%) | 3.16 |
| Single Male/Father | 266 (12.7%) | 3.06 |
| Single Female/Mother | 240 (11.4%) | 2.96 |
| Total Families | 2,100 (100.0%) | 3.13 |
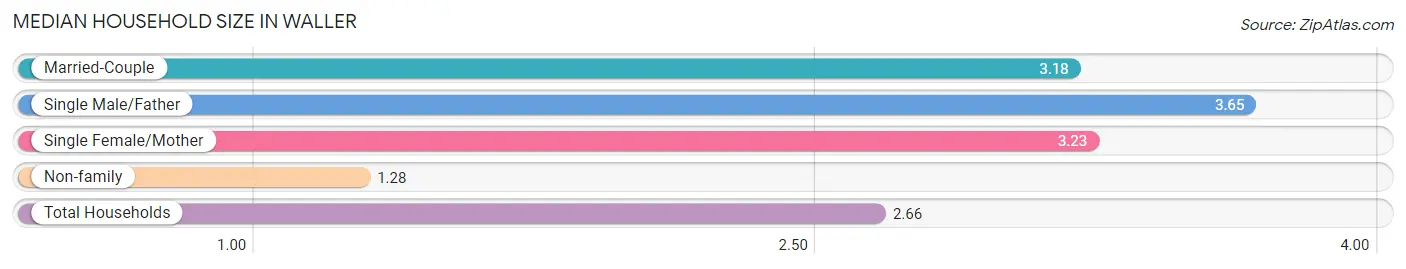
Median Household Size in Waller
The median household size in Waller is 2.66 persons per household, with single male/father households (266 | 8.9%) accounting for the largest median household size of 3.65 persons per household. non-family households (886 | 29.7%) represent the smallest median household size with 1.28 persons per household.
| Household Type | # Households | Household Size |
| Married-Couple | 1,594 (53.4%) | 3.18 |
| Single Male/Father | 266 (8.9%) | 3.65 |
| Single Female/Mother | 240 (8.0%) | 3.23 |
| Non-family | 886 (29.7%) | 1.28 |
| Total Households | 2,986 (100.0%) | 2.66 |
Household Size by Marriage Status in Waller
Out of a total of 2,986 households in Waller, 2,100 (70.3%) are family households, while 886 (29.7%) are nonfamily households. The most numerous type of family households are 2-person households, comprising 929, and the most common type of nonfamily households are 1-person households, comprising 728.
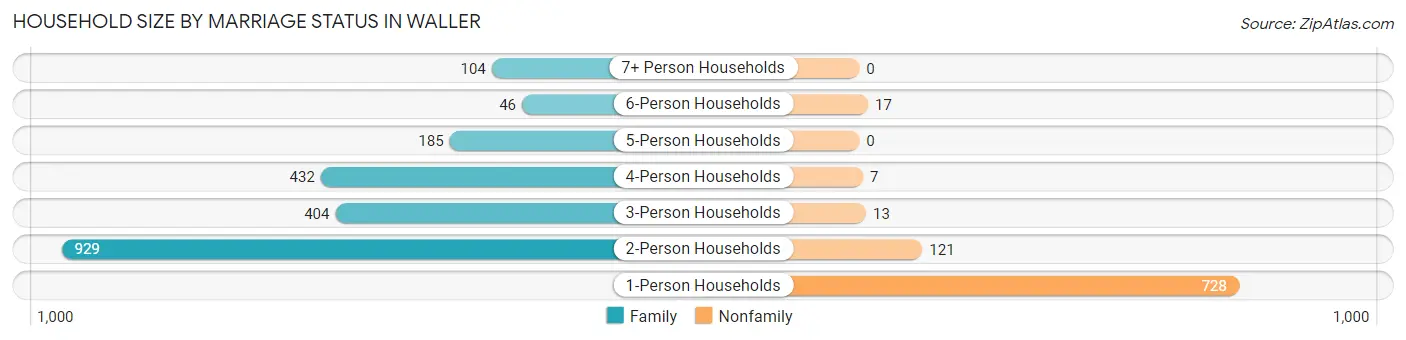
| Household Size | Family Households | Nonfamily Households |
| 1-Person Households | - | 728 (24.4%) |
| 2-Person Households | 929 (31.1%) | 121 (4.1%) |
| 3-Person Households | 404 (13.5%) | 13 (0.4%) |
| 4-Person Households | 432 (14.5%) | 7 (0.2%) |
| 5-Person Households | 185 (6.2%) | 0 (0.0%) |
| 6-Person Households | 46 (1.5%) | 17 (0.6%) |
| 7+ Person Households | 104 (3.5%) | 0 (0.0%) |
| Total | 2,100 (70.3%) | 886 (29.7%) |
Female Fertility in Waller
Fertility by Age in Waller
Average fertility rate in Waller is 18.0 births per 1,000 women. Women in the age bracket of 20 to 34 years have the highest fertility rate with 39.0 births per 1,000 women. Women in the age bracket of 20 to 34 years acount for 82.8% of all women with births.
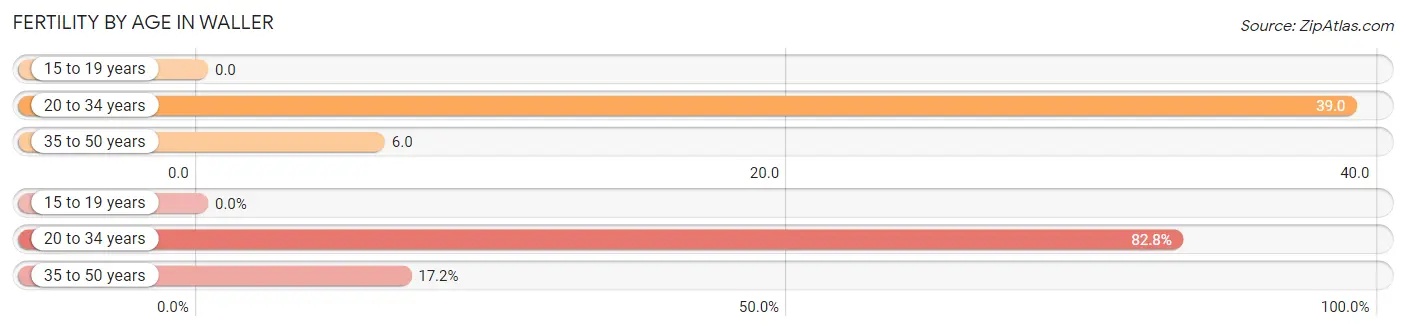
| Age Bracket | Women with Births | Births / 1,000 Women |
| 15 to 19 years | 0 (0.0%) | 0.0 |
| 20 to 34 years | 24 (82.8%) | 39.0 |
| 35 to 50 years | 5 (17.2%) | 6.0 |
| Total | 29 (100.0%) | 18.0 |
Fertility by Age by Marriage Status in Waller
34.5% of women with births (29) in Waller are married. The highest percentage of unmarried women with births falls into 20 to 34 years age bracket with 79.2% of them unmarried at the time of birth, while the lowest percentage of unmarried women with births belong to 35 to 50 years age bracket with 0.0% of them unmarried.
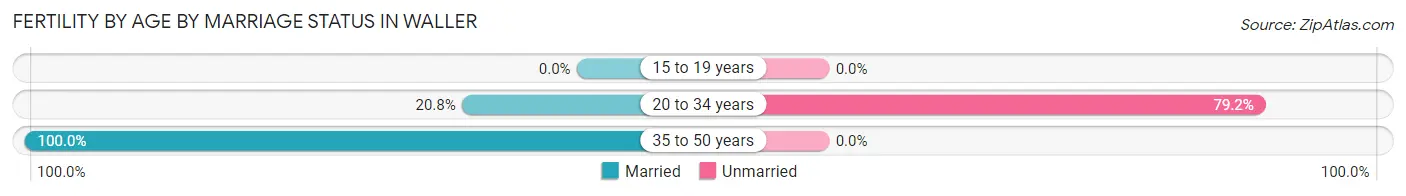
| Age Bracket | Married | Unmarried |
| 15 to 19 years | 0 (0.0%) | 0 (0.0%) |
| 20 to 34 years | 5 (20.8%) | 19 (79.2%) |
| 35 to 50 years | 5 (100.0%) | 0 (0.0%) |
| Total | 10 (34.5%) | 19 (65.5%) |
Fertility by Education in Waller
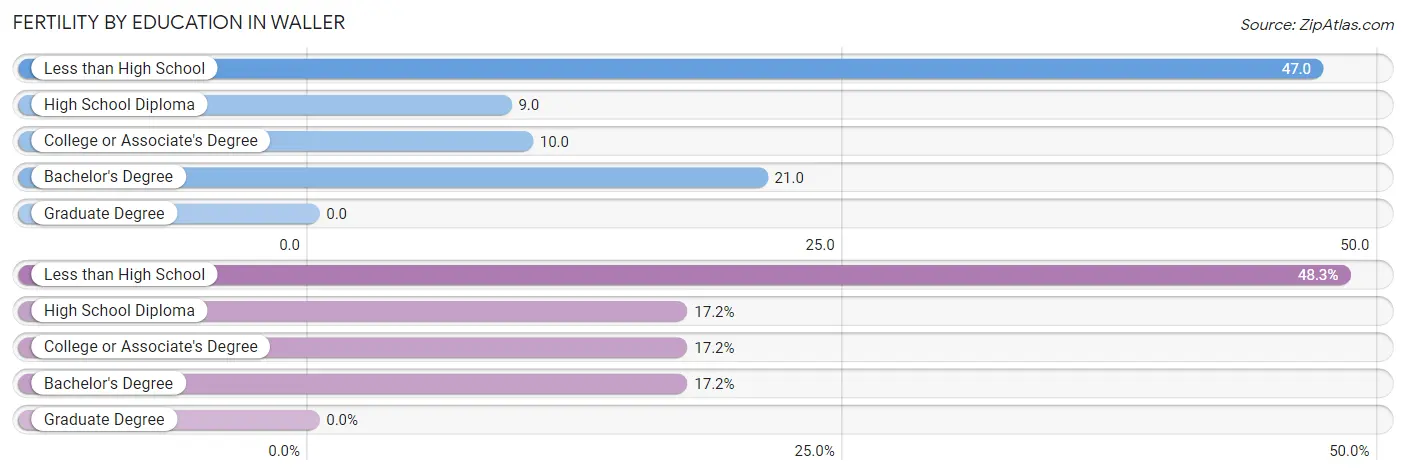
| Educational Attainment | Women with Births | Births / 1,000 Women |
| Less than High School | 14 (48.3%) | 47.0 |
| High School Diploma | 5 (17.2%) | 9.0 |
| College or Associate's Degree | 5 (17.2%) | 10.0 |
| Bachelor's Degree | 5 (17.2%) | 21.0 |
| Graduate Degree | 0 (0.0%) | 0.0 |
| Total | 29 (100.0%) | 18.0 |
Fertility by Education by Marriage Status in Waller
65.5% of women with births in Waller are unmarried. Women with the educational attainment of college or associate's degree are most likely to be married with 100.0% of them married at childbirth, while women with the educational attainment of less than high school are least likely to be married with 100.0% of them unmarried at childbirth.
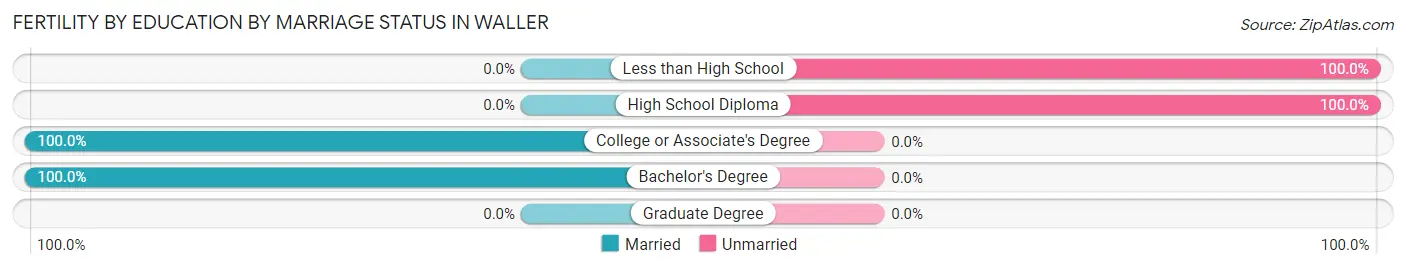
| Educational Attainment | Married | Unmarried |
| Less than High School | 0 (0.0%) | 14 (100.0%) |
| High School Diploma | 0 (0.0%) | 5 (100.0%) |
| College or Associate's Degree | 5 (100.0%) | 0 (0.0%) |
| Bachelor's Degree | 5 (100.0%) | 0 (0.0%) |
| Graduate Degree | 0 (0.0%) | 0 (0.0%) |
| Total | 10 (34.5%) | 19 (65.5%) |
Employment Characteristics in Waller
Employment by Class of Employer in Waller
Among the 3,641 employed individuals in Waller, private company employees (2,495 | 68.5%), local government employees (428 | 11.8%), and not-for-profit organizations (236 | 6.5%) make up the most common classes of employment.
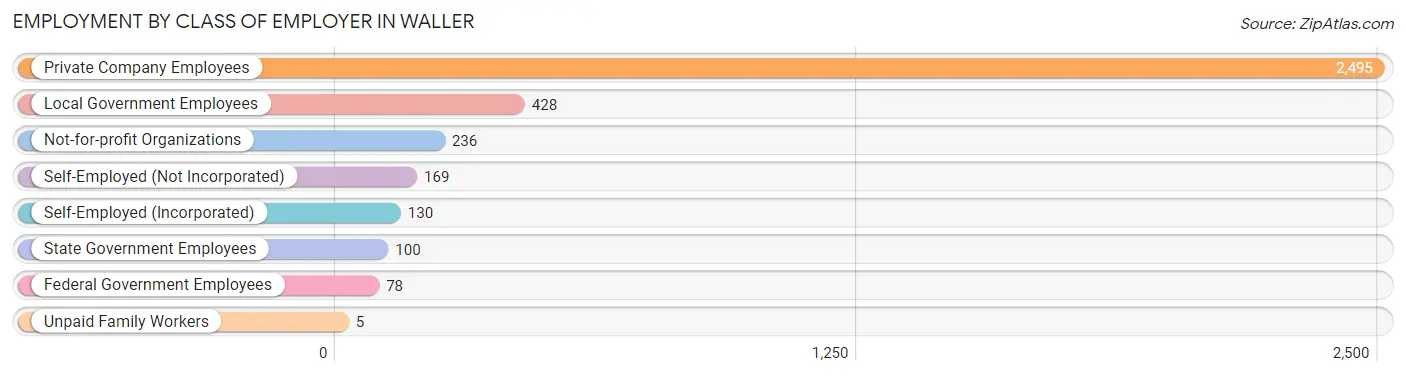
| Employer Class | # Employees | % Employees |
| Private Company Employees | 2,495 | 68.5% |
| Self-Employed (Incorporated) | 130 | 3.6% |
| Self-Employed (Not Incorporated) | 169 | 4.6% |
| Not-for-profit Organizations | 236 | 6.5% |
| Local Government Employees | 428 | 11.8% |
| State Government Employees | 100 | 2.8% |
| Federal Government Employees | 78 | 2.1% |
| Unpaid Family Workers | 5 | 0.1% |
| Total | 3,641 | 100.0% |
Employment Status by Age in Waller
According to the labor force statistics for Waller, out of the total population over 16 years of age (6,371), 61.4% or 3,912 individuals are in the labor force, with 3.6% or 141 of them unemployed. The age group with the highest labor force participation rate is 45 to 54 years, with 82.2% or 844 individuals in the labor force. Within the labor force, the 16 to 19 years age range has the highest percentage of unemployed individuals, with 25.4% or 29 of them being unemployed.
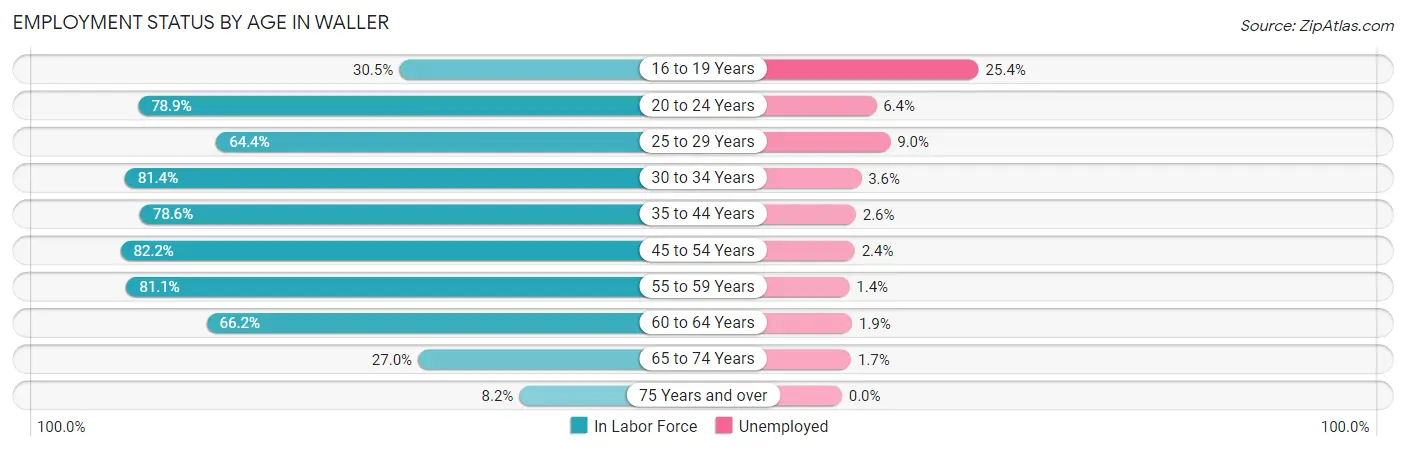
| Age Bracket | In Labor Force | Unemployed |
| 16 to 19 Years | 114 (30.5%) | 29 (25.4%) |
| 20 to 24 Years | 296 (78.9%) | 19 (6.4%) |
| 25 to 29 Years | 145 (64.4%) | 13 (9.0%) |
| 30 to 34 Years | 535 (81.4%) | 19 (3.6%) |
| 35 to 44 Years | 774 (78.6%) | 20 (2.6%) |
| 45 to 54 Years | 844 (82.2%) | 20 (2.4%) |
| 55 to 59 Years | 494 (81.1%) | 7 (1.4%) |
| 60 to 64 Years | 429 (66.2%) | 8 (1.9%) |
| 65 to 74 Years | 229 (27.0%) | 4 (1.7%) |
| 75 Years and over | 51 (8.2%) | 0 (0.0%) |
| Total | 3,912 (61.4%) | 141 (3.6%) |
Employment Status by Educational Attainment in Waller
According to labor force statistics for Waller, 77.6% of individuals (3,221) out of the total population between 25 and 64 years of age (4,151) are in the labor force, with 2.7% or 87 of them being unemployed. The group with the highest labor force participation rate are those with the educational attainment of bachelor's degree or higher, with 87.9% or 897 individuals in the labor force. Within the labor force, individuals with college / associate degree education have the highest percentage of unemployment, with 4.5% or 58 of them being unemployed.
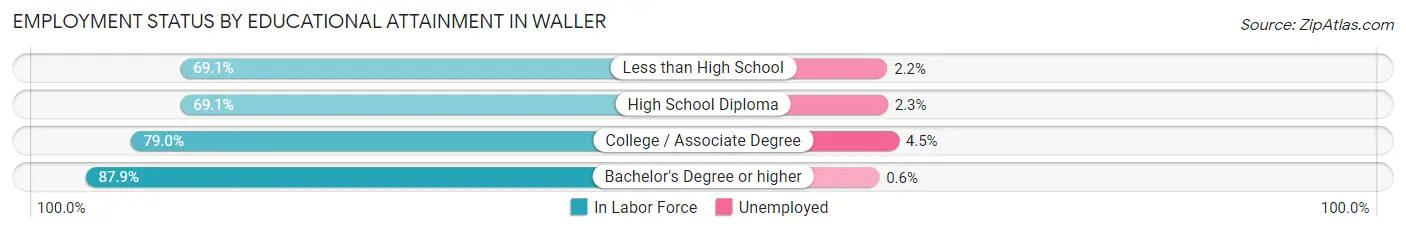
| Educational Attainment | In Labor Force | Unemployed |
| Less than High School | 273 (69.1%) | 9 (2.2%) |
| High School Diploma | 768 (69.1%) | 26 (2.3%) |
| College / Associate Degree | 1,284 (79.0%) | 73 (4.5%) |
| Bachelor's Degree or higher | 897 (87.9%) | 6 (0.6%) |
| Total | 3,221 (77.6%) | 112 (2.7%) |
Employment Occupations by Sex in Waller
Management, Business, Science and Arts Occupations
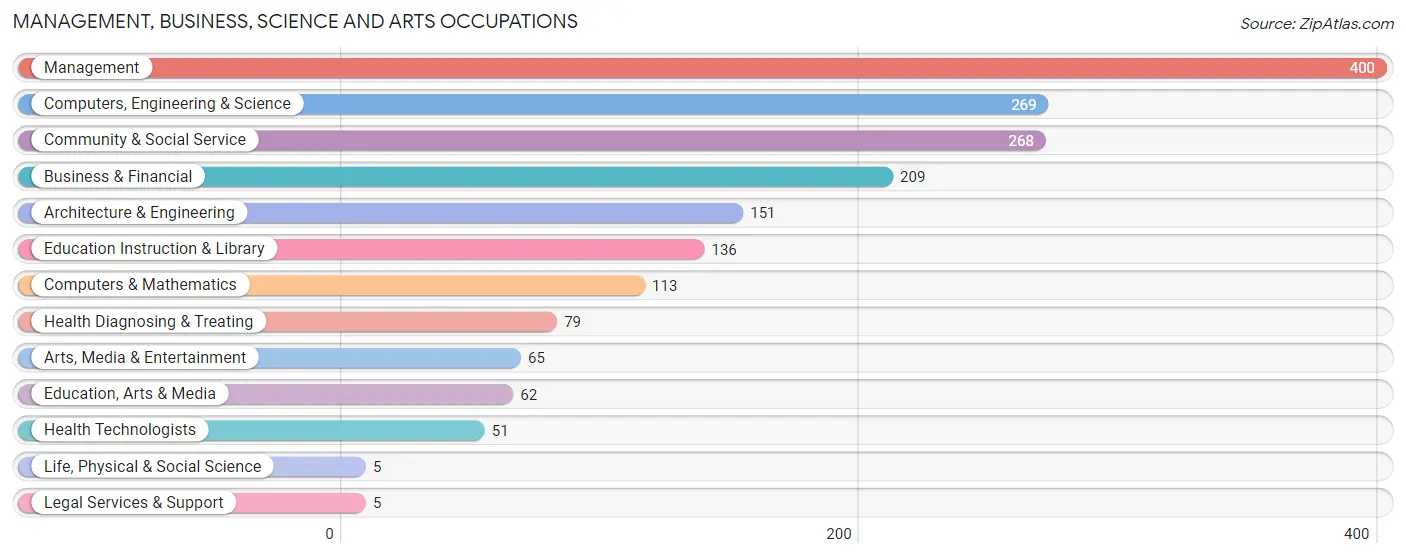
The most common Management, Business, Science and Arts occupations in Waller are Management (400 | 10.7%), Computers, Engineering & Science (269 | 7.2%), Community & Social Service (268 | 7.2%), Business & Financial (209 | 5.6%), and Architecture & Engineering (151 | 4.0%).
Management, Business, Science and Arts Occupations by Sex
Within the Management, Business, Science and Arts occupations in Waller, the most male-oriented occupations are Life, Physical & Social Science (80.0%), Computers & Mathematics (73.5%), and Computers, Engineering & Science (71.8%), while the most female-oriented occupations are Legal Services & Support (100.0%), Health Diagnosing & Treating (100.0%), and Health Technologists (100.0%).
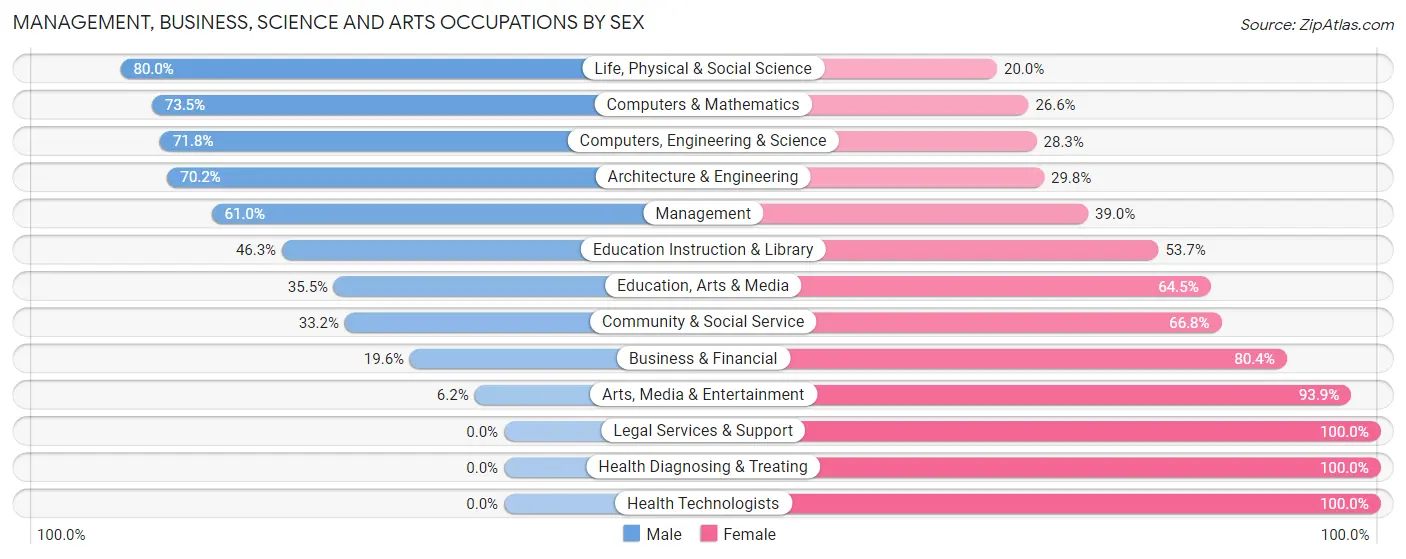
| Occupation | Male | Female |
| Management | 244 (61.0%) | 156 (39.0%) |
| Business & Financial | 41 (19.6%) | 168 (80.4%) |
| Computers, Engineering & Science | 193 (71.8%) | 76 (28.2%) |
| Computers & Mathematics | 83 (73.5%) | 30 (26.6%) |
| Architecture & Engineering | 106 (70.2%) | 45 (29.8%) |
| Life, Physical & Social Science | 4 (80.0%) | 1 (20.0%) |
| Community & Social Service | 89 (33.2%) | 179 (66.8%) |
| Education, Arts & Media | 22 (35.5%) | 40 (64.5%) |
| Legal Services & Support | 0 (0.0%) | 5 (100.0%) |
| Education Instruction & Library | 63 (46.3%) | 73 (53.7%) |
| Arts, Media & Entertainment | 4 (6.1%) | 61 (93.9%) |
| Health Diagnosing & Treating | 0 (0.0%) | 79 (100.0%) |
| Health Technologists | 0 (0.0%) | 51 (100.0%) |
| Total (Category) | 567 (46.3%) | 658 (53.7%) |
| Total (Overall) | 1,972 (52.7%) | 1,772 (47.3%) |
Services Occupations
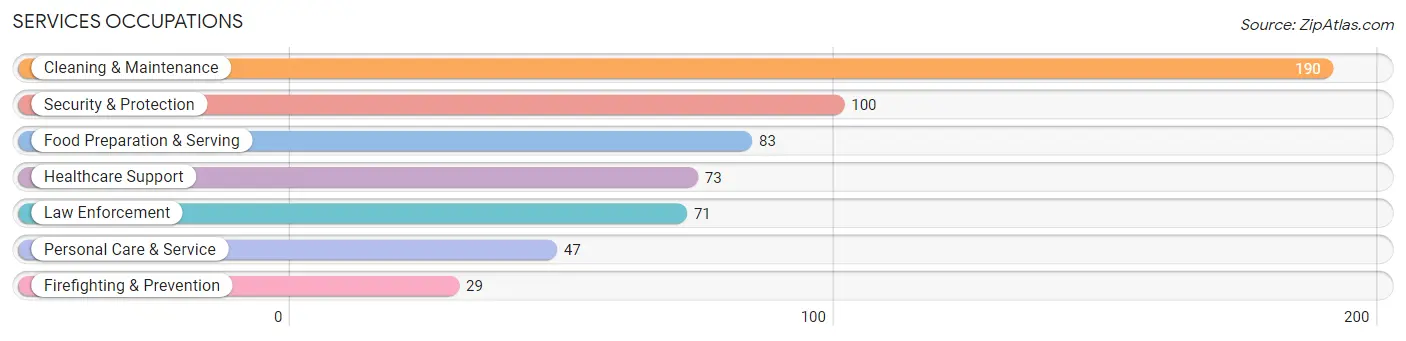
The most common Services occupations in Waller are Cleaning & Maintenance (190 | 5.1%), Security & Protection (100 | 2.7%), Food Preparation & Serving (83 | 2.2%), Healthcare Support (73 | 1.9%), and Law Enforcement (71 | 1.9%).
Services Occupations by Sex
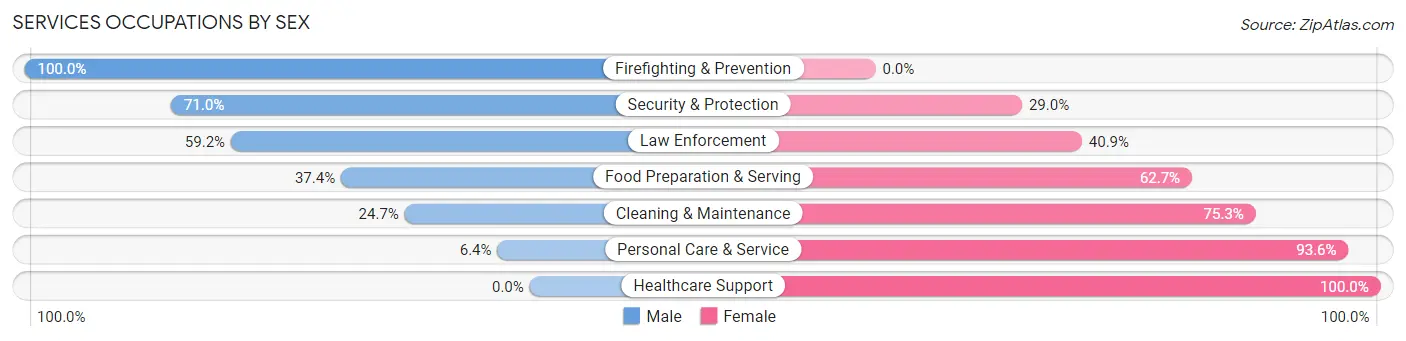
Within the Services occupations in Waller, the most male-oriented occupations are Firefighting & Prevention (100.0%), Security & Protection (71.0%), and Law Enforcement (59.2%), while the most female-oriented occupations are Healthcare Support (100.0%), Personal Care & Service (93.6%), and Cleaning & Maintenance (75.3%).
| Occupation | Male | Female |
| Healthcare Support | 0 (0.0%) | 73 (100.0%) |
| Security & Protection | 71 (71.0%) | 29 (29.0%) |
| Firefighting & Prevention | 29 (100.0%) | 0 (0.0%) |
| Law Enforcement | 42 (59.2%) | 29 (40.8%) |
| Food Preparation & Serving | 31 (37.3%) | 52 (62.6%) |
| Cleaning & Maintenance | 47 (24.7%) | 143 (75.3%) |
| Personal Care & Service | 3 (6.4%) | 44 (93.6%) |
| Total (Category) | 152 (30.8%) | 341 (69.2%) |
| Total (Overall) | 1,972 (52.7%) | 1,772 (47.3%) |
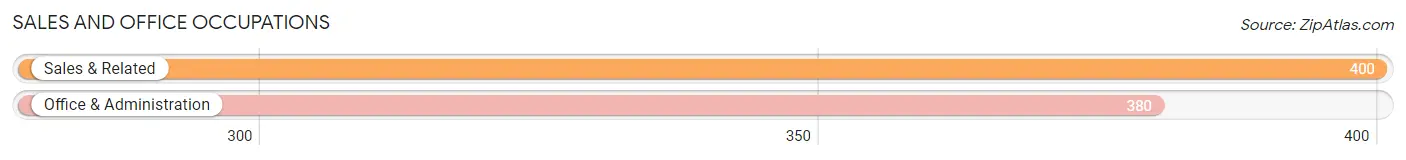
Sales and Office Occupations
The most common Sales and Office occupations in Waller are Sales & Related (400 | 10.7%), and Office & Administration (380 | 10.2%).
Sales and Office Occupations by Sex
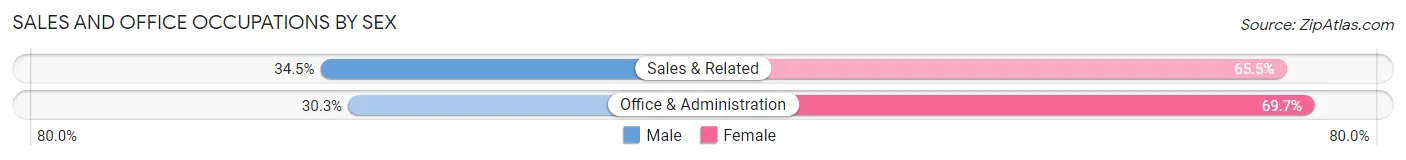
| Occupation | Male | Female |
| Sales & Related | 138 (34.5%) | 262 (65.5%) |
| Office & Administration | 115 (30.3%) | 265 (69.7%) |
| Total (Category) | 253 (32.4%) | 527 (67.6%) |
| Total (Overall) | 1,972 (52.7%) | 1,772 (47.3%) |
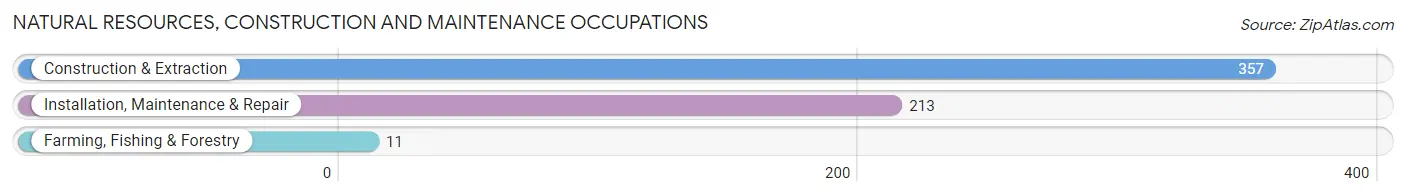
Natural Resources, Construction and Maintenance Occupations
The most common Natural Resources, Construction and Maintenance occupations in Waller are Construction & Extraction (357 | 9.5%), Installation, Maintenance & Repair (213 | 5.7%), and Farming, Fishing & Forestry (11 | 0.3%).
Natural Resources, Construction and Maintenance Occupations by Sex
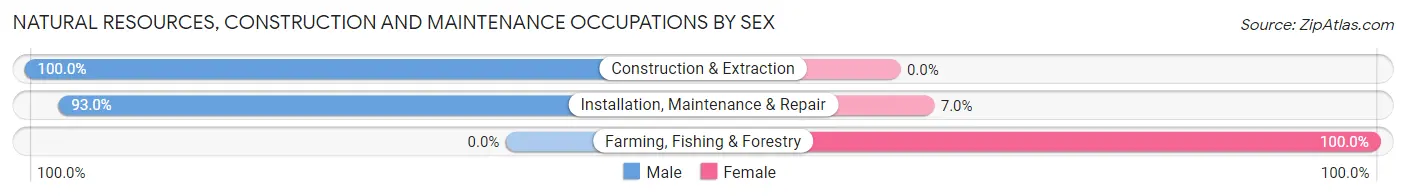
| Occupation | Male | Female |
| Farming, Fishing & Forestry | 0 (0.0%) | 11 (100.0%) |
| Construction & Extraction | 357 (100.0%) | 0 (0.0%) |
| Installation, Maintenance & Repair | 198 (93.0%) | 15 (7.0%) |
| Total (Category) | 555 (95.5%) | 26 (4.5%) |
| Total (Overall) | 1,972 (52.7%) | 1,772 (47.3%) |
Production, Transportation and Moving Occupations
The most common Production, Transportation and Moving occupations in Waller are Production (331 | 8.8%), Material Moving (197 | 5.3%), and Transportation (137 | 3.7%).
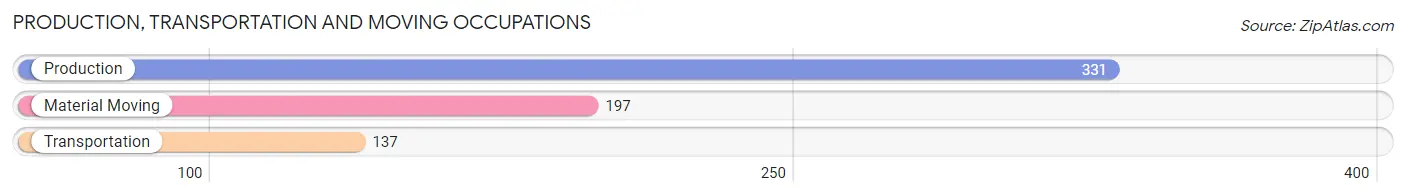
Production, Transportation and Moving Occupations by Sex
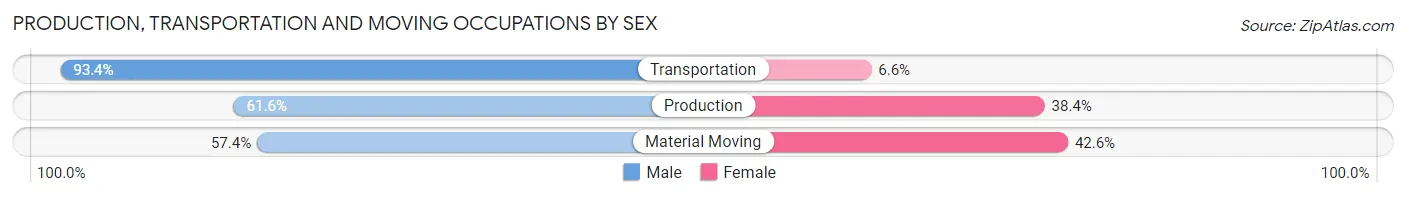
| Occupation | Male | Female |
| Production | 204 (61.6%) | 127 (38.4%) |
| Transportation | 128 (93.4%) | 9 (6.6%) |
| Material Moving | 113 (57.4%) | 84 (42.6%) |
| Total (Category) | 445 (66.9%) | 220 (33.1%) |
| Total (Overall) | 1,972 (52.7%) | 1,772 (47.3%) |
Employment Industries by Sex in Waller
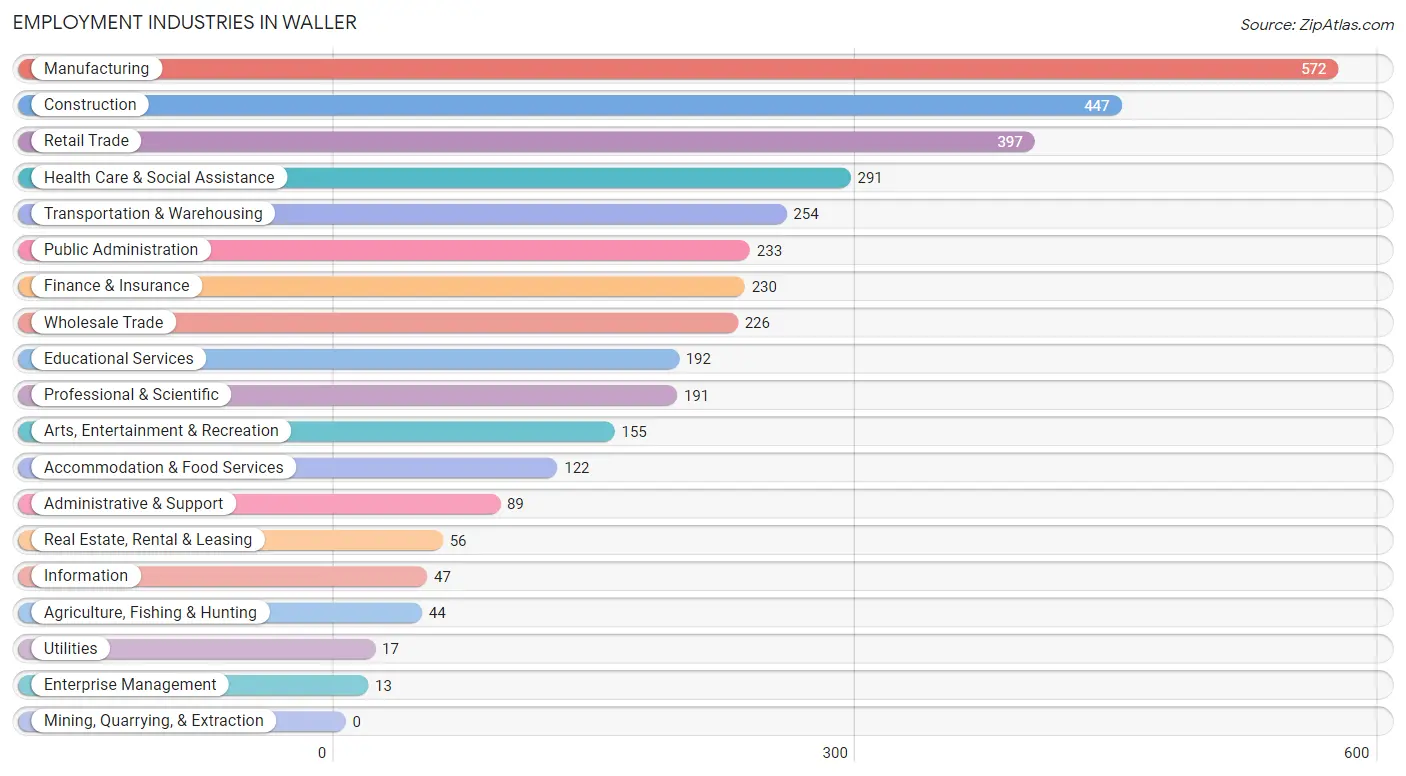
Employment Industries in Waller
The major employment industries in Waller include Manufacturing (572 | 15.3%), Construction (447 | 11.9%), Retail Trade (397 | 10.6%), Health Care & Social Assistance (291 | 7.8%), and Transportation & Warehousing (254 | 6.8%).
Employment Industries by Sex in Waller
The Waller industries that see more men than women are Enterprise Management (100.0%), Construction (94.9%), and Transportation & Warehousing (90.2%), whereas the industries that tend to have a higher number of women are Health Care & Social Assistance (97.6%), Arts, Entertainment & Recreation (90.3%), and Professional & Scientific (87.4%).
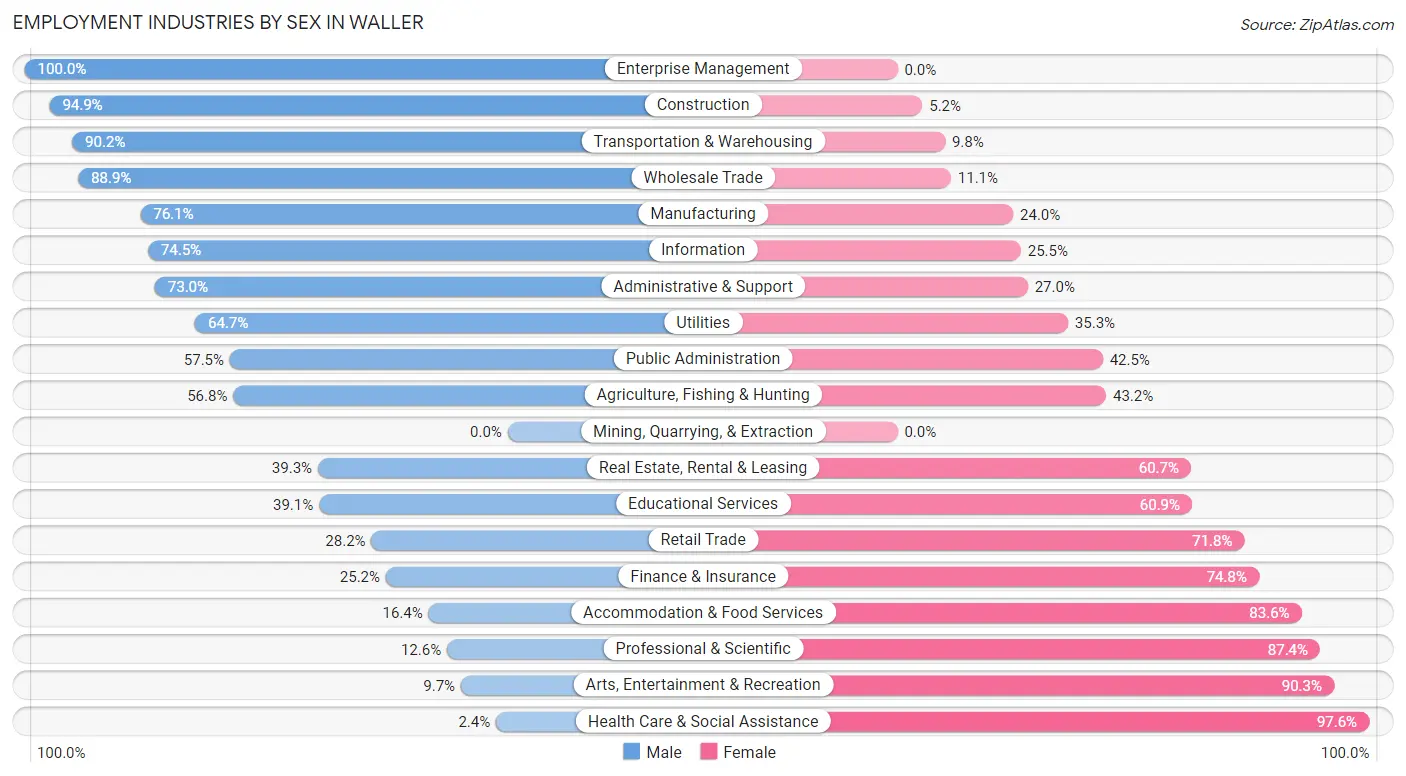
| Industry | Male | Female |
| Agriculture, Fishing & Hunting | 25 (56.8%) | 19 (43.2%) |
| Mining, Quarrying, & Extraction | 0 (0.0%) | 0 (0.0%) |
| Construction | 424 (94.9%) | 23 (5.1%) |
| Manufacturing | 435 (76.0%) | 137 (23.9%) |
| Wholesale Trade | 201 (88.9%) | 25 (11.1%) |
| Retail Trade | 112 (28.2%) | 285 (71.8%) |
| Transportation & Warehousing | 229 (90.2%) | 25 (9.8%) |
| Utilities | 11 (64.7%) | 6 (35.3%) |
| Information | 35 (74.5%) | 12 (25.5%) |
| Finance & Insurance | 58 (25.2%) | 172 (74.8%) |
| Real Estate, Rental & Leasing | 22 (39.3%) | 34 (60.7%) |
| Professional & Scientific | 24 (12.6%) | 167 (87.4%) |
| Enterprise Management | 13 (100.0%) | 0 (0.0%) |
| Administrative & Support | 65 (73.0%) | 24 (27.0%) |
| Educational Services | 75 (39.1%) | 117 (60.9%) |
| Health Care & Social Assistance | 7 (2.4%) | 284 (97.6%) |
| Arts, Entertainment & Recreation | 15 (9.7%) | 140 (90.3%) |
| Accommodation & Food Services | 20 (16.4%) | 102 (83.6%) |
| Public Administration | 134 (57.5%) | 99 (42.5%) |
| Total | 1,972 (52.7%) | 1,772 (47.3%) |
Education in Waller
School Enrollment in Waller
The most common levels of schooling among the 1,586 students in Waller are middle school (406 | 25.6%), elementary school (354 | 22.3%), and high school (345 | 21.7%).
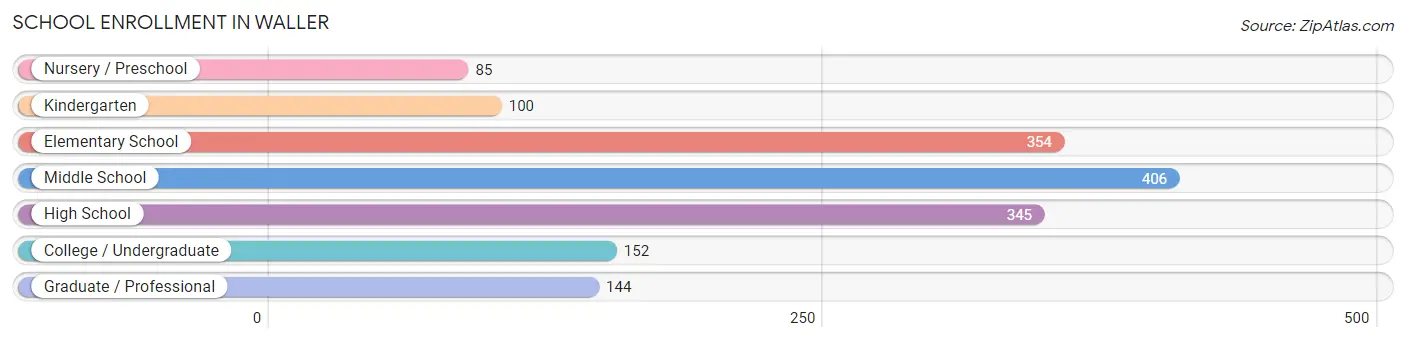
| School Level | # Students | % Students |
| Nursery / Preschool | 85 | 5.4% |
| Kindergarten | 100 | 6.3% |
| Elementary School | 354 | 22.3% |
| Middle School | 406 | 25.6% |
| High School | 345 | 21.7% |
| College / Undergraduate | 152 | 9.6% |
| Graduate / Professional | 144 | 9.1% |
| Total | 1,586 | 100.0% |
School Enrollment by Age by Funding Source in Waller
Out of a total of 1,586 students who are enrolled in schools in Waller, 428 (27.0%) attend a private institution, while the remaining 1,158 (73.0%) are enrolled in public schools. The age group of 3 to 4 year olds has the highest likelihood of being enrolled in private schools, with 45 (66.2% in the age bracket) enrolled. Conversely, the age group of 20 to 24 year olds has the lowest likelihood of being enrolled in a private school, with 32 (100.0% in the age bracket) attending a public institution.
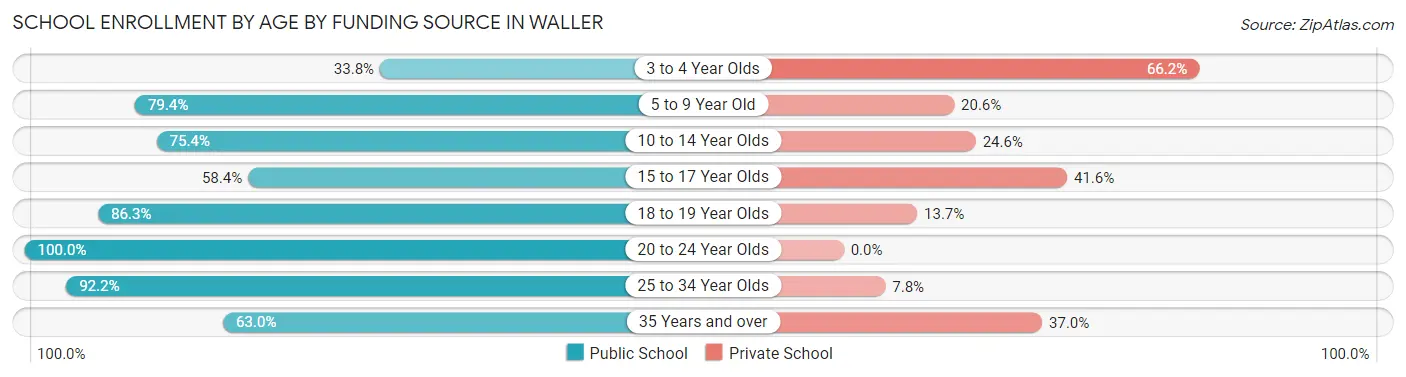
| Age Bracket | Public School | Private School |
| 3 to 4 Year Olds | 23 (33.8%) | 45 (66.2%) |
| 5 to 9 Year Old | 309 (79.4%) | 80 (20.6%) |
| 10 to 14 Year Olds | 365 (75.4%) | 119 (24.6%) |
| 15 to 17 Year Olds | 181 (58.4%) | 129 (41.6%) |
| 18 to 19 Year Olds | 82 (86.3%) | 13 (13.7%) |
| 20 to 24 Year Olds | 32 (100.0%) | 0 (0.0%) |
| 25 to 34 Year Olds | 107 (92.2%) | 9 (7.8%) |
| 35 Years and over | 58 (63.0%) | 34 (37.0%) |
| Total | 1,158 (73.0%) | 428 (27.0%) |
Educational Attainment by Field of Study in Waller
Business (377 | 26.8%), social sciences (166 | 11.8%), education (133 | 9.5%), arts & humanities (117 | 8.3%), and liberal arts & history (94 | 6.7%) are the most common fields of study among 1,407 individuals in Waller who have obtained a bachelor's degree or higher.
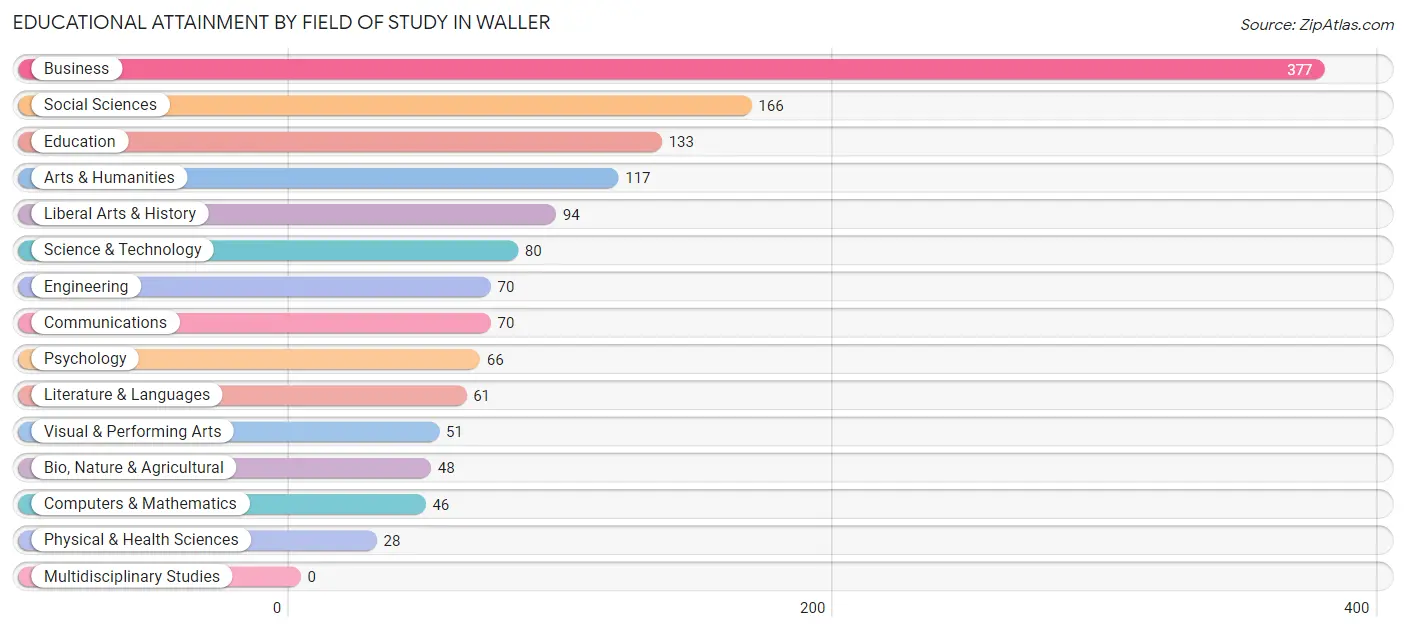
| Field of Study | # Graduates | % Graduates |
| Computers & Mathematics | 46 | 3.3% |
| Bio, Nature & Agricultural | 48 | 3.4% |
| Physical & Health Sciences | 28 | 2.0% |
| Psychology | 66 | 4.7% |
| Social Sciences | 166 | 11.8% |
| Engineering | 70 | 5.0% |
| Multidisciplinary Studies | 0 | 0.0% |
| Science & Technology | 80 | 5.7% |
| Business | 377 | 26.8% |
| Education | 133 | 9.5% |
| Literature & Languages | 61 | 4.3% |
| Liberal Arts & History | 94 | 6.7% |
| Visual & Performing Arts | 51 | 3.6% |
| Communications | 70 | 5.0% |
| Arts & Humanities | 117 | 8.3% |
| Total | 1,407 | 100.0% |
Transportation & Commute in Waller
Vehicle Availability by Sex in Waller
The most prevalent vehicle ownership categories in Waller are males with 3 vehicles (610, accounting for 31.5%) and females with 3 vehicles (470, making up 35.9%).
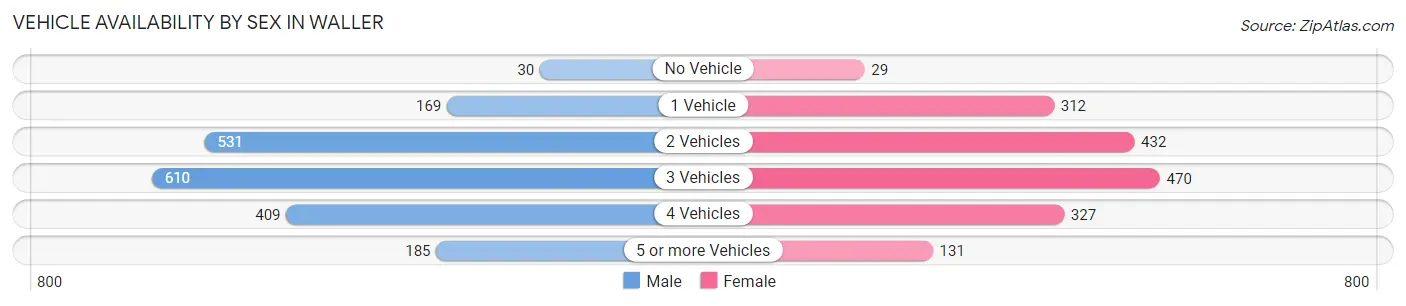
| Vehicles Available | Male | Female |
| No Vehicle | 30 (1.5%) | 29 (1.7%) |
| 1 Vehicle | 169 (8.7%) | 312 (18.3%) |
| 2 Vehicles | 531 (27.5%) | 432 (25.4%) |
| 3 Vehicles | 610 (31.5%) | 470 (27.6%) |
| 4 Vehicles | 409 (21.1%) | 327 (19.2%) |
| 5 or more Vehicles | 185 (9.6%) | 131 (7.7%) |
| Total | 1,934 (100.0%) | 1,701 (100.0%) |
Commute Time in Waller
The most frequently occuring commute durations in Waller are 20 to 24 minutes (687 commuters, 22.6%), 15 to 19 minutes (565 commuters, 18.6%), and 30 to 34 minutes (358 commuters, 11.8%).
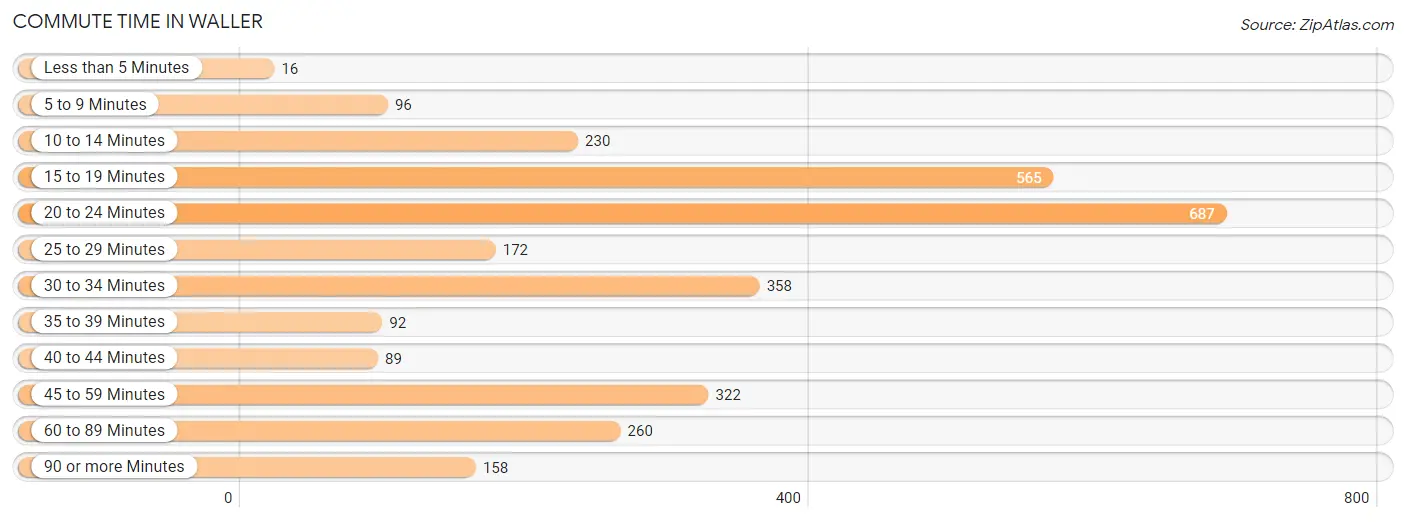
| Commute Time | # Commuters | % Commuters |
| Less than 5 Minutes | 16 | 0.5% |
| 5 to 9 Minutes | 96 | 3.2% |
| 10 to 14 Minutes | 230 | 7.5% |
| 15 to 19 Minutes | 565 | 18.6% |
| 20 to 24 Minutes | 687 | 22.6% |
| 25 to 29 Minutes | 172 | 5.7% |
| 30 to 34 Minutes | 358 | 11.8% |
| 35 to 39 Minutes | 92 | 3.0% |
| 40 to 44 Minutes | 89 | 2.9% |
| 45 to 59 Minutes | 322 | 10.6% |
| 60 to 89 Minutes | 260 | 8.5% |
| 90 or more Minutes | 158 | 5.2% |
Commute Time by Sex in Waller
The most common commute times in Waller are 20 to 24 minutes (287 commuters, 17.4%) for males and 20 to 24 minutes (400 commuters, 28.7%) for females.
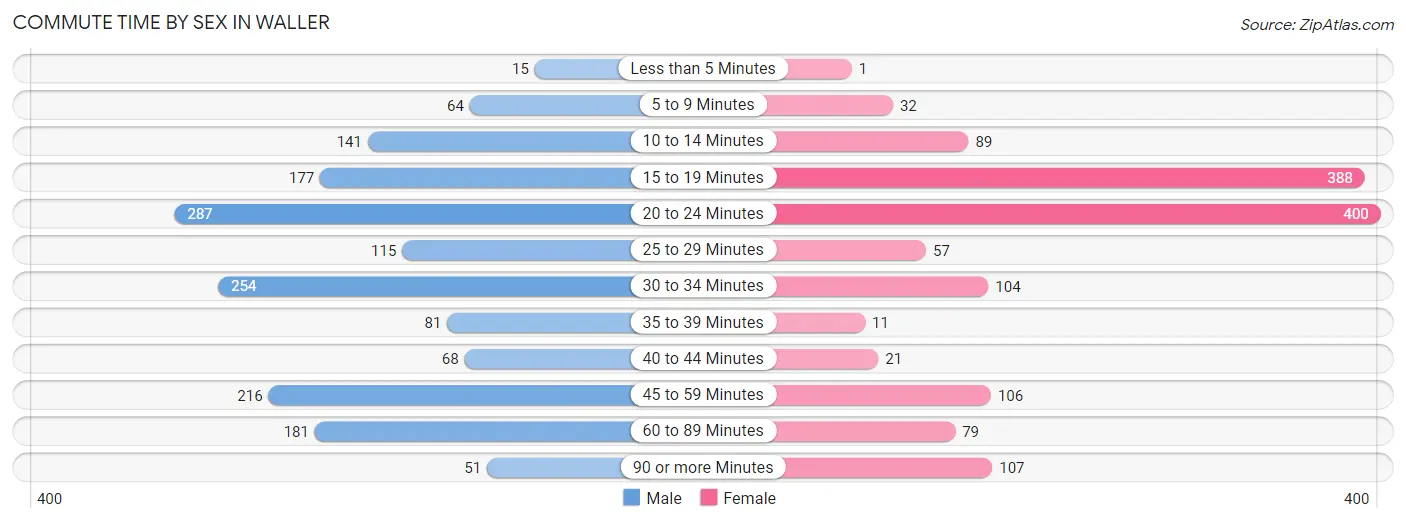
| Commute Time | Male | Female |
| Less than 5 Minutes | 15 (0.9%) | 1 (0.1%) |
| 5 to 9 Minutes | 64 (3.9%) | 32 (2.3%) |
| 10 to 14 Minutes | 141 (8.6%) | 89 (6.4%) |
| 15 to 19 Minutes | 177 (10.7%) | 388 (27.8%) |
| 20 to 24 Minutes | 287 (17.4%) | 400 (28.7%) |
| 25 to 29 Minutes | 115 (7.0%) | 57 (4.1%) |
| 30 to 34 Minutes | 254 (15.4%) | 104 (7.5%) |
| 35 to 39 Minutes | 81 (4.9%) | 11 (0.8%) |
| 40 to 44 Minutes | 68 (4.1%) | 21 (1.5%) |
| 45 to 59 Minutes | 216 (13.1%) | 106 (7.6%) |
| 60 to 89 Minutes | 181 (11.0%) | 79 (5.7%) |
| 90 or more Minutes | 51 (3.1%) | 107 (7.7%) |
Time of Departure to Work by Sex in Waller
The most frequent times of departure to work in Waller are 6:00 AM to 6:29 AM (276, 16.7%) for males and 7:30 AM to 7:59 AM (290, 20.8%) for females.
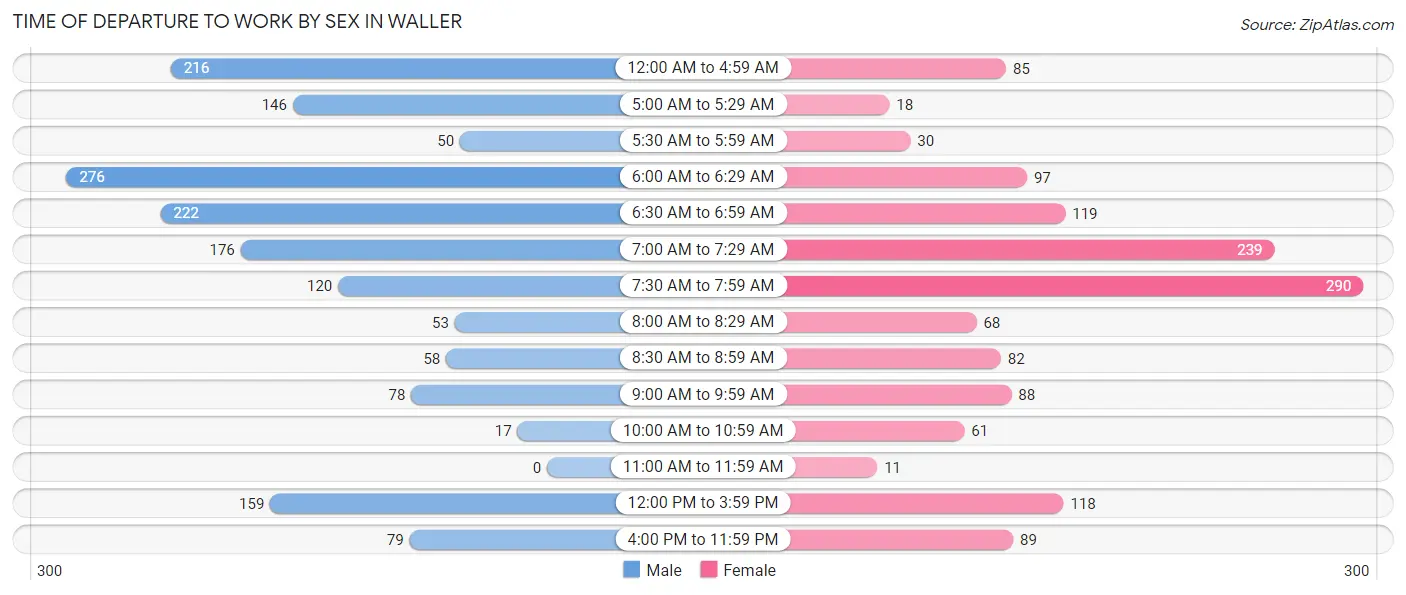
| Time of Departure | Male | Female |
| 12:00 AM to 4:59 AM | 216 (13.1%) | 85 (6.1%) |
| 5:00 AM to 5:29 AM | 146 (8.8%) | 18 (1.3%) |
| 5:30 AM to 5:59 AM | 50 (3.0%) | 30 (2.1%) |
| 6:00 AM to 6:29 AM | 276 (16.7%) | 97 (7.0%) |
| 6:30 AM to 6:59 AM | 222 (13.5%) | 119 (8.5%) |
| 7:00 AM to 7:29 AM | 176 (10.7%) | 239 (17.1%) |
| 7:30 AM to 7:59 AM | 120 (7.3%) | 290 (20.8%) |
| 8:00 AM to 8:29 AM | 53 (3.2%) | 68 (4.9%) |
| 8:30 AM to 8:59 AM | 58 (3.5%) | 82 (5.9%) |
| 9:00 AM to 9:59 AM | 78 (4.7%) | 88 (6.3%) |
| 10:00 AM to 10:59 AM | 17 (1.0%) | 61 (4.4%) |
| 11:00 AM to 11:59 AM | 0 (0.0%) | 11 (0.8%) |
| 12:00 PM to 3:59 PM | 159 (9.6%) | 118 (8.5%) |
| 4:00 PM to 11:59 PM | 79 (4.8%) | 89 (6.4%) |
| Total | 1,650 (100.0%) | 1,395 (100.0%) |
Housing Occupancy in Waller
Occupancy by Ownership in Waller
Of the total 2,986 dwellings in Waller, owner-occupied units account for 2,507 (84.0%), while renter-occupied units make up 479 (16.0%).
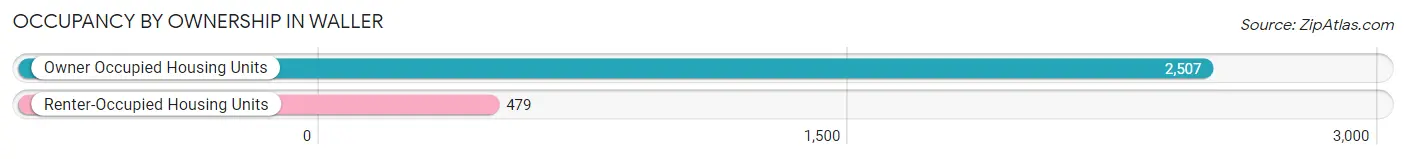
| Occupancy | # Housing Units | % Housing Units |
| Owner Occupied Housing Units | 2,507 | 84.0% |
| Renter-Occupied Housing Units | 479 | 16.0% |
| Total Occupied Housing Units | 2,986 | 100.0% |
Occupancy by Household Size in Waller
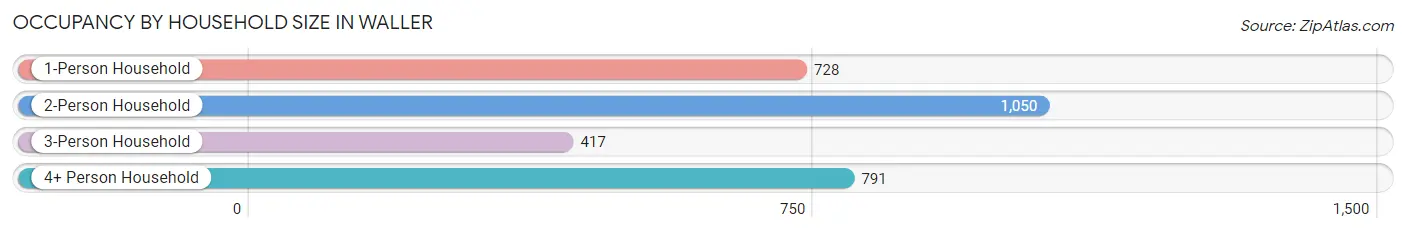
| Household Size | # Housing Units | % Housing Units |
| 1-Person Household | 728 | 24.4% |
| 2-Person Household | 1,050 | 35.2% |
| 3-Person Household | 417 | 14.0% |
| 4+ Person Household | 791 | 26.5% |
| Total Housing Units | 2,986 | 100.0% |
Occupancy by Ownership by Household Size in Waller
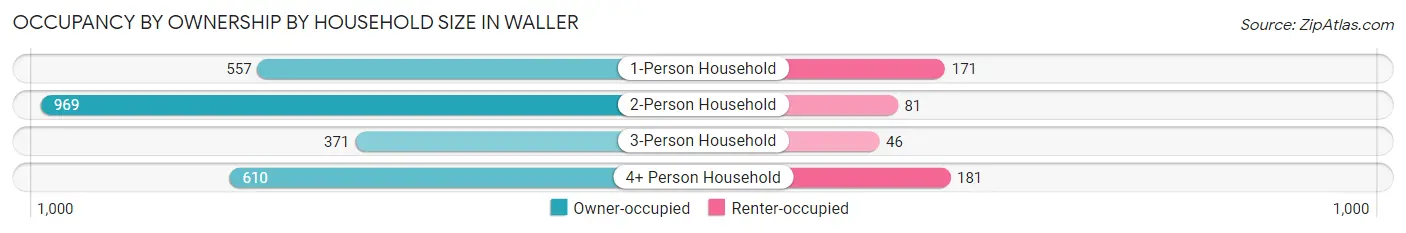
| Household Size | Owner-occupied | Renter-occupied |
| 1-Person Household | 557 (76.5%) | 171 (23.5%) |
| 2-Person Household | 969 (92.3%) | 81 (7.7%) |
| 3-Person Household | 371 (89.0%) | 46 (11.0%) |
| 4+ Person Household | 610 (77.1%) | 181 (22.9%) |
| Total Housing Units | 2,507 (84.0%) | 479 (16.0%) |
Occupancy by Educational Attainment in Waller
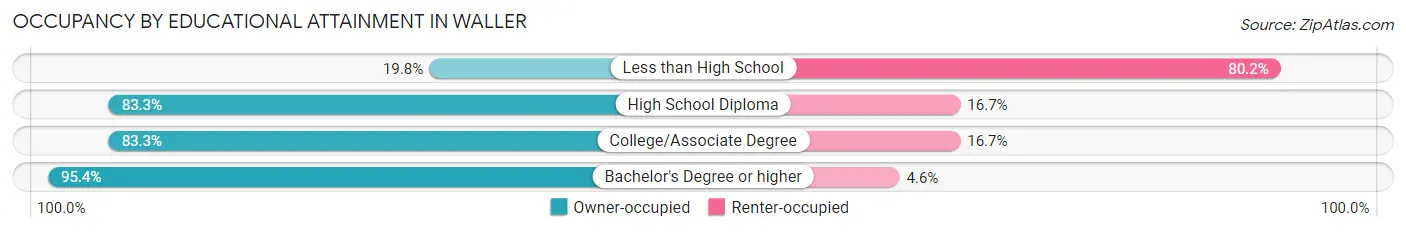
| Household Size | Owner-occupied | Renter-occupied |
| Less than High School | 24 (19.8%) | 97 (80.2%) |
| High School Diploma | 728 (83.3%) | 146 (16.7%) |
| College/Associate Degree | 994 (83.3%) | 199 (16.7%) |
| Bachelor's Degree or higher | 761 (95.4%) | 37 (4.6%) |
Occupancy by Age of Householder in Waller
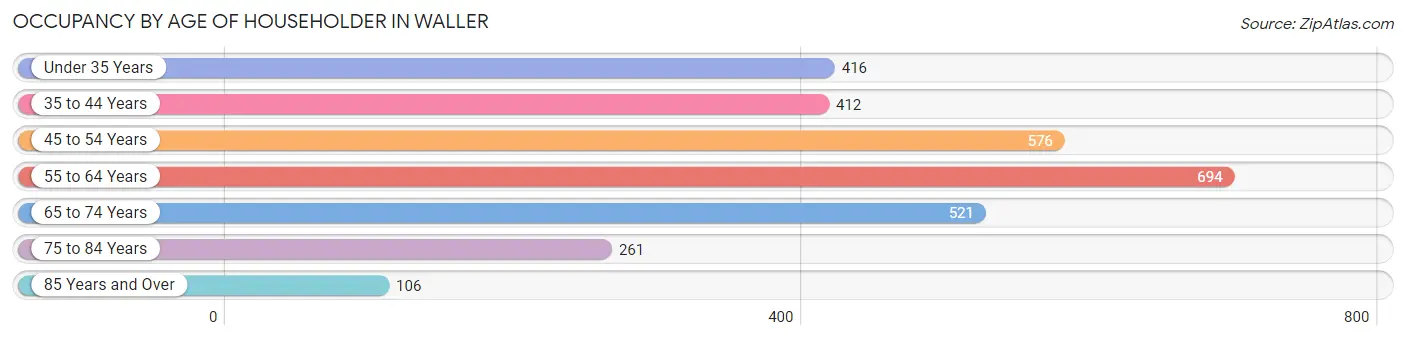
| Age Bracket | # Households | % Households |
| Under 35 Years | 416 | 13.9% |
| 35 to 44 Years | 412 | 13.8% |
| 45 to 54 Years | 576 | 19.3% |
| 55 to 64 Years | 694 | 23.2% |
| 65 to 74 Years | 521 | 17.4% |
| 75 to 84 Years | 261 | 8.7% |
| 85 Years and Over | 106 | 3.5% |
| Total | 2,986 | 100.0% |
Housing Finances in Waller
Median Income by Occupancy in Waller
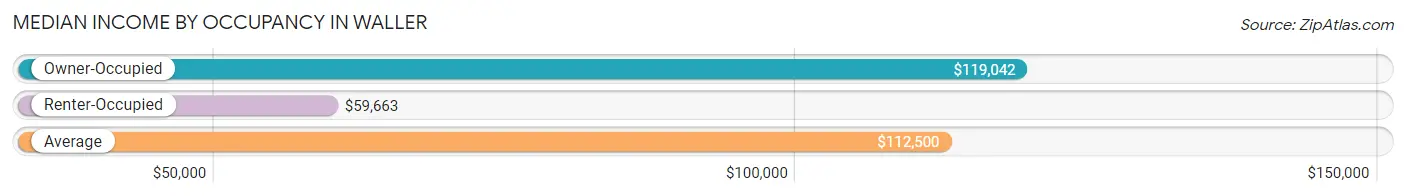
| Occupancy Type | # Households | Median Income |
| Owner-Occupied | 2,507 (84.0%) | $119,042 |
| Renter-Occupied | 479 (16.0%) | $59,663 |
| Average | 2,986 (100.0%) | $112,500 |
Occupancy by Householder Income Bracket in Waller
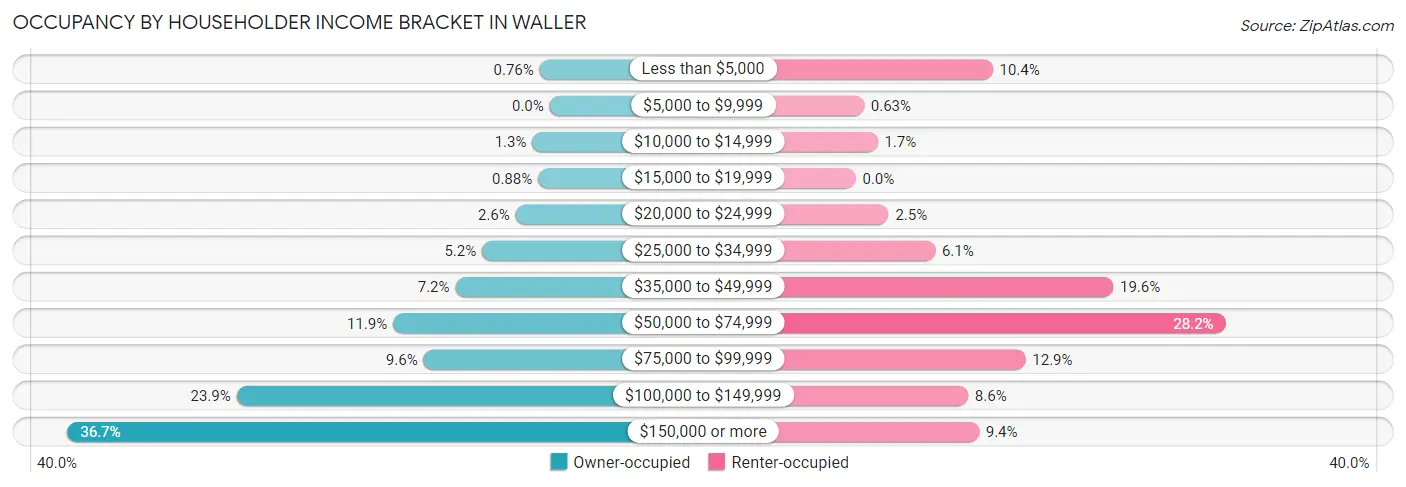
| Income Bracket | Owner-occupied | Renter-occupied |
| Less than $5,000 | 19 (0.8%) | 50 (10.4%) |
| $5,000 to $9,999 | 0 (0.0%) | 3 (0.6%) |
| $10,000 to $14,999 | 33 (1.3%) | 8 (1.7%) |
| $15,000 to $19,999 | 22 (0.9%) | 0 (0.0%) |
| $20,000 to $24,999 | 65 (2.6%) | 12 (2.5%) |
| $25,000 to $34,999 | 129 (5.1%) | 29 (6.0%) |
| $35,000 to $49,999 | 180 (7.2%) | 94 (19.6%) |
| $50,000 to $74,999 | 299 (11.9%) | 135 (28.2%) |
| $75,000 to $99,999 | 241 (9.6%) | 62 (12.9%) |
| $100,000 to $149,999 | 598 (23.8%) | 41 (8.6%) |
| $150,000 or more | 921 (36.7%) | 45 (9.4%) |
| Total | 2,507 (100.0%) | 479 (100.0%) |
Monthly Housing Cost Tiers in Waller
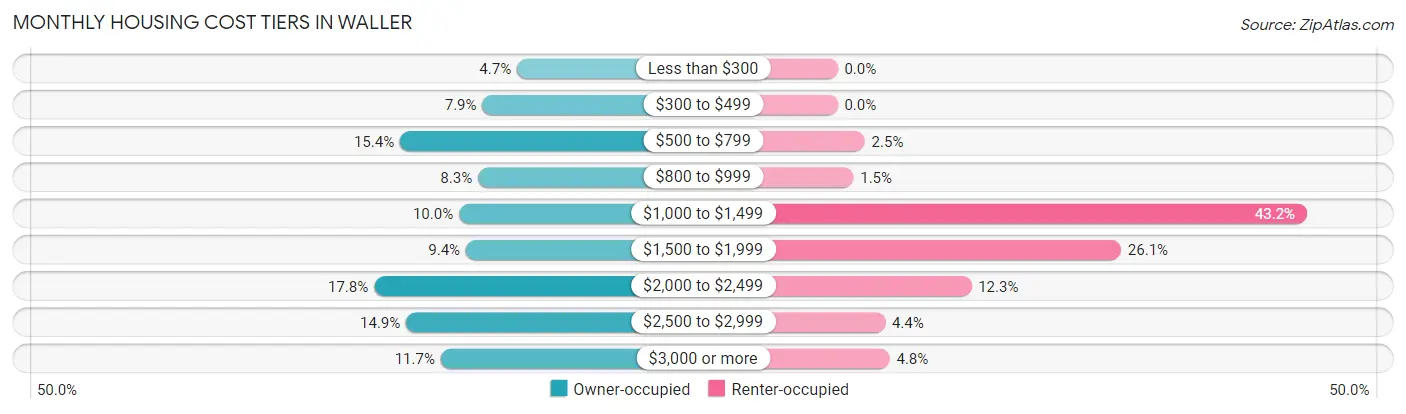
| Monthly Cost | Owner-occupied | Renter-occupied |
| Less than $300 | 117 (4.7%) | 0 (0.0%) |
| $300 to $499 | 197 (7.9%) | 0 (0.0%) |
| $500 to $799 | 387 (15.4%) | 12 (2.5%) |
| $800 to $999 | 207 (8.3%) | 7 (1.5%) |
| $1,000 to $1,499 | 251 (10.0%) | 207 (43.2%) |
| $1,500 to $1,999 | 235 (9.4%) | 125 (26.1%) |
| $2,000 to $2,499 | 447 (17.8%) | 59 (12.3%) |
| $2,500 to $2,999 | 373 (14.9%) | 21 (4.4%) |
| $3,000 or more | 293 (11.7%) | 23 (4.8%) |
| Total | 2,507 (100.0%) | 479 (100.0%) |
Physical Housing Characteristics in Waller
Housing Structures in Waller
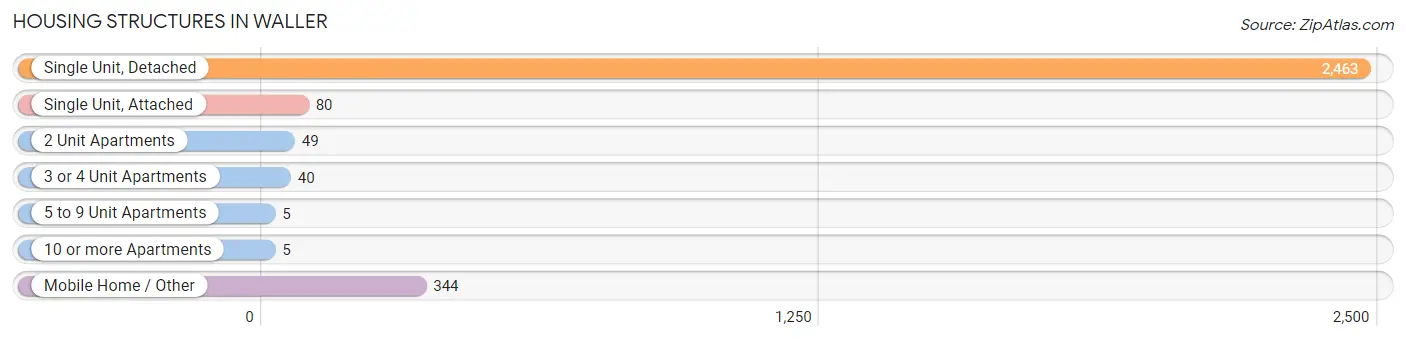
| Structure Type | # Housing Units | % Housing Units |
| Single Unit, Detached | 2,463 | 82.5% |
| Single Unit, Attached | 80 | 2.7% |
| 2 Unit Apartments | 49 | 1.6% |
| 3 or 4 Unit Apartments | 40 | 1.3% |
| 5 to 9 Unit Apartments | 5 | 0.2% |
| 10 or more Apartments | 5 | 0.2% |
| Mobile Home / Other | 344 | 11.5% |
| Total | 2,986 | 100.0% |
Housing Structures by Occupancy in Waller
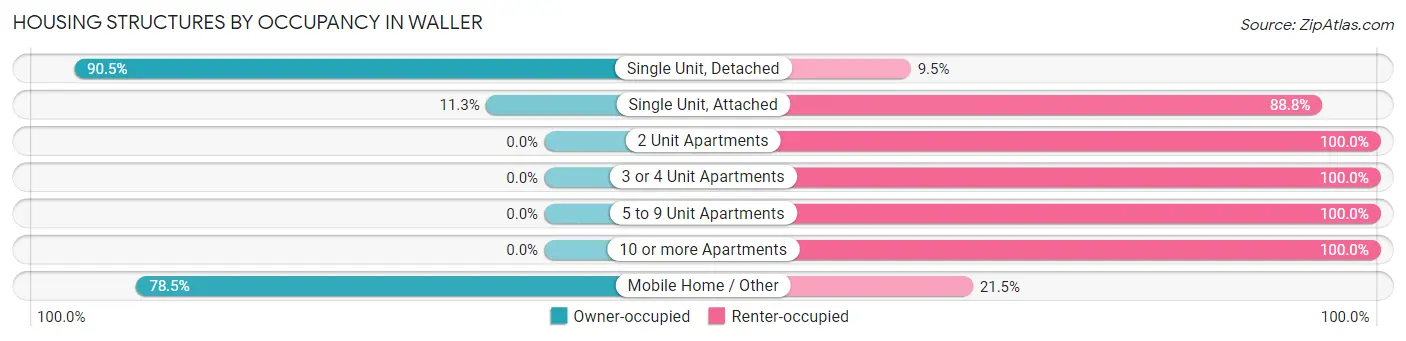
| Structure Type | Owner-occupied | Renter-occupied |
| Single Unit, Detached | 2,228 (90.5%) | 235 (9.5%) |
| Single Unit, Attached | 9 (11.3%) | 71 (88.7%) |
| 2 Unit Apartments | 0 (0.0%) | 49 (100.0%) |
| 3 or 4 Unit Apartments | 0 (0.0%) | 40 (100.0%) |
| 5 to 9 Unit Apartments | 0 (0.0%) | 5 (100.0%) |
| 10 or more Apartments | 0 (0.0%) | 5 (100.0%) |
| Mobile Home / Other | 270 (78.5%) | 74 (21.5%) |
| Total | 2,507 (84.0%) | 479 (16.0%) |
Housing Structures by Number of Rooms in Waller
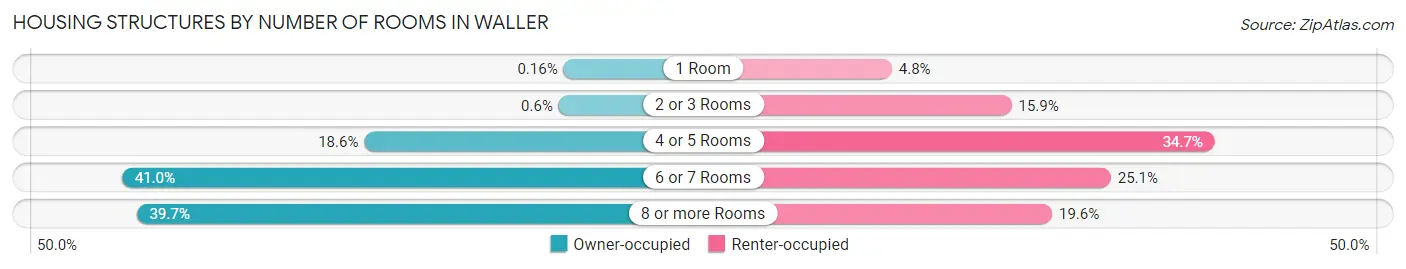
| Number of Rooms | Owner-occupied | Renter-occupied |
| 1 Room | 4 (0.2%) | 23 (4.8%) |
| 2 or 3 Rooms | 15 (0.6%) | 76 (15.9%) |
| 4 or 5 Rooms | 466 (18.6%) | 166 (34.7%) |
| 6 or 7 Rooms | 1,028 (41.0%) | 120 (25.1%) |
| 8 or more Rooms | 994 (39.7%) | 94 (19.6%) |
| Total | 2,507 (100.0%) | 479 (100.0%) |
Housing Structure by Heating Type in Waller
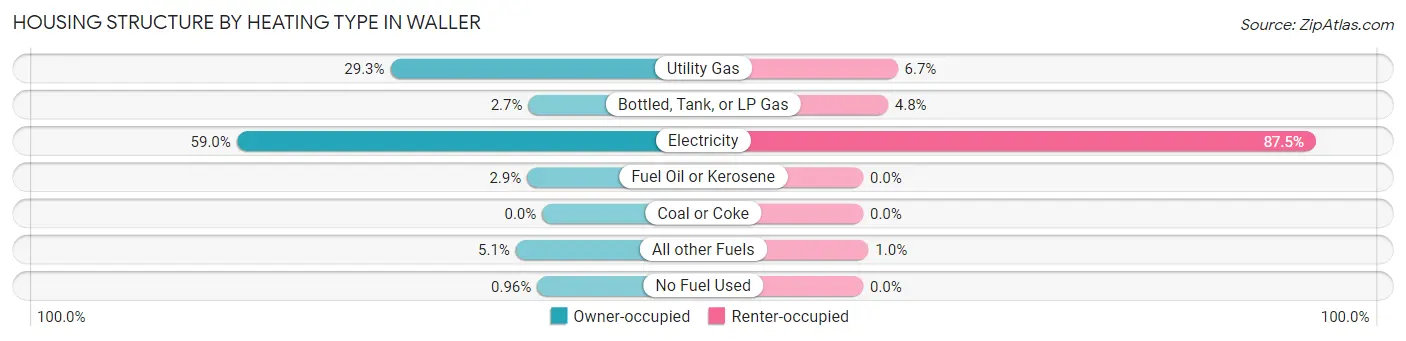
| Heating Type | Owner-occupied | Renter-occupied |
| Utility Gas | 735 (29.3%) | 32 (6.7%) |
| Bottled, Tank, or LP Gas | 67 (2.7%) | 23 (4.8%) |
| Electricity | 1,480 (59.0%) | 419 (87.5%) |
| Fuel Oil or Kerosene | 73 (2.9%) | 0 (0.0%) |
| Coal or Coke | 0 (0.0%) | 0 (0.0%) |
| All other Fuels | 128 (5.1%) | 5 (1.0%) |
| No Fuel Used | 24 (1.0%) | 0 (0.0%) |
| Total | 2,507 (100.0%) | 479 (100.0%) |
Household Vehicle Usage in Waller

| Vehicles per Household | Owner-occupied | Renter-occupied |
| No Vehicle | 37 (1.5%) | 25 (5.2%) |
| 1 Vehicle | 543 (21.7%) | 174 (36.3%) |
| 2 Vehicles | 711 (28.4%) | 199 (41.5%) |
| 3 or more Vehicles | 1,216 (48.5%) | 81 (16.9%) |
| Total | 2,507 (100.0%) | 479 (100.0%) |
Real Estate & Mortgages in Waller
Real Estate and Mortgage Overview in Waller
| Characteristic | Without Mortgage | With Mortgage |
| Housing Units | 968 | 1,539 |
| Median Property Value | $378,700 | $473,700 |
| Median Household Income | $91,223 | $698 |
| Monthly Housing Costs | $664 | $293 |
| Real Estate Taxes | $3,851 | $0 |
Property Value by Mortgage Status in Waller
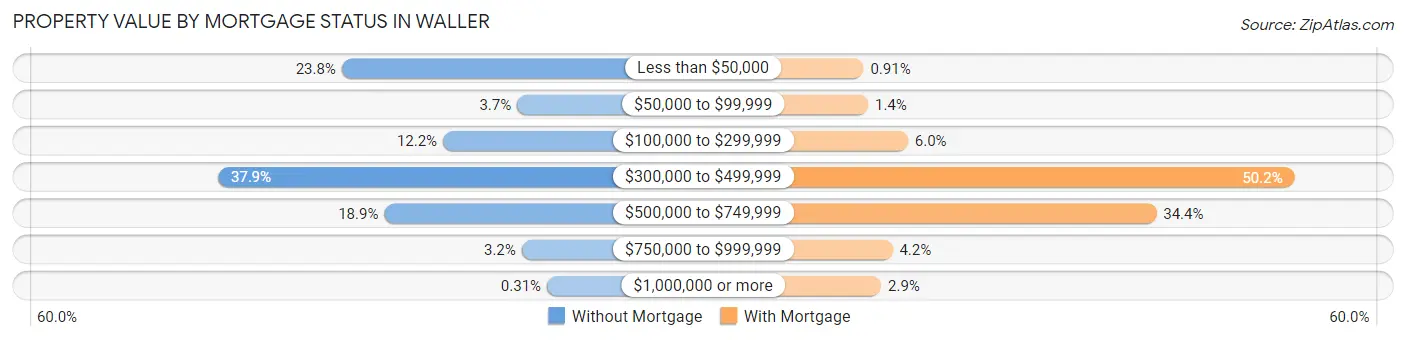
| Property Value | Without Mortgage | With Mortgage |
| Less than $50,000 | 230 (23.8%) | 14 (0.9%) |
| $50,000 to $99,999 | 36 (3.7%) | 22 (1.4%) |
| $100,000 to $299,999 | 118 (12.2%) | 92 (6.0%) |
| $300,000 to $499,999 | 367 (37.9%) | 772 (50.2%) |
| $500,000 to $749,999 | 183 (18.9%) | 529 (34.4%) |
| $750,000 to $999,999 | 31 (3.2%) | 65 (4.2%) |
| $1,000,000 or more | 3 (0.3%) | 45 (2.9%) |
| Total | 968 (100.0%) | 1,539 (100.0%) |
Household Income by Mortgage Status in Waller
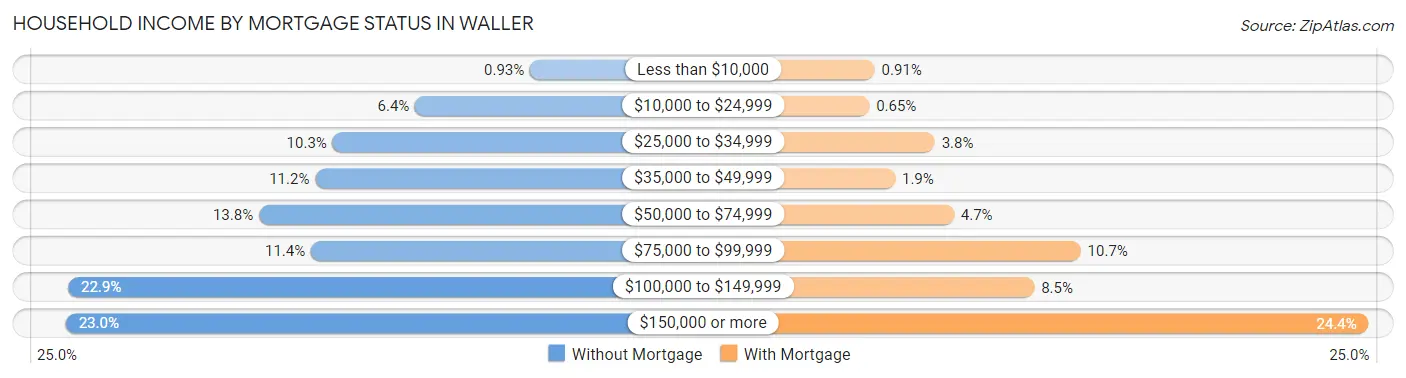
| Household Income | Without Mortgage | With Mortgage |
| Less than $10,000 | 9 (0.9%) | 14 (0.9%) |
| $10,000 to $24,999 | 62 (6.4%) | 10 (0.6%) |
| $25,000 to $34,999 | 100 (10.3%) | 58 (3.8%) |
| $35,000 to $49,999 | 108 (11.2%) | 29 (1.9%) |
| $50,000 to $74,999 | 134 (13.8%) | 72 (4.7%) |
| $75,000 to $99,999 | 110 (11.4%) | 165 (10.7%) |
| $100,000 to $149,999 | 222 (22.9%) | 131 (8.5%) |
| $150,000 or more | 223 (23.0%) | 376 (24.4%) |
| Total | 968 (100.0%) | 1,539 (100.0%) |
Property Value to Household Income Ratio in Waller
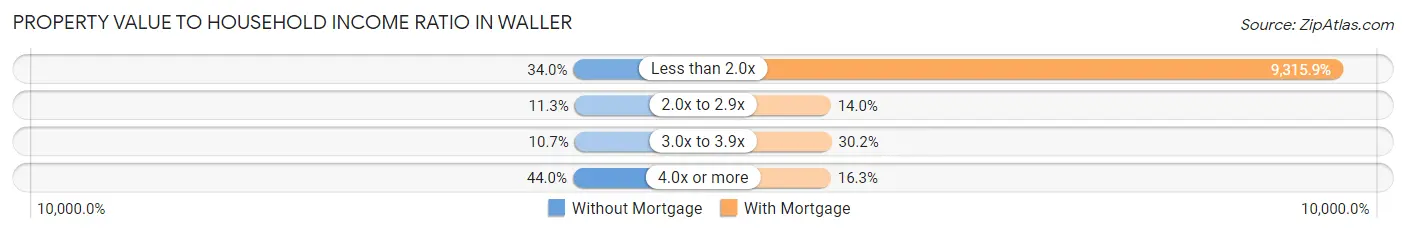
| Value-to-Income Ratio | Without Mortgage | With Mortgage |
| Less than 2.0x | 329 (34.0%) | 143,371 (9,315.9%) |
| 2.0x to 2.9x | 109 (11.3%) | 215 (14.0%) |
| 3.0x to 3.9x | 104 (10.7%) | 464 (30.1%) |
| 4.0x or more | 426 (44.0%) | 251 (16.3%) |
| Total | 968 (100.0%) | 1,539 (100.0%) |
Real Estate Taxes by Mortgage Status in Waller
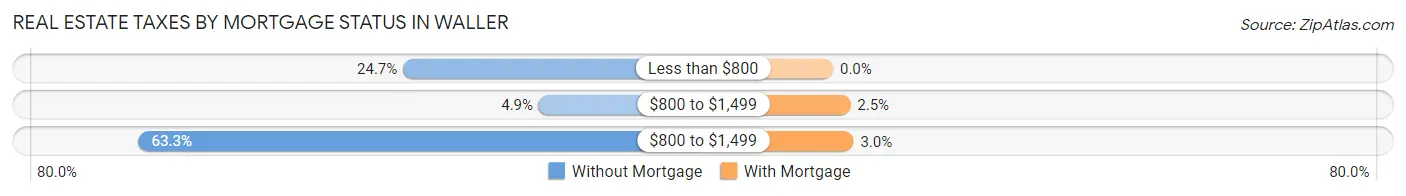
| Property Taxes | Without Mortgage | With Mortgage |
| Less than $800 | 239 (24.7%) | 0 (0.0%) |
| $800 to $1,499 | 47 (4.9%) | 39 (2.5%) |
| $800 to $1,499 | 613 (63.3%) | 46 (3.0%) |
| Total | 968 (100.0%) | 1,539 (100.0%) |
Health & Disability in Waller
Health Insurance Coverage by Age in Waller
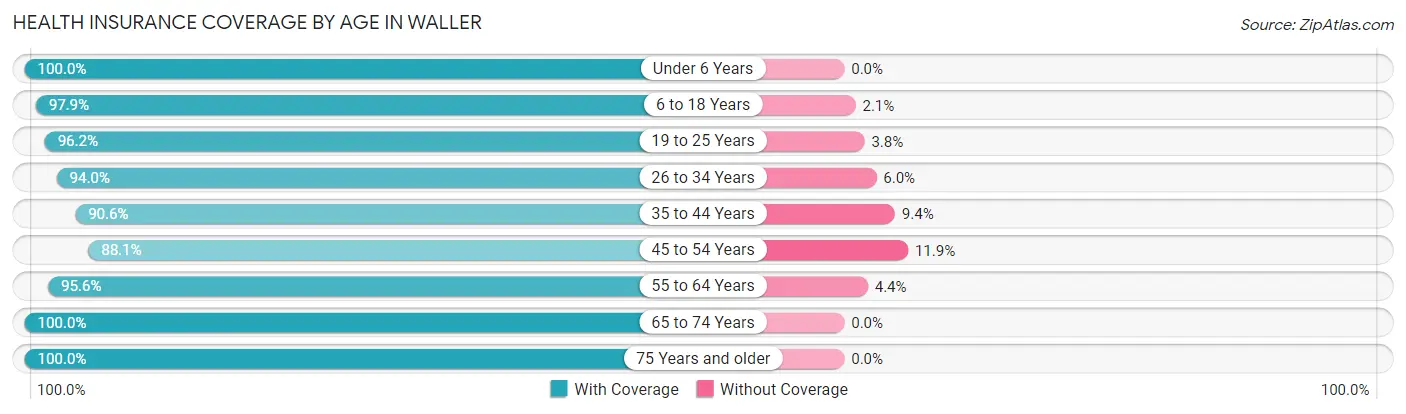
| Age Bracket | With Coverage | Without Coverage |
| Under 6 Years | 658 (100.0%) | 0 (0.0%) |
| 6 to 18 Years | 1,212 (97.9%) | 26 (2.1%) |
| 19 to 25 Years | 486 (96.2%) | 19 (3.8%) |
| 26 to 34 Years | 772 (94.0%) | 49 (6.0%) |
| 35 to 44 Years | 892 (90.6%) | 93 (9.4%) |
| 45 to 54 Years | 905 (88.1%) | 122 (11.9%) |
| 55 to 64 Years | 1,202 (95.6%) | 55 (4.4%) |
| 65 to 74 Years | 848 (100.0%) | 0 (0.0%) |
| 75 Years and older | 623 (100.0%) | 0 (0.0%) |
| Total | 7,598 (95.4%) | 364 (4.6%) |
Health Insurance Coverage by Citizenship Status in Waller
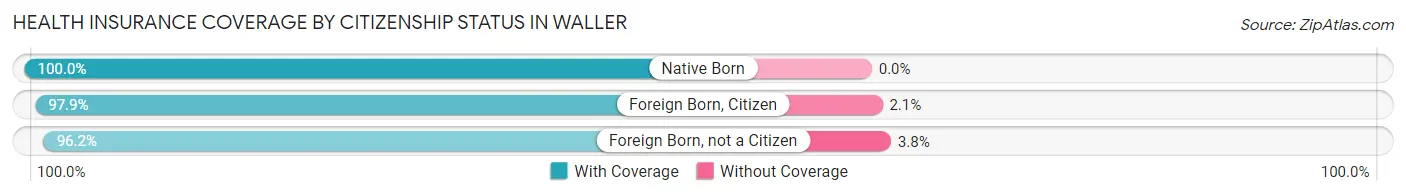
| Citizenship Status | With Coverage | Without Coverage |
| Native Born | 658 (100.0%) | 0 (0.0%) |
| Foreign Born, Citizen | 1,212 (97.9%) | 26 (2.1%) |
| Foreign Born, not a Citizen | 486 (96.2%) | 19 (3.8%) |
Health Insurance Coverage by Household Income in Waller
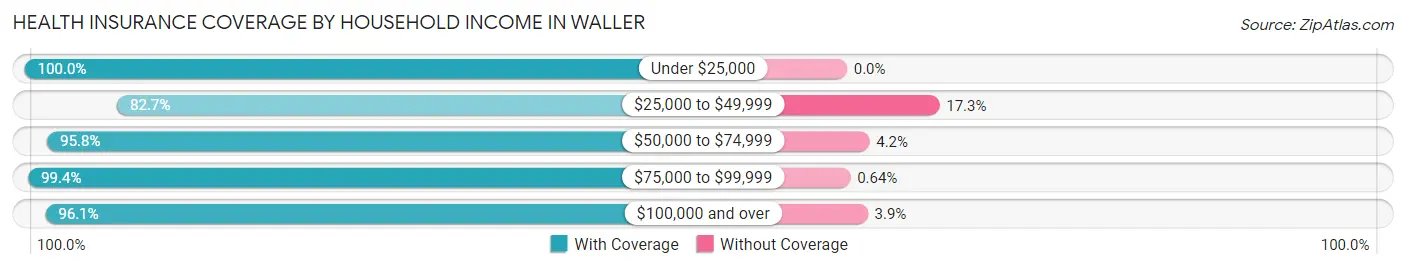
| Household Income | With Coverage | Without Coverage |
| Under $25,000 | 496 (100.0%) | 0 (0.0%) |
| $25,000 to $49,999 | 601 (82.7%) | 126 (17.3%) |
| $50,000 to $74,999 | 865 (95.8%) | 38 (4.2%) |
| $75,000 to $99,999 | 778 (99.4%) | 5 (0.6%) |
| $100,000 and over | 4,815 (96.1%) | 195 (3.9%) |
Public vs Private Health Insurance Coverage by Age in Waller
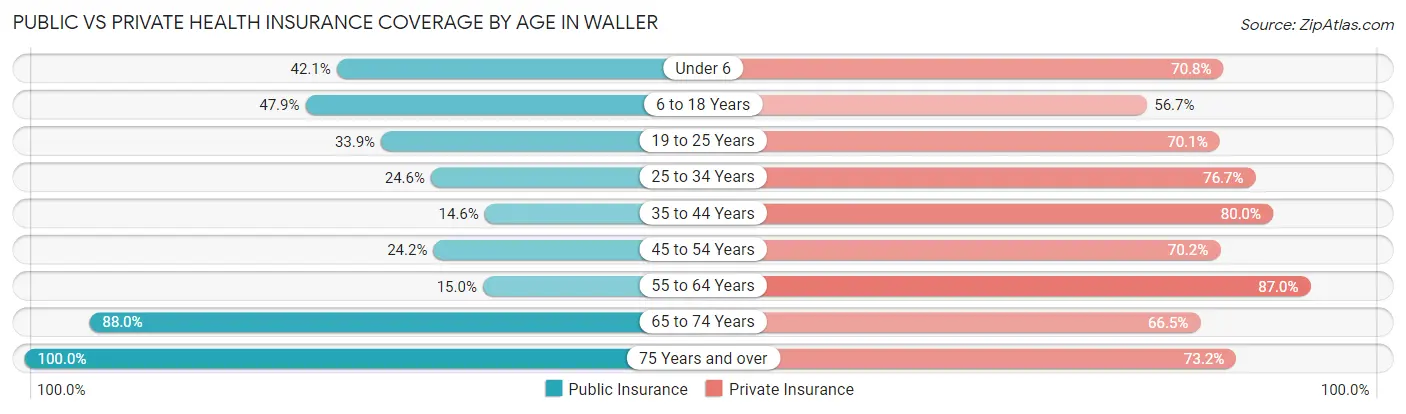
| Age Bracket | Public Insurance | Private Insurance |
| Under 6 | 277 (42.1%) | 466 (70.8%) |
| 6 to 18 Years | 593 (47.9%) | 702 (56.7%) |
| 19 to 25 Years | 171 (33.9%) | 354 (70.1%) |
| 25 to 34 Years | 202 (24.6%) | 630 (76.7%) |
| 35 to 44 Years | 144 (14.6%) | 788 (80.0%) |
| 45 to 54 Years | 248 (24.1%) | 721 (70.2%) |
| 55 to 64 Years | 188 (15.0%) | 1,093 (87.0%) |
| 65 to 74 Years | 746 (88.0%) | 564 (66.5%) |
| 75 Years and over | 623 (100.0%) | 456 (73.2%) |
| Total | 3,192 (40.1%) | 5,774 (72.5%) |
Disability Status by Sex by Age in Waller
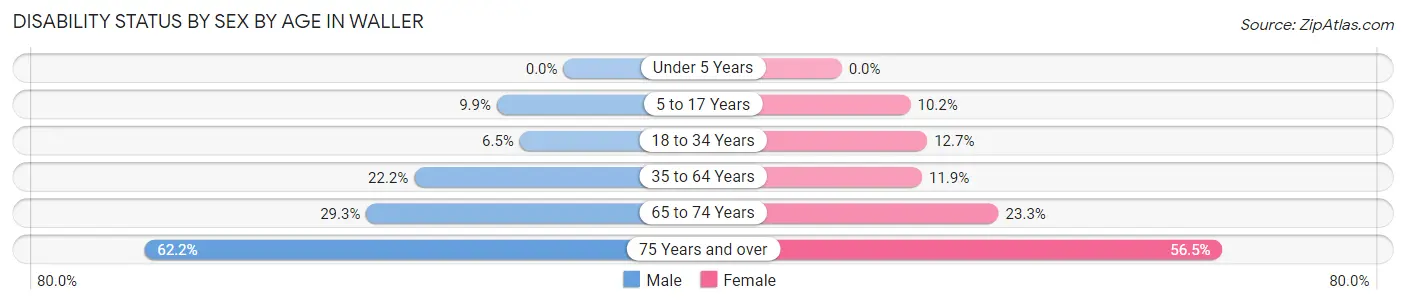
| Age Bracket | Male | Female |
| Under 5 Years | 0 (0.0%) | 0 (0.0%) |
| 5 to 17 Years | 67 (9.9%) | 59 (10.2%) |
| 18 to 34 Years | 43 (6.5%) | 91 (12.7%) |
| 35 to 64 Years | 347 (22.2%) | 203 (11.9%) |
| 65 to 74 Years | 120 (29.3%) | 102 (23.3%) |
| 75 Years and over | 163 (62.2%) | 204 (56.5%) |
Disability Class by Sex by Age in Waller
Disability Class: Hearing Difficulty
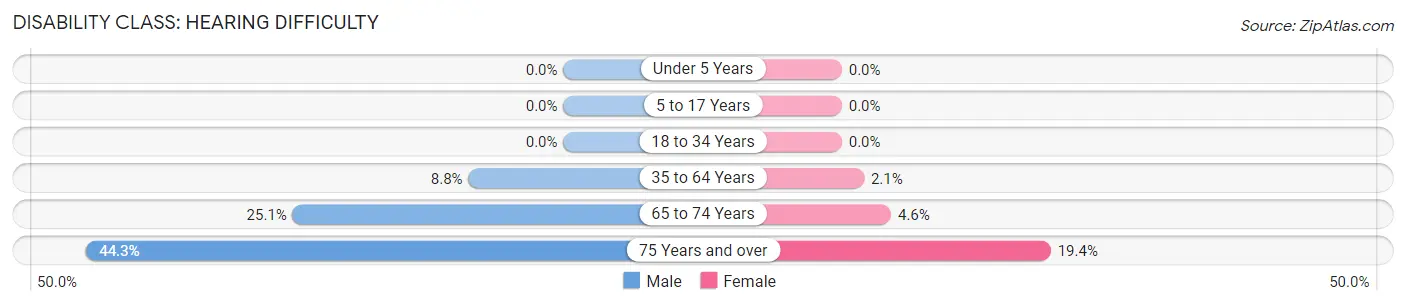
| Age Bracket | Male | Female |
| Under 5 Years | 0 (0.0%) | 0 (0.0%) |
| 5 to 17 Years | 0 (0.0%) | 0 (0.0%) |
| 18 to 34 Years | 0 (0.0%) | 0 (0.0%) |
| 35 to 64 Years | 138 (8.8%) | 35 (2.1%) |
| 65 to 74 Years | 103 (25.1%) | 20 (4.6%) |
| 75 Years and over | 116 (44.3%) | 70 (19.4%) |
Disability Class: Vision Difficulty
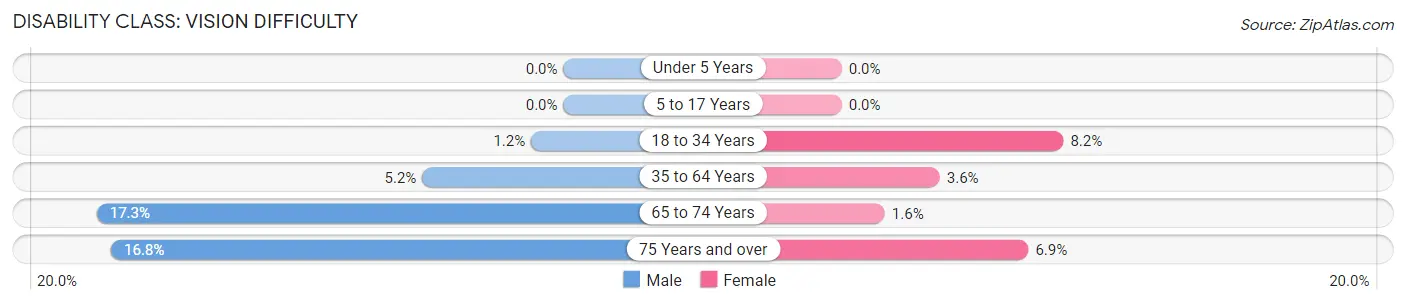
| Age Bracket | Male | Female |
| Under 5 Years | 0 (0.0%) | 0 (0.0%) |
| 5 to 17 Years | 0 (0.0%) | 0 (0.0%) |
| 18 to 34 Years | 8 (1.2%) | 59 (8.2%) |
| 35 to 64 Years | 82 (5.2%) | 62 (3.6%) |
| 65 to 74 Years | 71 (17.3%) | 7 (1.6%) |
| 75 Years and over | 44 (16.8%) | 25 (6.9%) |
Disability Class: Cognitive Difficulty
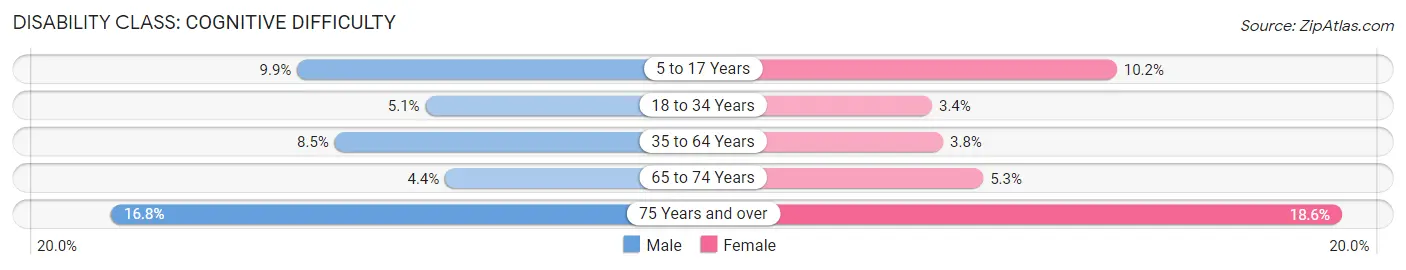
| Age Bracket | Male | Female |
| 5 to 17 Years | 67 (9.9%) | 59 (10.2%) |
| 18 to 34 Years | 34 (5.1%) | 24 (3.4%) |
| 35 to 64 Years | 133 (8.5%) | 64 (3.8%) |
| 65 to 74 Years | 18 (4.4%) | 23 (5.2%) |
| 75 Years and over | 44 (16.8%) | 67 (18.6%) |
Disability Class: Ambulatory Difficulty
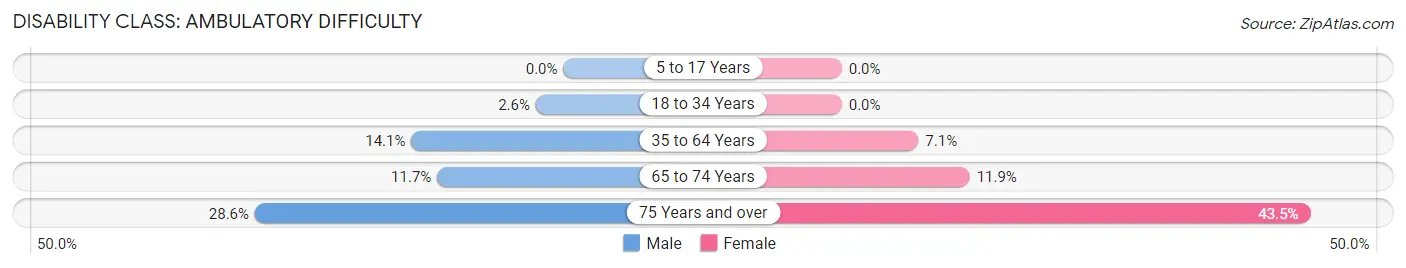
| Age Bracket | Male | Female |
| 5 to 17 Years | 0 (0.0%) | 0 (0.0%) |
| 18 to 34 Years | 17 (2.6%) | 0 (0.0%) |
| 35 to 64 Years | 221 (14.1%) | 121 (7.1%) |
| 65 to 74 Years | 48 (11.7%) | 52 (11.9%) |
| 75 Years and over | 75 (28.6%) | 157 (43.5%) |
Disability Class: Self-Care Difficulty
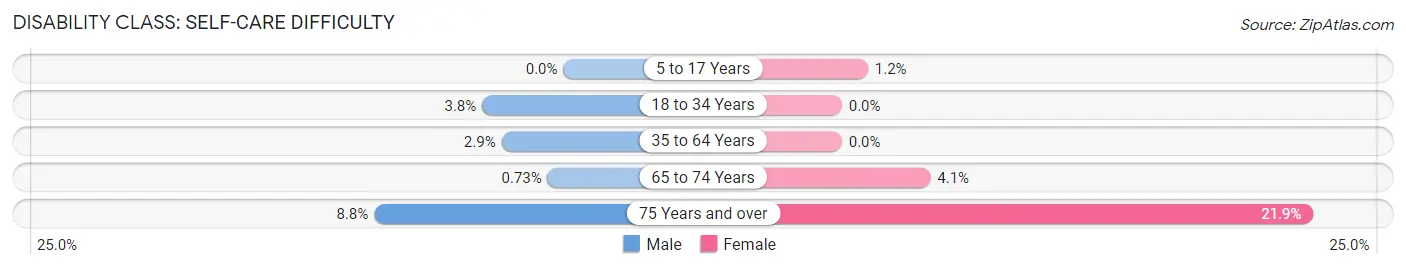
| Age Bracket | Male | Female |
| 5 to 17 Years | 0 (0.0%) | 7 (1.2%) |
| 18 to 34 Years | 25 (3.8%) | 0 (0.0%) |
| 35 to 64 Years | 45 (2.9%) | 0 (0.0%) |
| 65 to 74 Years | 3 (0.7%) | 18 (4.1%) |
| 75 Years and over | 23 (8.8%) | 79 (21.9%) |
Technology Access in Waller
Computing Device Access in Waller
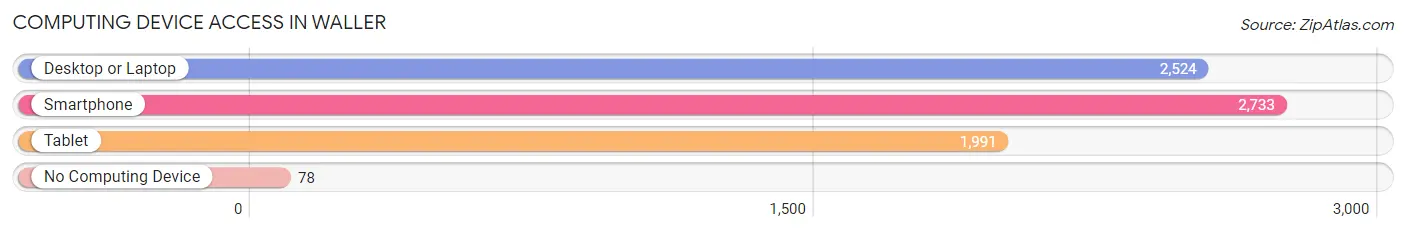
| Device Type | # Households | % Households |
| Desktop or Laptop | 2,524 | 84.5% |
| Smartphone | 2,733 | 91.5% |
| Tablet | 1,991 | 66.7% |
| No Computing Device | 78 | 2.6% |
| Total | 2,986 | 100.0% |
Internet Access in Waller
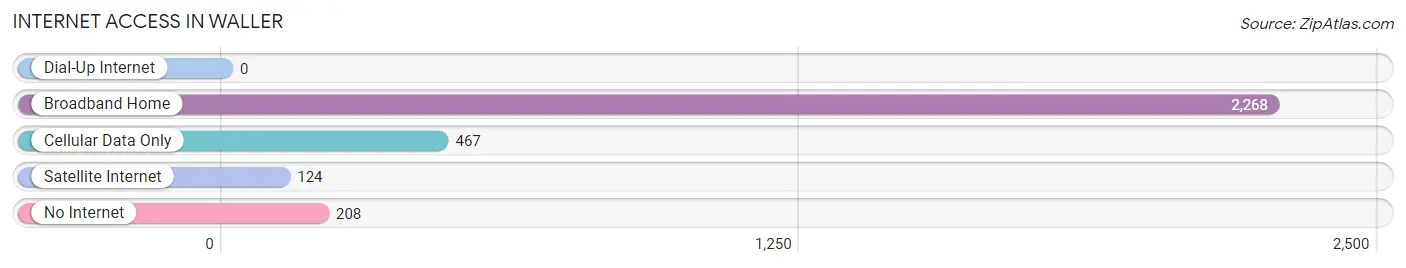
| Internet Type | # Households | % Households |
| Dial-Up Internet | 0 | 0.0% |
| Broadband Home | 2,268 | 75.9% |
| Cellular Data Only | 467 | 15.6% |
| Satellite Internet | 124 | 4.2% |
| No Internet | 208 | 7.0% |
| Total | 2,986 | 100.0% |
Waller Summary
Waller, Washington is a small town located in the Cascade Mountains of Washington State. It is situated in the foothills of the Cascades, about 25 miles east of Seattle. The town has a population of about 1,500 people and is the county seat of Waller County.
Waller was founded in 1883 by a group of settlers from the Midwest. The town was named after the Waller family, who were among the first settlers. The town was originally a logging and farming community, but in the early 1900s, it became a popular tourist destination. The town is known for its beautiful scenery, including the nearby Mount Rainier National Park.
Geographically, Waller is located in the foothills of the Cascades, at an elevation of about 1,000 feet. The town is surrounded by forests and mountains, and is home to several rivers and streams. The climate in Waller is generally mild, with temperatures ranging from the mid-30s in the winter to the mid-80s in the summer.
The economy of Waller is largely based on tourism. The town is home to several resorts and hotels, as well as a variety of restaurants and shops. The town also has a small manufacturing sector, which produces a variety of products, including furniture and clothing.
Demographically, Waller is a predominantly white town, with about 90% of the population being Caucasian. The town also has a small Hispanic population, as well as a small African American population. The median household income in Waller is about $50,000, and the median home value is about $200,000.
Waller is a small town with a rich history and a beautiful natural setting. It is a popular tourist destination, and its economy is largely based on tourism. The town is home to a diverse population, and its economy is largely based on manufacturing and tourism. Waller is a great place to live and visit, and it is a great example of a small town in the Pacific Northwest.
Common Questions
What is Per Capita Income in Waller?
Per Capita income in Waller is $48,533.
What is the Median Family Income in Waller?
Median Family Income in Waller is $123,720.
What is the Median Household income in Waller?
Median Household Income in Waller is $112,500.
What is Income or Wage Gap in Waller?
Income or Wage Gap in Waller is 47.6%.
Women in Waller earn 52.4 cents for every dollar earned by a man.
What is Inequality or Gini Index in Waller?
Inequality or Gini Index in Waller is 0.41.
What is the Total Population of Waller?
Total Population of Waller is 7,991.
What is the Total Male Population of Waller?
Total Male Population of Waller is 3,800.
What is the Total Female Population of Waller?
Total Female Population of Waller is 4,191.
What is the Ratio of Males per 100 Females in Waller?
There are 90.67 Males per 100 Females in Waller.
What is the Ratio of Females per 100 Males in Waller?
There are 110.29 Females per 100 Males in Waller.
What is the Median Population Age in Waller?
Median Population Age in Waller is 42.4 Years.
What is the Average Family Size in Waller
Average Family Size in Waller is 3.1 People.
What is the Average Household Size in Waller
Average Household Size in Waller is 2.7 People.
How Large is the Labor Force in Waller?
There are 3,912 People in the Labor Forcein in Waller.
What is the Percentage of People in the Labor Force in Waller?
61.4% of People are in the Labor Force in Waller.
What is the Unemployment Rate in Waller?
Unemployment Rate in Waller is 3.6%.