Cities with the Lowest Poverty Level Among Children Under the Age of 5 in New York
RELATED REPORTS & OPTIONS
Lowest Poverty | Child 0-5
New York
Compare Cities
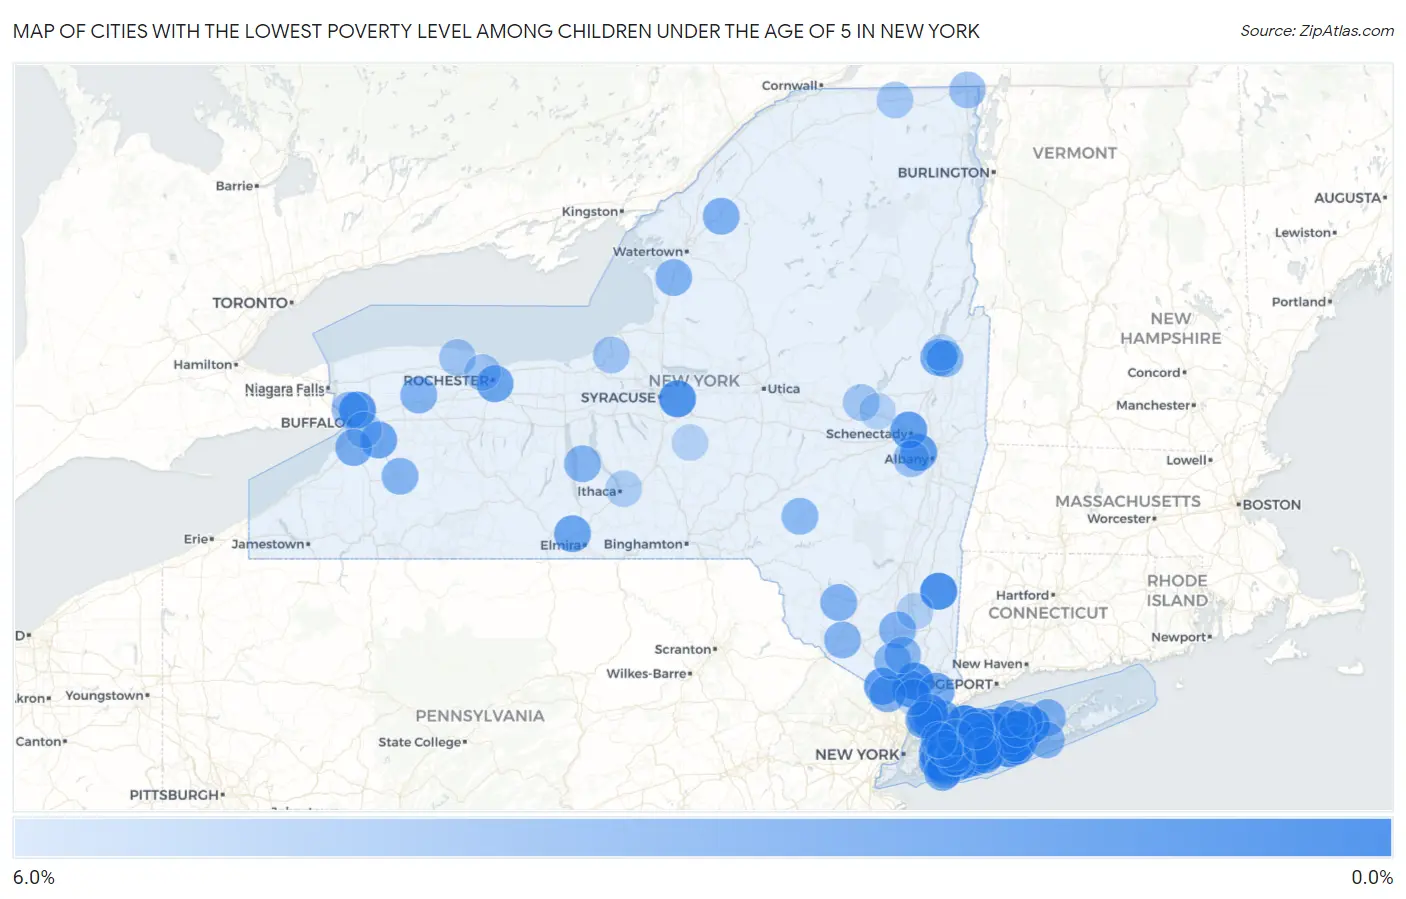
Map of Cities with the Lowest Poverty Level Among Children Under the Age of 5 in New York
6.0%
0.0%
Cities with the Lowest Poverty Level Among Children Under the Age of 5 in New York
| City | Child Poverty | vs State | vs National | |
| 1. | Lloyd Harbor | 0.67% | 18.7%(-18.1)#1 | 18.1%(-17.4)#42 |
| 2. | Selden | 0.74% | 18.7%(-18.0)#2 | 18.1%(-17.3)#52 |
| 3. | Medford | 0.82% | 18.7%(-17.9)#3 | 18.1%(-17.2)#65 |
| 4. | Levittown | 0.92% | 18.7%(-17.8)#4 | 18.1%(-17.1)#84 |
| 5. | North Massapequa | 0.97% | 18.7%(-17.8)#5 | 18.1%(-17.1)#98 |
| 6. | Ridge | 1.0% | 18.7%(-17.7)#6 | 18.1%(-17.1)#105 |
| 7. | Lynbrook | 1.1% | 18.7%(-17.6)#7 | 18.1%(-16.9)#121 |
| 8. | Holtsville | 1.1% | 18.7%(-17.6)#8 | 18.1%(-16.9)#129 |
| 9. | Massapequa | 1.3% | 18.7%(-17.5)#9 | 18.1%(-16.8)#152 |
| 10. | Sayville | 1.4% | 18.7%(-17.4)#10 | 18.1%(-16.7)#178 |
| 11. | Syosset | 1.5% | 18.7%(-17.3)#11 | 18.1%(-16.6)#196 |
| 12. | Millbrook | 1.5% | 18.7%(-17.3)#12 | 18.1%(-16.6)#205 |
| 13. | Patchogue | 1.5% | 18.7%(-17.2)#13 | 18.1%(-16.5)#209 |
| 14. | Croton On Hudson | 1.5% | 18.7%(-17.2)#14 | 18.1%(-16.5)#211 |
| 15. | Garden City | 1.6% | 18.7%(-17.2)#15 | 18.1%(-16.5)#217 |
| 16. | Port Washington | 1.6% | 18.7%(-17.2)#16 | 18.1%(-16.5)#221 |
| 17. | Fort Covington | 1.6% | 18.7%(-17.1)#17 | 18.1%(-16.4)#237 |
| 18. | Fayetteville | 1.7% | 18.7%(-17.1)#18 | 18.1%(-16.4)#238 |
| 19. | Stony Brook | 1.7% | 18.7%(-17.1)#19 | 18.1%(-16.4)#248 |
| 20. | Hicksville | 1.7% | 18.7%(-17.0)#20 | 18.1%(-16.3)#264 |
| 21. | Floral Park | 1.8% | 18.7%(-17.0)#21 | 18.1%(-16.3)#281 |
| 22. | Eggertsville | 1.9% | 18.7%(-16.9)#22 | 18.1%(-16.2)#307 |
| 23. | Kings Park | 1.9% | 18.7%(-16.8)#23 | 18.1%(-16.1)#320 |
| 24. | De Witt | 2.0% | 18.7%(-16.8)#24 | 18.1%(-16.1)#329 |
| 25. | Ronkonkoma | 2.1% | 18.7%(-16.7)#25 | 18.1%(-16.0)#364 |
| 26. | Smithtown | 2.2% | 18.7%(-16.5)#26 | 18.1%(-15.9)#411 |
| 27. | Westmere | 2.3% | 18.7%(-16.5)#27 | 18.1%(-15.8)#440 |
| 28. | Scotia | 2.3% | 18.7%(-16.4)#28 | 18.1%(-15.7)#451 |
| 29. | Bay Shore | 2.3% | 18.7%(-16.4)#29 | 18.1%(-15.7)#456 |
| 30. | Larchmont | 2.4% | 18.7%(-16.4)#30 | 18.1%(-15.7)#467 |
| 31. | Sloatsburg | 2.4% | 18.7%(-16.3)#31 | 18.1%(-15.7)#480 |
| 32. | West Babylon | 2.5% | 18.7%(-16.2)#32 | 18.1%(-15.5)#512 |
| 33. | Dix Hills | 2.5% | 18.7%(-16.2)#33 | 18.1%(-15.5)#524 |
| 34. | Valley Stream | 2.6% | 18.7%(-16.1)#34 | 18.1%(-15.5)#541 |
| 35. | Brighton | 2.7% | 18.7%(-16.0)#35 | 18.1%(-15.3)#590 |
| 36. | Big Flats | 2.8% | 18.7%(-16.0)#36 | 18.1%(-15.3)#603 |
| 37. | Congers | 2.8% | 18.7%(-16.0)#37 | 18.1%(-15.3)#615 |
| 38. | Lindenhurst | 2.8% | 18.7%(-16.0)#38 | 18.1%(-15.3)#618 |
| 39. | North Babylon | 2.8% | 18.7%(-15.9)#39 | 18.1%(-15.2)#632 |
| 40. | East Aurora | 2.8% | 18.7%(-15.9)#40 | 18.1%(-15.2)#640 |
| 41. | Rye | 2.8% | 18.7%(-15.9)#41 | 18.1%(-15.2)#644 |
| 42. | Armonk | 2.9% | 18.7%(-15.9)#42 | 18.1%(-15.2)#651 |
| 43. | Eastchester | 2.9% | 18.7%(-15.8)#43 | 18.1%(-15.2)#669 |
| 44. | Scarsdale | 2.9% | 18.7%(-15.8)#44 | 18.1%(-15.2)#671 |
| 45. | Centerport | 2.9% | 18.7%(-15.8)#45 | 18.1%(-15.1)#682 |
| 46. | West Hempstead | 3.0% | 18.7%(-15.8)#46 | 18.1%(-15.1)#695 |
| 47. | Farmingville | 3.0% | 18.7%(-15.8)#47 | 18.1%(-15.1)#708 |
| 48. | East Setauket | 3.0% | 18.7%(-15.7)#48 | 18.1%(-15.0)#725 |
| 49. | West Glens Falls | 3.1% | 18.7%(-15.6)#49 | 18.1%(-14.9)#748 |
| 50. | Bronxville | 3.2% | 18.7%(-15.5)#50 | 18.1%(-14.8)#797 |
| 51. | Hamburg | 3.2% | 18.7%(-15.5)#51 | 18.1%(-14.8)#806 |
| 52. | West Islip | 3.2% | 18.7%(-15.5)#52 | 18.1%(-14.8)#808 |
| 53. | Suffern | 3.3% | 18.7%(-15.4)#53 | 18.1%(-14.7)#838 |
| 54. | Oceanside | 3.4% | 18.7%(-15.4)#54 | 18.1%(-14.7)#862 |
| 55. | Antwerp | 3.5% | 18.7%(-15.2)#55 | 18.1%(-14.6)#915 |
| 56. | Bellmore | 3.5% | 18.7%(-15.2)#56 | 18.1%(-14.6)#916 |
| 57. | Gardnertown | 3.6% | 18.7%(-15.2)#57 | 18.1%(-14.5)#948 |
| 58. | Woodridge | 3.6% | 18.7%(-15.1)#58 | 18.1%(-14.4)#960 |
| 59. | Baiting Hollow | 3.6% | 18.7%(-15.1)#59 | 18.1%(-14.4)#964 |
| 60. | Barnum Island | 3.6% | 18.7%(-15.1)#60 | 18.1%(-14.4)#965 |
| 61. | Oakfield | 3.7% | 18.7%(-15.1)#61 | 18.1%(-14.4)#984 |
| 62. | North Patchogue | 3.7% | 18.7%(-15.1)#62 | 18.1%(-14.4)#985 |
| 63. | Adams | 3.7% | 18.7%(-15.1)#63 | 18.1%(-14.4)#986 |
| 64. | Long Beach | 3.7% | 18.7%(-15.1)#64 | 18.1%(-14.4)#988 |
| 65. | Arcade | 3.7% | 18.7%(-15.0)#65 | 18.1%(-14.4)#993 |
| 66. | Lodi | 3.7% | 18.7%(-15.0)#66 | 18.1%(-14.4)#1,009 |
| 67. | East Moriches | 3.7% | 18.7%(-15.0)#67 | 18.1%(-14.3)#1,018 |
| 68. | North Bellmore | 3.7% | 18.7%(-15.0)#68 | 18.1%(-14.3)#1,027 |
| 69. | Otisville | 3.8% | 18.7%(-14.9)#69 | 18.1%(-14.2)#1,055 |
| 70. | Woodbury | 3.9% | 18.7%(-14.9)#70 | 18.1%(-14.2)#1,076 |
| 71. | South Glens Falls | 3.9% | 18.7%(-14.8)#71 | 18.1%(-14.1)#1,093 |
| 72. | Delhi | 3.9% | 18.7%(-14.8)#72 | 18.1%(-14.1)#1,110 |
| 73. | West Point | 4.0% | 18.7%(-14.8)#73 | 18.1%(-14.1)#1,125 |
| 74. | Port Jefferson | 4.1% | 18.7%(-14.7)#74 | 18.1%(-14.0)#1,153 |
| 75. | Carmel | 4.3% | 18.7%(-14.5)#75 | 18.1%(-13.8)#1,241 |
| 76. | Kenmore | 4.3% | 18.7%(-14.5)#76 | 18.1%(-13.8)#1,246 |
| 77. | East Meadow | 4.4% | 18.7%(-14.4)#77 | 18.1%(-13.7)#1,281 |
| 78. | Champlain | 4.5% | 18.7%(-14.3)#78 | 18.1%(-13.6)#1,322 |
| 79. | Voorheesville | 4.5% | 18.7%(-14.2)#79 | 18.1%(-13.5)#1,348 |
| 80. | Hamlin | 4.8% | 18.7%(-14.0)#80 | 18.1%(-13.3)#1,441 |
| 81. | Hannibal | 4.8% | 18.7%(-14.0)#81 | 18.1%(-13.3)#1,452 |
| 82. | Greece | 4.8% | 18.7%(-14.0)#82 | 18.1%(-13.3)#1,476 |
| 83. | Roslyn Estates | 4.8% | 18.7%(-13.9)#83 | 18.1%(-13.2)#1,503 |
| 84. | Johnstown | 4.9% | 18.7%(-13.9)#84 | 18.1%(-13.2)#1,510 |
| 85. | North Merrick | 4.9% | 18.7%(-13.8)#85 | 18.1%(-13.2)#1,530 |
| 86. | Muttontown | 4.9% | 18.7%(-13.8)#86 | 18.1%(-13.1)#1,544 |
| 87. | Chateaugay | 5.0% | 18.7%(-13.7)#87 | 18.1%(-13.1)#1,568 |
| 88. | Mineola | 5.1% | 18.7%(-13.7)#88 | 18.1%(-13.0)#1,606 |
| 89. | Rocky Point | 5.2% | 18.7%(-13.6)#89 | 18.1%(-12.9)#1,652 |
| 90. | Deer Park | 5.2% | 18.7%(-13.5)#90 | 18.1%(-12.9)#1,664 |
| 91. | West Seneca | 5.2% | 18.7%(-13.5)#91 | 18.1%(-12.8)#1,676 |
| 92. | Plandome | 5.3% | 18.7%(-13.5)#92 | 18.1%(-12.8)#1,681 |
| 93. | Nyack | 5.3% | 18.7%(-13.4)#93 | 18.1%(-12.7)#1,722 |
| 94. | Forest Home | 5.3% | 18.7%(-13.4)#94 | 18.1%(-12.7)#1,724 |
| 95. | Spackenkill | 5.4% | 18.7%(-13.3)#95 | 18.1%(-12.7)#1,747 |
| 96. | Greenlawn | 5.4% | 18.7%(-13.3)#96 | 18.1%(-12.6)#1,756 |
| 97. | Fort Johnson | 5.6% | 18.7%(-13.2)#97 | 18.1%(-12.5)#1,813 |
| 98. | Deruyter | 5.6% | 18.7%(-13.2)#98 | 18.1%(-12.5)#1,818 |
| 99. | Coram | 5.6% | 18.7%(-13.2)#99 | 18.1%(-12.5)#1,825 |
| 100. | Glens Falls North | 5.6% | 18.7%(-13.1)#100 | 18.1%(-12.4)#1,850 |
Common Questions
What are the Top 10 Cities with the Lowest Poverty Level Among Children Under the Age of 5 in New York?
Top 10 Cities with the Lowest Poverty Level Among Children Under the Age of 5 in New York are:
#1
0.67%
#2
0.74%
#3
0.82%
#4
0.92%
#5
0.97%
#6
1.0%
#7
1.1%
#8
1.1%
#9
1.3%
#10
1.4%
What city has the Lowest Poverty Level Among Children Under the Age of 5 in New York?
Lloyd Harbor has the Lowest Poverty Level Among Children Under the Age of 5 in New York with 0.67%.
What is the Poverty Level Among Children Under the Age of 5 in the State of New York?
Poverty Level Among Children Under the Age of 5 in New York is 18.7%.
What is the Poverty Level Among Children Under the Age of 5 in the United States?
Poverty Level Among Children Under the Age of 5 in the United States is 18.1%.