Lake Morton Berrydale, WA Map & Demographics
Lake Morton Berrydale Map
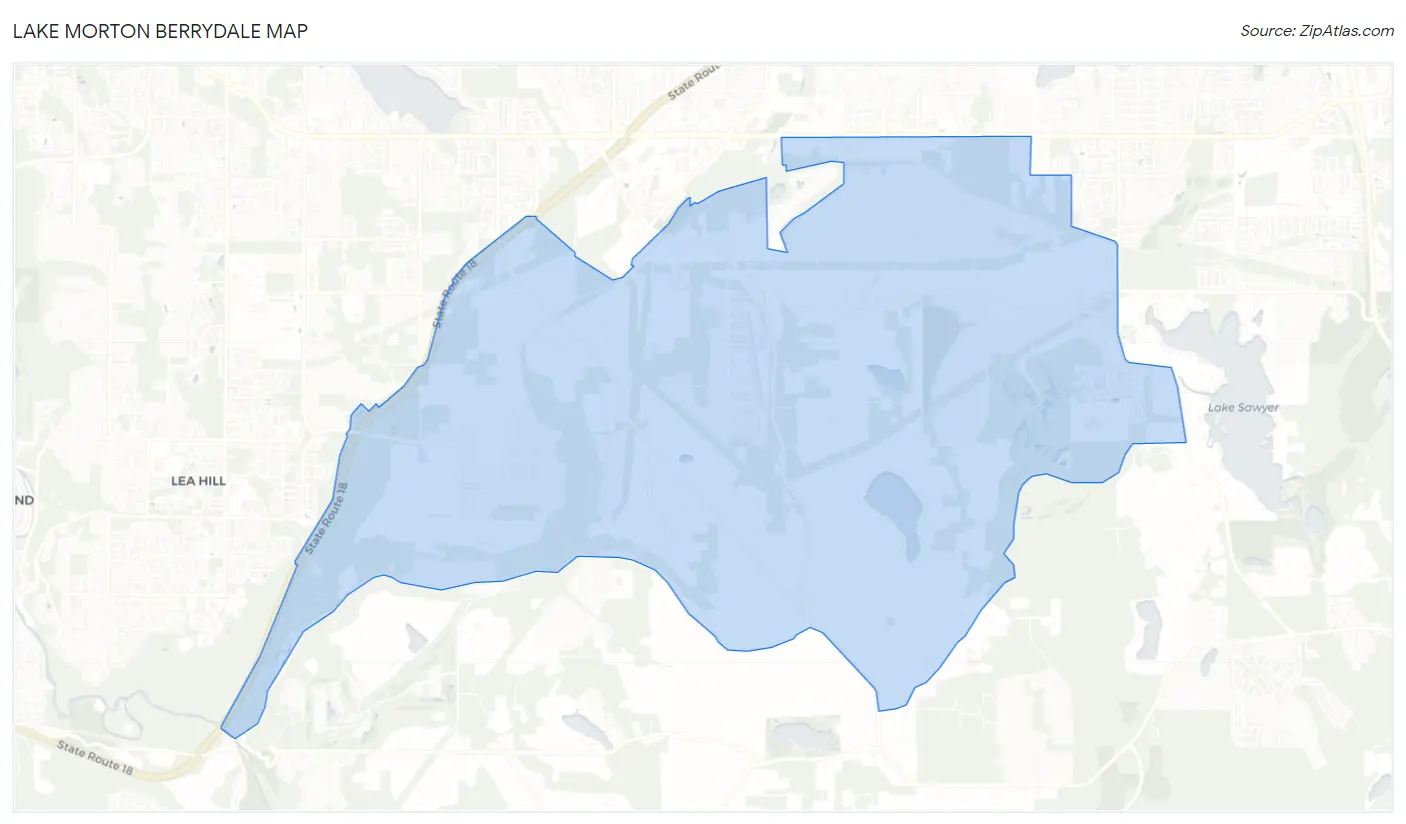
Lake Morton Berrydale Overview
$54,216
PER CAPITA INCOME
$121,316
AVG FAMILY INCOME
$121,272
AVG HOUSEHOLD INCOME
38.3%
WAGE / INCOME GAP [ % ]
61.7¢/ $1
WAGE / INCOME GAP [ $ ]
$6,029
FAMILY INCOME DEFICIT
0.39
INEQUALITY / GINI INDEX
10,457
TOTAL POPULATION
5,514
MALE POPULATION
4,943
FEMALE POPULATION
111.55
MALES / 100 FEMALES
89.64
FEMALES / 100 MALES
42.7
MEDIAN AGE
3.1
AVG FAMILY SIZE
3.0
AVG HOUSEHOLD SIZE
5,458
LABOR FORCE [ PEOPLE ]
67.7%
PERCENT IN LABOR FORCE
3.0%
UNEMPLOYMENT RATE
Income in Lake Morton Berrydale
Income Overview in Lake Morton Berrydale
Per Capita Income in Lake Morton Berrydale is $54,216, while median incomes of families and households are $121,316 and $121,272 respectively.
| Characteristic | Number | Measure |
| Per Capita Income | 10,457 | $54,216 |
| Median Family Income | 3,086 | $121,316 |
| Mean Family Income | 3,086 | $161,191 |
| Median Household Income | 3,534 | $121,272 |
| Mean Household Income | 3,534 | $158,412 |
| Income Deficit | 3,086 | $6,029 |
| Wage / Income Gap (%) | 10,457 | 38.35% |
| Wage / Income Gap ($) | 10,457 | 61.65¢ per $1 |
| Gini / Inequality Index | 10,457 | 0.39 |
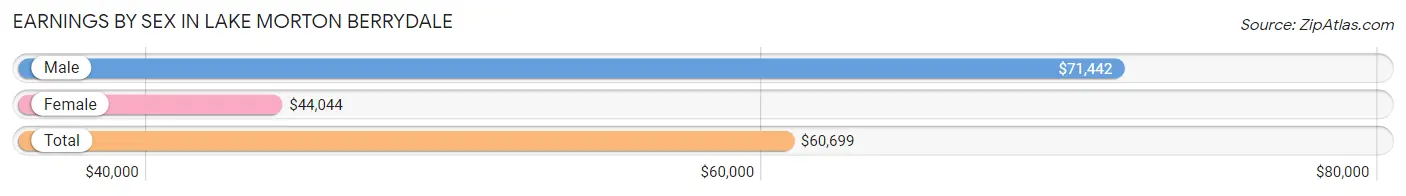
Earnings by Sex in Lake Morton Berrydale
Average Earnings in Lake Morton Berrydale are $60,699, $71,442 for men and $44,044 for women, a difference of 38.4%.
| Sex | Number | Average Earnings |
| Male | 3,152 (54.7%) | $71,442 |
| Female | 2,608 (45.3%) | $44,044 |
| Total | 5,760 (100.0%) | $60,699 |
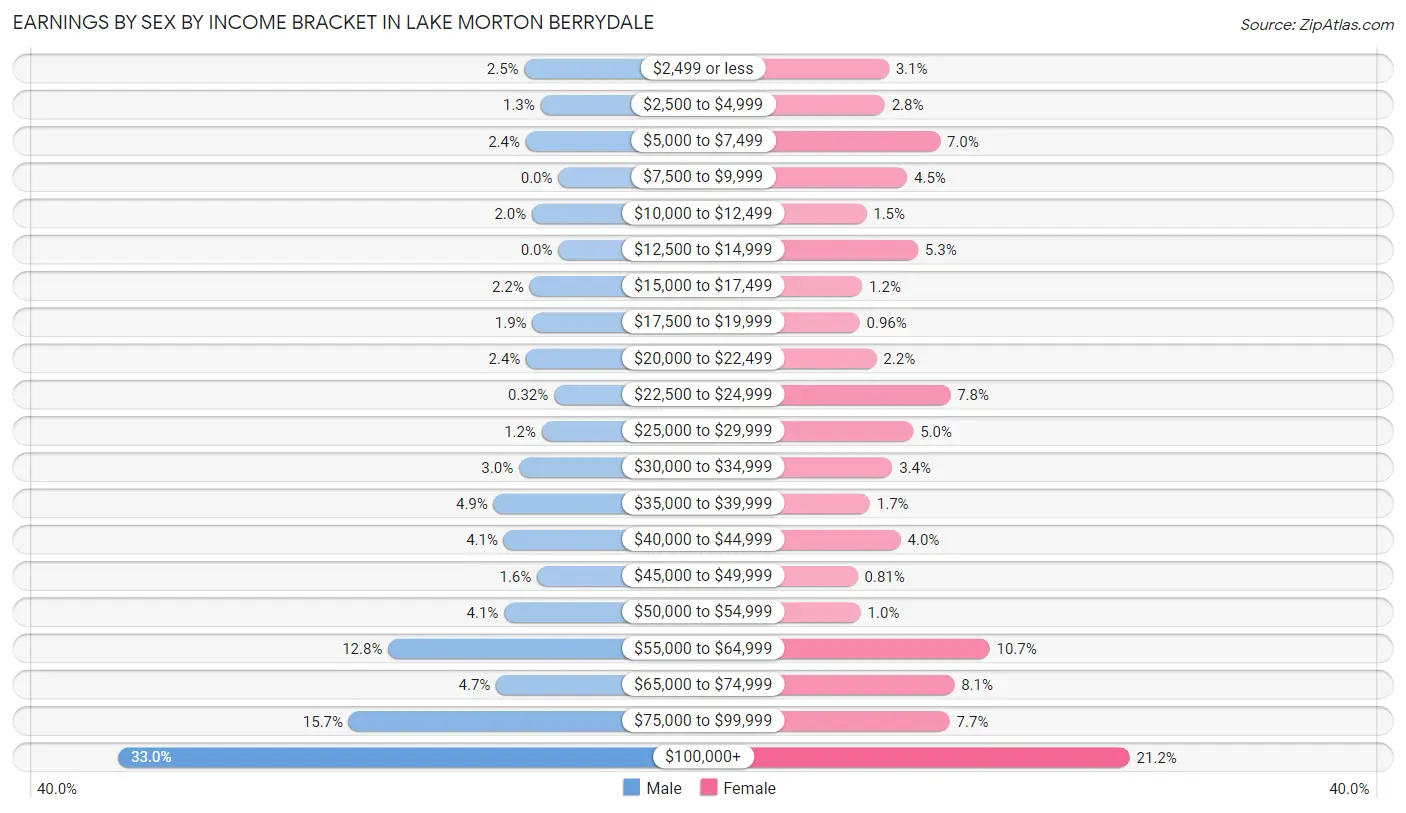
Earnings by Sex by Income Bracket in Lake Morton Berrydale
The most common earnings brackets in Lake Morton Berrydale are $100,000+ for men (1,040 | 33.0%) and $100,000+ for women (553 | 21.2%).
| Income | Male | Female |
| $2,499 or less | 80 (2.5%) | 82 (3.1%) |
| $2,500 to $4,999 | 42 (1.3%) | 74 (2.8%) |
| $5,000 to $7,499 | 77 (2.4%) | 182 (7.0%) |
| $7,500 to $9,999 | 0 (0.0%) | 118 (4.5%) |
| $10,000 to $12,499 | 62 (2.0%) | 38 (1.5%) |
| $12,500 to $14,999 | 0 (0.0%) | 139 (5.3%) |
| $15,000 to $17,499 | 68 (2.2%) | 30 (1.1%) |
| $17,500 to $19,999 | 61 (1.9%) | 25 (1.0%) |
| $20,000 to $22,499 | 76 (2.4%) | 58 (2.2%) |
| $22,500 to $24,999 | 10 (0.3%) | 202 (7.7%) |
| $25,000 to $29,999 | 39 (1.2%) | 130 (5.0%) |
| $30,000 to $34,999 | 93 (2.9%) | 89 (3.4%) |
| $35,000 to $39,999 | 153 (4.9%) | 45 (1.7%) |
| $40,000 to $44,999 | 129 (4.1%) | 105 (4.0%) |
| $45,000 to $49,999 | 50 (1.6%) | 21 (0.8%) |
| $50,000 to $54,999 | 128 (4.1%) | 27 (1.0%) |
| $55,000 to $64,999 | 402 (12.8%) | 279 (10.7%) |
| $65,000 to $74,999 | 147 (4.7%) | 210 (8.1%) |
| $75,000 to $99,999 | 495 (15.7%) | 201 (7.7%) |
| $100,000+ | 1,040 (33.0%) | 553 (21.2%) |
| Total | 3,152 (100.0%) | 2,608 (100.0%) |
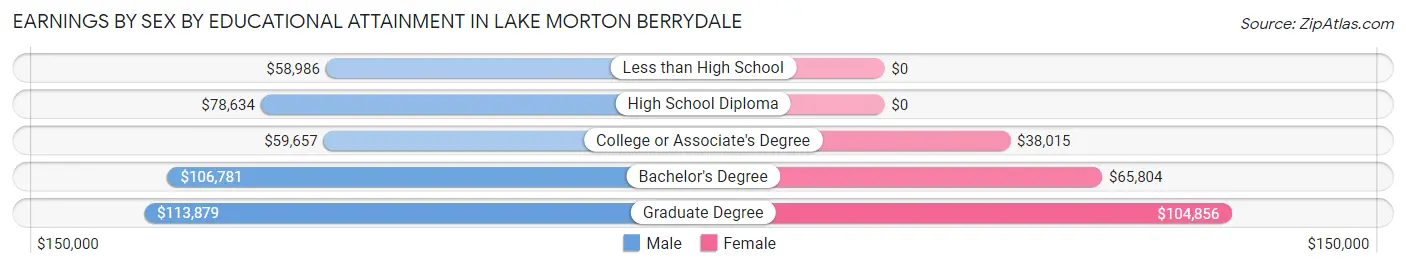
Earnings by Sex by Educational Attainment in Lake Morton Berrydale
Average earnings in Lake Morton Berrydale are $78,857 for men and $55,212 for women, a difference of 30.0%. Men with an educational attainment of graduate degree enjoy the highest average annual earnings of $113,879, while those with less than high school education earn the least with $58,986. Women with an educational attainment of graduate degree earn the most with the average annual earnings of $104,856, while those with college or associate's degree education have the smallest earnings of $38,015.
| Educational Attainment | Male Income | Female Income |
| Less than High School | $58,986 | $0 |
| High School Diploma | $78,634 | $0 |
| College or Associate's Degree | $59,657 | $38,015 |
| Bachelor's Degree | $106,781 | $65,804 |
| Graduate Degree | $113,879 | $104,856 |
| Total | $78,857 | $55,212 |
Family Income in Lake Morton Berrydale
Family Income Brackets in Lake Morton Berrydale
According to the Lake Morton Berrydale family income data, there are 830 families falling into the $200,000+ income range, which is the most common income bracket and makes up 26.9% of all families. Conversely, the $10,000 to $14,999 income bracket is the least frequent group with only 6 families (0.2%) belonging to this category.
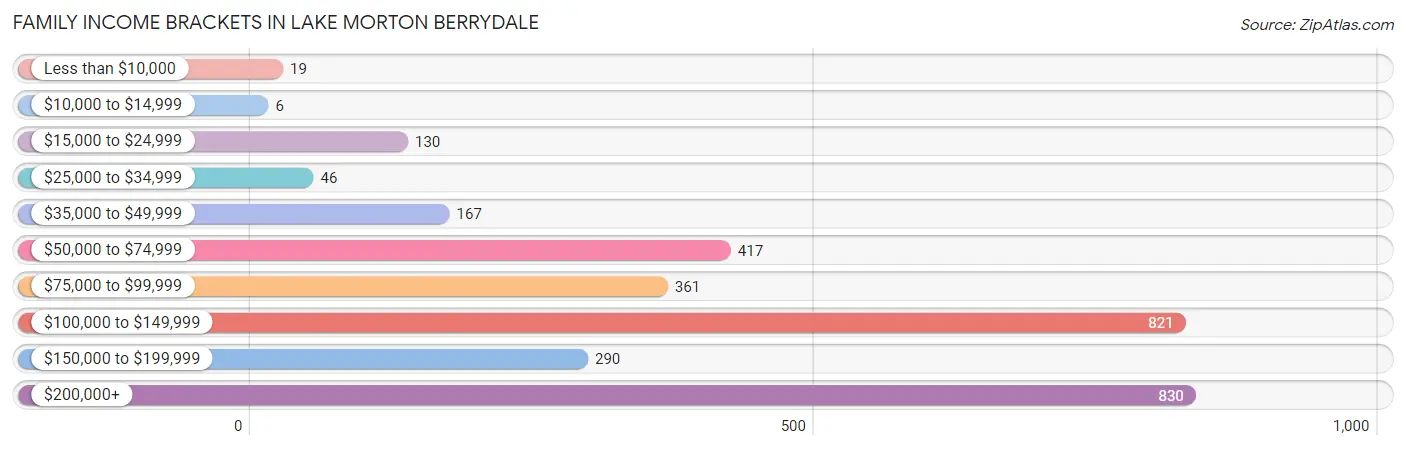
| Income Bracket | # Families | % Families |
| Less than $10,000 | 19 | 0.6% |
| $10,000 to $14,999 | 6 | 0.2% |
| $15,000 to $24,999 | 130 | 4.2% |
| $25,000 to $34,999 | 46 | 1.5% |
| $35,000 to $49,999 | 167 | 5.4% |
| $50,000 to $74,999 | 417 | 13.5% |
| $75,000 to $99,999 | 361 | 11.7% |
| $100,000 to $149,999 | 821 | 26.6% |
| $150,000 to $199,999 | 290 | 9.4% |
| $200,000+ | 830 | 26.9% |
Family Income by Famaliy Size in Lake Morton Berrydale
4-person families (554 | 17.9%) account for the highest median family income in Lake Morton Berrydale with $148,519 per family, while 2-person families (1,585 | 51.4%) have the highest median income of $61,467 per family member.
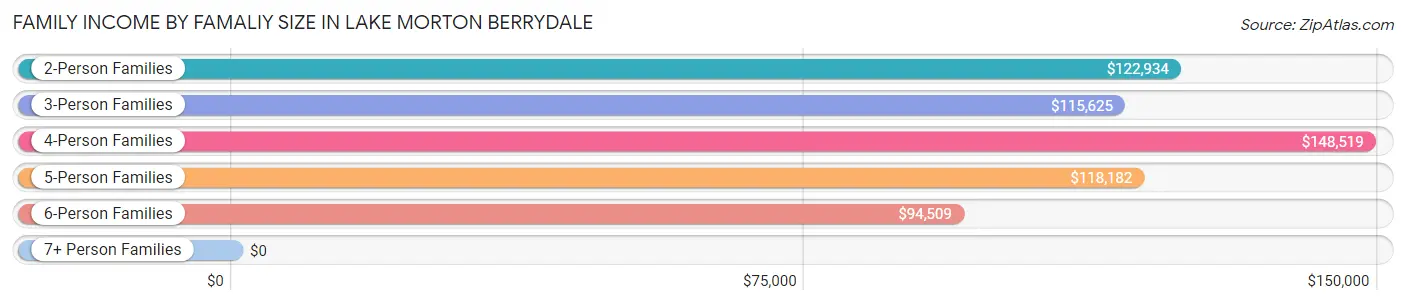
| Income Bracket | # Families | Median Income |
| 2-Person Families | 1,585 (51.4%) | $122,934 |
| 3-Person Families | 534 (17.3%) | $115,625 |
| 4-Person Families | 554 (17.9%) | $148,519 |
| 5-Person Families | 238 (7.7%) | $118,182 |
| 6-Person Families | 99 (3.2%) | $94,509 |
| 7+ Person Families | 76 (2.5%) | $0 |
| Total | 3,086 (100.0%) | $121,316 |
Family Income by Number of Earners in Lake Morton Berrydale
The median family income in Lake Morton Berrydale is $121,316, with families comprising 3+ earners (340) having the highest median family income of $216,172, while families with no earners (421) have the lowest median family income of $63,036, accounting for 11.0% and 13.6% of families, respectively.
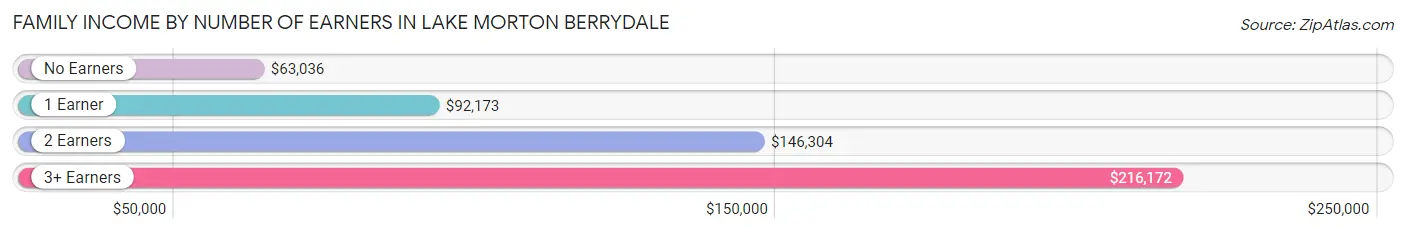
| Number of Earners | # Families | Median Income |
| No Earners | 421 (13.6%) | $63,036 |
| 1 Earner | 797 (25.8%) | $92,173 |
| 2 Earners | 1,528 (49.5%) | $146,304 |
| 3+ Earners | 340 (11.0%) | $216,172 |
| Total | 3,086 (100.0%) | $121,316 |
Household Income in Lake Morton Berrydale
Household Income Brackets in Lake Morton Berrydale
With 1,004 households falling in the category, the $100,000 to $149,999 income range is the most frequent in Lake Morton Berrydale, accounting for 28.4% of all households. In contrast, only 7 households (0.2%) fall into the $10,000 to $14,999 income bracket, making it the least populous group.
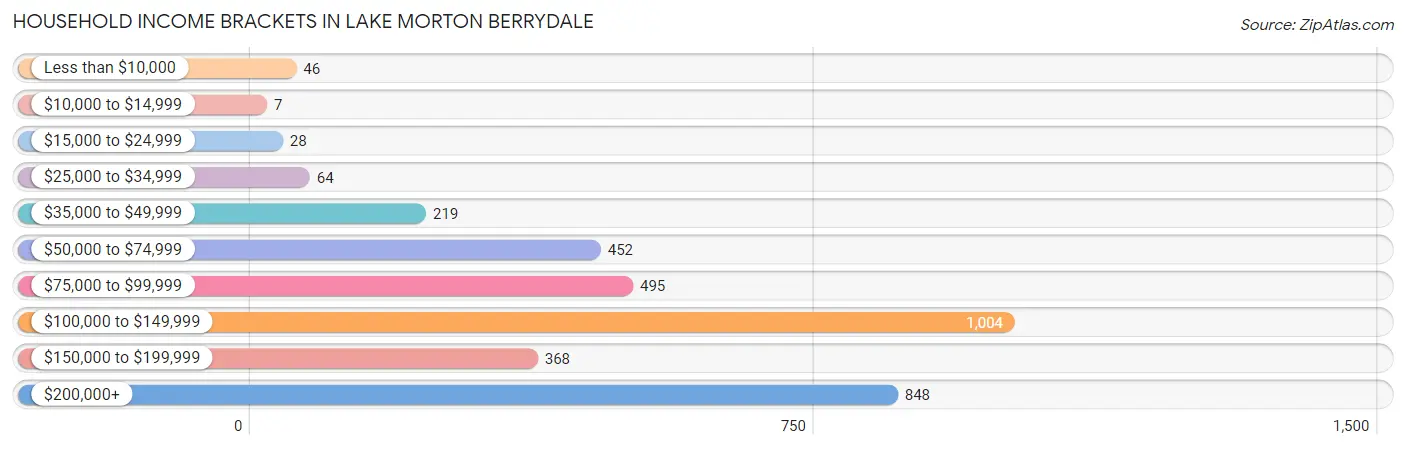
| Income Bracket | # Households | % Households |
| Less than $10,000 | 46 | 1.3% |
| $10,000 to $14,999 | 7 | 0.2% |
| $15,000 to $24,999 | 28 | 0.8% |
| $25,000 to $34,999 | 64 | 1.8% |
| $35,000 to $49,999 | 219 | 6.2% |
| $50,000 to $74,999 | 452 | 12.8% |
| $75,000 to $99,999 | 495 | 14.0% |
| $100,000 to $149,999 | 1,004 | 28.4% |
| $150,000 to $199,999 | 368 | 10.4% |
| $200,000+ | 848 | 24.0% |
Household Income by Householder Age in Lake Morton Berrydale
The median household income in Lake Morton Berrydale is $121,272, with the highest median household income of $127,604 found in the 45 to 64 years age bracket for the primary householder. A total of 1,759 households (49.8%) fall into this category. Meanwhile, the 15 to 24 years age bracket for the primary householder has the lowest median household income of $0, with 42 households (1.2%) in this group.
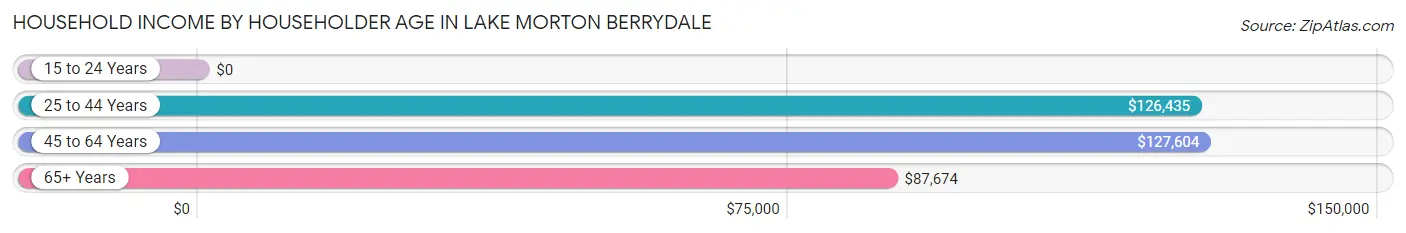
| Income Bracket | # Households | Median Income |
| 15 to 24 Years | 42 (1.2%) | $0 |
| 25 to 44 Years | 985 (27.9%) | $126,435 |
| 45 to 64 Years | 1,759 (49.8%) | $127,604 |
| 65+ Years | 748 (21.2%) | $87,674 |
| Total | 3,534 (100.0%) | $121,272 |
Poverty in Lake Morton Berrydale
Income Below Poverty by Sex and Age in Lake Morton Berrydale
With 4.3% poverty level for males and 5.9% for females among the residents of Lake Morton Berrydale, 16 and 17 year old males and 25 to 34 year old females are the most vulnerable to poverty, with 38 males (28.1%) and 150 females (23.0%) in their respective age groups living below the poverty level.
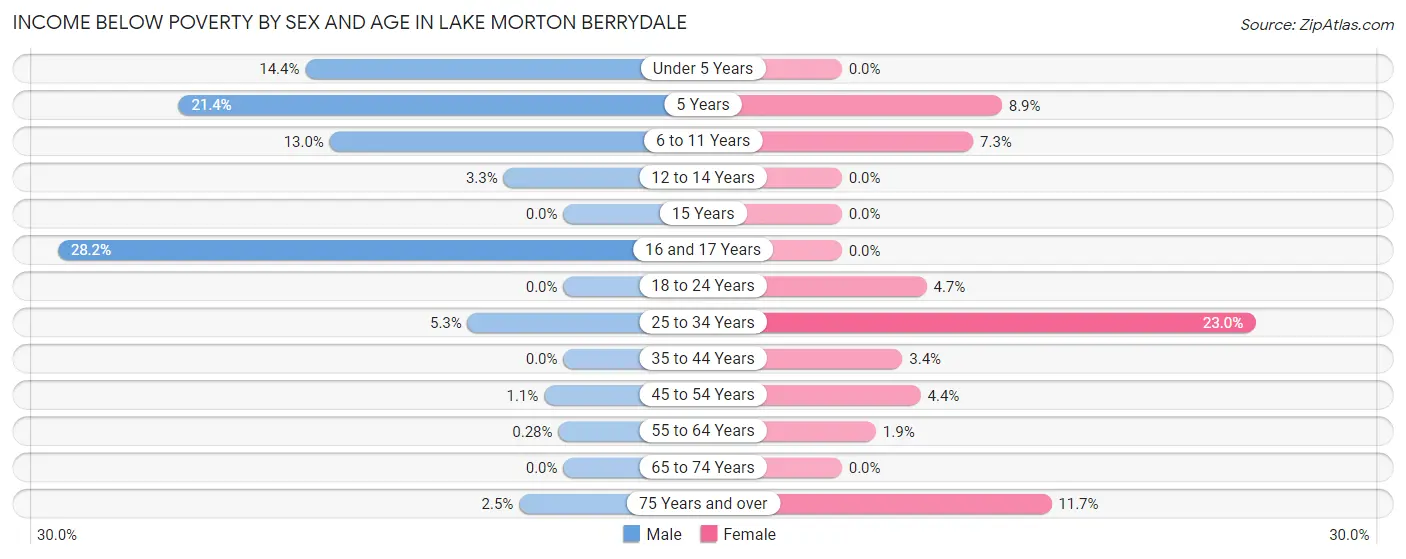
| Age Bracket | Male | Female |
| Under 5 Years | 51 (14.4%) | 0 (0.0%) |
| 5 Years | 18 (21.4%) | 9 (8.9%) |
| 6 to 11 Years | 76 (13.0%) | 25 (7.3%) |
| 12 to 14 Years | 9 (3.3%) | 0 (0.0%) |
| 15 Years | 0 (0.0%) | 0 (0.0%) |
| 16 and 17 Years | 38 (28.1%) | 0 (0.0%) |
| 18 to 24 Years | 0 (0.0%) | 11 (4.7%) |
| 25 to 34 Years | 26 (5.3%) | 150 (23.0%) |
| 35 to 44 Years | 0 (0.0%) | 20 (3.4%) |
| 45 to 54 Years | 10 (1.1%) | 38 (4.4%) |
| 55 to 64 Years | 2 (0.3%) | 15 (1.9%) |
| 65 to 74 Years | 0 (0.0%) | 0 (0.0%) |
| 75 Years and over | 7 (2.5%) | 21 (11.7%) |
| Total | 237 (4.3%) | 289 (5.9%) |
Income Above Poverty by Sex and Age in Lake Morton Berrydale
According to the poverty statistics in Lake Morton Berrydale, males aged 15 years and females aged under 5 years are the age groups that are most secure financially, with 100.0% of males and 100.0% of females in these age groups living above the poverty line.
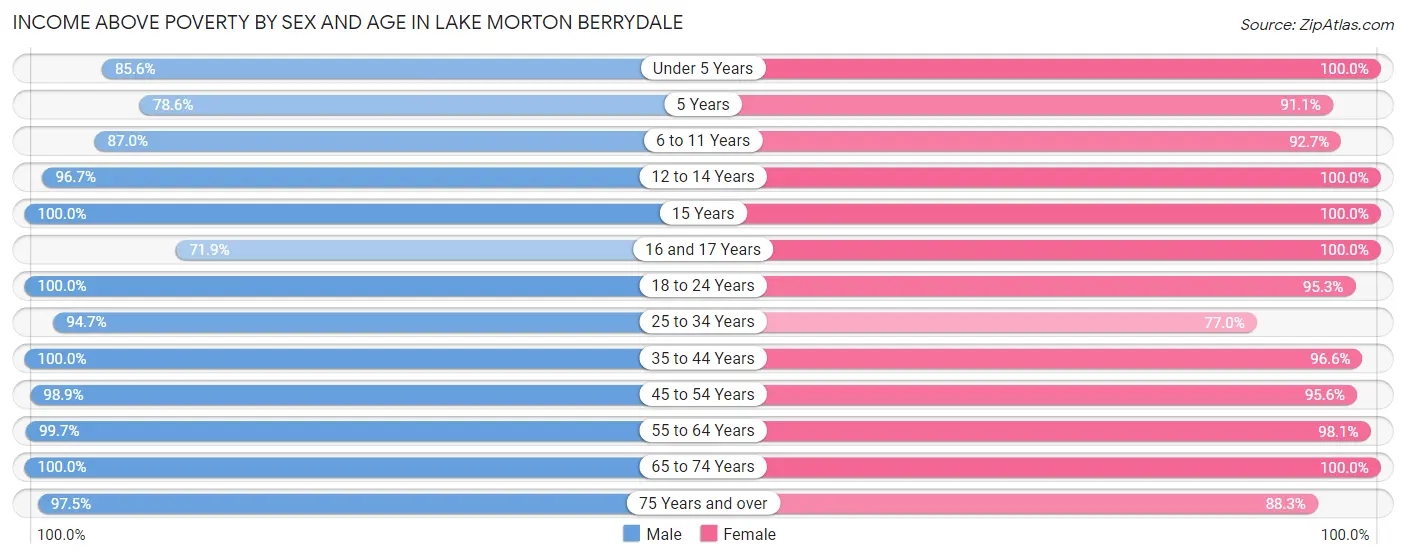
| Age Bracket | Male | Female |
| Under 5 Years | 304 (85.6%) | 236 (100.0%) |
| 5 Years | 66 (78.6%) | 92 (91.1%) |
| 6 to 11 Years | 508 (87.0%) | 317 (92.7%) |
| 12 to 14 Years | 261 (96.7%) | 248 (100.0%) |
| 15 Years | 47 (100.0%) | 70 (100.0%) |
| 16 and 17 Years | 97 (71.9%) | 136 (100.0%) |
| 18 to 24 Years | 329 (100.0%) | 222 (95.3%) |
| 25 to 34 Years | 462 (94.7%) | 502 (77.0%) |
| 35 to 44 Years | 678 (100.0%) | 574 (96.6%) |
| 45 to 54 Years | 925 (98.9%) | 827 (95.6%) |
| 55 to 64 Years | 717 (99.7%) | 776 (98.1%) |
| 65 to 74 Years | 548 (100.0%) | 495 (100.0%) |
| 75 Years and over | 277 (97.5%) | 159 (88.3%) |
| Total | 5,219 (95.7%) | 4,654 (94.2%) |
Income Below Poverty Among Married-Couple Families in Lake Morton Berrydale
The poverty statistics for married-couple families in Lake Morton Berrydale show that 1.3% or 33 of the total 2,597 families live below the poverty line. Families with 3 or 4 children have the highest poverty rate of 13.0%, comprising of 26 families. On the other hand, families with 1 or 2 children have the lowest poverty rate of 0.0%, which includes 0 families.
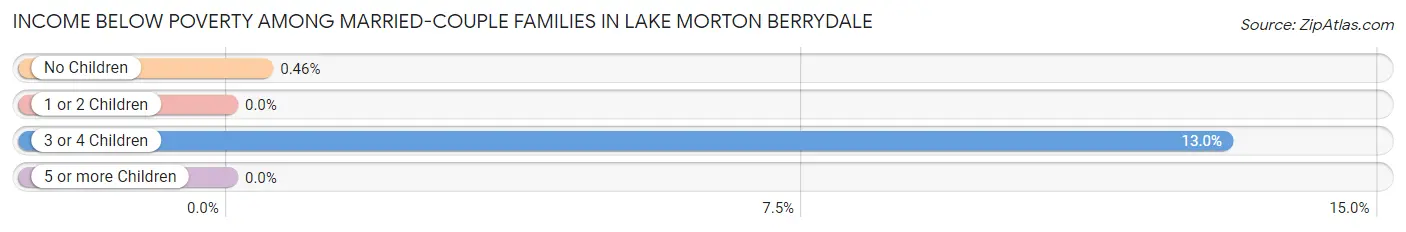
| Children | Above Poverty | Below Poverty |
| No Children | 1,531 (99.5%) | 7 (0.5%) |
| 1 or 2 Children | 809 (100.0%) | 0 (0.0%) |
| 3 or 4 Children | 174 (87.0%) | 26 (13.0%) |
| 5 or more Children | 50 (100.0%) | 0 (0.0%) |
| Total | 2,564 (98.7%) | 33 (1.3%) |
Income Below Poverty Among Single-Parent Households in Lake Morton Berrydale
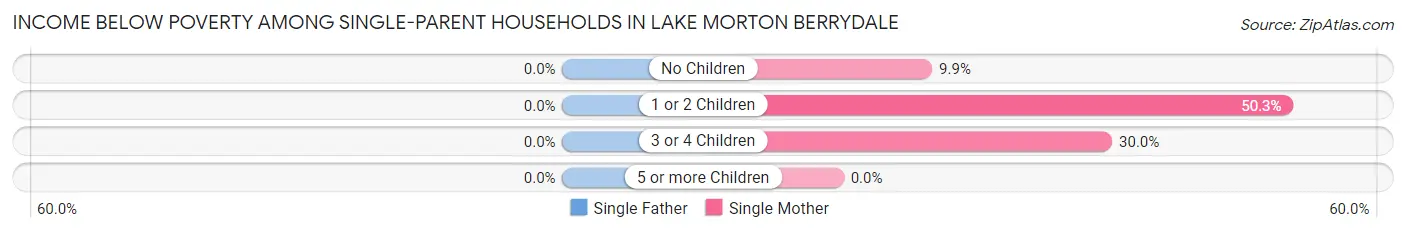
| Children | Single Father | Single Mother |
| No Children | 0 (0.0%) | 9 (9.9%) |
| 1 or 2 Children | 0 (0.0%) | 101 (50.2%) |
| 3 or 4 Children | 0 (0.0%) | 9 (30.0%) |
| 5 or more Children | 0 (0.0%) | 0 (0.0%) |
| Total | 0 (0.0%) | 119 (37.0%) |
Income Below Poverty Among Married-Couple vs Single-Parent Households in Lake Morton Berrydale
The poverty data for Lake Morton Berrydale shows that 33 of the married-couple family households (1.3%) and 119 of the single-parent households (24.3%) are living below the poverty level. Within the married-couple family households, those with 3 or 4 children have the highest poverty rate, with 26 households (13.0%) falling below the poverty line. Among the single-parent households, those with 1 or 2 children have the highest poverty rate, with 101 household (38.9%) living below poverty.
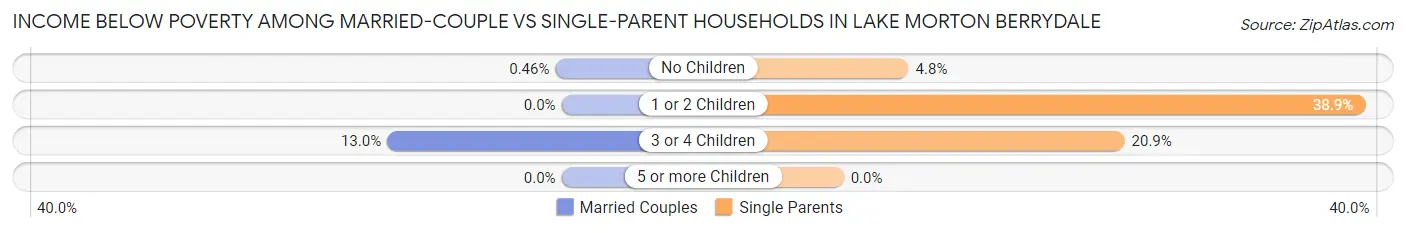
| Children | Married-Couple Families | Single-Parent Households |
| No Children | 7 (0.5%) | 9 (4.8%) |
| 1 or 2 Children | 0 (0.0%) | 101 (38.9%) |
| 3 or 4 Children | 26 (13.0%) | 9 (20.9%) |
| 5 or more Children | 0 (0.0%) | 0 (0.0%) |
| Total | 33 (1.3%) | 119 (24.3%) |
Race in Lake Morton Berrydale
The most populous races in Lake Morton Berrydale are White / Caucasian (7,993 | 76.4%), Two or more Races (1,016 | 9.7%), and Hispanic or Latino (1,010 | 9.7%).
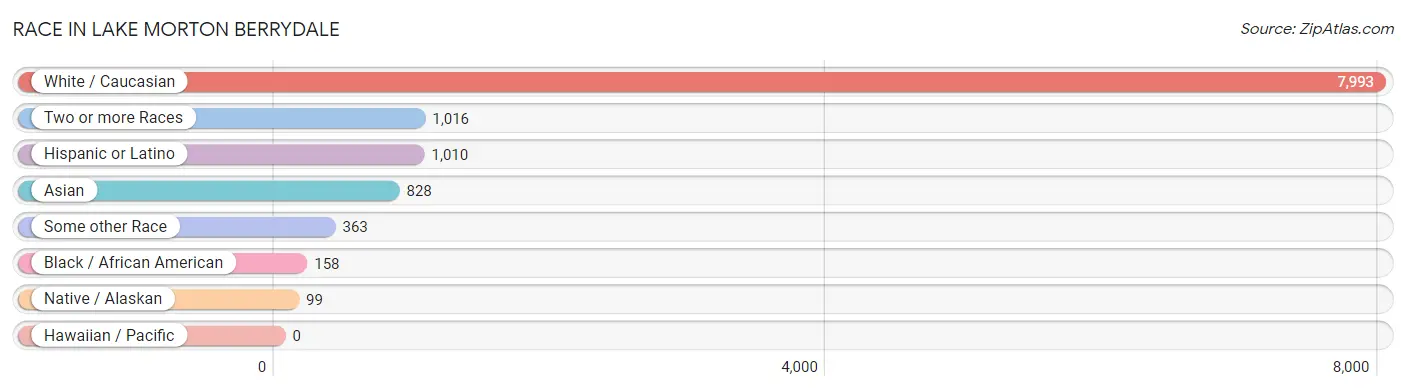
| Race | # Population | % Population |
| Asian | 828 | 7.9% |
| Black / African American | 158 | 1.5% |
| Hawaiian / Pacific | 0 | 0.0% |
| Hispanic or Latino | 1,010 | 9.7% |
| Native / Alaskan | 99 | 0.9% |
| White / Caucasian | 7,993 | 76.4% |
| Two or more Races | 1,016 | 9.7% |
| Some other Race | 363 | 3.5% |
| Total | 10,457 | 100.0% |
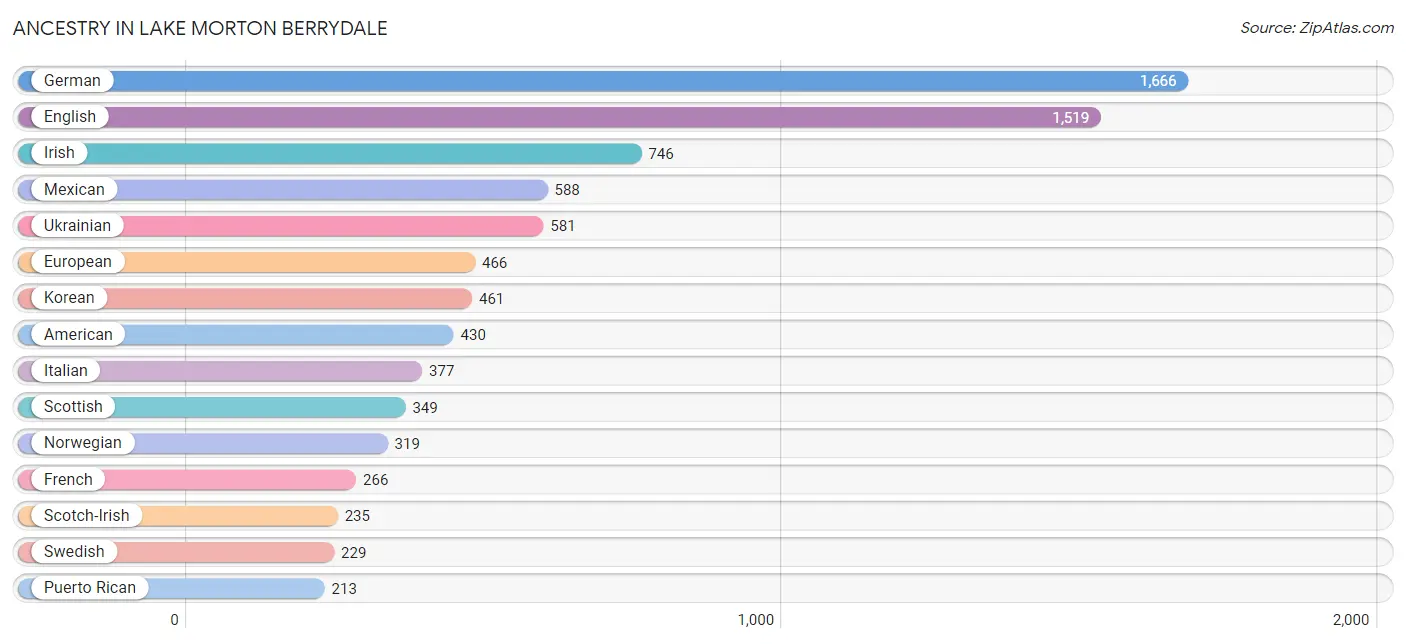
Ancestry in Lake Morton Berrydale
The most populous ancestries reported in Lake Morton Berrydale are German (1,666 | 15.9%), English (1,519 | 14.5%), Irish (746 | 7.1%), Mexican (588 | 5.6%), and Ukrainian (581 | 5.6%), together accounting for 48.8% of all Lake Morton Berrydale residents.
| Ancestry | # Population | % Population |
| American | 430 | 4.1% |
| Arab | 8 | 0.1% |
| Barbadian | 21 | 0.2% |
| Bhutanese | 140 | 1.3% |
| British | 54 | 0.5% |
| Burmese | 37 | 0.4% |
| Canadian | 44 | 0.4% |
| Celtic | 25 | 0.2% |
| Central American | 172 | 1.6% |
| Cherokee | 19 | 0.2% |
| Czech | 23 | 0.2% |
| Danish | 174 | 1.7% |
| Dutch | 109 | 1.0% |
| Eastern European | 45 | 0.4% |
| English | 1,519 | 14.5% |
| Estonian | 16 | 0.2% |
| European | 466 | 4.5% |
| French | 266 | 2.5% |
| French Canadian | 77 | 0.7% |
| German | 1,666 | 15.9% |
| Greek | 28 | 0.3% |
| Guamanian / Chamorro | 66 | 0.6% |
| Hungarian | 35 | 0.3% |
| Indian (Asian) | 108 | 1.0% |
| Irish | 746 | 7.1% |
| Italian | 377 | 3.6% |
| Jamaican | 11 | 0.1% |
| Japanese | 28 | 0.3% |
| Korean | 461 | 4.4% |
| Lebanese | 8 | 0.1% |
| Luxembourger | 8 | 0.1% |
| Malaysian | 27 | 0.3% |
| Mexican | 588 | 5.6% |
| Mexican American Indian | 41 | 0.4% |
| Native Hawaiian | 15 | 0.1% |
| Northern European | 34 | 0.3% |
| Norwegian | 319 | 3.0% |
| Pakistani | 20 | 0.2% |
| Polish | 190 | 1.8% |
| Portuguese | 59 | 0.6% |
| Puerto Rican | 213 | 2.0% |
| Puget Sound Salish | 34 | 0.3% |
| Salvadoran | 172 | 1.6% |
| Samoan | 46 | 0.4% |
| Scandinavian | 67 | 0.6% |
| Scotch-Irish | 235 | 2.2% |
| Scottish | 349 | 3.3% |
| Slovak | 8 | 0.1% |
| Spaniard | 31 | 0.3% |
| Sri Lankan | 173 | 1.7% |
| Swedish | 229 | 2.2% |
| Swiss | 34 | 0.3% |
| Thai | 198 | 1.9% |
| Tlingit-Haida | 6 | 0.1% |
| Turkish | 29 | 0.3% |
| Ukrainian | 581 | 5.6% |
| Welsh | 78 | 0.7% |
| Yugoslavian | 9 | 0.1% | View All 58 Rows |
Immigrants in Lake Morton Berrydale
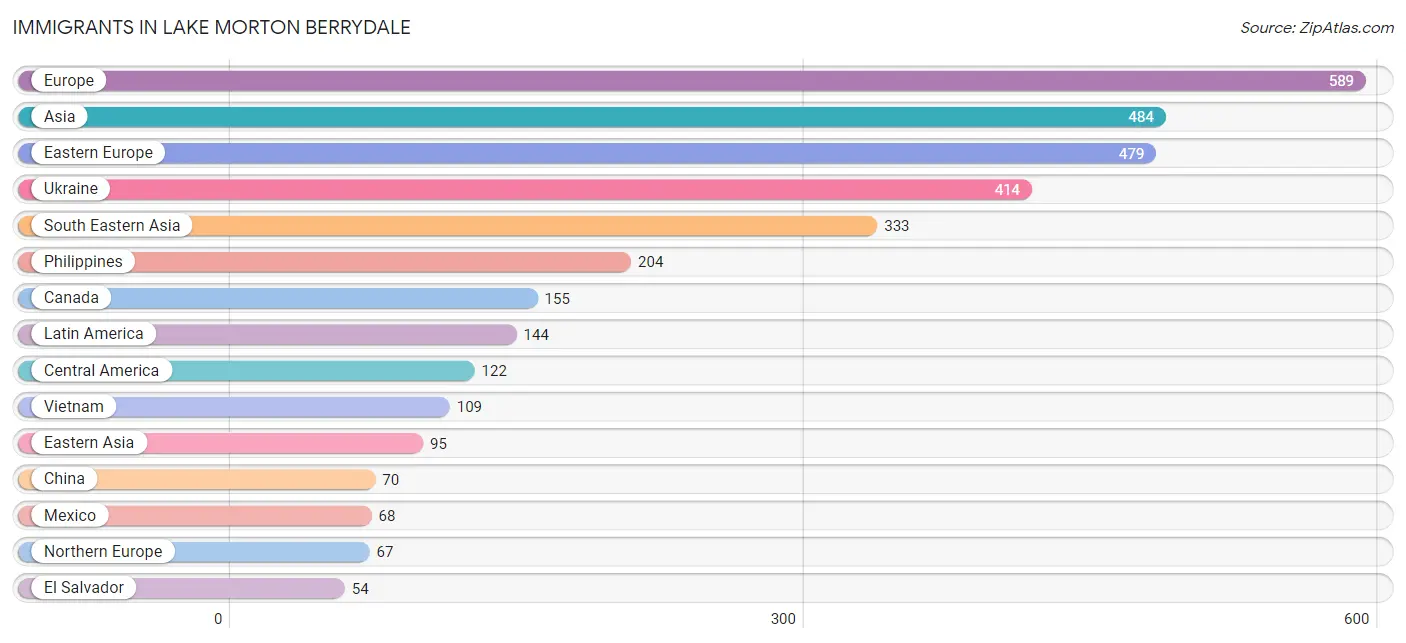
The most numerous immigrant groups reported in Lake Morton Berrydale came from Europe (589 | 5.6%), Asia (484 | 4.6%), Eastern Europe (479 | 4.6%), Ukraine (414 | 4.0%), and South Eastern Asia (333 | 3.2%), together accounting for 22.0% of all Lake Morton Berrydale residents.
| Immigration Origin | # Population | % Population |
| Asia | 484 | 4.6% |
| Barbados | 11 | 0.1% |
| Canada | 155 | 1.5% |
| Caribbean | 22 | 0.2% |
| Central America | 122 | 1.2% |
| China | 70 | 0.7% |
| Eastern Asia | 95 | 0.9% |
| Eastern Europe | 479 | 4.6% |
| El Salvador | 54 | 0.5% |
| England | 22 | 0.2% |
| Europe | 589 | 5.6% |
| Germany | 10 | 0.1% |
| India | 46 | 0.4% |
| Italy | 4 | 0.0% |
| Jamaica | 11 | 0.1% |
| Japan | 25 | 0.2% |
| Latin America | 144 | 1.4% |
| Mexico | 68 | 0.6% |
| Netherlands | 29 | 0.3% |
| Northern Europe | 67 | 0.6% |
| Philippines | 204 | 1.9% |
| Romania | 53 | 0.5% |
| Russia | 12 | 0.1% |
| Scotland | 8 | 0.1% |
| South Central Asia | 46 | 0.4% |
| South Eastern Asia | 333 | 3.2% |
| Southern Europe | 4 | 0.0% |
| Taiwan | 10 | 0.1% |
| Thailand | 20 | 0.2% |
| Turkey | 10 | 0.1% |
| Ukraine | 414 | 4.0% |
| Vietnam | 109 | 1.0% |
| Western Asia | 10 | 0.1% |
| Western Europe | 39 | 0.4% | View All 34 Rows |
Sex and Age in Lake Morton Berrydale
Sex and Age in Lake Morton Berrydale
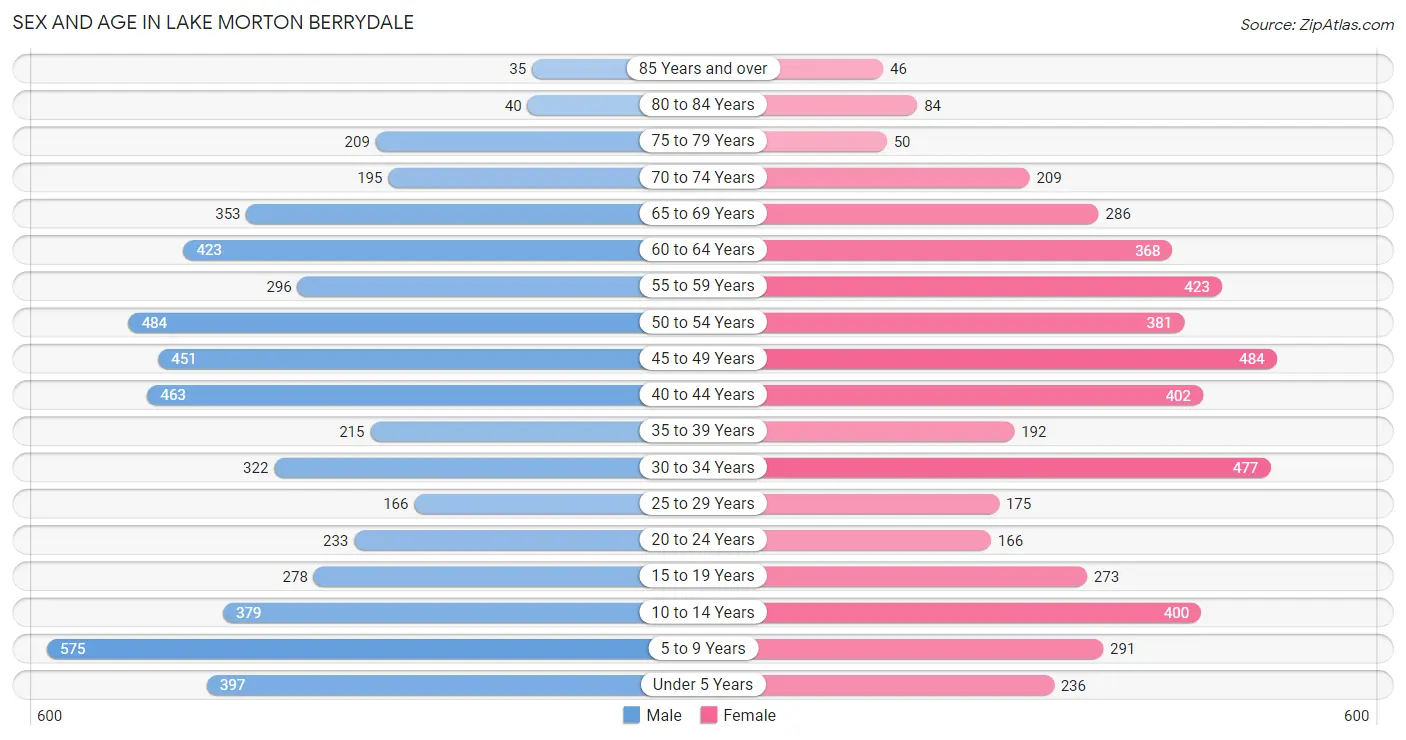
The most populous age groups in Lake Morton Berrydale are 5 to 9 Years (575 | 10.4%) for men and 45 to 49 Years (484 | 9.8%) for women.
| Age Bracket | Male | Female |
| Under 5 Years | 397 (7.2%) | 236 (4.8%) |
| 5 to 9 Years | 575 (10.4%) | 291 (5.9%) |
| 10 to 14 Years | 379 (6.9%) | 400 (8.1%) |
| 15 to 19 Years | 278 (5.0%) | 273 (5.5%) |
| 20 to 24 Years | 233 (4.2%) | 166 (3.4%) |
| 25 to 29 Years | 166 (3.0%) | 175 (3.5%) |
| 30 to 34 Years | 322 (5.8%) | 477 (9.7%) |
| 35 to 39 Years | 215 (3.9%) | 192 (3.9%) |
| 40 to 44 Years | 463 (8.4%) | 402 (8.1%) |
| 45 to 49 Years | 451 (8.2%) | 484 (9.8%) |
| 50 to 54 Years | 484 (8.8%) | 381 (7.7%) |
| 55 to 59 Years | 296 (5.4%) | 423 (8.6%) |
| 60 to 64 Years | 423 (7.7%) | 368 (7.4%) |
| 65 to 69 Years | 353 (6.4%) | 286 (5.8%) |
| 70 to 74 Years | 195 (3.5%) | 209 (4.2%) |
| 75 to 79 Years | 209 (3.8%) | 50 (1.0%) |
| 80 to 84 Years | 40 (0.7%) | 84 (1.7%) |
| 85 Years and over | 35 (0.6%) | 46 (0.9%) |
| Total | 5,514 (100.0%) | 4,943 (100.0%) |
Families and Households in Lake Morton Berrydale
Median Family Size in Lake Morton Berrydale
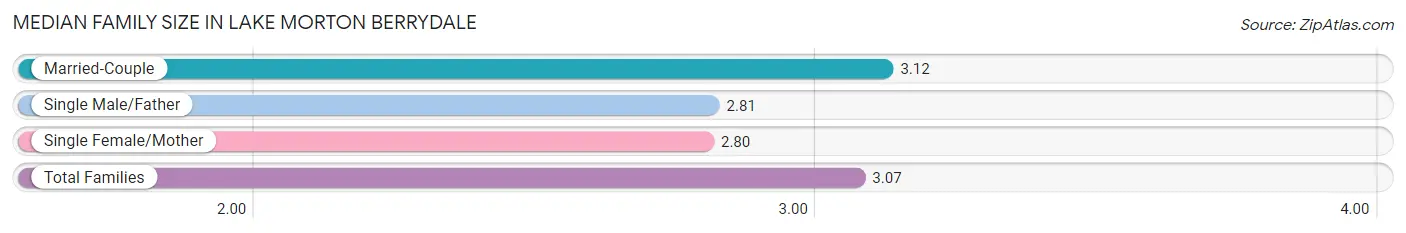
The median family size in Lake Morton Berrydale is 3.07 persons per family, with married-couple families (2,597 | 84.2%) accounting for the largest median family size of 3.12 persons per family. On the other hand, single female/mother families (322 | 10.4%) represent the smallest median family size with 2.80 persons per family.
| Family Type | # Families | Family Size |
| Married-Couple | 2,597 (84.2%) | 3.12 |
| Single Male/Father | 167 (5.4%) | 2.81 |
| Single Female/Mother | 322 (10.4%) | 2.80 |
| Total Families | 3,086 (100.0%) | 3.07 |
Median Household Size in Lake Morton Berrydale
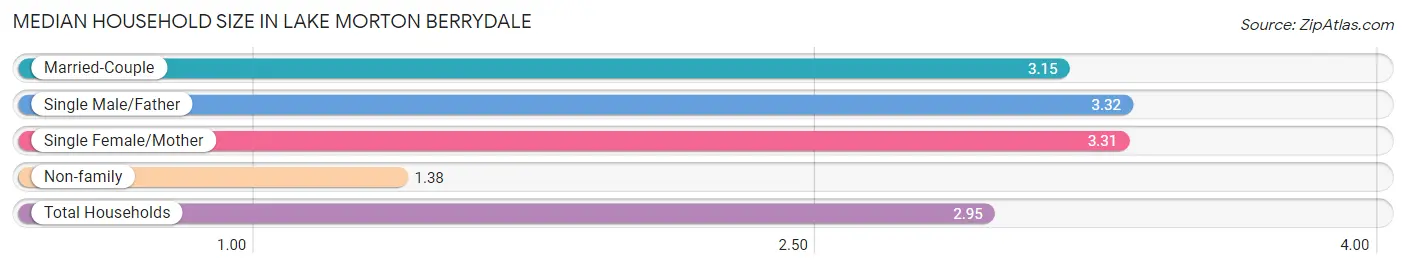
The median household size in Lake Morton Berrydale is 2.95 persons per household, with single male/father households (167 | 4.7%) accounting for the largest median household size of 3.32 persons per household. non-family households (448 | 12.7%) represent the smallest median household size with 1.38 persons per household.
| Household Type | # Households | Household Size |
| Married-Couple | 2,597 (73.5%) | 3.15 |
| Single Male/Father | 167 (4.7%) | 3.32 |
| Single Female/Mother | 322 (9.1%) | 3.31 |
| Non-family | 448 (12.7%) | 1.38 |
| Total Households | 3,534 (100.0%) | 2.95 |
Household Size by Marriage Status in Lake Morton Berrydale
Out of a total of 3,534 households in Lake Morton Berrydale, 3,086 (87.3%) are family households, while 448 (12.7%) are nonfamily households. The most numerous type of family households are 2-person households, comprising 1,409, and the most common type of nonfamily households are 1-person households, comprising 307.
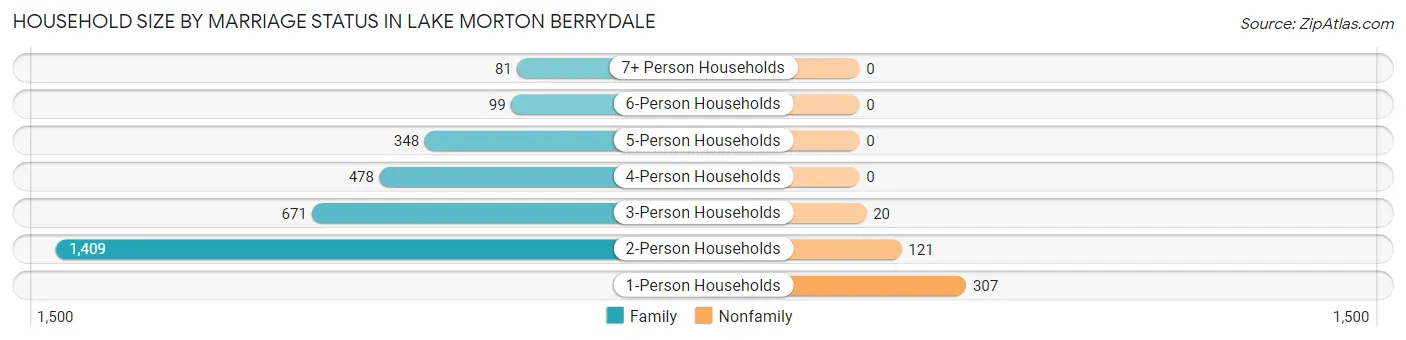
| Household Size | Family Households | Nonfamily Households |
| 1-Person Households | - | 307 (8.7%) |
| 2-Person Households | 1,409 (39.9%) | 121 (3.4%) |
| 3-Person Households | 671 (19.0%) | 20 (0.6%) |
| 4-Person Households | 478 (13.5%) | 0 (0.0%) |
| 5-Person Households | 348 (9.9%) | 0 (0.0%) |
| 6-Person Households | 99 (2.8%) | 0 (0.0%) |
| 7+ Person Households | 81 (2.3%) | 0 (0.0%) |
| Total | 3,086 (87.3%) | 448 (12.7%) |
Female Fertility in Lake Morton Berrydale
Fertility by Age in Lake Morton Berrydale
Average fertility rate in Lake Morton Berrydale is 46.0 births per 1,000 women. Women in the age bracket of 20 to 34 years have the highest fertility rate with 99.0 births per 1,000 women. Women in the age bracket of 20 to 34 years acount for 77.9% of all women with births.
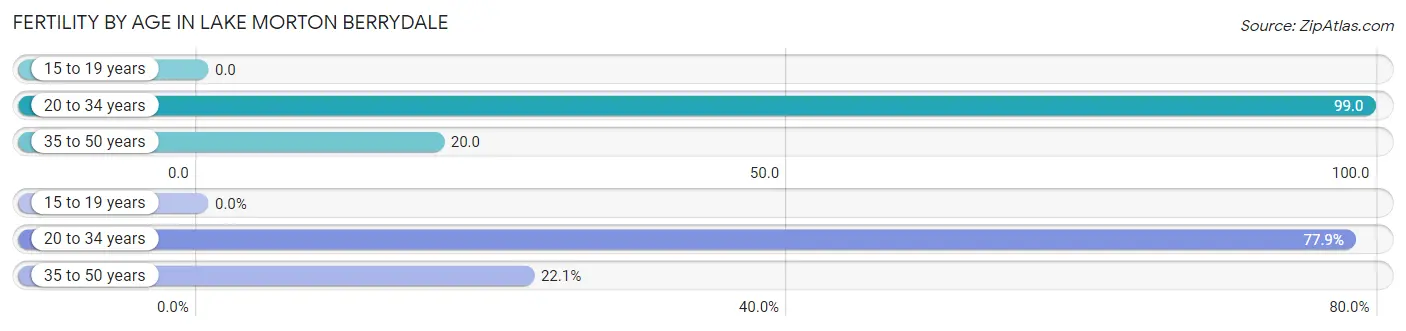
| Age Bracket | Women with Births | Births / 1,000 Women |
| 15 to 19 years | 0 (0.0%) | 0.0 |
| 20 to 34 years | 81 (77.9%) | 99.0 |
| 35 to 50 years | 23 (22.1%) | 20.0 |
| Total | 104 (100.0%) | 46.0 |
Fertility by Age by Marriage Status in Lake Morton Berrydale
77.9% of women with births (104) in Lake Morton Berrydale are married. The highest percentage of unmarried women with births falls into 20 to 34 years age bracket with 28.4% of them unmarried at the time of birth, while the lowest percentage of unmarried women with births belong to 35 to 50 years age bracket with 0.0% of them unmarried.
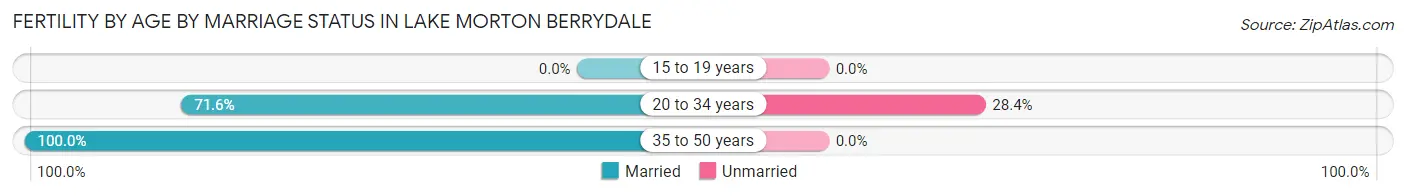
| Age Bracket | Married | Unmarried |
| 15 to 19 years | 0 (0.0%) | 0 (0.0%) |
| 20 to 34 years | 58 (71.6%) | 23 (28.4%) |
| 35 to 50 years | 23 (100.0%) | 0 (0.0%) |
| Total | 81 (77.9%) | 23 (22.1%) |
Fertility by Education in Lake Morton Berrydale
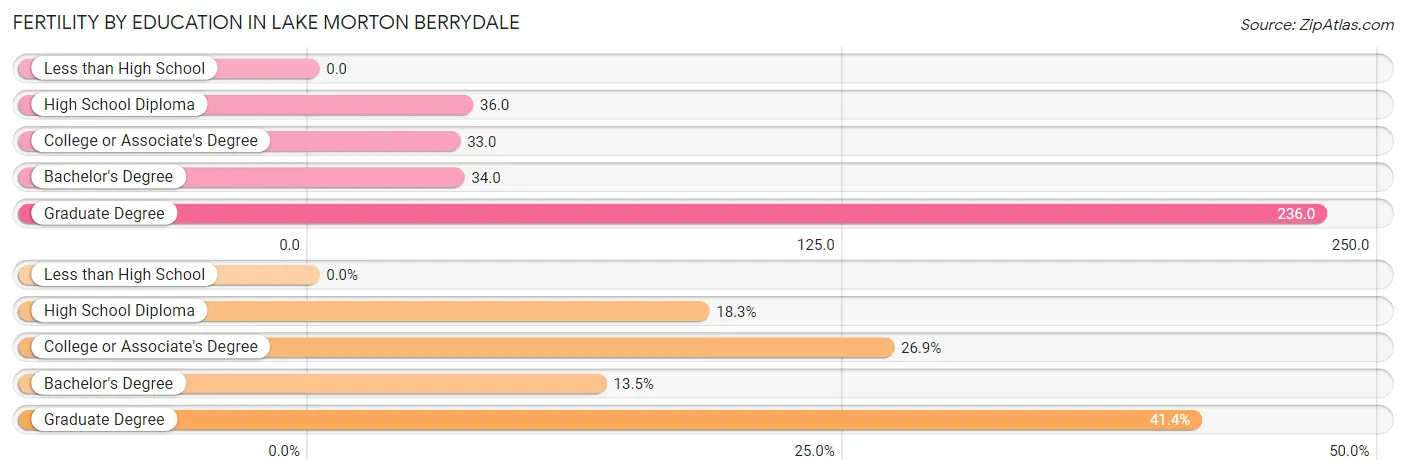
| Educational Attainment | Women with Births | Births / 1,000 Women |
| Less than High School | 0 (0.0%) | 0.0 |
| High School Diploma | 19 (18.3%) | 36.0 |
| College or Associate's Degree | 28 (26.9%) | 33.0 |
| Bachelor's Degree | 14 (13.5%) | 34.0 |
| Graduate Degree | 43 (41.3%) | 236.0 |
| Total | 104 (100.0%) | 46.0 |
Fertility by Education by Marriage Status in Lake Morton Berrydale
22.1% of women with births in Lake Morton Berrydale are unmarried. Women with the educational attainment of bachelor's degree are most likely to be married with 100.0% of them married at childbirth, while women with the educational attainment of college or associate's degree are least likely to be married with 50.0% of them unmarried at childbirth.
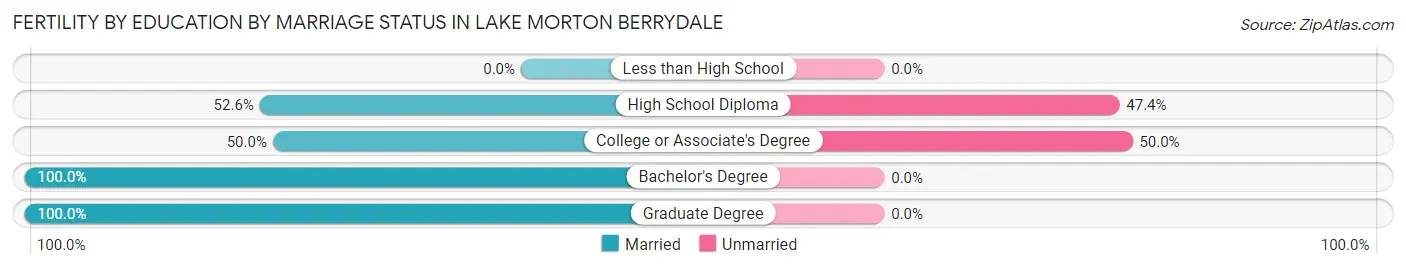
| Educational Attainment | Married | Unmarried |
| Less than High School | 0 (0.0%) | 0 (0.0%) |
| High School Diploma | 10 (52.6%) | 9 (47.4%) |
| College or Associate's Degree | 14 (50.0%) | 14 (50.0%) |
| Bachelor's Degree | 14 (100.0%) | 0 (0.0%) |
| Graduate Degree | 43 (100.0%) | 0 (0.0%) |
| Total | 81 (77.9%) | 23 (22.1%) |
Employment Characteristics in Lake Morton Berrydale
Employment by Class of Employer in Lake Morton Berrydale
Among the 5,147 employed individuals in Lake Morton Berrydale, private company employees (3,374 | 65.5%), local government employees (509 | 9.9%), and not-for-profit organizations (379 | 7.4%) make up the most common classes of employment.
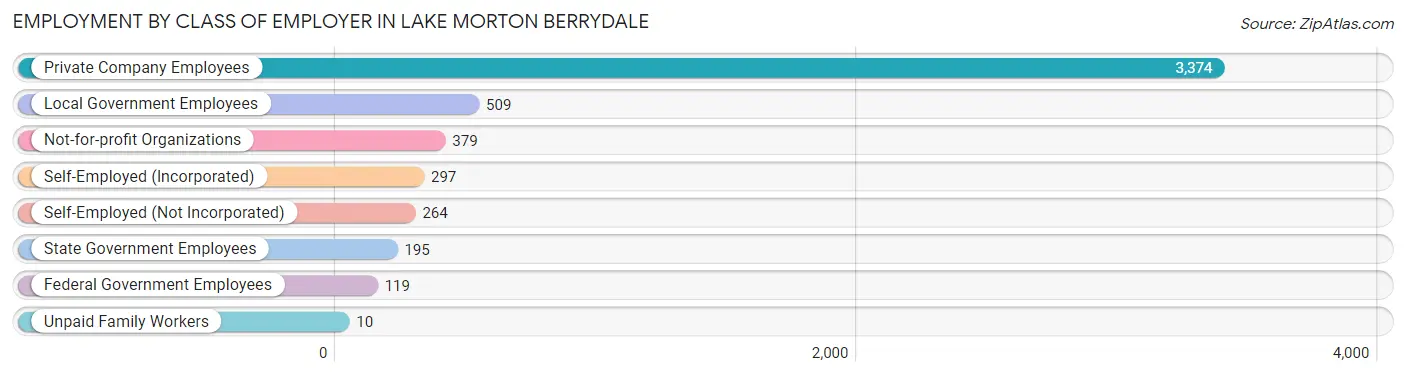
| Employer Class | # Employees | % Employees |
| Private Company Employees | 3,374 | 65.5% |
| Self-Employed (Incorporated) | 297 | 5.8% |
| Self-Employed (Not Incorporated) | 264 | 5.1% |
| Not-for-profit Organizations | 379 | 7.4% |
| Local Government Employees | 509 | 9.9% |
| State Government Employees | 195 | 3.8% |
| Federal Government Employees | 119 | 2.3% |
| Unpaid Family Workers | 10 | 0.2% |
| Total | 5,147 | 100.0% |
Employment Status by Age in Lake Morton Berrydale
According to the labor force statistics for Lake Morton Berrydale, out of the total population over 16 years of age (8,062), 67.7% or 5,458 individuals are in the labor force, with 3.0% or 164 of them unemployed. The age group with the highest labor force participation rate is 20 to 24 years, with 96.5% or 385 individuals in the labor force. Within the labor force, the 16 to 19 years age range has the highest percentage of unemployed individuals, with 25.5% or 36 of them being unemployed.
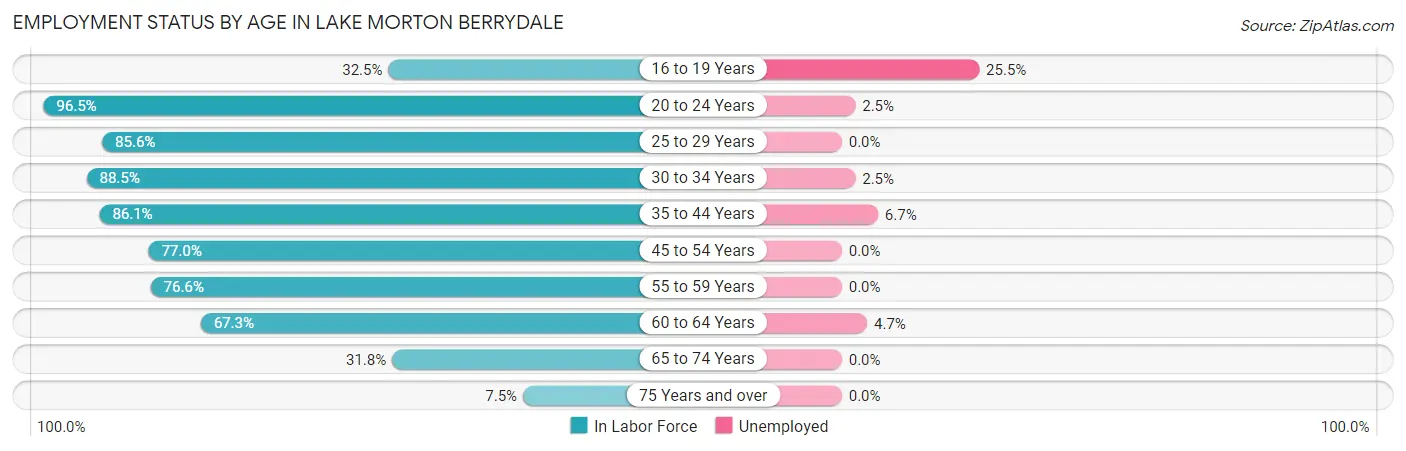
| Age Bracket | In Labor Force | Unemployed |
| 16 to 19 Years | 141 (32.5%) | 36 (25.5%) |
| 20 to 24 Years | 385 (96.5%) | 10 (2.5%) |
| 25 to 29 Years | 292 (85.6%) | 0 (0.0%) |
| 30 to 34 Years | 707 (88.5%) | 18 (2.5%) |
| 35 to 44 Years | 1,095 (86.1%) | 73 (6.7%) |
| 45 to 54 Years | 1,386 (77.0%) | 0 (0.0%) |
| 55 to 59 Years | 551 (76.6%) | 0 (0.0%) |
| 60 to 64 Years | 532 (67.3%) | 25 (4.7%) |
| 65 to 74 Years | 332 (31.8%) | 0 (0.0%) |
| 75 Years and over | 35 (7.5%) | 0 (0.0%) |
| Total | 5,458 (67.7%) | 164 (3.0%) |
Employment Status by Educational Attainment in Lake Morton Berrydale
According to labor force statistics for Lake Morton Berrydale, 79.7% of individuals (4,560) out of the total population between 25 and 64 years of age (5,722) are in the labor force, with 2.5% or 114 of them being unemployed. The group with the highest labor force participation rate are those with the educational attainment of bachelor's degree or higher, with 91.4% or 1,631 individuals in the labor force. Within the labor force, individuals with less than high school education have the highest percentage of unemployment, with 4.3% or 9 of them being unemployed.
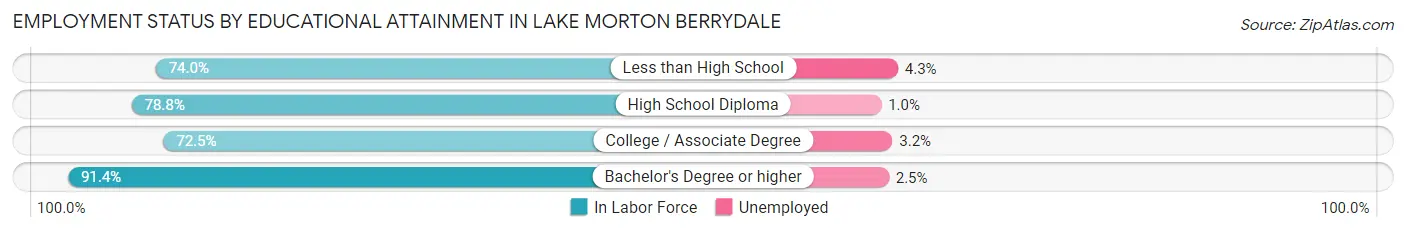
| Educational Attainment | In Labor Force | Unemployed |
| Less than High School | 211 (74.0%) | 12 (4.3%) |
| High School Diploma | 920 (78.8%) | 12 (1.0%) |
| College / Associate Degree | 1,802 (72.5%) | 80 (3.2%) |
| Bachelor's Degree or higher | 1,631 (91.4%) | 45 (2.5%) |
| Total | 4,560 (79.7%) | 143 (2.5%) |
Employment Occupations by Sex in Lake Morton Berrydale
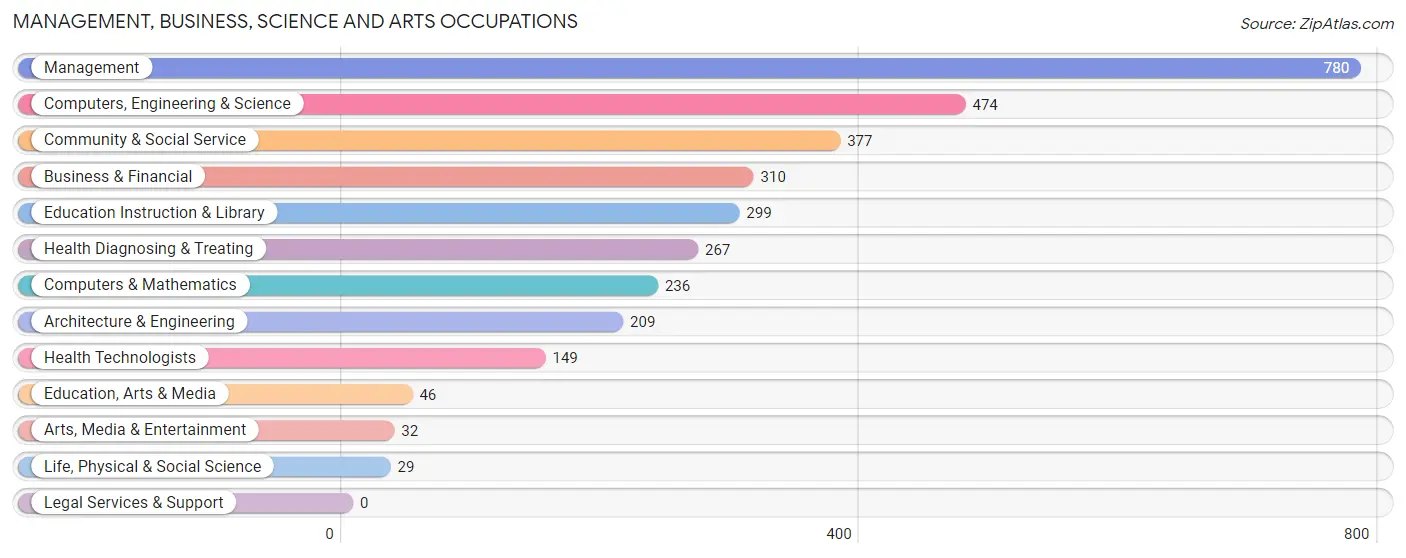
Management, Business, Science and Arts Occupations
The most common Management, Business, Science and Arts occupations in Lake Morton Berrydale are Management (780 | 14.8%), Computers, Engineering & Science (474 | 9.0%), Community & Social Service (377 | 7.2%), Business & Financial (310 | 5.9%), and Education Instruction & Library (299 | 5.7%).
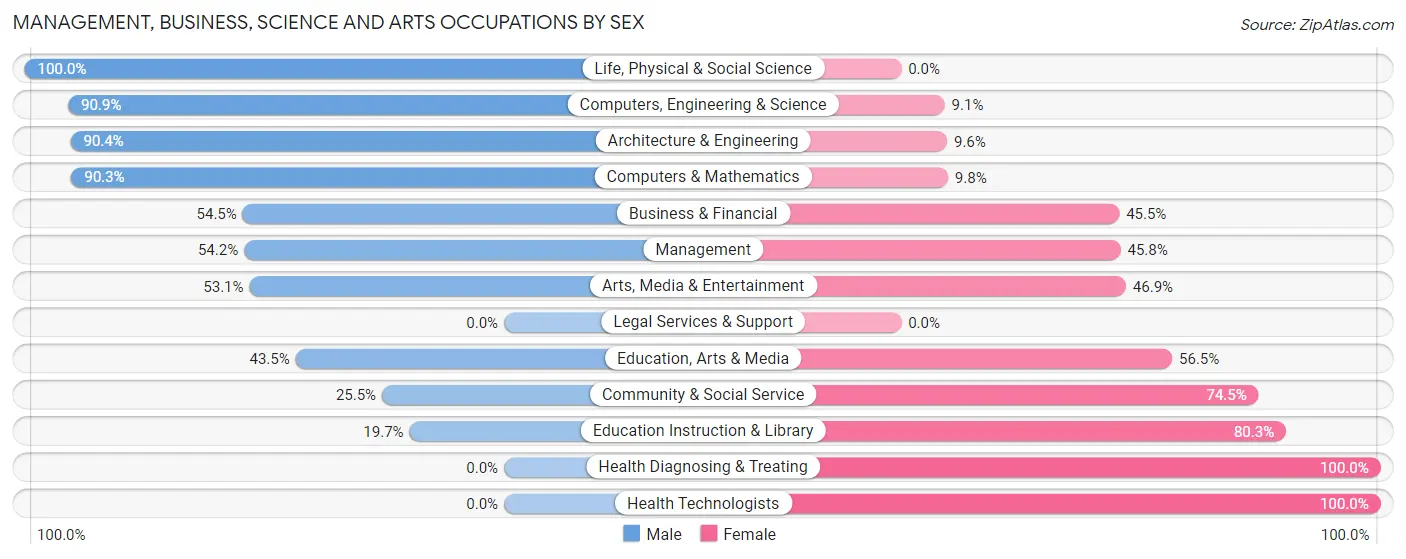
Management, Business, Science and Arts Occupations by Sex
Within the Management, Business, Science and Arts occupations in Lake Morton Berrydale, the most male-oriented occupations are Life, Physical & Social Science (100.0%), Computers, Engineering & Science (90.9%), and Architecture & Engineering (90.4%), while the most female-oriented occupations are Health Diagnosing & Treating (100.0%), Health Technologists (100.0%), and Education Instruction & Library (80.3%).
| Occupation | Male | Female |
| Management | 423 (54.2%) | 357 (45.8%) |
| Business & Financial | 169 (54.5%) | 141 (45.5%) |
| Computers, Engineering & Science | 431 (90.9%) | 43 (9.1%) |
| Computers & Mathematics | 213 (90.2%) | 23 (9.8%) |
| Architecture & Engineering | 189 (90.4%) | 20 (9.6%) |
| Life, Physical & Social Science | 29 (100.0%) | 0 (0.0%) |
| Community & Social Service | 96 (25.5%) | 281 (74.5%) |
| Education, Arts & Media | 20 (43.5%) | 26 (56.5%) |
| Legal Services & Support | 0 (0.0%) | 0 (0.0%) |
| Education Instruction & Library | 59 (19.7%) | 240 (80.3%) |
| Arts, Media & Entertainment | 17 (53.1%) | 15 (46.9%) |
| Health Diagnosing & Treating | 0 (0.0%) | 267 (100.0%) |
| Health Technologists | 0 (0.0%) | 149 (100.0%) |
| Total (Category) | 1,119 (50.7%) | 1,089 (49.3%) |
| Total (Overall) | 2,932 (55.7%) | 2,332 (44.3%) |
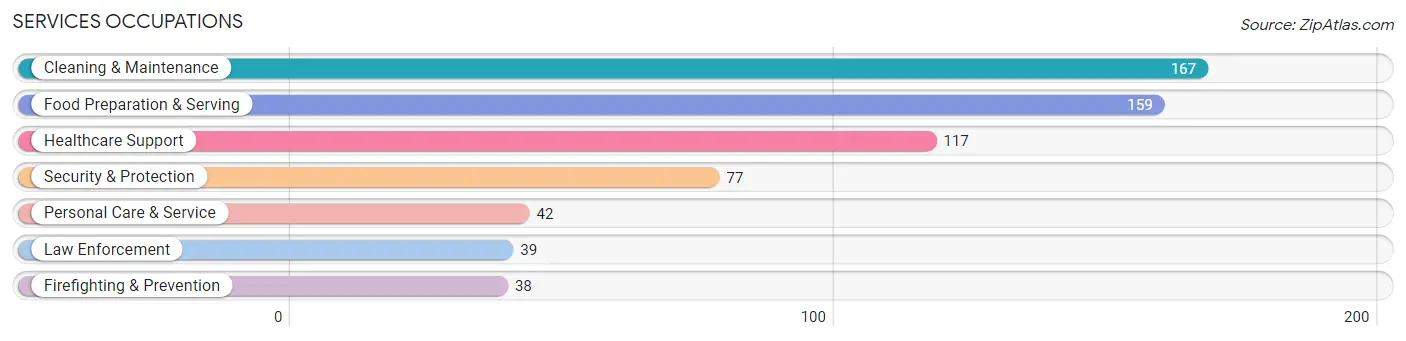
Services Occupations
The most common Services occupations in Lake Morton Berrydale are Cleaning & Maintenance (167 | 3.2%), Food Preparation & Serving (159 | 3.0%), Healthcare Support (117 | 2.2%), Security & Protection (77 | 1.5%), and Personal Care & Service (42 | 0.8%).
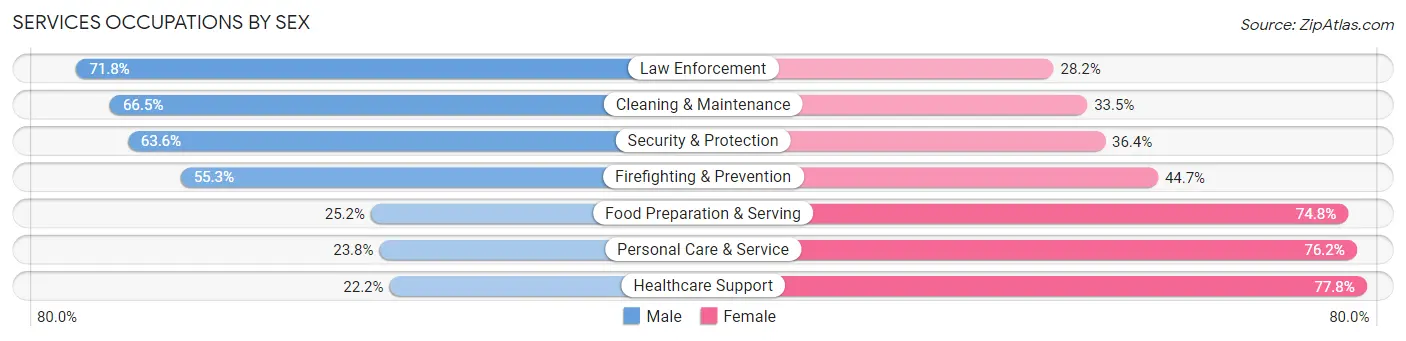
Services Occupations by Sex
Within the Services occupations in Lake Morton Berrydale, the most male-oriented occupations are Law Enforcement (71.8%), Cleaning & Maintenance (66.5%), and Security & Protection (63.6%), while the most female-oriented occupations are Healthcare Support (77.8%), Personal Care & Service (76.2%), and Food Preparation & Serving (74.8%).
| Occupation | Male | Female |
| Healthcare Support | 26 (22.2%) | 91 (77.8%) |
| Security & Protection | 49 (63.6%) | 28 (36.4%) |
| Firefighting & Prevention | 21 (55.3%) | 17 (44.7%) |
| Law Enforcement | 28 (71.8%) | 11 (28.2%) |
| Food Preparation & Serving | 40 (25.2%) | 119 (74.8%) |
| Cleaning & Maintenance | 111 (66.5%) | 56 (33.5%) |
| Personal Care & Service | 10 (23.8%) | 32 (76.2%) |
| Total (Category) | 236 (42.0%) | 326 (58.0%) |
| Total (Overall) | 2,932 (55.7%) | 2,332 (44.3%) |
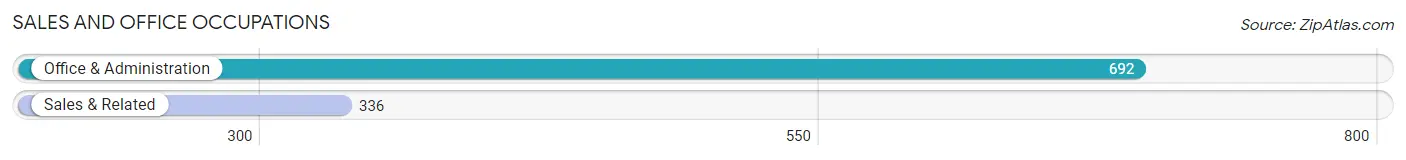
Sales and Office Occupations
The most common Sales and Office occupations in Lake Morton Berrydale are Office & Administration (692 | 13.2%), and Sales & Related (336 | 6.4%).
Sales and Office Occupations by Sex
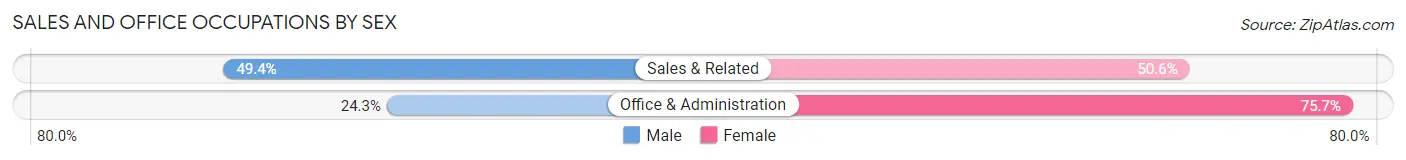
| Occupation | Male | Female |
| Sales & Related | 166 (49.4%) | 170 (50.6%) |
| Office & Administration | 168 (24.3%) | 524 (75.7%) |
| Total (Category) | 334 (32.5%) | 694 (67.5%) |
| Total (Overall) | 2,932 (55.7%) | 2,332 (44.3%) |
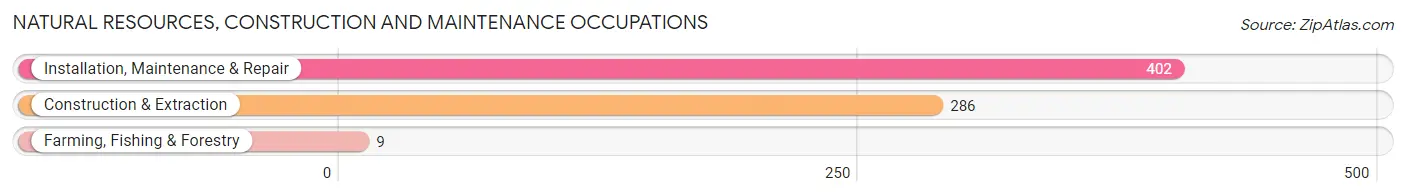
Natural Resources, Construction and Maintenance Occupations
The most common Natural Resources, Construction and Maintenance occupations in Lake Morton Berrydale are Installation, Maintenance & Repair (402 | 7.6%), Construction & Extraction (286 | 5.4%), and Farming, Fishing & Forestry (9 | 0.2%).
Natural Resources, Construction and Maintenance Occupations by Sex
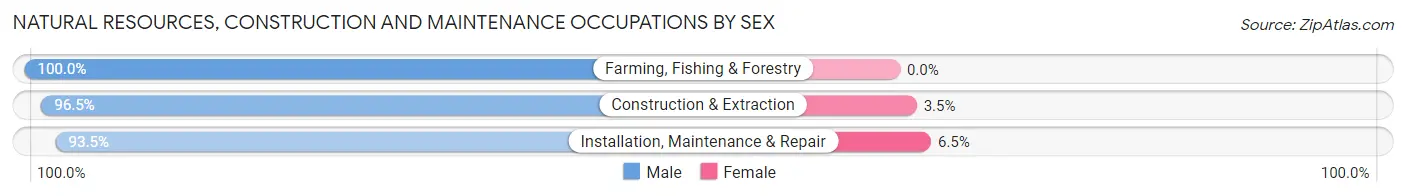
| Occupation | Male | Female |
| Farming, Fishing & Forestry | 9 (100.0%) | 0 (0.0%) |
| Construction & Extraction | 276 (96.5%) | 10 (3.5%) |
| Installation, Maintenance & Repair | 376 (93.5%) | 26 (6.5%) |
| Total (Category) | 661 (94.8%) | 36 (5.2%) |
| Total (Overall) | 2,932 (55.7%) | 2,332 (44.3%) |
Production, Transportation and Moving Occupations
The most common Production, Transportation and Moving occupations in Lake Morton Berrydale are Production (341 | 6.5%), Transportation (269 | 5.1%), and Material Moving (159 | 3.0%).
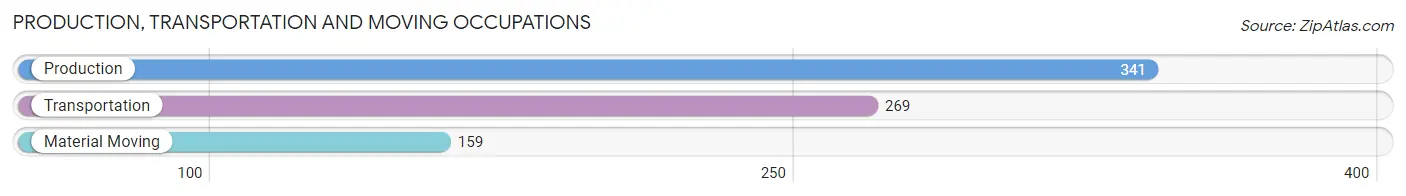
Production, Transportation and Moving Occupations by Sex
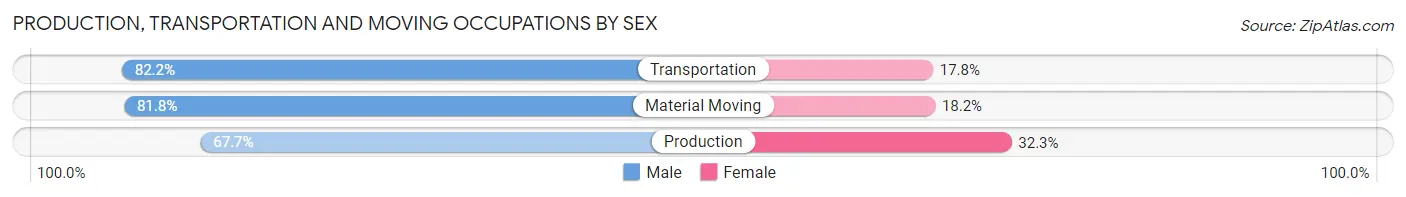
| Occupation | Male | Female |
| Production | 231 (67.7%) | 110 (32.3%) |
| Transportation | 221 (82.2%) | 48 (17.8%) |
| Material Moving | 130 (81.8%) | 29 (18.2%) |
| Total (Category) | 582 (75.7%) | 187 (24.3%) |
| Total (Overall) | 2,932 (55.7%) | 2,332 (44.3%) |
Employment Industries by Sex in Lake Morton Berrydale
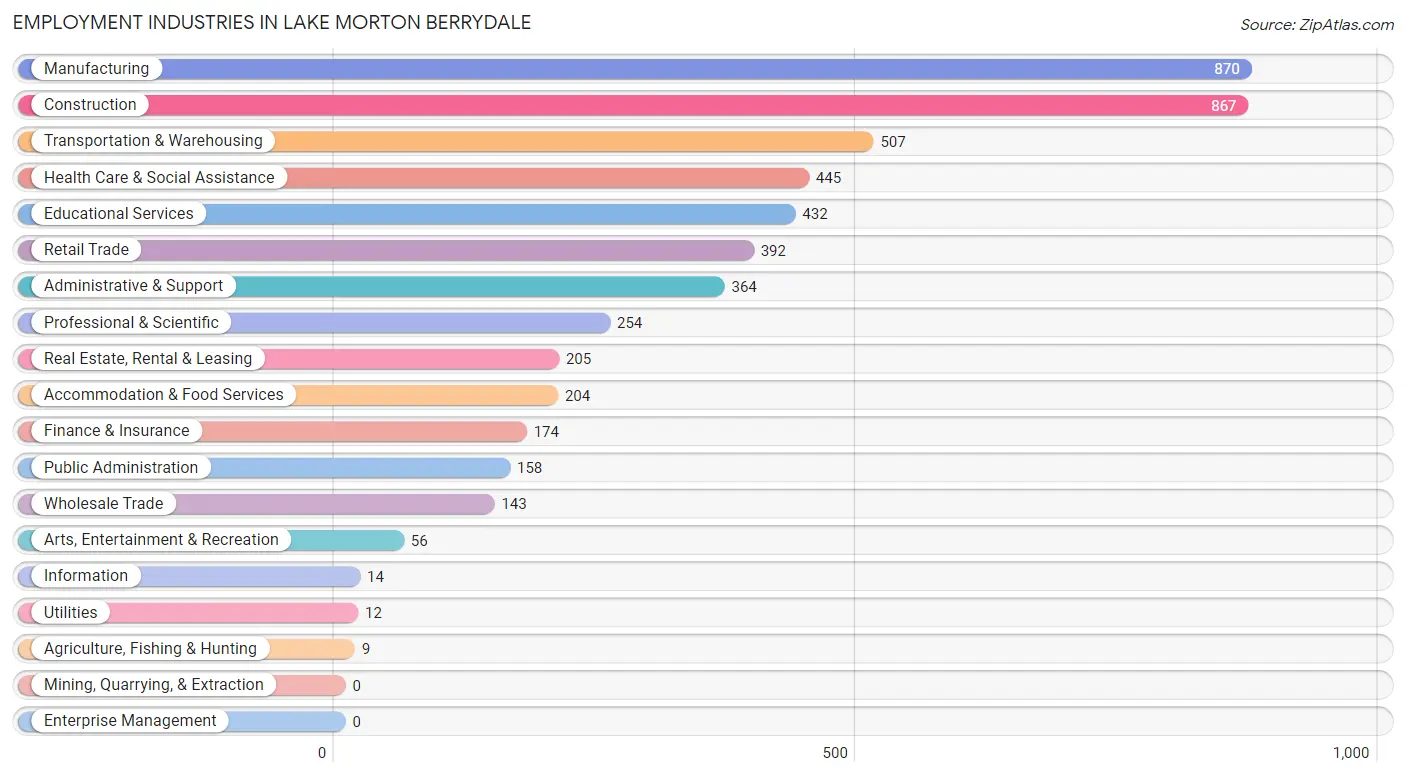
Employment Industries in Lake Morton Berrydale
The major employment industries in Lake Morton Berrydale include Manufacturing (870 | 16.5%), Construction (867 | 16.5%), Transportation & Warehousing (507 | 9.6%), Health Care & Social Assistance (445 | 8.5%), and Educational Services (432 | 8.2%).
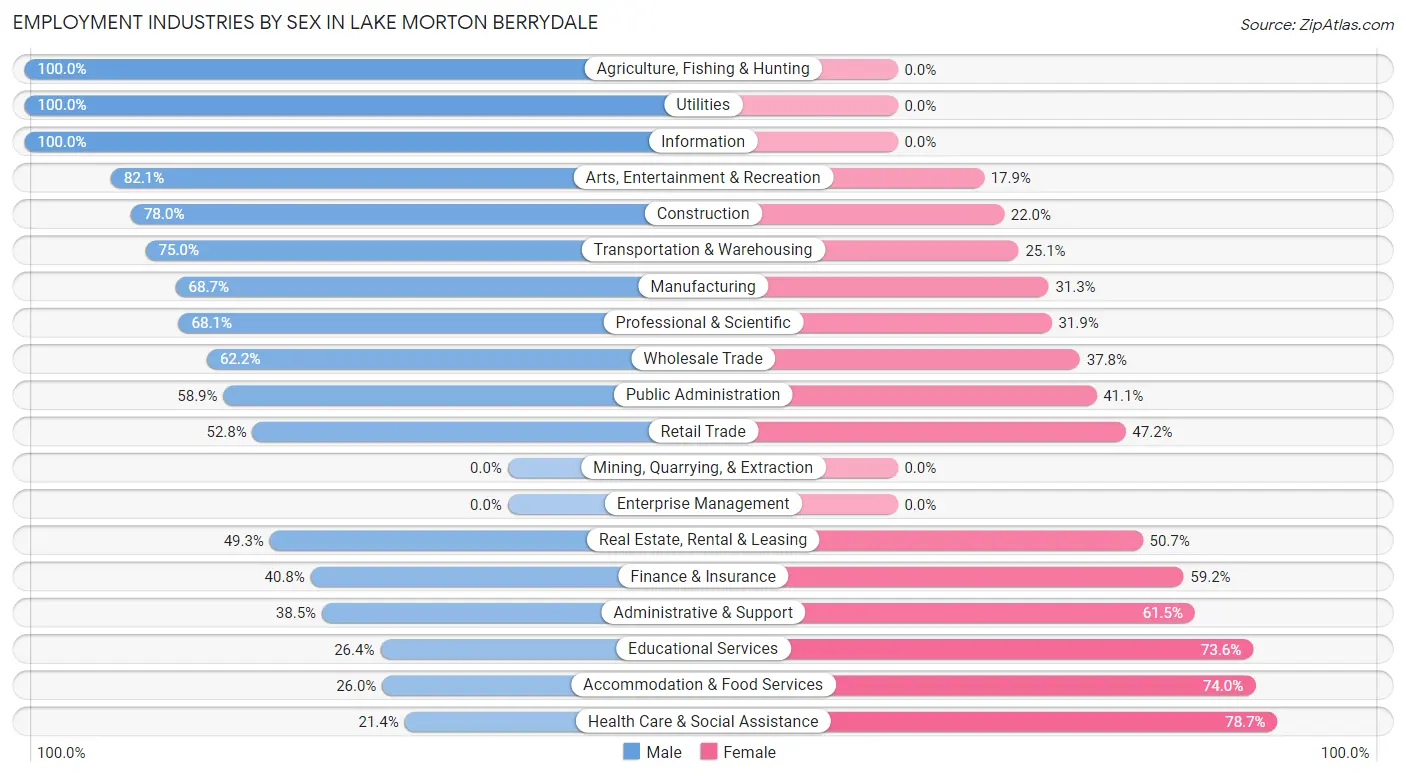
Employment Industries by Sex in Lake Morton Berrydale
The Lake Morton Berrydale industries that see more men than women are Agriculture, Fishing & Hunting (100.0%), Utilities (100.0%), and Information (100.0%), whereas the industries that tend to have a higher number of women are Health Care & Social Assistance (78.6%), Accommodation & Food Services (74.0%), and Educational Services (73.6%).
| Industry | Male | Female |
| Agriculture, Fishing & Hunting | 9 (100.0%) | 0 (0.0%) |
| Mining, Quarrying, & Extraction | 0 (0.0%) | 0 (0.0%) |
| Construction | 676 (78.0%) | 191 (22.0%) |
| Manufacturing | 598 (68.7%) | 272 (31.3%) |
| Wholesale Trade | 89 (62.2%) | 54 (37.8%) |
| Retail Trade | 207 (52.8%) | 185 (47.2%) |
| Transportation & Warehousing | 380 (75.0%) | 127 (25.1%) |
| Utilities | 12 (100.0%) | 0 (0.0%) |
| Information | 14 (100.0%) | 0 (0.0%) |
| Finance & Insurance | 71 (40.8%) | 103 (59.2%) |
| Real Estate, Rental & Leasing | 101 (49.3%) | 104 (50.7%) |
| Professional & Scientific | 173 (68.1%) | 81 (31.9%) |
| Enterprise Management | 0 (0.0%) | 0 (0.0%) |
| Administrative & Support | 140 (38.5%) | 224 (61.5%) |
| Educational Services | 114 (26.4%) | 318 (73.6%) |
| Health Care & Social Assistance | 95 (21.3%) | 350 (78.6%) |
| Arts, Entertainment & Recreation | 46 (82.1%) | 10 (17.9%) |
| Accommodation & Food Services | 53 (26.0%) | 151 (74.0%) |
| Public Administration | 93 (58.9%) | 65 (41.1%) |
| Total | 2,932 (55.7%) | 2,332 (44.3%) |
Education in Lake Morton Berrydale
School Enrollment in Lake Morton Berrydale
The most common levels of schooling among the 2,338 students in Lake Morton Berrydale are elementary school (614 | 26.3%), middle school (591 | 25.3%), and high school (511 | 21.9%).
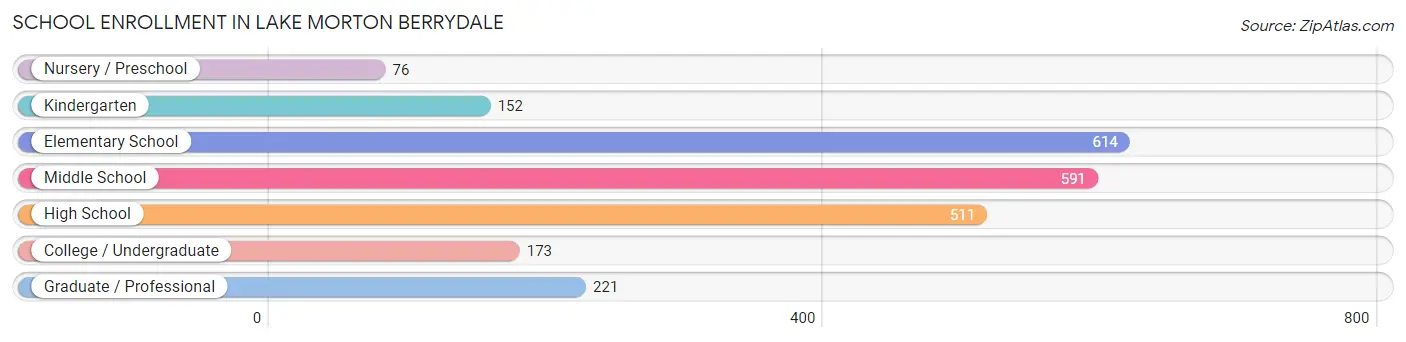
| School Level | # Students | % Students |
| Nursery / Preschool | 76 | 3.3% |
| Kindergarten | 152 | 6.5% |
| Elementary School | 614 | 26.3% |
| Middle School | 591 | 25.3% |
| High School | 511 | 21.9% |
| College / Undergraduate | 173 | 7.4% |
| Graduate / Professional | 221 | 9.5% |
| Total | 2,338 | 100.0% |
School Enrollment by Age by Funding Source in Lake Morton Berrydale
Out of a total of 2,338 students who are enrolled in schools in Lake Morton Berrydale, 267 (11.4%) attend a private institution, while the remaining 2,071 (88.6%) are enrolled in public schools. The age group of 3 to 4 year olds has the highest likelihood of being enrolled in private schools, with 29 (100.0% in the age bracket) enrolled. Conversely, the age group of 18 to 19 year olds has the lowest likelihood of being enrolled in a private school, with 84 (100.0% in the age bracket) attending a public institution.
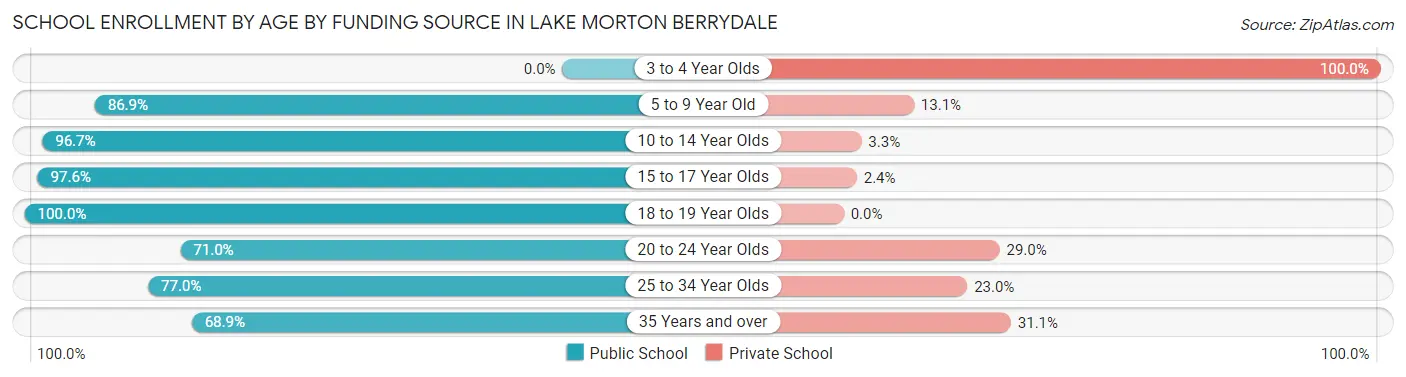
| Age Bracket | Public School | Private School |
| 3 to 4 Year Olds | 0 (0.0%) | 29 (100.0%) |
| 5 to 9 Year Old | 658 (86.9%) | 99 (13.1%) |
| 10 to 14 Year Olds | 703 (96.7%) | 24 (3.3%) |
| 15 to 17 Year Olds | 360 (97.6%) | 9 (2.4%) |
| 18 to 19 Year Olds | 84 (100.0%) | 0 (0.0%) |
| 20 to 24 Year Olds | 22 (71.0%) | 9 (29.0%) |
| 25 to 34 Year Olds | 87 (77.0%) | 26 (23.0%) |
| 35 Years and over | 157 (68.9%) | 71 (31.1%) |
| Total | 2,071 (88.6%) | 267 (11.4%) |
Educational Attainment by Field of Study in Lake Morton Berrydale
Engineering (366 | 16.0%), business (362 | 15.8%), science & technology (342 | 14.9%), education (250 | 10.9%), and social sciences (189 | 8.3%) are the most common fields of study among 2,288 individuals in Lake Morton Berrydale who have obtained a bachelor's degree or higher.
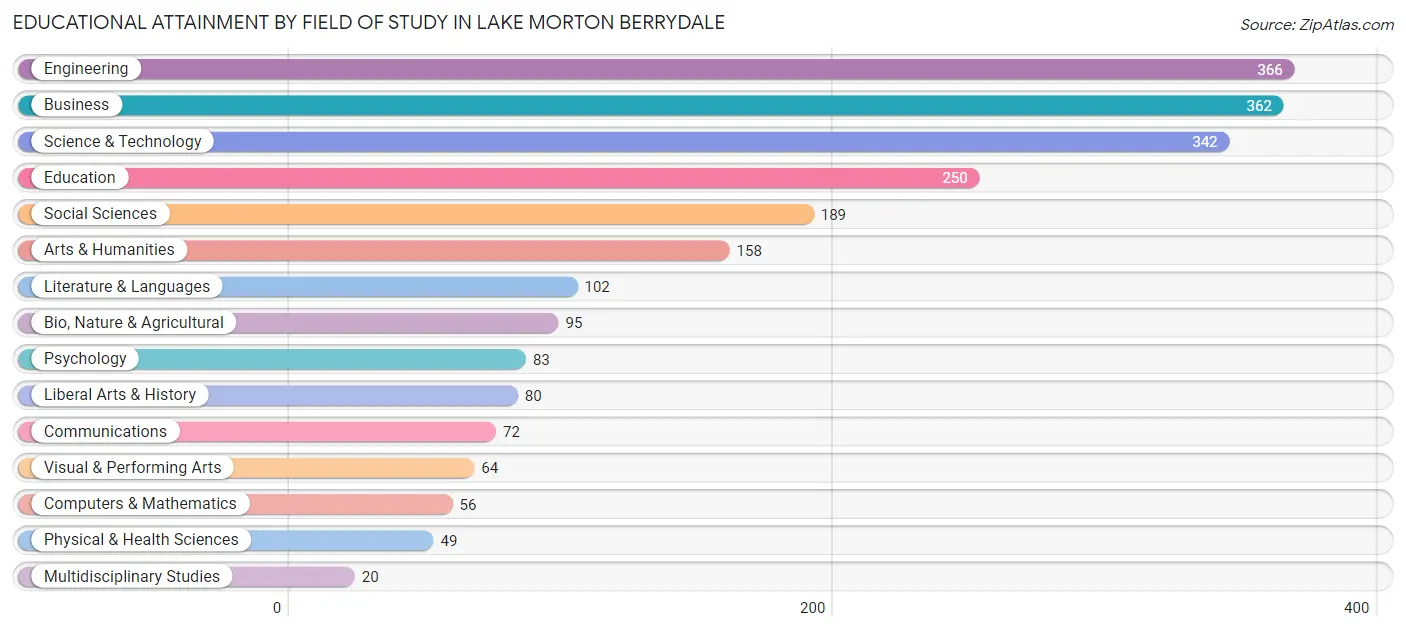
| Field of Study | # Graduates | % Graduates |
| Computers & Mathematics | 56 | 2.5% |
| Bio, Nature & Agricultural | 95 | 4.2% |
| Physical & Health Sciences | 49 | 2.1% |
| Psychology | 83 | 3.6% |
| Social Sciences | 189 | 8.3% |
| Engineering | 366 | 16.0% |
| Multidisciplinary Studies | 20 | 0.9% |
| Science & Technology | 342 | 14.9% |
| Business | 362 | 15.8% |
| Education | 250 | 10.9% |
| Literature & Languages | 102 | 4.5% |
| Liberal Arts & History | 80 | 3.5% |
| Visual & Performing Arts | 64 | 2.8% |
| Communications | 72 | 3.2% |
| Arts & Humanities | 158 | 6.9% |
| Total | 2,288 | 100.0% |
Transportation & Commute in Lake Morton Berrydale
Vehicle Availability by Sex in Lake Morton Berrydale
The most prevalent vehicle ownership categories in Lake Morton Berrydale are males with 2 vehicles (965, accounting for 34.2%) and females with 2 vehicles (783, making up 41.5%).
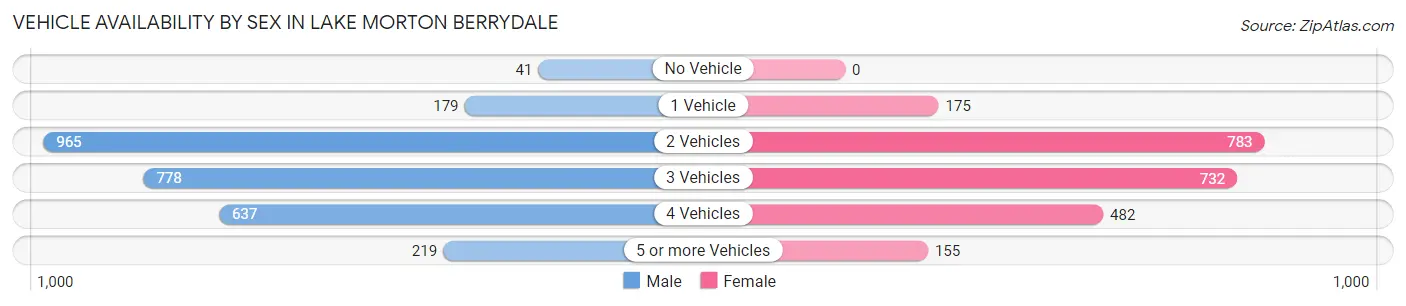
| Vehicles Available | Male | Female |
| No Vehicle | 41 (1.5%) | 0 (0.0%) |
| 1 Vehicle | 179 (6.4%) | 175 (7.5%) |
| 2 Vehicles | 965 (34.2%) | 783 (33.7%) |
| 3 Vehicles | 778 (27.6%) | 732 (31.5%) |
| 4 Vehicles | 637 (22.6%) | 482 (20.7%) |
| 5 or more Vehicles | 219 (7.8%) | 155 (6.7%) |
| Total | 2,819 (100.0%) | 2,327 (100.0%) |
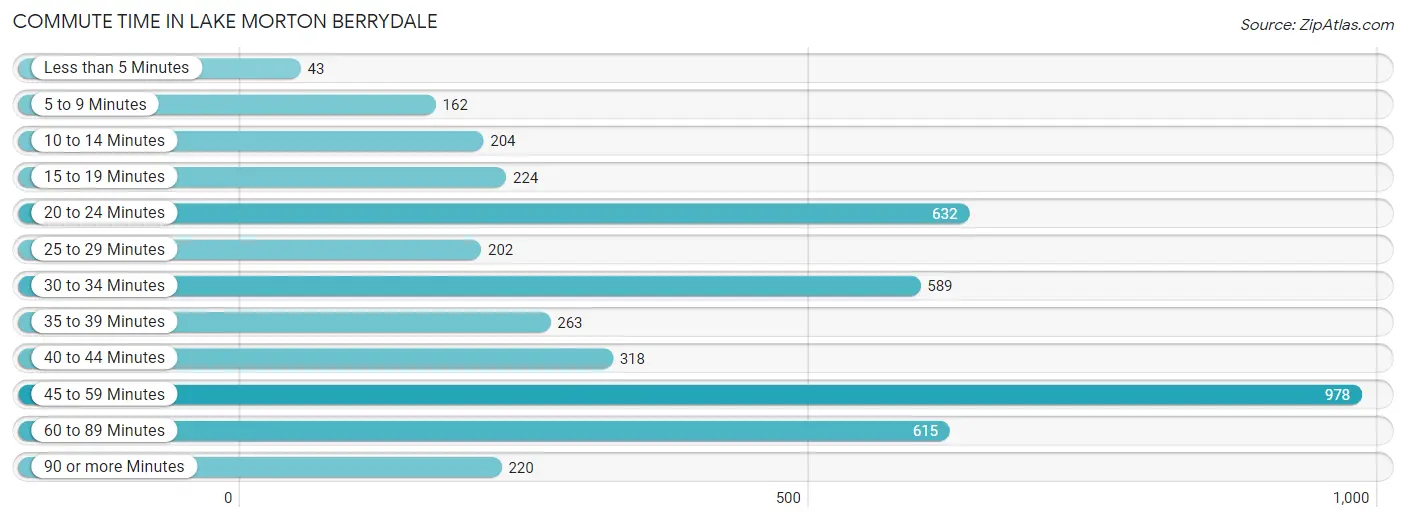
Commute Time in Lake Morton Berrydale
The most frequently occuring commute durations in Lake Morton Berrydale are 45 to 59 minutes (978 commuters, 22.0%), 20 to 24 minutes (632 commuters, 14.2%), and 60 to 89 minutes (615 commuters, 13.8%).
| Commute Time | # Commuters | % Commuters |
| Less than 5 Minutes | 43 | 1.0% |
| 5 to 9 Minutes | 162 | 3.6% |
| 10 to 14 Minutes | 204 | 4.6% |
| 15 to 19 Minutes | 224 | 5.0% |
| 20 to 24 Minutes | 632 | 14.2% |
| 25 to 29 Minutes | 202 | 4.5% |
| 30 to 34 Minutes | 589 | 13.2% |
| 35 to 39 Minutes | 263 | 5.9% |
| 40 to 44 Minutes | 318 | 7.1% |
| 45 to 59 Minutes | 978 | 22.0% |
| 60 to 89 Minutes | 615 | 13.8% |
| 90 or more Minutes | 220 | 4.9% |
Commute Time by Sex in Lake Morton Berrydale
The most common commute times in Lake Morton Berrydale are 45 to 59 minutes (615 commuters, 25.2%) for males and 45 to 59 minutes (363 commuters, 18.1%) for females.
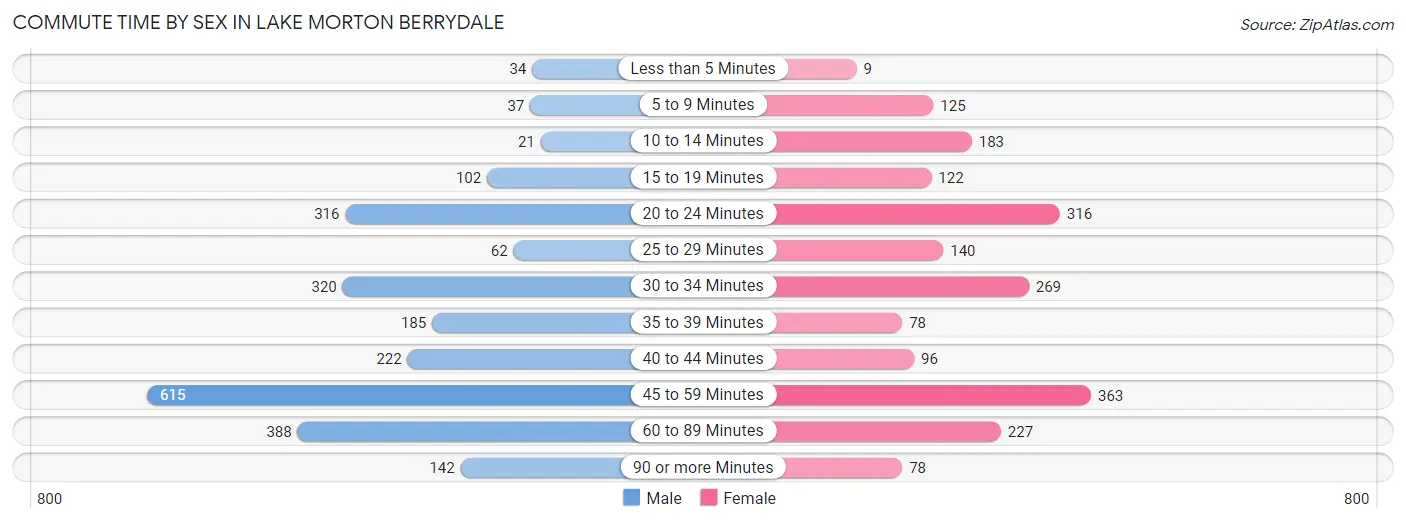
| Commute Time | Male | Female |
| Less than 5 Minutes | 34 (1.4%) | 9 (0.4%) |
| 5 to 9 Minutes | 37 (1.5%) | 125 (6.2%) |
| 10 to 14 Minutes | 21 (0.9%) | 183 (9.1%) |
| 15 to 19 Minutes | 102 (4.2%) | 122 (6.1%) |
| 20 to 24 Minutes | 316 (12.9%) | 316 (15.8%) |
| 25 to 29 Minutes | 62 (2.5%) | 140 (7.0%) |
| 30 to 34 Minutes | 320 (13.1%) | 269 (13.4%) |
| 35 to 39 Minutes | 185 (7.6%) | 78 (3.9%) |
| 40 to 44 Minutes | 222 (9.1%) | 96 (4.8%) |
| 45 to 59 Minutes | 615 (25.2%) | 363 (18.1%) |
| 60 to 89 Minutes | 388 (15.9%) | 227 (11.3%) |
| 90 or more Minutes | 142 (5.8%) | 78 (3.9%) |
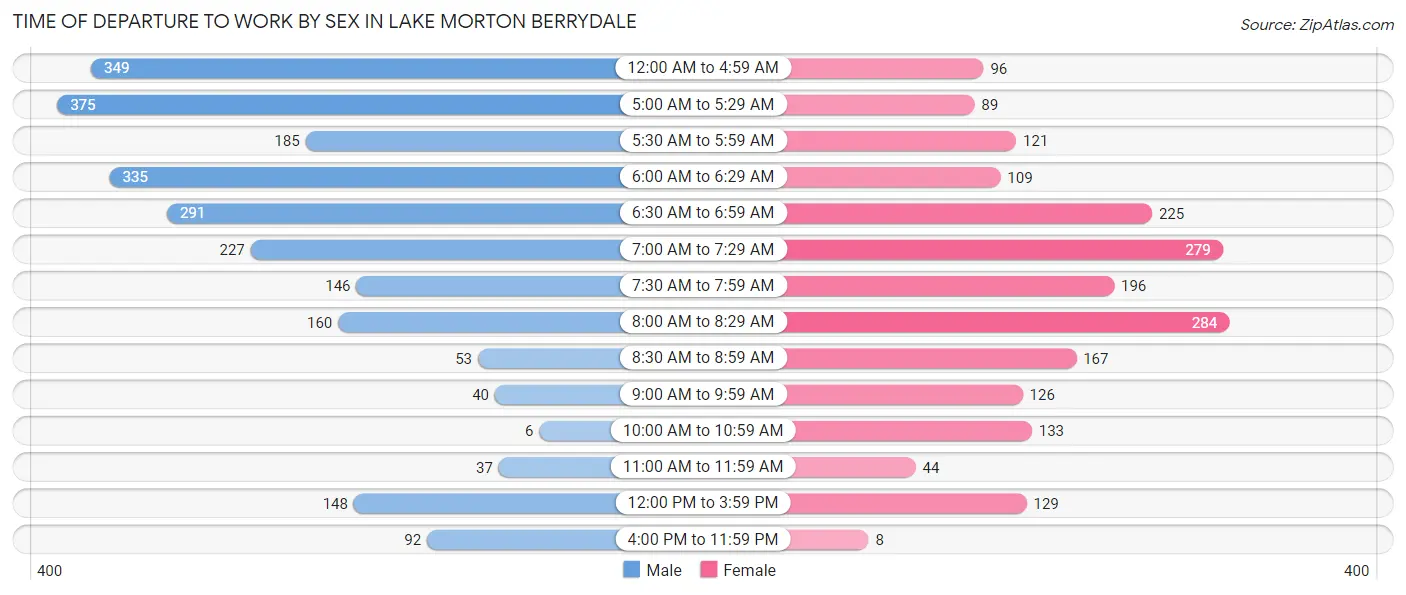
Time of Departure to Work by Sex in Lake Morton Berrydale
The most frequent times of departure to work in Lake Morton Berrydale are 5:00 AM to 5:29 AM (375, 15.3%) for males and 8:00 AM to 8:29 AM (284, 14.2%) for females.
| Time of Departure | Male | Female |
| 12:00 AM to 4:59 AM | 349 (14.3%) | 96 (4.8%) |
| 5:00 AM to 5:29 AM | 375 (15.3%) | 89 (4.4%) |
| 5:30 AM to 5:59 AM | 185 (7.6%) | 121 (6.0%) |
| 6:00 AM to 6:29 AM | 335 (13.7%) | 109 (5.4%) |
| 6:30 AM to 6:59 AM | 291 (11.9%) | 225 (11.2%) |
| 7:00 AM to 7:29 AM | 227 (9.3%) | 279 (13.9%) |
| 7:30 AM to 7:59 AM | 146 (6.0%) | 196 (9.8%) |
| 8:00 AM to 8:29 AM | 160 (6.6%) | 284 (14.2%) |
| 8:30 AM to 8:59 AM | 53 (2.2%) | 167 (8.3%) |
| 9:00 AM to 9:59 AM | 40 (1.6%) | 126 (6.3%) |
| 10:00 AM to 10:59 AM | 6 (0.3%) | 133 (6.6%) |
| 11:00 AM to 11:59 AM | 37 (1.5%) | 44 (2.2%) |
| 12:00 PM to 3:59 PM | 148 (6.1%) | 129 (6.4%) |
| 4:00 PM to 11:59 PM | 92 (3.8%) | 8 (0.4%) |
| Total | 2,444 (100.0%) | 2,006 (100.0%) |
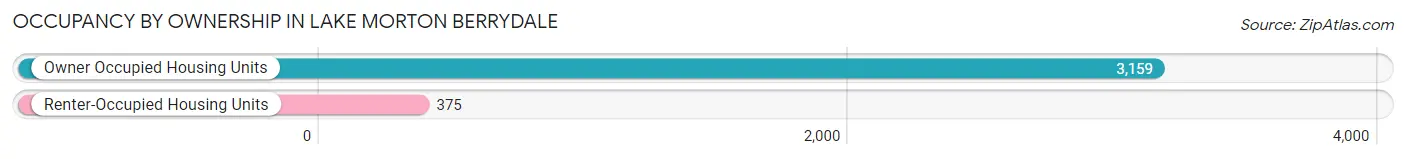
Housing Occupancy in Lake Morton Berrydale
Occupancy by Ownership in Lake Morton Berrydale
Of the total 3,534 dwellings in Lake Morton Berrydale, owner-occupied units account for 3,159 (89.4%), while renter-occupied units make up 375 (10.6%).
| Occupancy | # Housing Units | % Housing Units |
| Owner Occupied Housing Units | 3,159 | 89.4% |
| Renter-Occupied Housing Units | 375 | 10.6% |
| Total Occupied Housing Units | 3,534 | 100.0% |
Occupancy by Household Size in Lake Morton Berrydale
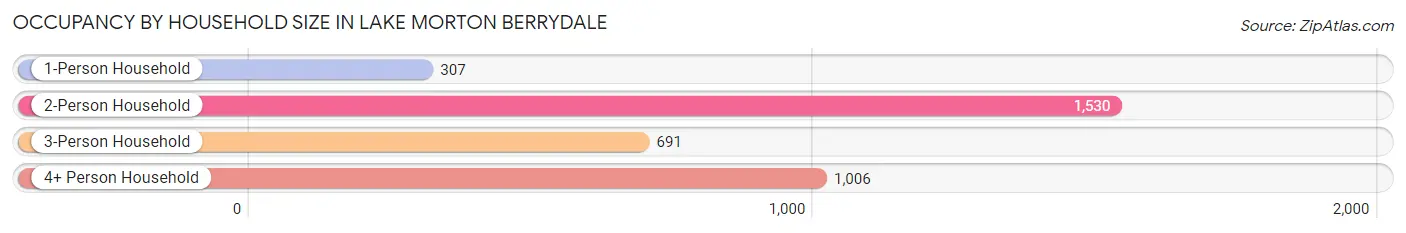
| Household Size | # Housing Units | % Housing Units |
| 1-Person Household | 307 | 8.7% |
| 2-Person Household | 1,530 | 43.3% |
| 3-Person Household | 691 | 19.6% |
| 4+ Person Household | 1,006 | 28.5% |
| Total Housing Units | 3,534 | 100.0% |
Occupancy by Ownership by Household Size in Lake Morton Berrydale
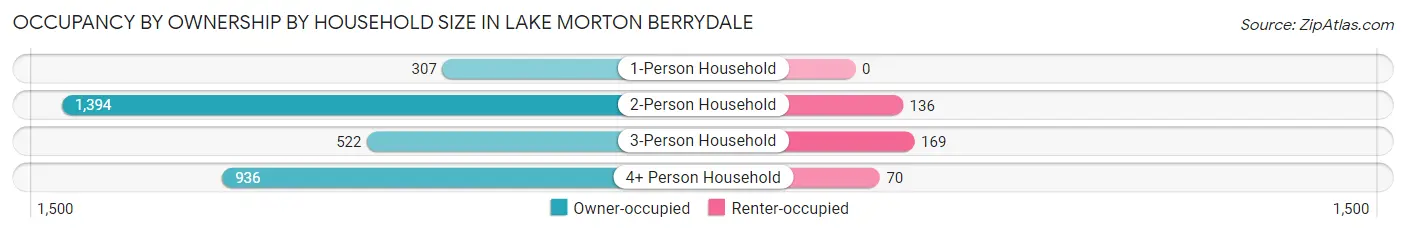
| Household Size | Owner-occupied | Renter-occupied |
| 1-Person Household | 307 (100.0%) | 0 (0.0%) |
| 2-Person Household | 1,394 (91.1%) | 136 (8.9%) |
| 3-Person Household | 522 (75.5%) | 169 (24.5%) |
| 4+ Person Household | 936 (93.0%) | 70 (7.0%) |
| Total Housing Units | 3,159 (89.4%) | 375 (10.6%) |
Occupancy by Educational Attainment in Lake Morton Berrydale
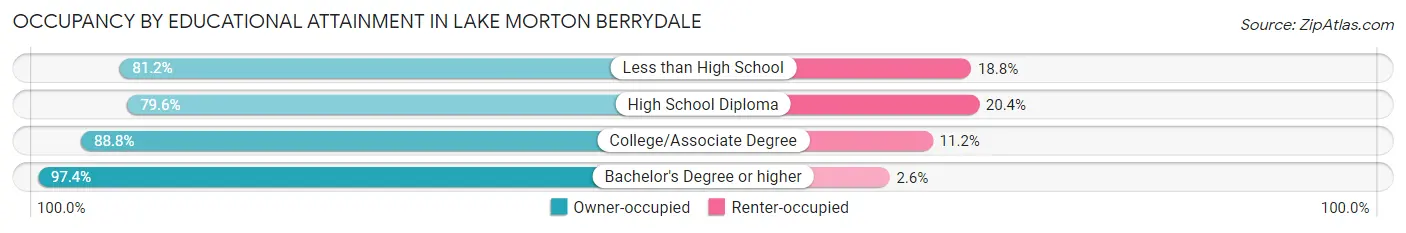
| Household Size | Owner-occupied | Renter-occupied |
| Less than High School | 108 (81.2%) | 25 (18.8%) |
| High School Diploma | 579 (79.6%) | 148 (20.4%) |
| College/Associate Degree | 1,364 (88.8%) | 172 (11.2%) |
| Bachelor's Degree or higher | 1,108 (97.4%) | 30 (2.6%) |
Occupancy by Age of Householder in Lake Morton Berrydale
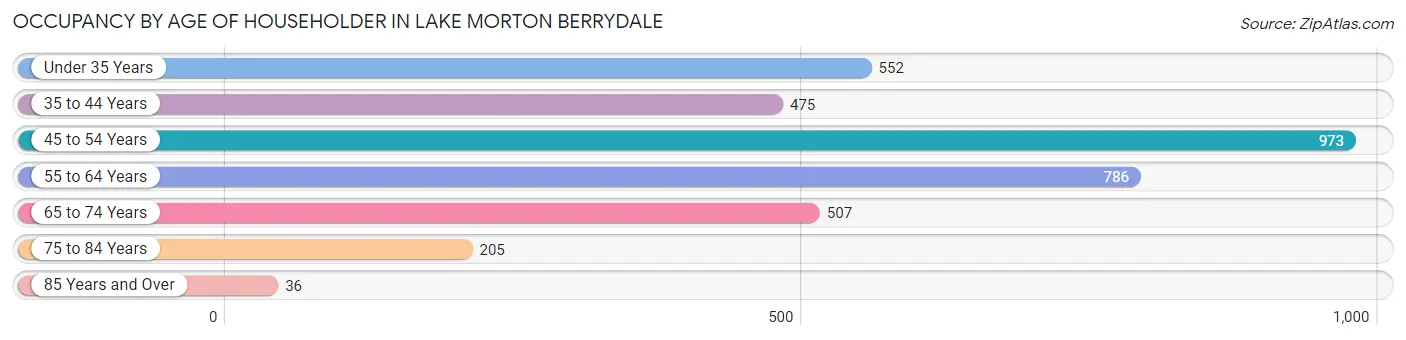
| Age Bracket | # Households | % Households |
| Under 35 Years | 552 | 15.6% |
| 35 to 44 Years | 475 | 13.4% |
| 45 to 54 Years | 973 | 27.5% |
| 55 to 64 Years | 786 | 22.2% |
| 65 to 74 Years | 507 | 14.3% |
| 75 to 84 Years | 205 | 5.8% |
| 85 Years and Over | 36 | 1.0% |
| Total | 3,534 | 100.0% |
Housing Finances in Lake Morton Berrydale
Median Income by Occupancy in Lake Morton Berrydale
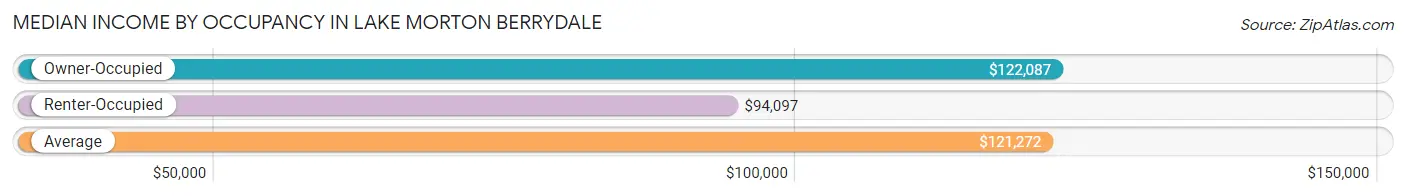
| Occupancy Type | # Households | Median Income |
| Owner-Occupied | 3,159 (89.4%) | $122,087 |
| Renter-Occupied | 375 (10.6%) | $94,097 |
| Average | 3,534 (100.0%) | $121,272 |
Occupancy by Householder Income Bracket in Lake Morton Berrydale
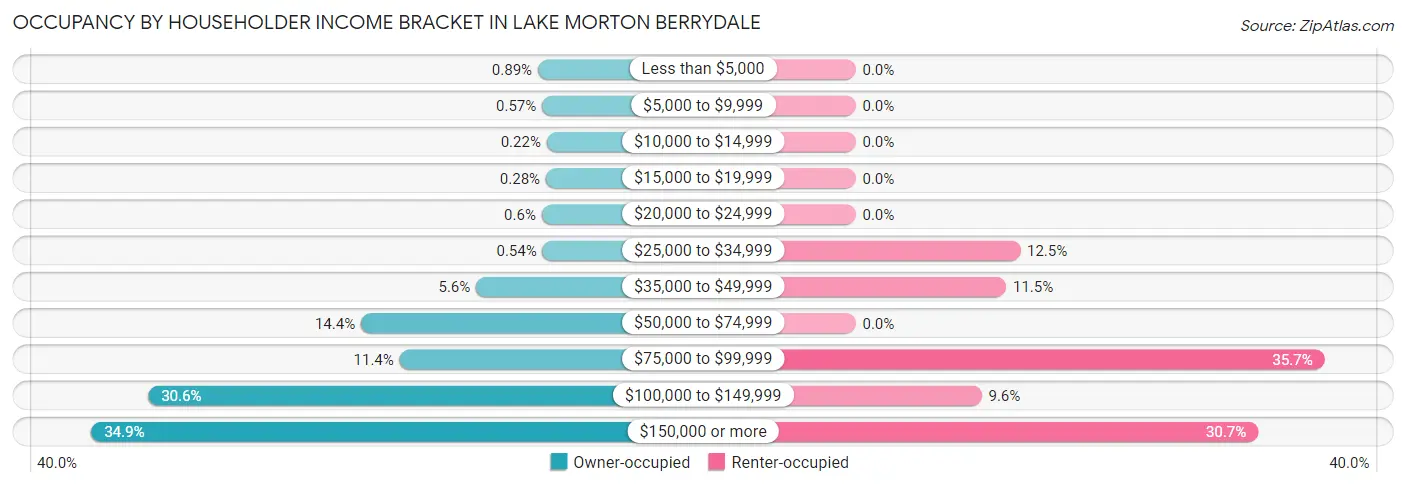
| Income Bracket | Owner-occupied | Renter-occupied |
| Less than $5,000 | 28 (0.9%) | 0 (0.0%) |
| $5,000 to $9,999 | 18 (0.6%) | 0 (0.0%) |
| $10,000 to $14,999 | 7 (0.2%) | 0 (0.0%) |
| $15,000 to $19,999 | 9 (0.3%) | 0 (0.0%) |
| $20,000 to $24,999 | 19 (0.6%) | 0 (0.0%) |
| $25,000 to $34,999 | 17 (0.5%) | 47 (12.5%) |
| $35,000 to $49,999 | 177 (5.6%) | 43 (11.5%) |
| $50,000 to $74,999 | 454 (14.4%) | 0 (0.0%) |
| $75,000 to $99,999 | 361 (11.4%) | 134 (35.7%) |
| $100,000 to $149,999 | 966 (30.6%) | 36 (9.6%) |
| $150,000 or more | 1,103 (34.9%) | 115 (30.7%) |
| Total | 3,159 (100.0%) | 375 (100.0%) |
Monthly Housing Cost Tiers in Lake Morton Berrydale
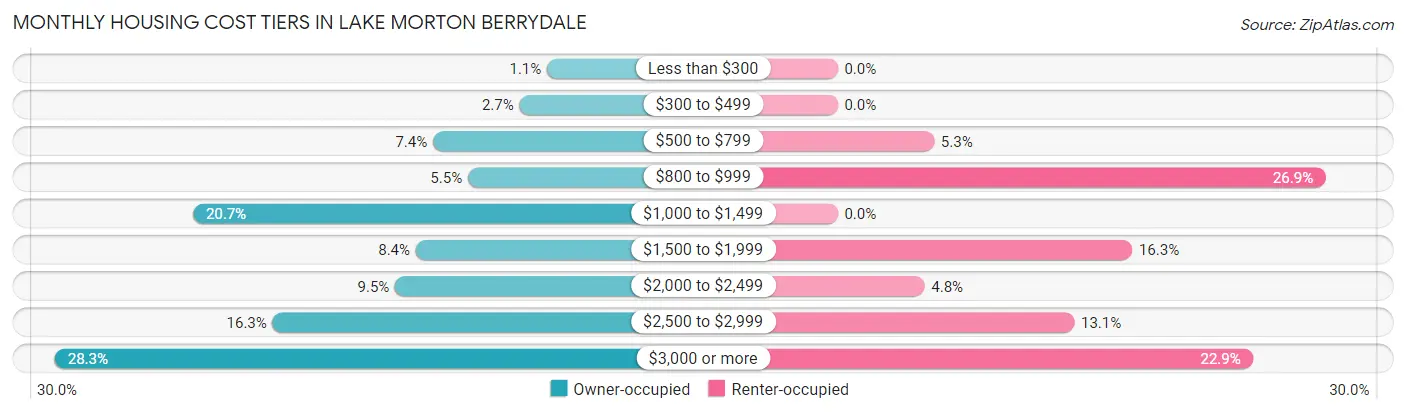
| Monthly Cost | Owner-occupied | Renter-occupied |
| Less than $300 | 36 (1.1%) | 0 (0.0%) |
| $300 to $499 | 84 (2.7%) | 0 (0.0%) |
| $500 to $799 | 235 (7.4%) | 20 (5.3%) |
| $800 to $999 | 174 (5.5%) | 101 (26.9%) |
| $1,000 to $1,499 | 654 (20.7%) | 0 (0.0%) |
| $1,500 to $1,999 | 265 (8.4%) | 61 (16.3%) |
| $2,000 to $2,499 | 301 (9.5%) | 18 (4.8%) |
| $2,500 to $2,999 | 515 (16.3%) | 49 (13.1%) |
| $3,000 or more | 895 (28.3%) | 86 (22.9%) |
| Total | 3,159 (100.0%) | 375 (100.0%) |
Physical Housing Characteristics in Lake Morton Berrydale
Housing Structures in Lake Morton Berrydale
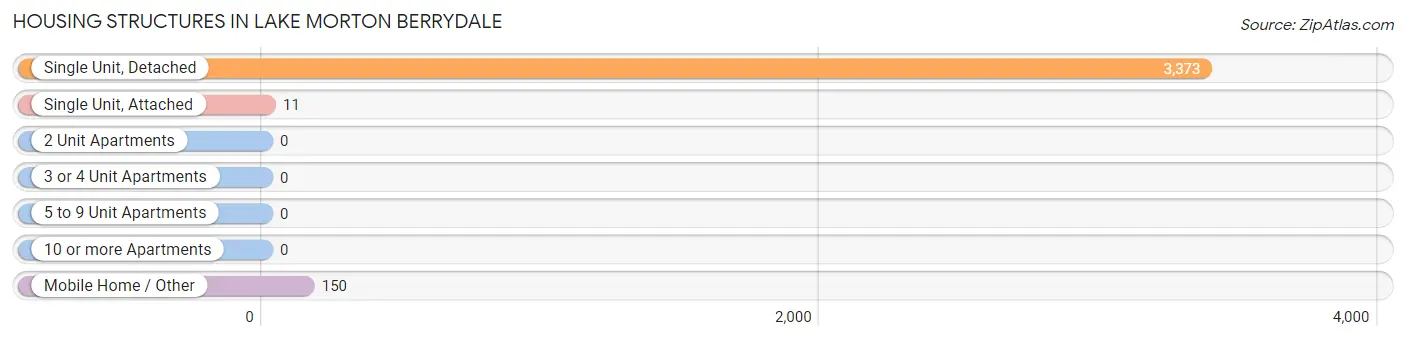
| Structure Type | # Housing Units | % Housing Units |
| Single Unit, Detached | 3,373 | 95.4% |
| Single Unit, Attached | 11 | 0.3% |
| 2 Unit Apartments | 0 | 0.0% |
| 3 or 4 Unit Apartments | 0 | 0.0% |
| 5 to 9 Unit Apartments | 0 | 0.0% |
| 10 or more Apartments | 0 | 0.0% |
| Mobile Home / Other | 150 | 4.2% |
| Total | 3,534 | 100.0% |
Housing Structures by Occupancy in Lake Morton Berrydale
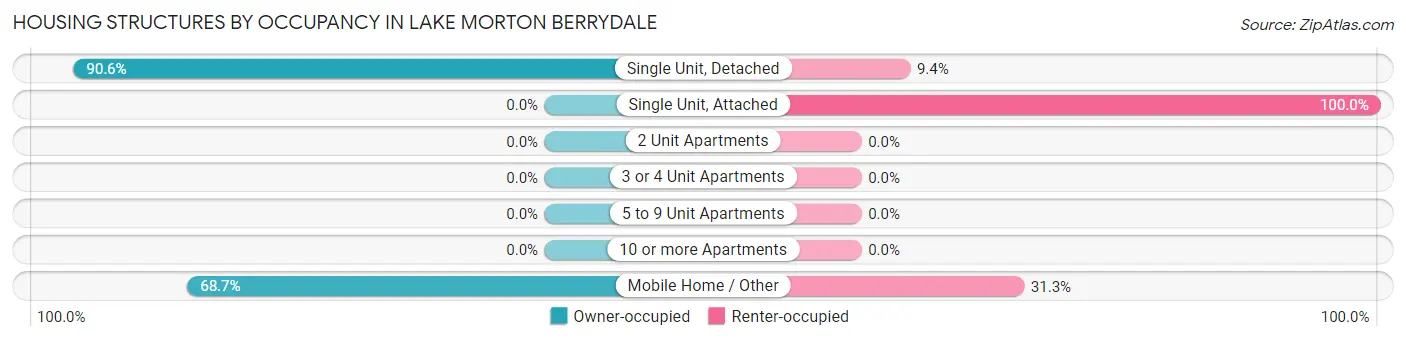
| Structure Type | Owner-occupied | Renter-occupied |
| Single Unit, Detached | 3,056 (90.6%) | 317 (9.4%) |
| Single Unit, Attached | 0 (0.0%) | 11 (100.0%) |
| 2 Unit Apartments | 0 (0.0%) | 0 (0.0%) |
| 3 or 4 Unit Apartments | 0 (0.0%) | 0 (0.0%) |
| 5 to 9 Unit Apartments | 0 (0.0%) | 0 (0.0%) |
| 10 or more Apartments | 0 (0.0%) | 0 (0.0%) |
| Mobile Home / Other | 103 (68.7%) | 47 (31.3%) |
| Total | 3,159 (89.4%) | 375 (10.6%) |
Housing Structures by Number of Rooms in Lake Morton Berrydale
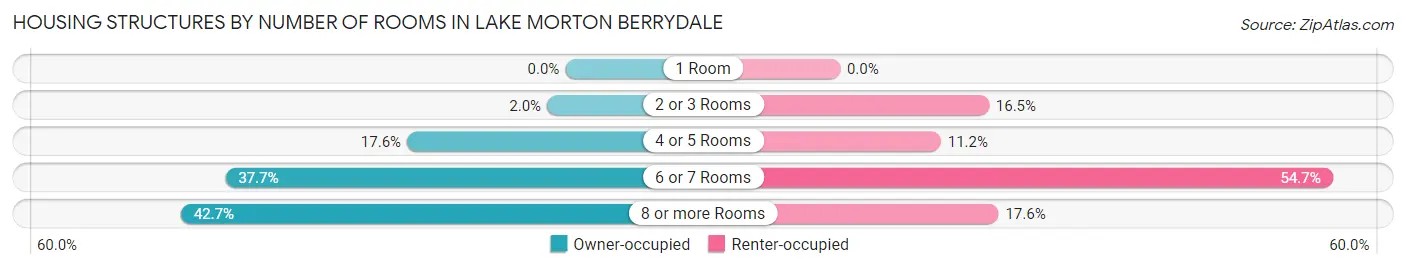
| Number of Rooms | Owner-occupied | Renter-occupied |
| 1 Room | 0 (0.0%) | 0 (0.0%) |
| 2 or 3 Rooms | 64 (2.0%) | 62 (16.5%) |
| 4 or 5 Rooms | 555 (17.6%) | 42 (11.2%) |
| 6 or 7 Rooms | 1,192 (37.7%) | 205 (54.7%) |
| 8 or more Rooms | 1,348 (42.7%) | 66 (17.6%) |
| Total | 3,159 (100.0%) | 375 (100.0%) |
Housing Structure by Heating Type in Lake Morton Berrydale
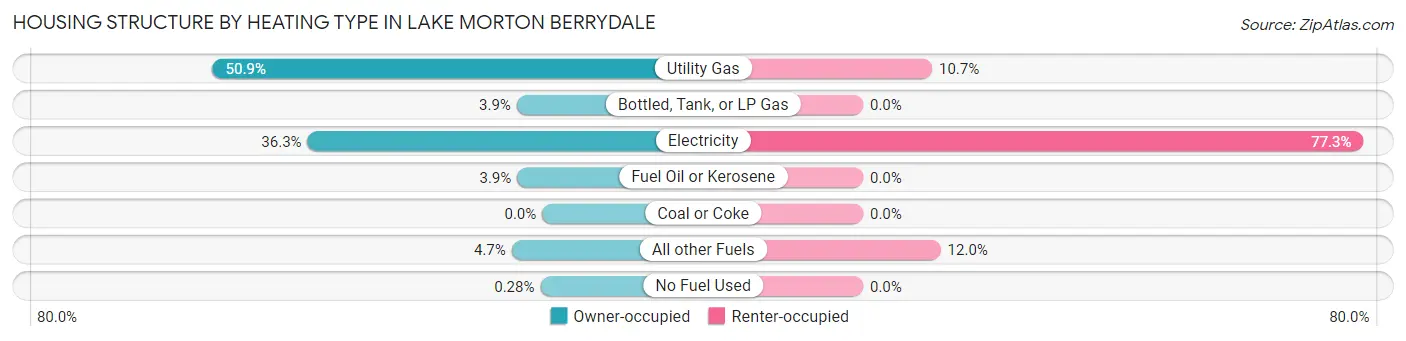
| Heating Type | Owner-occupied | Renter-occupied |
| Utility Gas | 1,609 (50.9%) | 40 (10.7%) |
| Bottled, Tank, or LP Gas | 124 (3.9%) | 0 (0.0%) |
| Electricity | 1,146 (36.3%) | 290 (77.3%) |
| Fuel Oil or Kerosene | 122 (3.9%) | 0 (0.0%) |
| Coal or Coke | 0 (0.0%) | 0 (0.0%) |
| All other Fuels | 149 (4.7%) | 45 (12.0%) |
| No Fuel Used | 9 (0.3%) | 0 (0.0%) |
| Total | 3,159 (100.0%) | 375 (100.0%) |
Household Vehicle Usage in Lake Morton Berrydale
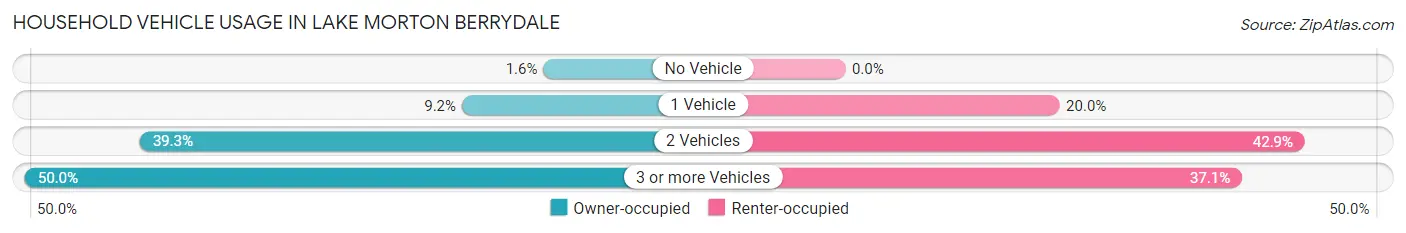
| Vehicles per Household | Owner-occupied | Renter-occupied |
| No Vehicle | 50 (1.6%) | 0 (0.0%) |
| 1 Vehicle | 290 (9.2%) | 75 (20.0%) |
| 2 Vehicles | 1,240 (39.3%) | 161 (42.9%) |
| 3 or more Vehicles | 1,579 (50.0%) | 139 (37.1%) |
| Total | 3,159 (100.0%) | 375 (100.0%) |
Real Estate & Mortgages in Lake Morton Berrydale
Real Estate and Mortgage Overview in Lake Morton Berrydale
| Characteristic | Without Mortgage | With Mortgage |
| Housing Units | 912 | 2,247 |
| Median Property Value | $616,000 | $599,200 |
| Median Household Income | $105,750 | $876 |
| Monthly Housing Costs | $972 | $895 |
| Real Estate Taxes | $6,650 | $105 |
Property Value by Mortgage Status in Lake Morton Berrydale
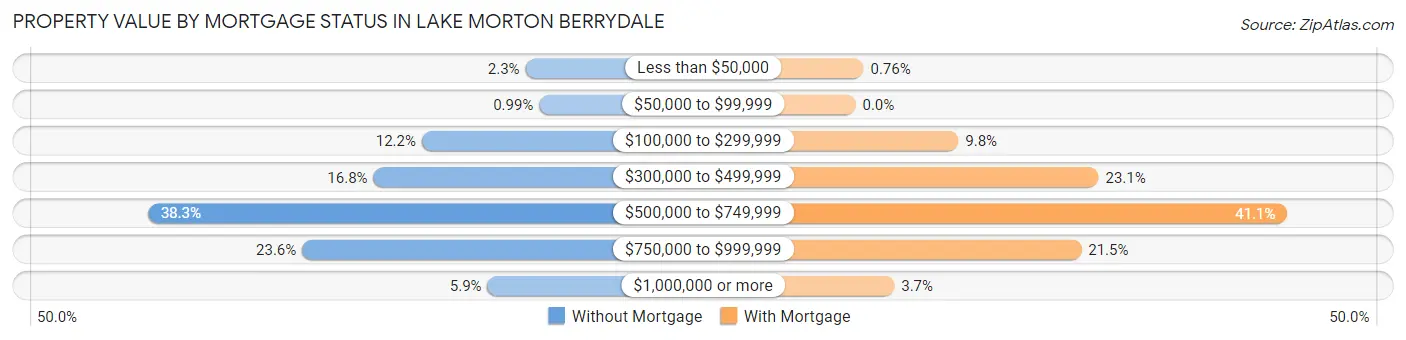
| Property Value | Without Mortgage | With Mortgage |
| Less than $50,000 | 21 (2.3%) | 17 (0.8%) |
| $50,000 to $99,999 | 9 (1.0%) | 0 (0.0%) |
| $100,000 to $299,999 | 111 (12.2%) | 220 (9.8%) |
| $300,000 to $499,999 | 153 (16.8%) | 520 (23.1%) |
| $500,000 to $749,999 | 349 (38.3%) | 924 (41.1%) |
| $750,000 to $999,999 | 215 (23.6%) | 483 (21.5%) |
| $1,000,000 or more | 54 (5.9%) | 83 (3.7%) |
| Total | 912 (100.0%) | 2,247 (100.0%) |
Household Income by Mortgage Status in Lake Morton Berrydale
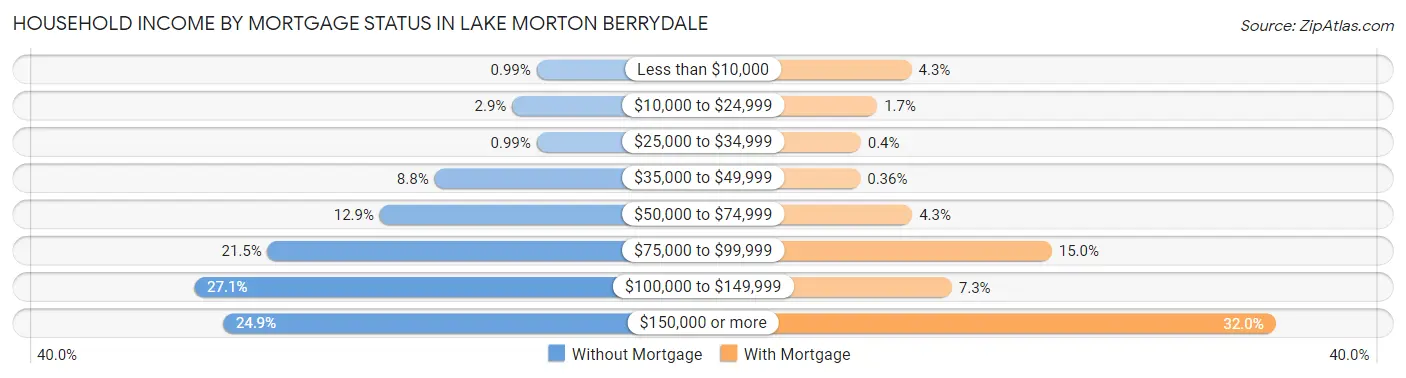
| Household Income | Without Mortgage | With Mortgage |
| Less than $10,000 | 9 (1.0%) | 96 (4.3%) |
| $10,000 to $24,999 | 26 (2.9%) | 37 (1.7%) |
| $25,000 to $34,999 | 9 (1.0%) | 9 (0.4%) |
| $35,000 to $49,999 | 80 (8.8%) | 8 (0.4%) |
| $50,000 to $74,999 | 118 (12.9%) | 97 (4.3%) |
| $75,000 to $99,999 | 196 (21.5%) | 336 (14.9%) |
| $100,000 to $149,999 | 247 (27.1%) | 165 (7.3%) |
| $150,000 or more | 227 (24.9%) | 719 (32.0%) |
| Total | 912 (100.0%) | 2,247 (100.0%) |
Property Value to Household Income Ratio in Lake Morton Berrydale
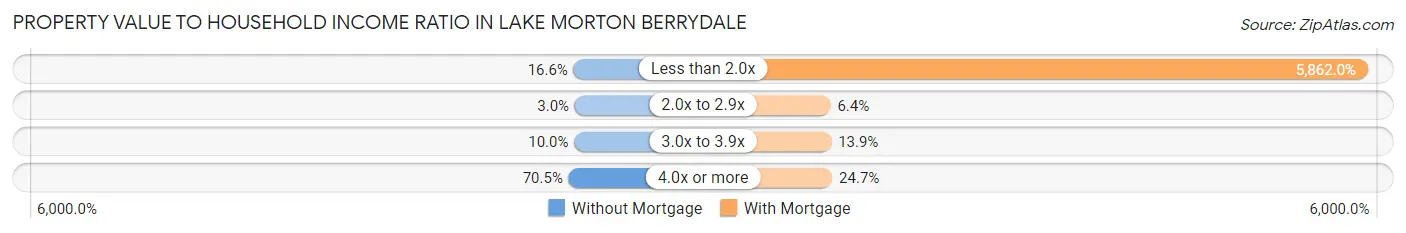
| Value-to-Income Ratio | Without Mortgage | With Mortgage |
| Less than 2.0x | 151 (16.6%) | 131,719 (5,862.0%) |
| 2.0x to 2.9x | 27 (3.0%) | 143 (6.4%) |
| 3.0x to 3.9x | 91 (10.0%) | 313 (13.9%) |
| 4.0x or more | 643 (70.5%) | 554 (24.7%) |
| Total | 912 (100.0%) | 2,247 (100.0%) |
Real Estate Taxes by Mortgage Status in Lake Morton Berrydale
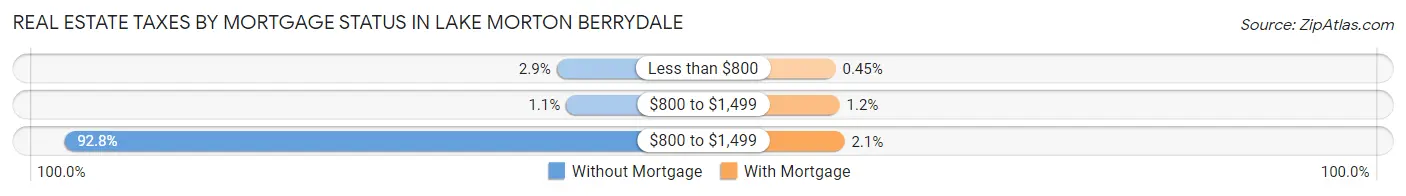
| Property Taxes | Without Mortgage | With Mortgage |
| Less than $800 | 26 (2.9%) | 10 (0.4%) |
| $800 to $1,499 | 10 (1.1%) | 27 (1.2%) |
| $800 to $1,499 | 846 (92.8%) | 47 (2.1%) |
| Total | 912 (100.0%) | 2,247 (100.0%) |
Health & Disability in Lake Morton Berrydale
Health Insurance Coverage by Age in Lake Morton Berrydale
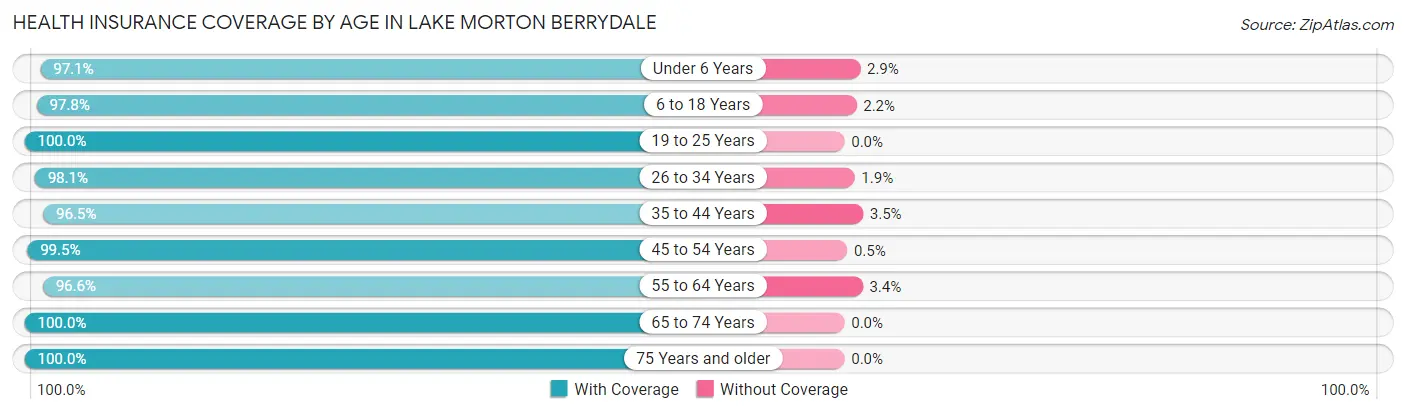
| Age Bracket | With Coverage | Without Coverage |
| Under 6 Years | 794 (97.1%) | 24 (2.9%) |
| 6 to 18 Years | 1,888 (97.8%) | 43 (2.2%) |
| 19 to 25 Years | 475 (100.0%) | 0 (0.0%) |
| 26 to 34 Years | 1,092 (98.1%) | 21 (1.9%) |
| 35 to 44 Years | 1,228 (96.5%) | 44 (3.5%) |
| 45 to 54 Years | 1,791 (99.5%) | 9 (0.5%) |
| 55 to 64 Years | 1,459 (96.6%) | 51 (3.4%) |
| 65 to 74 Years | 1,043 (100.0%) | 0 (0.0%) |
| 75 Years and older | 464 (100.0%) | 0 (0.0%) |
| Total | 10,234 (98.2%) | 192 (1.8%) |
Health Insurance Coverage by Citizenship Status in Lake Morton Berrydale
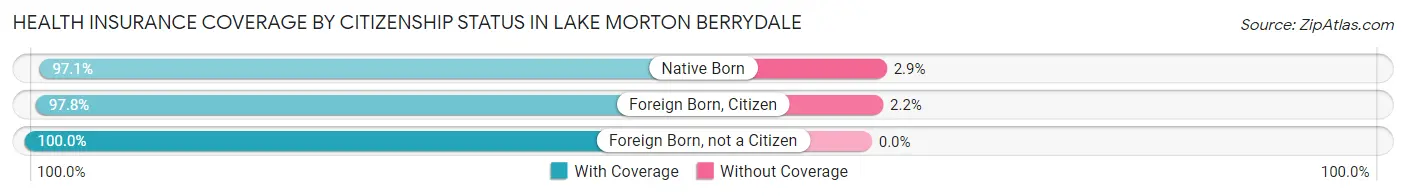
| Citizenship Status | With Coverage | Without Coverage |
| Native Born | 794 (97.1%) | 24 (2.9%) |
| Foreign Born, Citizen | 1,888 (97.8%) | 43 (2.2%) |
| Foreign Born, not a Citizen | 475 (100.0%) | 0 (0.0%) |
Health Insurance Coverage by Household Income in Lake Morton Berrydale
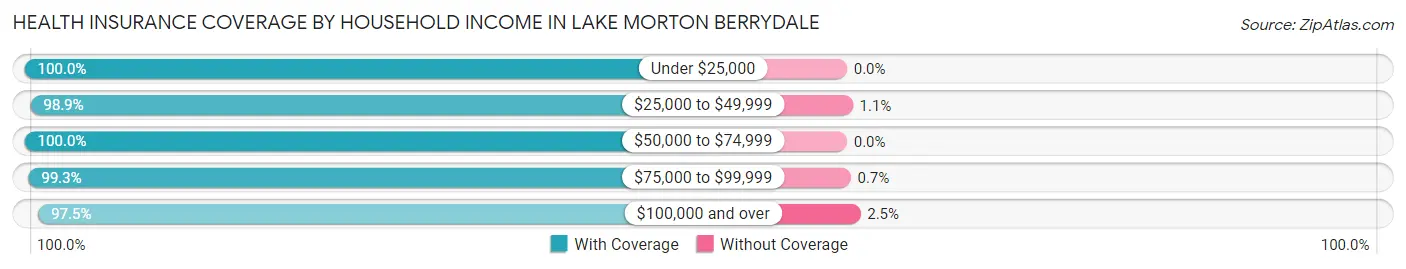
| Household Income | With Coverage | Without Coverage |
| Under $25,000 | 193 (100.0%) | 0 (0.0%) |
| $25,000 to $49,999 | 642 (98.9%) | 7 (1.1%) |
| $50,000 to $74,999 | 1,307 (100.0%) | 0 (0.0%) |
| $75,000 to $99,999 | 1,273 (99.3%) | 9 (0.7%) |
| $100,000 and over | 6,792 (97.5%) | 176 (2.5%) |
Public vs Private Health Insurance Coverage by Age in Lake Morton Berrydale
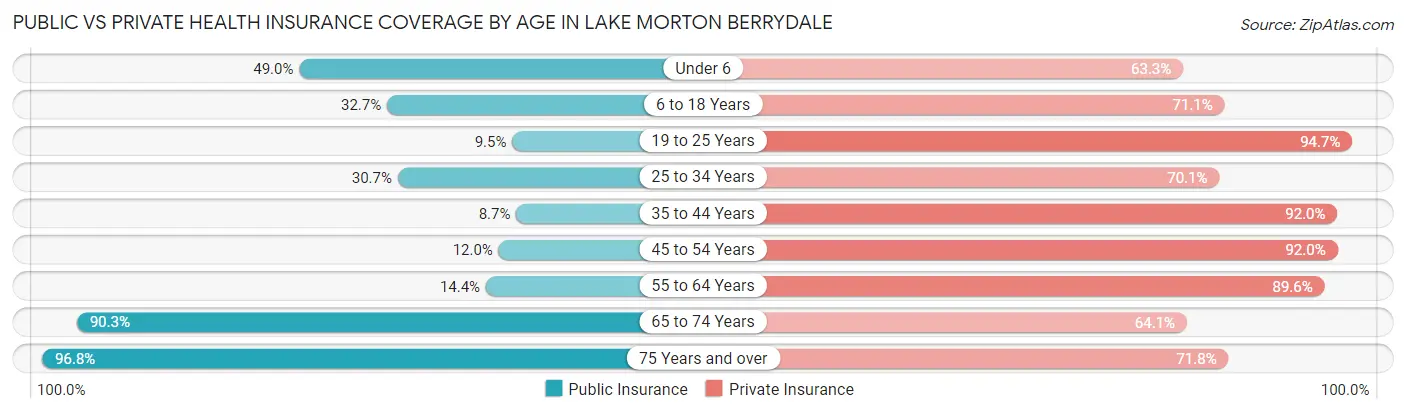
| Age Bracket | Public Insurance | Private Insurance |
| Under 6 | 401 (49.0%) | 518 (63.3%) |
| 6 to 18 Years | 632 (32.7%) | 1,372 (71.1%) |
| 19 to 25 Years | 45 (9.5%) | 450 (94.7%) |
| 25 to 34 Years | 342 (30.7%) | 780 (70.1%) |
| 35 to 44 Years | 111 (8.7%) | 1,170 (92.0%) |
| 45 to 54 Years | 216 (12.0%) | 1,656 (92.0%) |
| 55 to 64 Years | 217 (14.4%) | 1,353 (89.6%) |
| 65 to 74 Years | 942 (90.3%) | 668 (64.0%) |
| 75 Years and over | 449 (96.8%) | 333 (71.8%) |
| Total | 3,355 (32.2%) | 8,300 (79.6%) |
Disability Status by Sex by Age in Lake Morton Berrydale
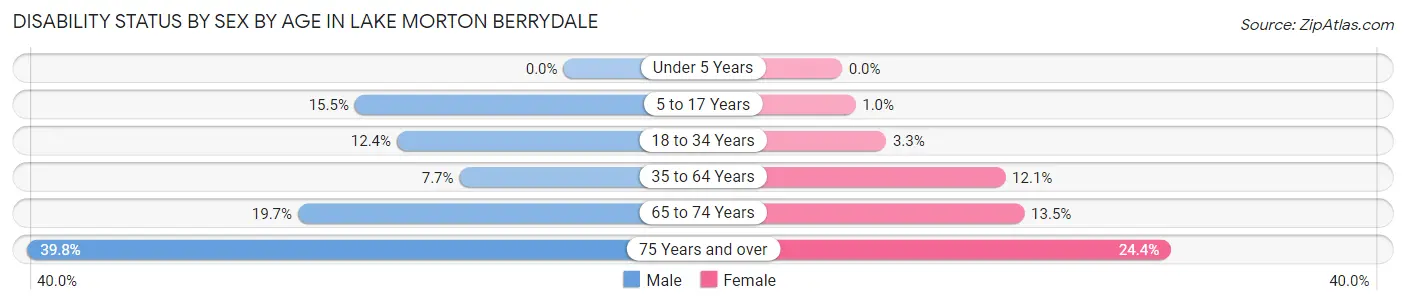
| Age Bracket | Male | Female |
| Under 5 Years | 0 (0.0%) | 0 (0.0%) |
| 5 to 17 Years | 176 (15.5%) | 9 (1.0%) |
| 18 to 34 Years | 101 (12.4%) | 28 (3.3%) |
| 35 to 64 Years | 180 (7.7%) | 273 (12.1%) |
| 65 to 74 Years | 108 (19.7%) | 67 (13.5%) |
| 75 Years and over | 113 (39.8%) | 44 (24.4%) |
Disability Class by Sex by Age in Lake Morton Berrydale
Disability Class: Hearing Difficulty
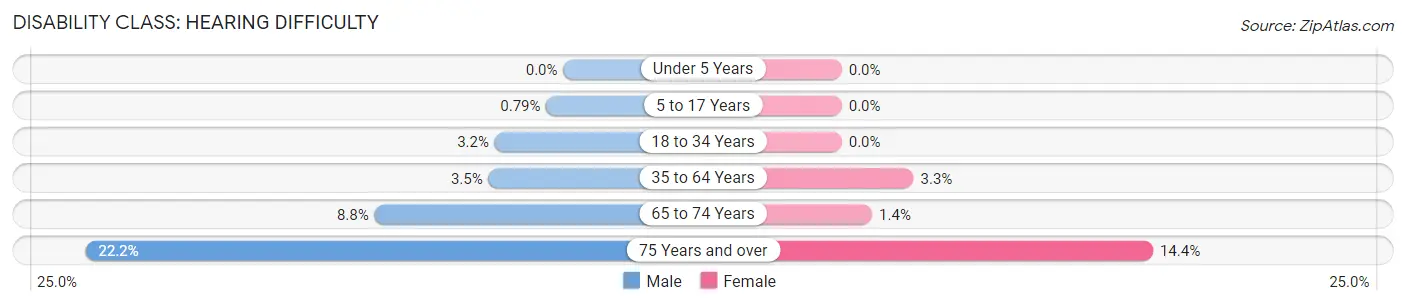
| Age Bracket | Male | Female |
| Under 5 Years | 0 (0.0%) | 0 (0.0%) |
| 5 to 17 Years | 9 (0.8%) | 0 (0.0%) |
| 18 to 34 Years | 26 (3.2%) | 0 (0.0%) |
| 35 to 64 Years | 81 (3.5%) | 75 (3.3%) |
| 65 to 74 Years | 48 (8.8%) | 7 (1.4%) |
| 75 Years and over | 63 (22.2%) | 26 (14.4%) |
Disability Class: Vision Difficulty
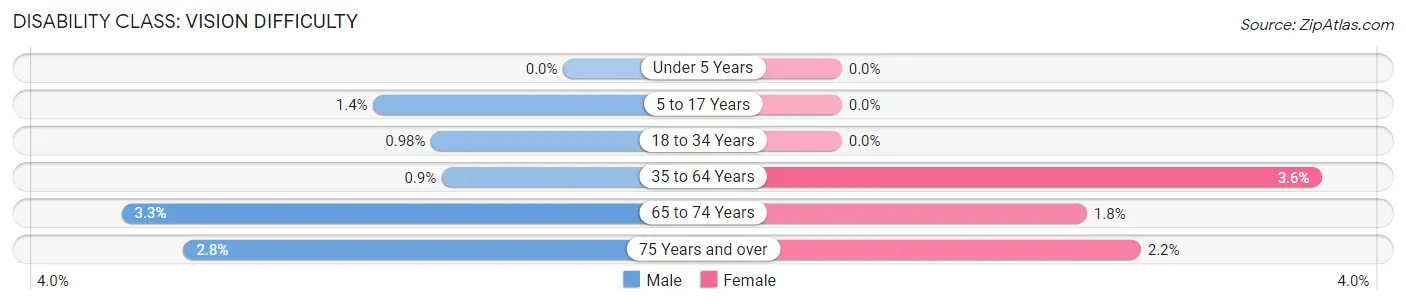
| Age Bracket | Male | Female |
| Under 5 Years | 0 (0.0%) | 0 (0.0%) |
| 5 to 17 Years | 16 (1.4%) | 0 (0.0%) |
| 18 to 34 Years | 8 (1.0%) | 0 (0.0%) |
| 35 to 64 Years | 21 (0.9%) | 80 (3.6%) |
| 65 to 74 Years | 18 (3.3%) | 9 (1.8%) |
| 75 Years and over | 8 (2.8%) | 4 (2.2%) |
Disability Class: Cognitive Difficulty
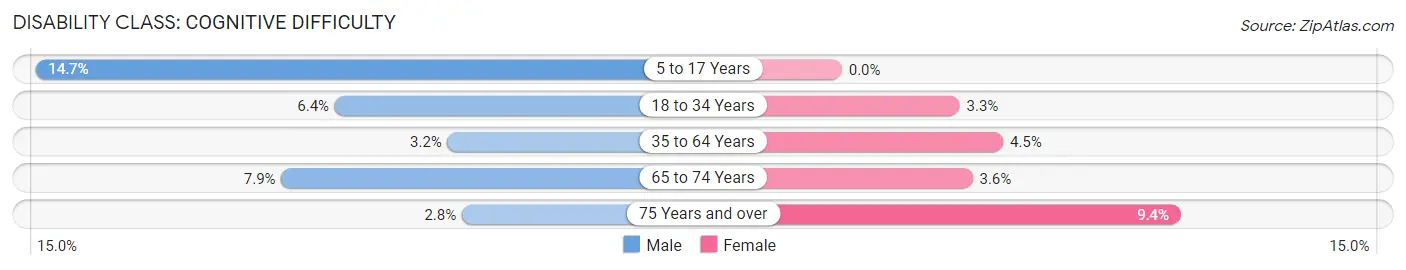
| Age Bracket | Male | Female |
| 5 to 17 Years | 167 (14.7%) | 0 (0.0%) |
| 18 to 34 Years | 52 (6.4%) | 28 (3.3%) |
| 35 to 64 Years | 75 (3.2%) | 101 (4.5%) |
| 65 to 74 Years | 43 (7.9%) | 18 (3.6%) |
| 75 Years and over | 8 (2.8%) | 17 (9.4%) |
Disability Class: Ambulatory Difficulty
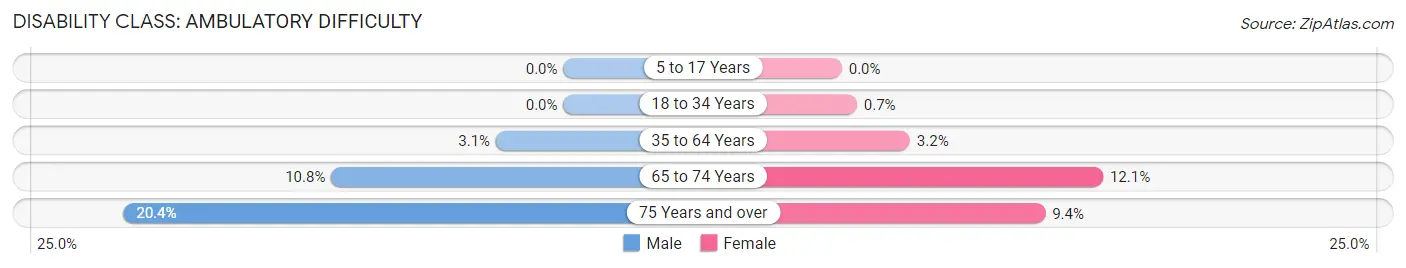
| Age Bracket | Male | Female |
| 5 to 17 Years | 0 (0.0%) | 0 (0.0%) |
| 18 to 34 Years | 0 (0.0%) | 6 (0.7%) |
| 35 to 64 Years | 73 (3.1%) | 71 (3.2%) |
| 65 to 74 Years | 59 (10.8%) | 60 (12.1%) |
| 75 Years and over | 58 (20.4%) | 17 (9.4%) |
Disability Class: Self-Care Difficulty
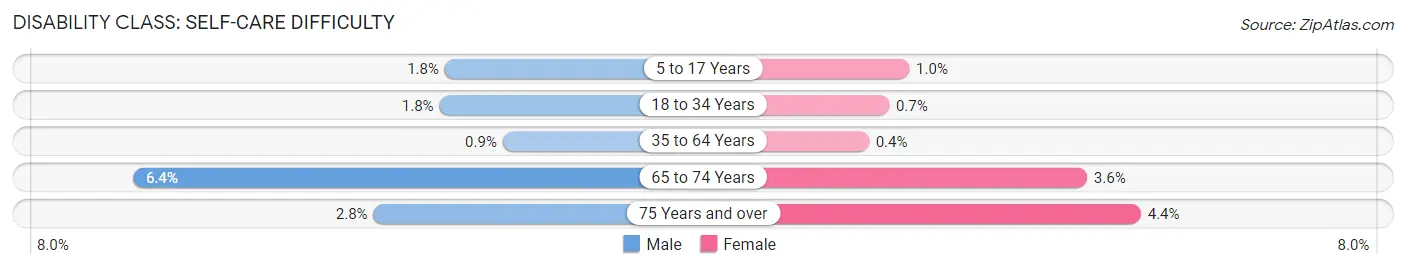
| Age Bracket | Male | Female |
| 5 to 17 Years | 20 (1.8%) | 9 (1.0%) |
| 18 to 34 Years | 15 (1.8%) | 6 (0.7%) |
| 35 to 64 Years | 21 (0.9%) | 9 (0.4%) |
| 65 to 74 Years | 35 (6.4%) | 18 (3.6%) |
| 75 Years and over | 8 (2.8%) | 8 (4.4%) |
Technology Access in Lake Morton Berrydale
Computing Device Access in Lake Morton Berrydale
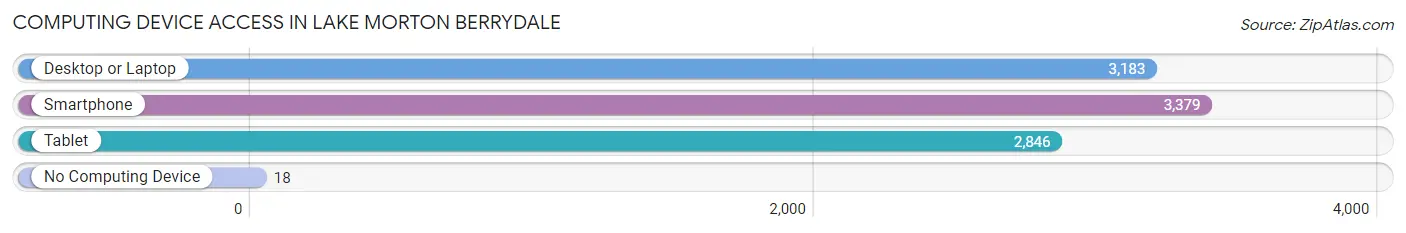
| Device Type | # Households | % Households |
| Desktop or Laptop | 3,183 | 90.1% |
| Smartphone | 3,379 | 95.6% |
| Tablet | 2,846 | 80.5% |
| No Computing Device | 18 | 0.5% |
| Total | 3,534 | 100.0% |
Internet Access in Lake Morton Berrydale
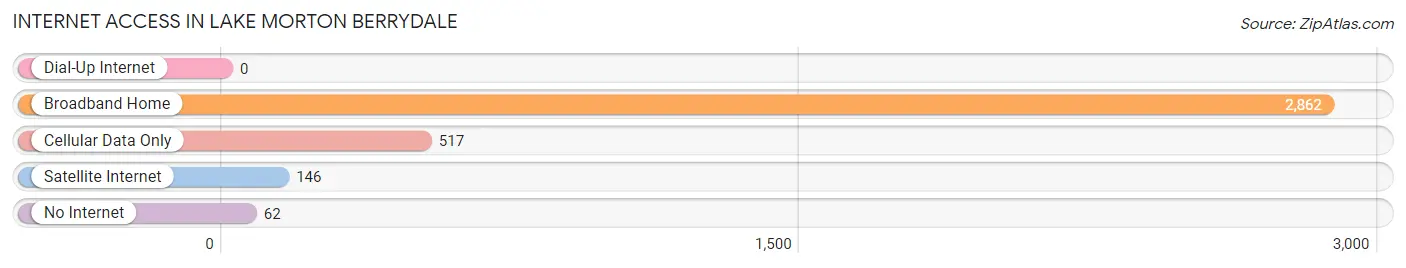
| Internet Type | # Households | % Households |
| Dial-Up Internet | 0 | 0.0% |
| Broadband Home | 2,862 | 81.0% |
| Cellular Data Only | 517 | 14.6% |
| Satellite Internet | 146 | 4.1% |
| No Internet | 62 | 1.8% |
| Total | 3,534 | 100.0% |
Lake Morton Berrydale Summary
History
Lake Morton-Berrydale is a small unincorporated community located in King County, Washington, United States. It is situated in the foothills of the Cascade Mountains, approximately 20 miles east of Seattle. The area was first settled in the late 1800s by homesteaders, and the community was officially established in the early 1900s.
The area was originally known as "Morton's Lake," named after the first settler, William Morton, who arrived in the area in 1883. He built a log cabin and began farming the land. Other settlers soon followed, and the area became known as "Morton's Lake Settlement." In the early 1900s, the settlement was renamed "Lake Morton-Berrydale" after the two main families in the area, the Mortons and the Berrys.
The area was primarily agricultural, with dairy farms, orchards, and vegetable farms. The community also had a sawmill, a general store, and a post office. In the 1920s, the area began to experience a population boom, as people moved to the area to take advantage of the fertile land and the proximity to Seattle.
Geography
Lake Morton-Berrydale is located in King County, Washington, approximately 20 miles east of Seattle. The area is situated in the foothills of the Cascade Mountains, and is surrounded by lush forests and rolling hills. The area is known for its scenic beauty, and is home to several lakes, including Lake Morton, Lake Berry, and Lake Washington.
The climate in the area is mild, with warm summers and cool winters. The average annual temperature is around 50 degrees Fahrenheit, and the average annual precipitation is around 40 inches.
Economy
The economy of Lake Morton-Berrydale is primarily based on agriculture. The area is home to several dairy farms, orchards, and vegetable farms. The area also has a few small businesses, including a sawmill, a general store, and a post office.
The area is also home to several recreational activities, including fishing, camping, and hiking. The area is also popular with tourists, who come to enjoy the scenic beauty and the outdoor activities.
Demographics
As of the 2010 census, the population of Lake Morton-Berrydale was 1,845. The population is primarily white (94.3%), with a small percentage of African American (2.2%), Asian (1.2%), and Hispanic (1.2%) residents. The median household income is $60,000, and the median home value is $250,000.
Conclusion
Lake Morton-Berrydale is a small unincorporated community located in King County, Washington, United States. It is situated in the foothills of the Cascade Mountains, approximately 20 miles east of Seattle. The area was first settled in the late 1800s by homesteaders, and the community was officially established in the early 1900s. The economy of Lake Morton-Berrydale is primarily based on agriculture, with dairy farms, orchards, and vegetable farms. The area is also home to several recreational activities, including fishing, camping, and hiking. As of the 2010 census, the population of Lake Morton-Berrydale was 1,845. The population is primarily white, with a small percentage of African American, Asian, and Hispanic residents.
Common Questions
What is Per Capita Income in Lake Morton Berrydale?
Per Capita income in Lake Morton Berrydale is $54,216.
What is the Median Family Income in Lake Morton Berrydale?
Median Family Income in Lake Morton Berrydale is $121,316.
What is the Median Household income in Lake Morton Berrydale?
Median Household Income in Lake Morton Berrydale is $121,272.
What is Income or Wage Gap in Lake Morton Berrydale?
Income or Wage Gap in Lake Morton Berrydale is 38.3%.
Women in Lake Morton Berrydale earn 61.7 cents for every dollar earned by a man.
What is Family Income Deficit in Lake Morton Berrydale?
Family Income Deficit in Lake Morton Berrydale is $6,029.
Families that are below poverty line in Lake Morton Berrydale earn $6,029 less on average than the poverty threshold level.
What is Inequality or Gini Index in Lake Morton Berrydale?
Inequality or Gini Index in Lake Morton Berrydale is 0.39.
What is the Total Population of Lake Morton Berrydale?
Total Population of Lake Morton Berrydale is 10,457.
What is the Total Male Population of Lake Morton Berrydale?
Total Male Population of Lake Morton Berrydale is 5,514.
What is the Total Female Population of Lake Morton Berrydale?
Total Female Population of Lake Morton Berrydale is 4,943.
What is the Ratio of Males per 100 Females in Lake Morton Berrydale?
There are 111.55 Males per 100 Females in Lake Morton Berrydale.
What is the Ratio of Females per 100 Males in Lake Morton Berrydale?
There are 89.64 Females per 100 Males in Lake Morton Berrydale.
What is the Median Population Age in Lake Morton Berrydale?
Median Population Age in Lake Morton Berrydale is 42.7 Years.
What is the Average Family Size in Lake Morton Berrydale
Average Family Size in Lake Morton Berrydale is 3.1 People.
What is the Average Household Size in Lake Morton Berrydale
Average Household Size in Lake Morton Berrydale is 3.0 People.
How Large is the Labor Force in Lake Morton Berrydale?
There are 5,458 People in the Labor Forcein in Lake Morton Berrydale.
What is the Percentage of People in the Labor Force in Lake Morton Berrydale?
67.7% of People are in the Labor Force in Lake Morton Berrydale.
What is the Unemployment Rate in Lake Morton Berrydale?
Unemployment Rate in Lake Morton Berrydale is 3.0%.