Cities with the Lowest Poverty Level Among Children Under the Age of 5 in Idaho
RELATED REPORTS & OPTIONS
Lowest Poverty | Child 0-5
Idaho
Compare Cities
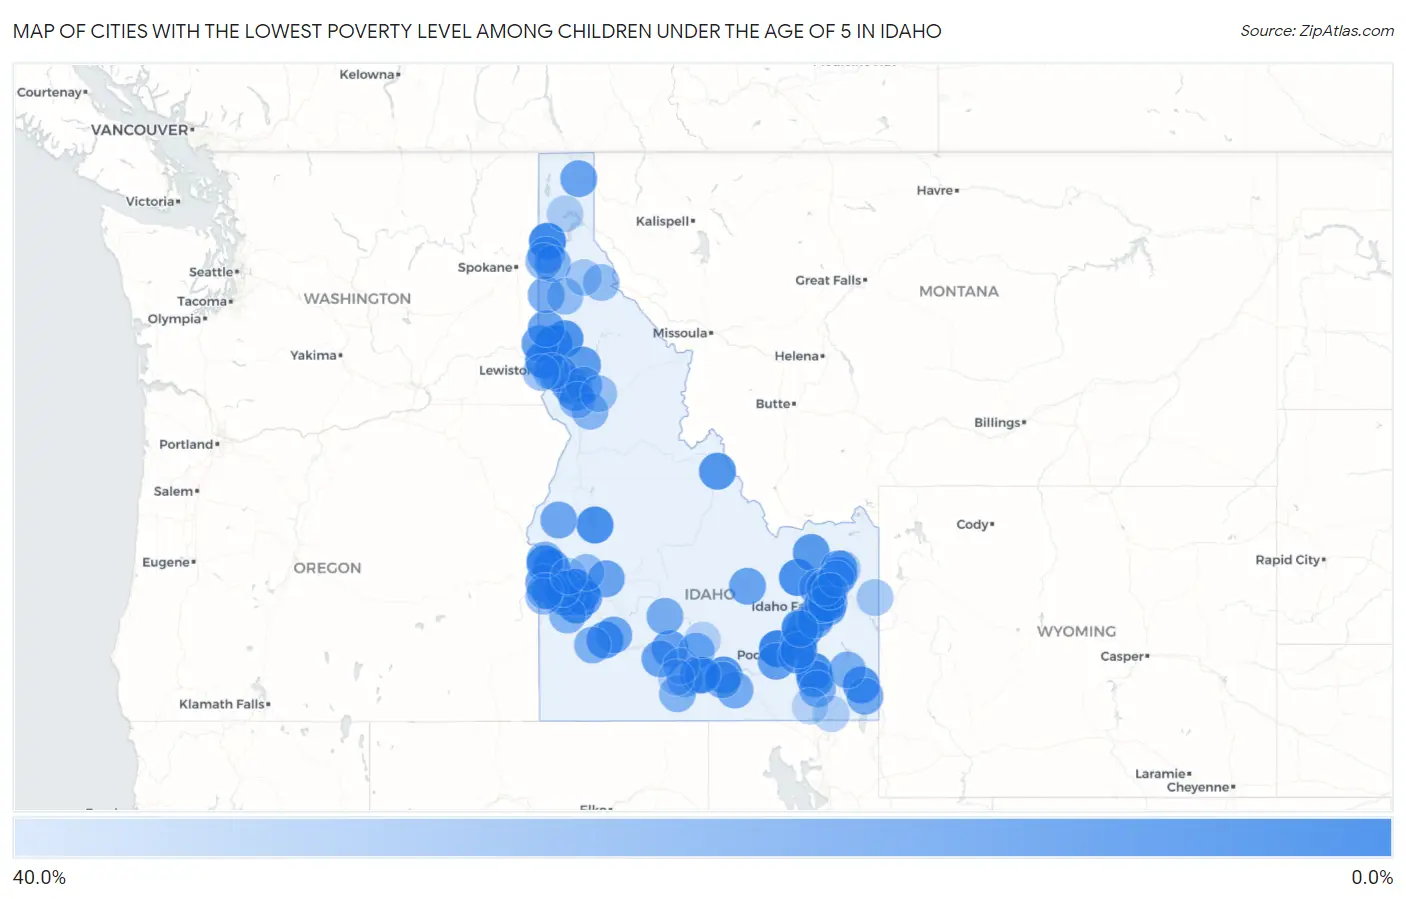
Map of Cities with the Lowest Poverty Level Among Children Under the Age of 5 in Idaho
40.0%
0.0%
Cities with the Lowest Poverty Level Among Children Under the Age of 5 in Idaho
| City | Child Poverty | vs State | vs National | |
| 1. | Aberdeen | 0.64% | 15.8%(-15.2)#1 | 18.1%(-17.4)#33 |
| 2. | Eagle | 1.1% | 15.8%(-14.7)#2 | 18.1%(-17.0)#118 |
| 3. | Spirit Lake | 3.2% | 15.8%(-12.6)#3 | 18.1%(-14.9)#795 |
| 4. | Troy | 3.4% | 15.8%(-12.4)#4 | 18.1%(-14.7)#868 |
| 5. | Iona | 3.5% | 15.8%(-12.3)#5 | 18.1%(-14.6)#896 |
| 6. | New Plymouth | 4.4% | 15.8%(-11.4)#6 | 18.1%(-13.7)#1,292 |
| 7. | Genesee | 4.5% | 15.8%(-11.3)#7 | 18.1%(-13.5)#1,353 |
| 8. | Mccammon | 5.3% | 15.8%(-10.5)#8 | 18.1%(-12.8)#1,684 |
| 9. | Cascade | 5.3% | 15.8%(-10.5)#9 | 18.1%(-12.7)#1,720 |
| 10. | Mud Lake | 5.5% | 15.8%(-10.3)#10 | 18.1%(-12.6)#1,771 |
| 11. | Eden | 5.8% | 15.8%(-10.0)#11 | 18.1%(-12.3)#1,912 |
| 12. | Kuna | 6.5% | 15.8%(-9.26)#12 | 18.1%(-11.5)#2,208 |
| 13. | Garden City | 6.9% | 15.8%(-8.94)#13 | 18.1%(-11.2)#2,353 |
| 14. | Fruitland | 7.4% | 15.8%(-8.37)#14 | 18.1%(-10.6)#2,609 |
| 15. | Georgetown | 7.7% | 15.8%(-8.11)#15 | 18.1%(-10.4)#2,714 |
| 16. | Deary | 7.7% | 15.8%(-8.11)#16 | 18.1%(-10.4)#2,720 |
| 17. | Salmon | 8.2% | 15.8%(-7.65)#17 | 18.1%(-9.91)#2,887 |
| 18. | Paul | 8.3% | 15.8%(-7.46)#18 | 18.1%(-9.73)#2,962 |
| 19. | Meridian | 8.6% | 15.8%(-7.17)#19 | 18.1%(-9.44)#3,098 |
| 20. | Blackfoot | 8.9% | 15.8%(-6.88)#20 | 18.1%(-9.14)#3,217 |
| 21. | Mountain Home Afb | 9.0% | 15.8%(-6.76)#21 | 18.1%(-9.02)#3,256 |
| 22. | Star | 9.3% | 15.8%(-6.46)#22 | 18.1%(-8.72)#3,406 |
| 23. | Dubois | 10.0% | 15.8%(-5.80)#23 | 18.1%(-8.06)#3,654 |
| 24. | Ucon | 10.5% | 15.8%(-5.27)#24 | 18.1%(-7.54)#3,862 |
| 25. | Parker | 10.9% | 15.8%(-4.93)#25 | 18.1%(-7.19)#3,999 |
| 26. | Fort Hall | 11.3% | 15.8%(-4.52)#26 | 18.1%(-6.78)#4,174 |
| 27. | Craigmont | 11.4% | 15.8%(-4.37)#27 | 18.1%(-6.63)#4,242 |
| 28. | Orofino | 11.6% | 15.8%(-4.19)#28 | 18.1%(-6.46)#4,304 |
| 29. | Lewisville | 11.8% | 15.8%(-4.03)#29 | 18.1%(-6.30)#4,369 |
| 30. | Moscow | 11.9% | 15.8%(-3.92)#30 | 18.1%(-6.19)#4,410 |
| 31. | Arimo | 12.0% | 15.8%(-3.80)#31 | 18.1%(-6.06)#4,460 |
| 32. | Ferdinand | 12.5% | 15.8%(-3.30)#32 | 18.1%(-5.56)#4,661 |
| 33. | Gooding | 12.6% | 15.8%(-3.23)#33 | 18.1%(-5.49)#4,685 |
| 34. | American Falls | 12.7% | 15.8%(-3.06)#34 | 18.1%(-5.32)#4,729 |
| 35. | Moreland | 12.8% | 15.8%(-2.95)#35 | 18.1%(-5.22)#4,777 |
| 36. | Sugar City | 13.0% | 15.8%(-2.79)#36 | 18.1%(-5.05)#4,837 |
| 37. | Ammon | 13.5% | 15.8%(-2.29)#37 | 18.1%(-4.56)#5,021 |
| 38. | Nampa | 13.7% | 15.8%(-2.11)#38 | 18.1%(-4.37)#5,097 |
| 39. | Parma | 13.9% | 15.8%(-1.86)#39 | 18.1%(-4.13)#5,186 |
| 40. | Shelley | 14.2% | 15.8%(-1.59)#40 | 18.1%(-3.85)#5,285 |
| 41. | Idaho City | 14.3% | 15.8%(-1.51)#41 | 18.1%(-3.78)#5,324 |
| 42. | Potlatch | 14.5% | 15.8%(-1.31)#42 | 18.1%(-3.57)#5,412 |
| 43. | Hagerman | 14.5% | 15.8%(-1.28)#43 | 18.1%(-3.55)#5,422 |
| 44. | Moore | 14.6% | 15.8%(-1.16)#44 | 18.1%(-3.43)#5,460 |
| 45. | Bonners Ferry | 15.2% | 15.8%(-0.623)#45 | 18.1%(-2.89)#5,650 |
| 46. | Roberts | 15.4% | 15.8%(-0.413)#46 | 18.1%(-2.68)#5,734 |
| 47. | Mountain Home | 15.7% | 15.8%(-0.098)#47 | 18.1%(-2.36)#5,834 |
| 48. | Caldwell | 15.9% | 15.8%(+0.093)#48 | 18.1%(-2.17)#5,894 |
| 49. | Cambridge | 16.1% | 15.8%(+0.331)#49 | 18.1%(-1.93)#5,981 |
| 50. | Boise City | 16.6% | 15.8%(+0.815)#50 | 18.1%(-1.45)#6,122 |
| 51. | Culdesac | 16.7% | 15.8%(+0.869)#51 | 18.1%(-1.40)#6,172 |
| 52. | Pocatello | 17.1% | 15.8%(+1.26)#52 | 18.1%(-1.00)#6,301 |
| 53. | Chubbuck | 17.3% | 15.8%(+1.48)#53 | 18.1%(-0.785)#6,360 |
| 54. | Rathdrum | 17.8% | 15.8%(+1.98)#54 | 18.1%(-0.288)#6,534 |
| 55. | Montpelier | 18.0% | 15.8%(+2.21)#55 | 18.1%(-0.053)#6,619 |
| 56. | Albion | 18.2% | 15.8%(+2.38)#56 | 18.1%(+0.119)#6,679 |
| 57. | Greenleaf | 18.4% | 15.8%(+2.62)#57 | 18.1%(+0.358)#6,753 |
| 58. | Plummer | 18.8% | 15.8%(+2.95)#58 | 18.1%(+0.687)#6,864 |
| 59. | Fairfield | 18.8% | 15.8%(+2.95)#59 | 18.1%(+0.687)#6,872 |
| 60. | Burley | 18.8% | 15.8%(+3.01)#60 | 18.1%(+0.750)#6,892 |
| 61. | Downey | 19.5% | 15.8%(+3.71)#61 | 18.1%(+1.45)#7,104 |
| 62. | Dietrich | 19.5% | 15.8%(+3.71)#62 | 18.1%(+1.45)#7,106 |
| 63. | Soda Springs | 19.6% | 15.8%(+3.84)#63 | 18.1%(+1.58)#7,144 |
| 64. | Firth | 20.0% | 15.8%(+4.20)#64 | 18.1%(+1.94)#7,262 |
| 65. | Idaho Falls | 20.3% | 15.8%(+4.47)#65 | 18.1%(+2.21)#7,358 |
| 66. | Grand View | 20.8% | 15.8%(+5.04)#66 | 18.1%(+2.77)#7,518 |
| 67. | Nezperce | 21.4% | 15.8%(+5.63)#67 | 18.1%(+3.37)#7,702 |
| 68. | Twin Falls | 21.5% | 15.8%(+5.72)#68 | 18.1%(+3.46)#7,745 |
| 69. | Hollister | 21.9% | 15.8%(+6.08)#69 | 18.1%(+3.81)#7,863 |
| 70. | Coeur D Alene | 22.0% | 15.8%(+6.21)#70 | 18.1%(+3.94)#7,904 |
| 71. | Melba | 22.2% | 15.8%(+6.42)#71 | 18.1%(+4.16)#7,959 |
| 72. | Middleton | 22.4% | 15.8%(+6.56)#72 | 18.1%(+4.30)#8,012 |
| 73. | Lincoln | 23.0% | 15.8%(+7.19)#73 | 18.1%(+4.93)#8,183 |
| 74. | Payette | 23.0% | 15.8%(+7.21)#74 | 18.1%(+4.95)#8,188 |
| 75. | Grangeville | 23.5% | 15.8%(+7.73)#75 | 18.1%(+5.47)#8,337 |
| 76. | Lapwai | 23.6% | 15.8%(+7.79)#76 | 18.1%(+5.52)#8,368 |
| 77. | Cottonwood | 25.0% | 15.8%(+9.20)#77 | 18.1%(+6.94)#8,730 |
| 78. | Hazelton | 25.0% | 15.8%(+9.20)#78 | 18.1%(+6.94)#8,738 |
| 79. | Horseshoe Bend | 25.0% | 15.8%(+9.20)#79 | 18.1%(+6.94)#8,750 |
| 80. | Post Falls | 25.3% | 15.8%(+9.54)#80 | 18.1%(+7.28)#8,870 |
| 81. | Homedale | 25.6% | 15.8%(+9.83)#81 | 18.1%(+7.56)#8,935 |
| 82. | Wilder | 26.0% | 15.8%(+10.2)#82 | 18.1%(+7.94)#9,026 |
| 83. | Wallace | 26.2% | 15.8%(+10.4)#83 | 18.1%(+8.17)#9,078 |
| 84. | Riverside | 26.3% | 15.8%(+10.5)#84 | 18.1%(+8.25)#9,096 |
| 85. | Menan | 26.3% | 15.8%(+10.5)#85 | 18.1%(+8.25)#9,098 |
| 86. | St Maries | 26.4% | 15.8%(+10.6)#86 | 18.1%(+8.29)#9,113 |
| 87. | Lewiston | 26.9% | 15.8%(+11.1)#87 | 18.1%(+8.81)#9,233 |
| 88. | Kooskia | 27.3% | 15.8%(+11.5)#88 | 18.1%(+9.21)#9,331 |
| 89. | Victor | 29.7% | 15.8%(+13.9)#89 | 18.1%(+11.7)#9,941 |
| 90. | Pinehurst | 31.1% | 15.8%(+15.3)#90 | 18.1%(+13.1)#10,272 |
| 91. | St Anthony | 31.8% | 15.8%(+16.0)#91 | 18.1%(+13.7)#10,391 |
| 92. | Rexburg | 32.1% | 15.8%(+16.3)#92 | 18.1%(+14.0)#10,446 |
| 93. | Jerome | 32.7% | 15.8%(+16.9)#93 | 18.1%(+14.6)#10,564 |
| 94. | Rigby | 33.1% | 15.8%(+17.3)#94 | 18.1%(+15.0)#10,616 |
| 95. | Sandpoint | 33.5% | 15.8%(+17.7)#95 | 18.1%(+15.5)#10,807 |
| 96. | Preston | 34.1% | 15.8%(+18.3)#96 | 18.1%(+16.0)#10,893 |
| 97. | Richfield | 34.8% | 15.8%(+19.0)#97 | 18.1%(+16.7)#11,018 |
| 98. | Filer | 35.1% | 15.8%(+19.3)#98 | 18.1%(+17.0)#11,060 |
| 99. | Emmett | 35.5% | 15.8%(+19.7)#99 | 18.1%(+17.4)#11,142 |
| 100. | Malad City | 36.5% | 15.8%(+20.7)#100 | 18.1%(+18.4)#11,348 |
Common Questions
What are the Top 10 Cities with the Lowest Poverty Level Among Children Under the Age of 5 in Idaho?
Top 10 Cities with the Lowest Poverty Level Among Children Under the Age of 5 in Idaho are:
#1
0.64%
#2
1.1%
#3
3.2%
#4
3.4%
#5
3.5%
#6
4.4%
#7
4.5%
#8
5.3%
#9
5.3%
#10
5.5%
What city has the Lowest Poverty Level Among Children Under the Age of 5 in Idaho?
Aberdeen has the Lowest Poverty Level Among Children Under the Age of 5 in Idaho with 0.64%.
What is the Poverty Level Among Children Under the Age of 5 in the State of Idaho?
Poverty Level Among Children Under the Age of 5 in Idaho is 15.8%.
What is the Poverty Level Among Children Under the Age of 5 in the United States?
Poverty Level Among Children Under the Age of 5 in the United States is 18.1%.