Gleed, WA Map & Demographics
Gleed Map
Gleed Overview
$33,390
PER CAPITA INCOME
$86,026
AVG FAMILY INCOME
$76,875
AVG HOUSEHOLD INCOME
0.7%
WAGE / INCOME GAP [ % ]
99.3¢/ $1
WAGE / INCOME GAP [ $ ]
0.37
INEQUALITY / GINI INDEX
3,231
TOTAL POPULATION
1,679
MALE POPULATION
1,552
FEMALE POPULATION
108.18
MALES / 100 FEMALES
92.44
FEMALES / 100 MALES
41.3
MEDIAN AGE
3.0
AVG FAMILY SIZE
2.7
AVG HOUSEHOLD SIZE
1,553
LABOR FORCE [ PEOPLE ]
63.4%
PERCENT IN LABOR FORCE
5.3%
UNEMPLOYMENT RATE
Gleed Area Codes
Income in Gleed
Income Overview in Gleed
Per Capita Income in Gleed is $33,390, while median incomes of families and households are $86,026 and $76,875 respectively.
| Characteristic | Number | Measure |
| Per Capita Income | 3,231 | $33,390 |
| Median Family Income | 965 | $86,026 |
| Mean Family Income | 965 | $99,428 |
| Median Household Income | 1,191 | $76,875 |
| Mean Household Income | 1,191 | $90,555 |
| Income Deficit | 965 | $0 |
| Wage / Income Gap (%) | 3,231 | 0.71% |
| Wage / Income Gap ($) | 3,231 | 99.29¢ per $1 |
| Gini / Inequality Index | 3,231 | 0.37 |
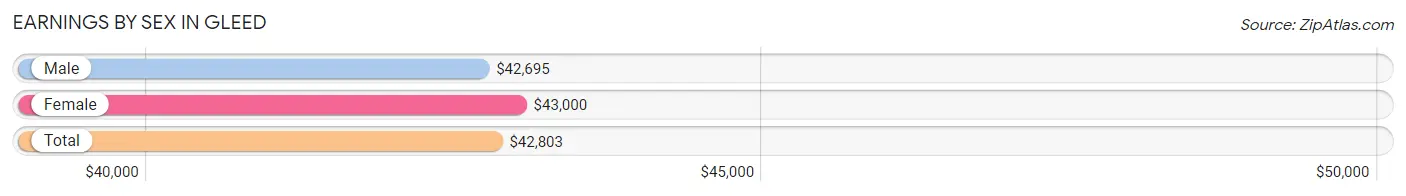
Earnings by Sex in Gleed
Average Earnings in Gleed are $42,803, $42,695 for men and $43,000 for women, a difference of 0.7%.
| Sex | Number | Average Earnings |
| Male | 962 (55.0%) | $42,695 |
| Female | 786 (45.0%) | $43,000 |
| Total | 1,748 (100.0%) | $42,803 |
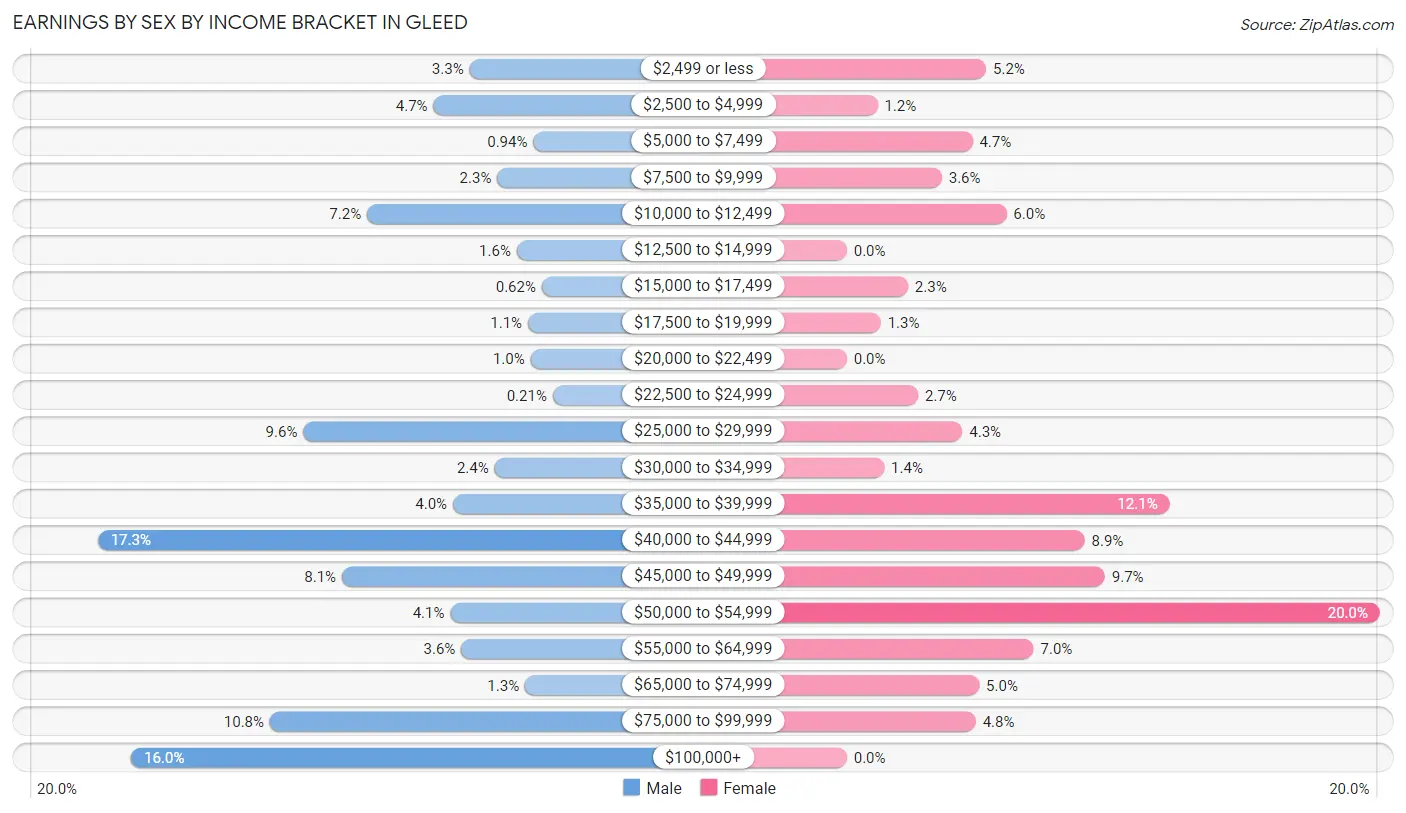
Earnings by Sex by Income Bracket in Gleed
The most common earnings brackets in Gleed are $40,000 to $44,999 for men (166 | 17.3%) and $50,000 to $54,999 for women (157 | 20.0%).
| Income | Male | Female |
| $2,499 or less | 32 (3.3%) | 41 (5.2%) |
| $2,500 to $4,999 | 45 (4.7%) | 9 (1.1%) |
| $5,000 to $7,499 | 9 (0.9%) | 37 (4.7%) |
| $7,500 to $9,999 | 22 (2.3%) | 28 (3.6%) |
| $10,000 to $12,499 | 69 (7.2%) | 47 (6.0%) |
| $12,500 to $14,999 | 15 (1.6%) | 0 (0.0%) |
| $15,000 to $17,499 | 6 (0.6%) | 18 (2.3%) |
| $17,500 to $19,999 | 11 (1.1%) | 10 (1.3%) |
| $20,000 to $22,499 | 10 (1.0%) | 0 (0.0%) |
| $22,500 to $24,999 | 2 (0.2%) | 21 (2.7%) |
| $25,000 to $29,999 | 92 (9.6%) | 34 (4.3%) |
| $30,000 to $34,999 | 23 (2.4%) | 11 (1.4%) |
| $35,000 to $39,999 | 38 (4.0%) | 95 (12.1%) |
| $40,000 to $44,999 | 166 (17.3%) | 70 (8.9%) |
| $45,000 to $49,999 | 78 (8.1%) | 76 (9.7%) |
| $50,000 to $54,999 | 39 (4.1%) | 157 (20.0%) |
| $55,000 to $64,999 | 35 (3.6%) | 55 (7.0%) |
| $65,000 to $74,999 | 12 (1.3%) | 39 (5.0%) |
| $75,000 to $99,999 | 104 (10.8%) | 38 (4.8%) |
| $100,000+ | 154 (16.0%) | 0 (0.0%) |
| Total | 962 (100.0%) | 786 (100.0%) |
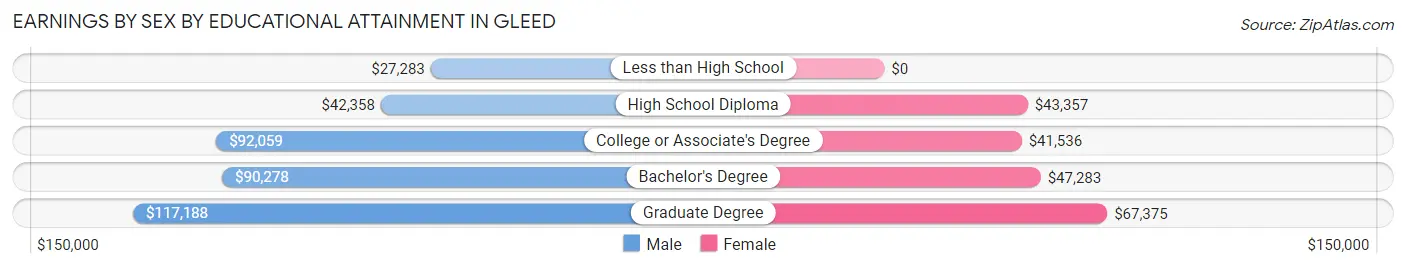
Earnings by Sex by Educational Attainment in Gleed
Average earnings in Gleed are $44,590 for men and $43,964 for women, a difference of 1.4%. Men with an educational attainment of graduate degree enjoy the highest average annual earnings of $117,188, while those with less than high school education earn the least with $27,283. Women with an educational attainment of graduate degree earn the most with the average annual earnings of $67,375, while those with college or associate's degree education have the smallest earnings of $41,536.
| Educational Attainment | Male Income | Female Income |
| Less than High School | $27,283 | $0 |
| High School Diploma | $42,358 | $43,357 |
| College or Associate's Degree | $92,059 | $41,536 |
| Bachelor's Degree | $90,278 | $47,283 |
| Graduate Degree | $117,188 | $67,375 |
| Total | $44,590 | $43,964 |
Family Income in Gleed
Family Income Brackets in Gleed
According to the Gleed family income data, there are 229 families falling into the $75,000 to $99,999 income range, which is the most common income bracket and makes up 23.7% of all families. Conversely, the $10,000 to $14,999 income bracket is the least frequent group with only 12 families (1.2%) belonging to this category.
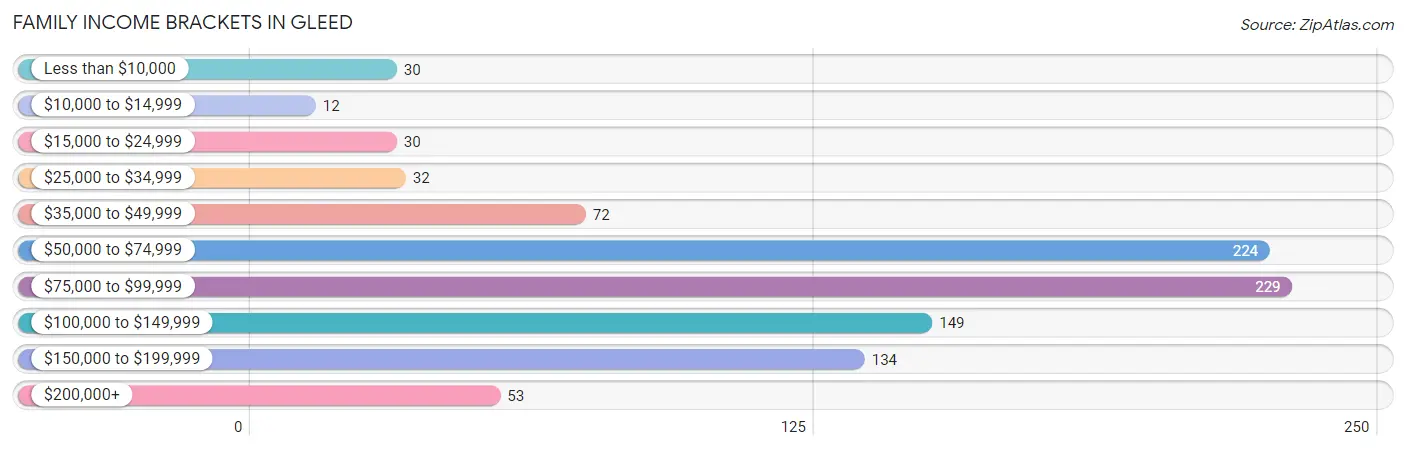
| Income Bracket | # Families | % Families |
| Less than $10,000 | 30 | 3.1% |
| $10,000 to $14,999 | 12 | 1.2% |
| $15,000 to $24,999 | 30 | 3.1% |
| $25,000 to $34,999 | 32 | 3.3% |
| $35,000 to $49,999 | 72 | 7.5% |
| $50,000 to $74,999 | 224 | 23.2% |
| $75,000 to $99,999 | 229 | 23.7% |
| $100,000 to $149,999 | 149 | 15.4% |
| $150,000 to $199,999 | 134 | 13.9% |
| $200,000+ | 53 | 5.5% |
Family Income by Famaliy Size in Gleed
5-person families (154 | 16.0%) account for the highest median family income in Gleed with $98,201 per family, while 2-person families (437 | 45.3%) have the highest median income of $43,482 per family member.
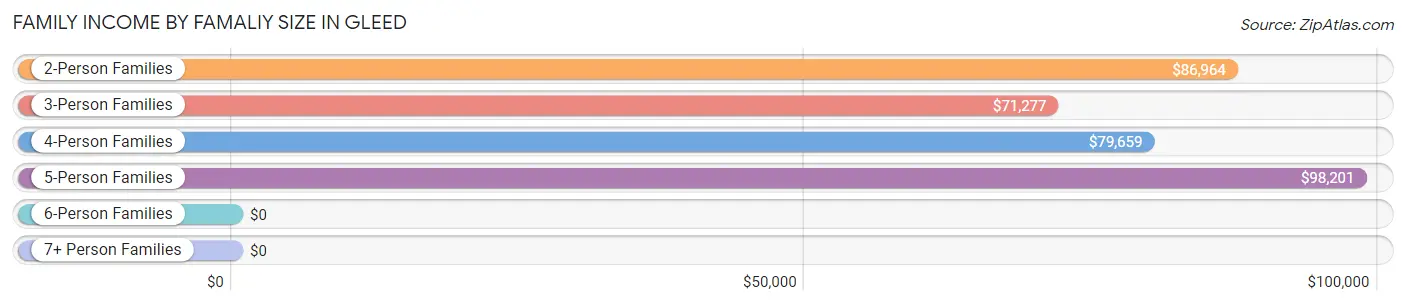
| Income Bracket | # Families | Median Income |
| 2-Person Families | 437 (45.3%) | $86,964 |
| 3-Person Families | 178 (18.4%) | $71,277 |
| 4-Person Families | 195 (20.2%) | $79,659 |
| 5-Person Families | 154 (16.0%) | $98,201 |
| 6-Person Families | 0 (0.0%) | $0 |
| 7+ Person Families | 1 (0.1%) | $0 |
| Total | 965 (100.0%) | $86,026 |
Family Income by Number of Earners in Gleed
The median family income in Gleed is $86,026, with families comprising 3+ earners (42) having the highest median family income of $124,500, while families with 1 earner (213) have the lowest median family income of $61,705, accounting for 4.3% and 22.1% of families, respectively.
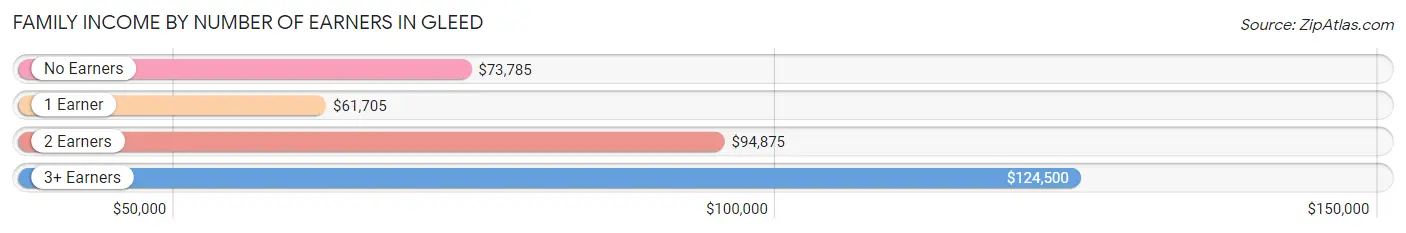
| Number of Earners | # Families | Median Income |
| No Earners | 123 (12.8%) | $73,785 |
| 1 Earner | 213 (22.1%) | $61,705 |
| 2 Earners | 587 (60.8%) | $94,875 |
| 3+ Earners | 42 (4.3%) | $124,500 |
| Total | 965 (100.0%) | $86,026 |
Household Income in Gleed
Household Income Brackets in Gleed
With 235 households falling in the category, the $75,000 to $99,999 income range is the most frequent in Gleed, accounting for 19.7% of all households. In contrast, only 21 households (1.8%) fall into the $10,000 to $14,999 income bracket, making it the least populous group.
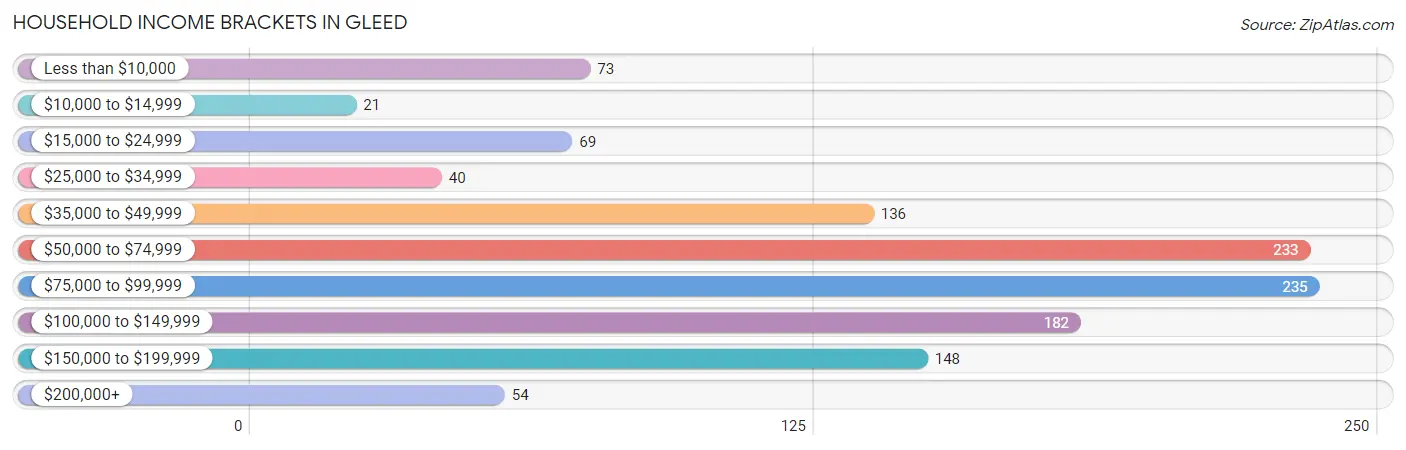
| Income Bracket | # Households | % Households |
| Less than $10,000 | 73 | 6.1% |
| $10,000 to $14,999 | 21 | 1.8% |
| $15,000 to $24,999 | 69 | 5.8% |
| $25,000 to $34,999 | 40 | 3.4% |
| $35,000 to $49,999 | 136 | 11.4% |
| $50,000 to $74,999 | 233 | 19.6% |
| $75,000 to $99,999 | 235 | 19.7% |
| $100,000 to $149,999 | 182 | 15.3% |
| $150,000 to $199,999 | 148 | 12.4% |
| $200,000+ | 54 | 4.5% |
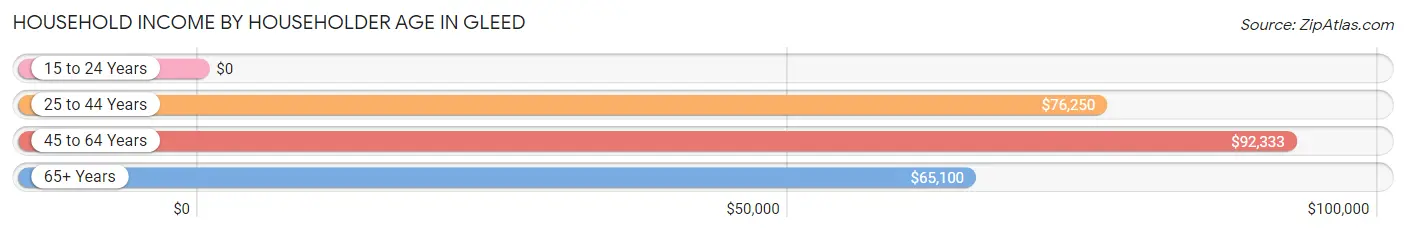
Household Income by Householder Age in Gleed
The median household income in Gleed is $76,875, with the highest median household income of $92,333 found in the 45 to 64 years age bracket for the primary householder. A total of 548 households (46.0%) fall into this category. Meanwhile, the 15 to 24 years age bracket for the primary householder has the lowest median household income of $0, with 10 households (0.8%) in this group.
| Income Bracket | # Households | Median Income |
| 15 to 24 Years | 10 (0.8%) | $0 |
| 25 to 44 Years | 327 (27.5%) | $76,250 |
| 45 to 64 Years | 548 (46.0%) | $92,333 |
| 65+ Years | 306 (25.7%) | $65,100 |
| Total | 1,191 (100.0%) | $76,875 |
Poverty in Gleed
Income Below Poverty by Sex and Age in Gleed
With 9.5% poverty level for males and 7.3% for females among the residents of Gleed, 16 and 17 year old males and 15 year old females are the most vulnerable to poverty, with 20 males (51.3%) and 61 females (85.9%) in their respective age groups living below the poverty level.
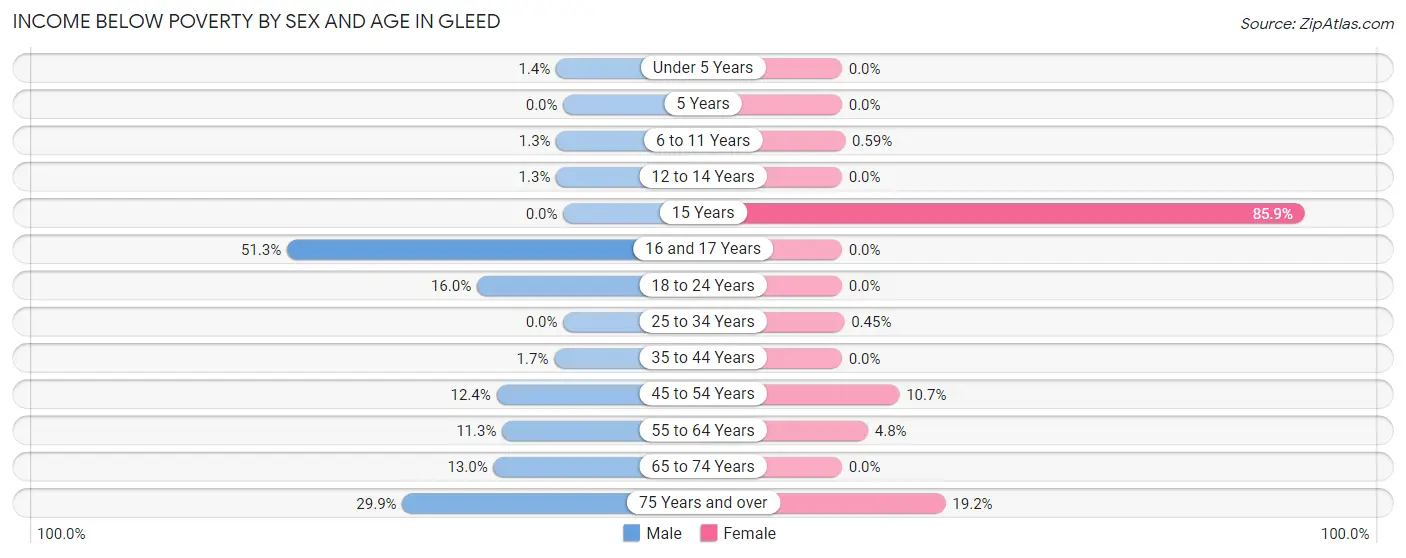
| Age Bracket | Male | Female |
| Under 5 Years | 2 (1.3%) | 0 (0.0%) |
| 5 Years | 0 (0.0%) | 0 (0.0%) |
| 6 to 11 Years | 2 (1.3%) | 1 (0.6%) |
| 12 to 14 Years | 1 (1.3%) | 0 (0.0%) |
| 15 Years | 0 (0.0%) | 61 (85.9%) |
| 16 and 17 Years | 20 (51.3%) | 0 (0.0%) |
| 18 to 24 Years | 21 (16.0%) | 0 (0.0%) |
| 25 to 34 Years | 0 (0.0%) | 1 (0.4%) |
| 35 to 44 Years | 3 (1.7%) | 0 (0.0%) |
| 45 to 54 Years | 30 (12.4%) | 21 (10.7%) |
| 55 to 64 Years | 33 (11.3%) | 9 (4.8%) |
| 65 to 74 Years | 24 (13.0%) | 0 (0.0%) |
| 75 Years and over | 23 (29.9%) | 20 (19.2%) |
| Total | 159 (9.5%) | 113 (7.3%) |
Income Above Poverty by Sex and Age in Gleed
According to the poverty statistics in Gleed, males aged 15 years and females aged under 5 years are the age groups that are most secure financially, with 100.0% of males and 100.0% of females in these age groups living above the poverty line.
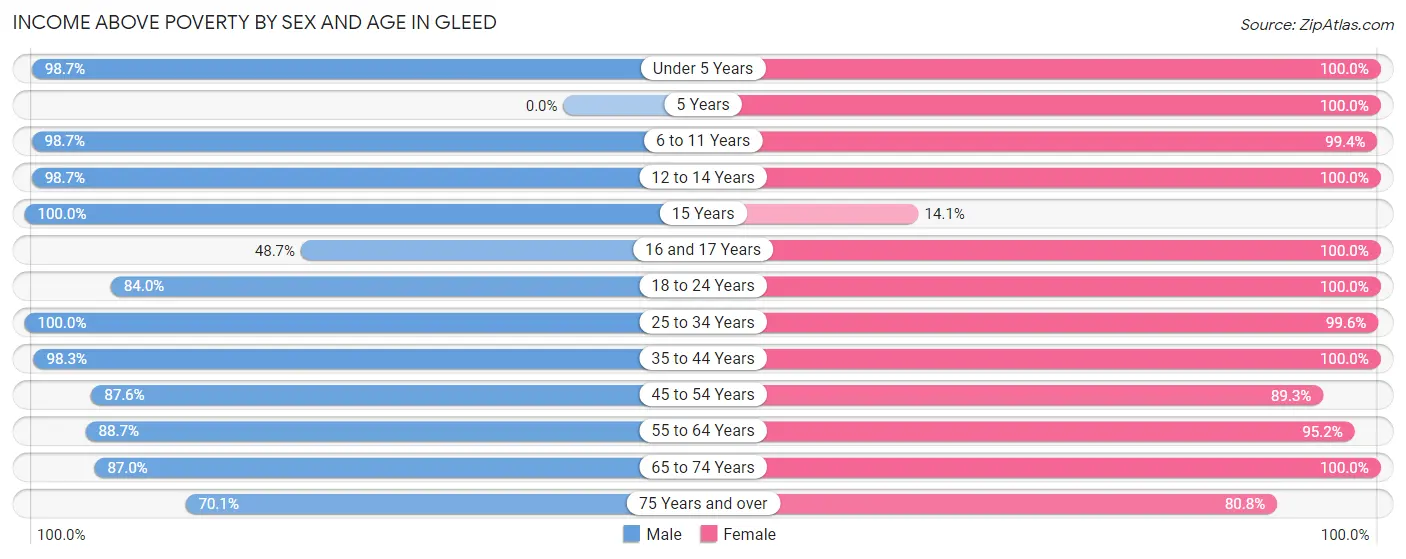
| Age Bracket | Male | Female |
| Under 5 Years | 146 (98.7%) | 84 (100.0%) |
| 5 Years | 0 (0.0%) | 29 (100.0%) |
| 6 to 11 Years | 153 (98.7%) | 168 (99.4%) |
| 12 to 14 Years | 75 (98.7%) | 45 (100.0%) |
| 15 Years | 4 (100.0%) | 10 (14.1%) |
| 16 and 17 Years | 19 (48.7%) | 40 (100.0%) |
| 18 to 24 Years | 110 (84.0%) | 33 (100.0%) |
| 25 to 34 Years | 153 (100.0%) | 223 (99.6%) |
| 35 to 44 Years | 175 (98.3%) | 197 (100.0%) |
| 45 to 54 Years | 212 (87.6%) | 176 (89.3%) |
| 55 to 64 Years | 258 (88.7%) | 177 (95.2%) |
| 65 to 74 Years | 161 (87.0%) | 168 (100.0%) |
| 75 Years and over | 54 (70.1%) | 84 (80.8%) |
| Total | 1,520 (90.5%) | 1,434 (92.7%) |
Income Below Poverty Among Married-Couple Families in Gleed
The poverty statistics for married-couple families in Gleed show that 1.1% or 9 of the total 798 families live below the poverty line. Families with 1 or 2 children have the highest poverty rate of 4.5%, comprising of 9 families. On the other hand, families with no children have the lowest poverty rate of 0.0%, which includes 0 families.
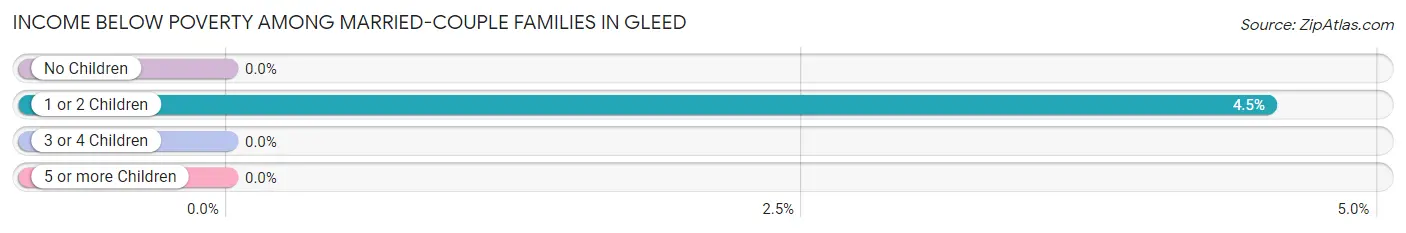
| Children | Above Poverty | Below Poverty |
| No Children | 477 (100.0%) | 0 (0.0%) |
| 1 or 2 Children | 190 (95.5%) | 9 (4.5%) |
| 3 or 4 Children | 122 (100.0%) | 0 (0.0%) |
| 5 or more Children | 0 (0.0%) | 0 (0.0%) |
| Total | 789 (98.9%) | 9 (1.1%) |
Income Below Poverty Among Single-Parent Households in Gleed
According to the poverty data in Gleed, 100.0% or 12 single-father households and 14.2% or 22 single-mother households are living below the poverty line. Among single-father households, those with no children have the highest poverty rate, with 12 households (100.0%) experiencing poverty. Likewise, among single-mother households, those with 5 or more children have the highest poverty rate, with 1 households (100.0%) falling below the poverty line.
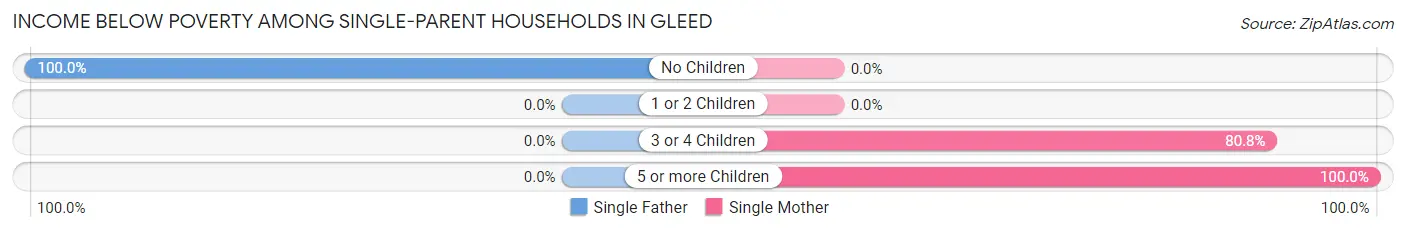
| Children | Single Father | Single Mother |
| No Children | 12 (100.0%) | 0 (0.0%) |
| 1 or 2 Children | 0 (0.0%) | 0 (0.0%) |
| 3 or 4 Children | 0 (0.0%) | 21 (80.8%) |
| 5 or more Children | 0 (0.0%) | 1 (100.0%) |
| Total | 12 (100.0%) | 22 (14.2%) |
Income Below Poverty Among Married-Couple vs Single-Parent Households in Gleed
The poverty data for Gleed shows that 9 of the married-couple family households (1.1%) and 34 of the single-parent households (20.4%) are living below the poverty level. Within the married-couple family households, those with 1 or 2 children have the highest poverty rate, with 9 households (4.5%) falling below the poverty line. Among the single-parent households, those with no children have the highest poverty rate, with 12 household (100.0%) living below poverty.
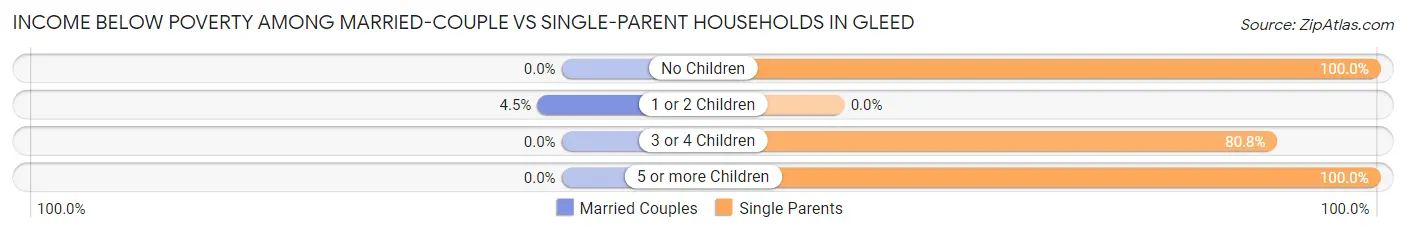
| Children | Married-Couple Families | Single-Parent Households |
| No Children | 0 (0.0%) | 12 (100.0%) |
| 1 or 2 Children | 9 (4.5%) | 0 (0.0%) |
| 3 or 4 Children | 0 (0.0%) | 21 (80.8%) |
| 5 or more Children | 0 (0.0%) | 1 (100.0%) |
| Total | 9 (1.1%) | 34 (20.4%) |
Race in Gleed
The most populous races in Gleed are White / Caucasian (2,692 | 83.3%), Hispanic or Latino (557 | 17.2%), and Some other Race (332 | 10.3%).
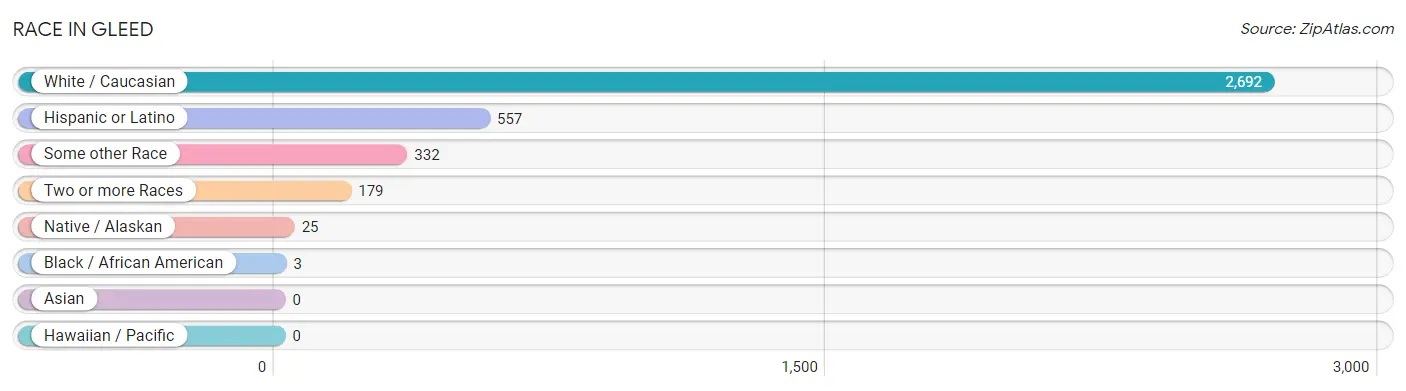
| Race | # Population | % Population |
| Asian | 0 | 0.0% |
| Black / African American | 3 | 0.1% |
| Hawaiian / Pacific | 0 | 0.0% |
| Hispanic or Latino | 557 | 17.2% |
| Native / Alaskan | 25 | 0.8% |
| White / Caucasian | 2,692 | 83.3% |
| Two or more Races | 179 | 5.5% |
| Some other Race | 332 | 10.3% |
| Total | 3,231 | 100.0% |
Ancestry in Gleed
The most populous ancestries reported in Gleed are German (696 | 21.5%), Mexican (500 | 15.5%), Norwegian (465 | 14.4%), English (392 | 12.1%), and American (217 | 6.7%), together accounting for 70.3% of all Gleed residents.
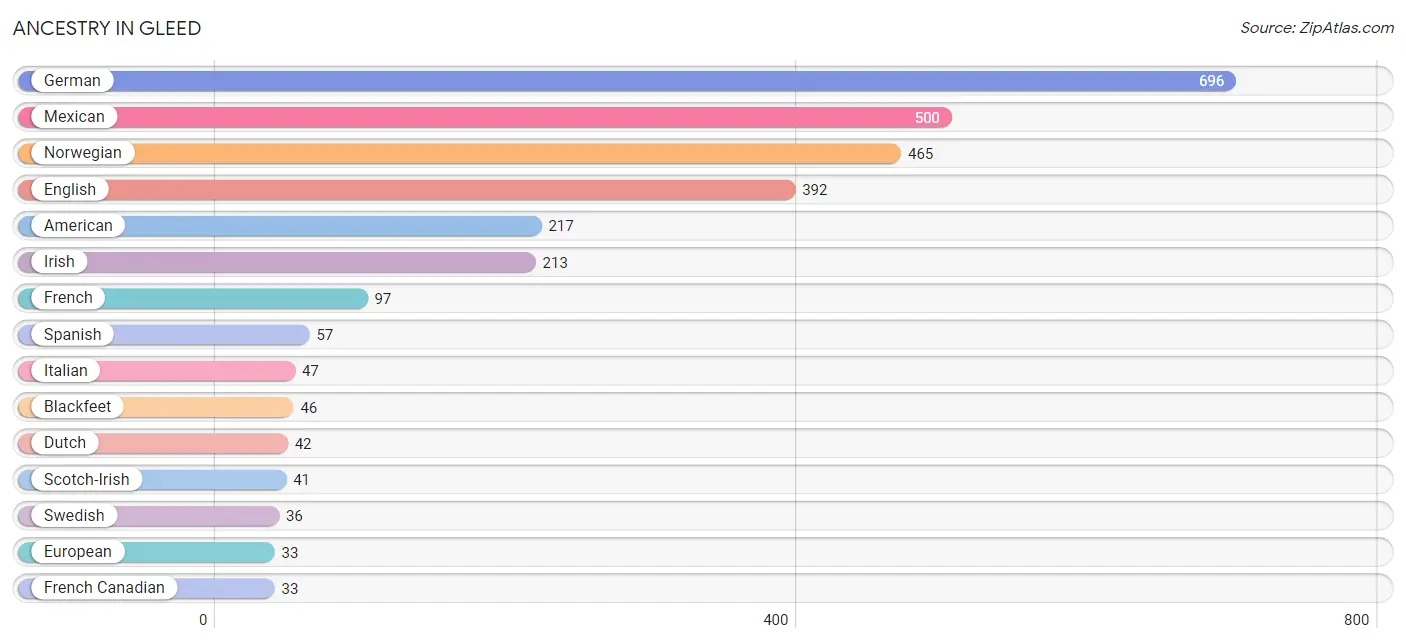
| Ancestry | # Population | % Population |
| American | 217 | 6.7% |
| Basque | 32 | 1.0% |
| Bhutanese | 8 | 0.3% |
| Blackfeet | 46 | 1.4% |
| British | 7 | 0.2% |
| Canadian | 11 | 0.3% |
| Cherokee | 15 | 0.5% |
| Colville | 7 | 0.2% |
| Dutch | 42 | 1.3% |
| English | 392 | 12.1% |
| European | 33 | 1.0% |
| French | 97 | 3.0% |
| French Canadian | 33 | 1.0% |
| German | 696 | 21.5% |
| Irish | 213 | 6.6% |
| Iroquois | 9 | 0.3% |
| Italian | 47 | 1.5% |
| Lithuanian | 24 | 0.7% |
| Mexican | 500 | 15.5% |
| Northern European | 26 | 0.8% |
| Norwegian | 465 | 14.4% |
| Paiute | 9 | 0.3% |
| Polish | 10 | 0.3% |
| Scandinavian | 23 | 0.7% |
| Scotch-Irish | 41 | 1.3% |
| Scottish | 25 | 0.8% |
| Spanish | 57 | 1.8% |
| Swedish | 36 | 1.1% | View All 28 Rows |
Immigrants in Gleed
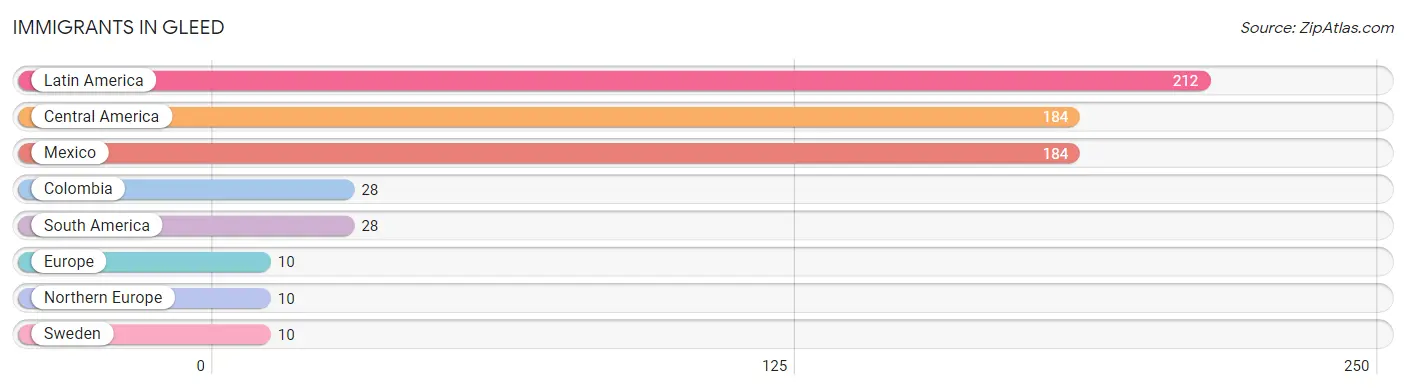
The most numerous immigrant groups reported in Gleed came from Latin America (212 | 6.6%), Central America (184 | 5.7%), Mexico (184 | 5.7%), Colombia (28 | 0.9%), and South America (28 | 0.9%), together accounting for 19.7% of all Gleed residents.
| Immigration Origin | # Population | % Population |
| Central America | 184 | 5.7% |
| Colombia | 28 | 0.9% |
| Europe | 10 | 0.3% |
| Latin America | 212 | 6.6% |
| Mexico | 184 | 5.7% |
| Northern Europe | 10 | 0.3% |
| South America | 28 | 0.9% |
| Sweden | 10 | 0.3% | View All 8 Rows |
Sex and Age in Gleed
Sex and Age in Gleed
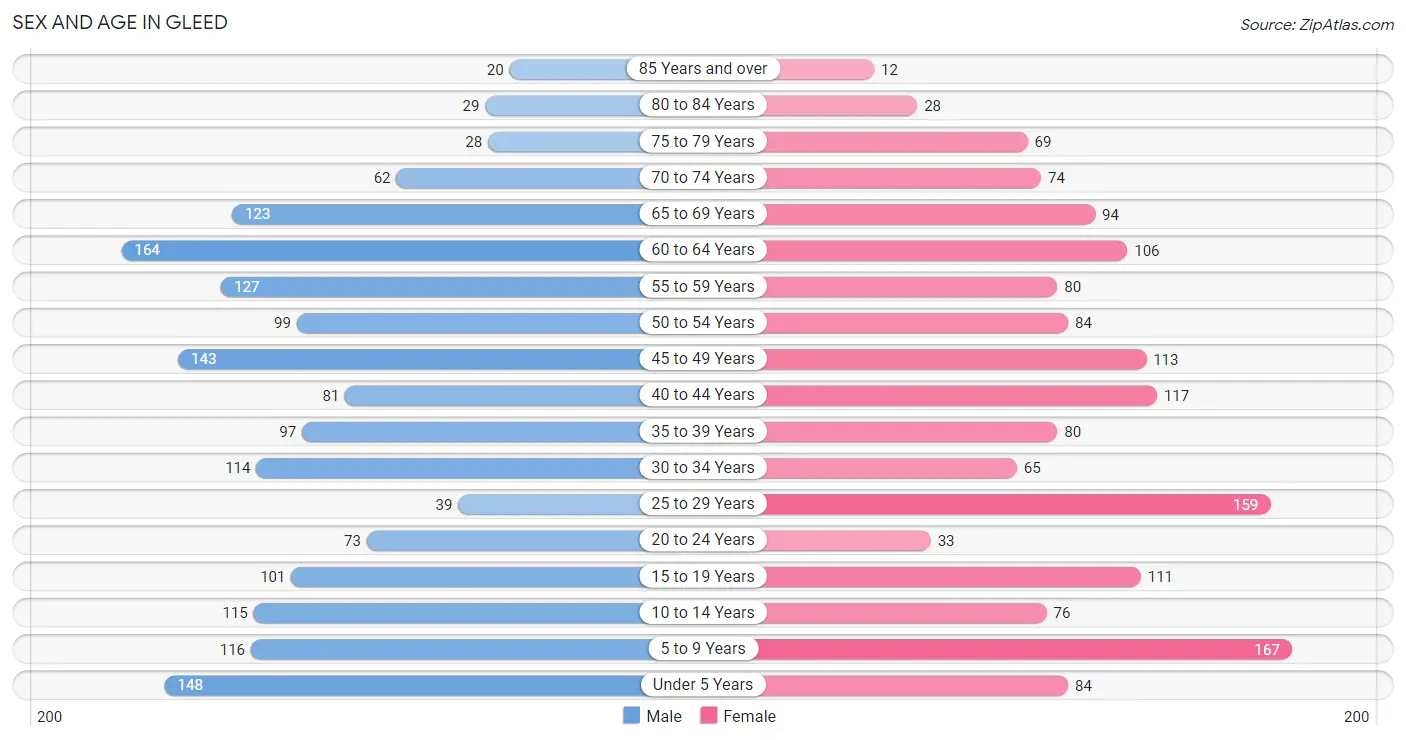
The most populous age groups in Gleed are 60 to 64 Years (164 | 9.8%) for men and 5 to 9 Years (167 | 10.8%) for women.
| Age Bracket | Male | Female |
| Under 5 Years | 148 (8.8%) | 84 (5.4%) |
| 5 to 9 Years | 116 (6.9%) | 167 (10.8%) |
| 10 to 14 Years | 115 (6.9%) | 76 (4.9%) |
| 15 to 19 Years | 101 (6.0%) | 111 (7.1%) |
| 20 to 24 Years | 73 (4.3%) | 33 (2.1%) |
| 25 to 29 Years | 39 (2.3%) | 159 (10.2%) |
| 30 to 34 Years | 114 (6.8%) | 65 (4.2%) |
| 35 to 39 Years | 97 (5.8%) | 80 (5.1%) |
| 40 to 44 Years | 81 (4.8%) | 117 (7.5%) |
| 45 to 49 Years | 143 (8.5%) | 113 (7.3%) |
| 50 to 54 Years | 99 (5.9%) | 84 (5.4%) |
| 55 to 59 Years | 127 (7.6%) | 80 (5.1%) |
| 60 to 64 Years | 164 (9.8%) | 106 (6.8%) |
| 65 to 69 Years | 123 (7.3%) | 94 (6.1%) |
| 70 to 74 Years | 62 (3.7%) | 74 (4.8%) |
| 75 to 79 Years | 28 (1.7%) | 69 (4.4%) |
| 80 to 84 Years | 29 (1.7%) | 28 (1.8%) |
| 85 Years and over | 20 (1.2%) | 12 (0.8%) |
| Total | 1,679 (100.0%) | 1,552 (100.0%) |
Families and Households in Gleed
Median Family Size in Gleed
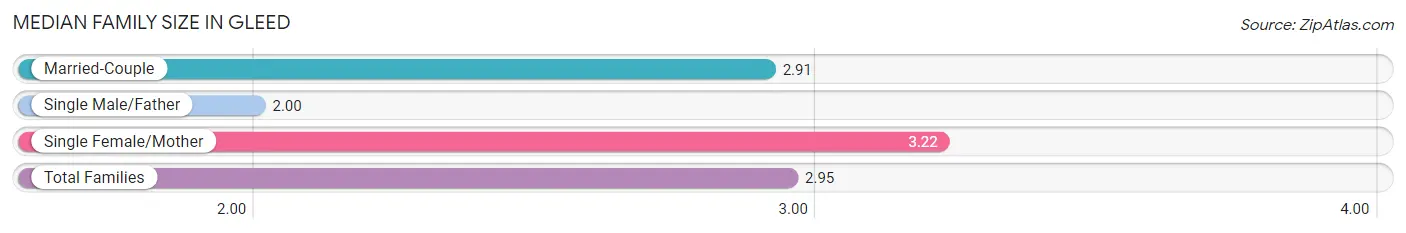
The median family size in Gleed is 2.95 persons per family, with single female/mother families (155 | 16.1%) accounting for the largest median family size of 3.22 persons per family. On the other hand, single male/father families (12 | 1.2%) represent the smallest median family size with 2.00 persons per family.
| Family Type | # Families | Family Size |
| Married-Couple | 798 (82.7%) | 2.91 |
| Single Male/Father | 12 (1.2%) | 2.00 |
| Single Female/Mother | 155 (16.1%) | 3.22 |
| Total Families | 965 (100.0%) | 2.95 |
Median Household Size in Gleed
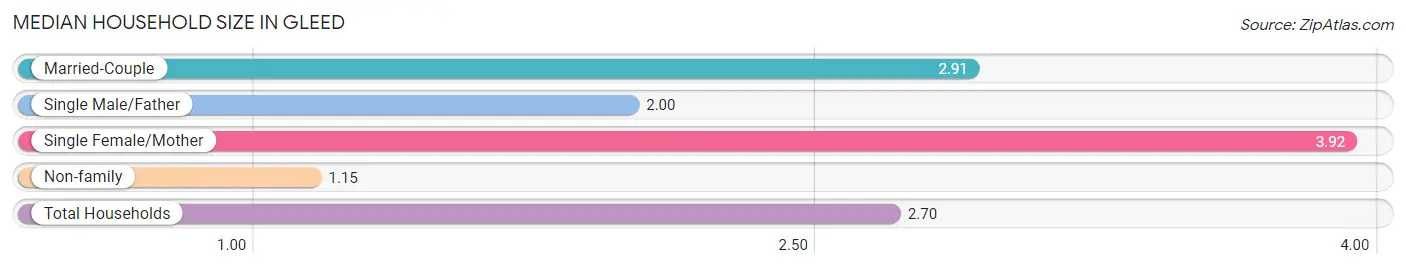
The median household size in Gleed is 2.70 persons per household, with single female/mother households (155 | 13.0%) accounting for the largest median household size of 3.92 persons per household. non-family households (226 | 19.0%) represent the smallest median household size with 1.15 persons per household.
| Household Type | # Households | Household Size |
| Married-Couple | 798 (67.0%) | 2.91 |
| Single Male/Father | 12 (1.0%) | 2.00 |
| Single Female/Mother | 155 (13.0%) | 3.92 |
| Non-family | 226 (19.0%) | 1.15 |
| Total Households | 1,191 (100.0%) | 2.70 |
Household Size by Marriage Status in Gleed
Out of a total of 1,191 households in Gleed, 965 (81.0%) are family households, while 226 (19.0%) are nonfamily households. The most numerous type of family households are 2-person households, comprising 428, and the most common type of nonfamily households are 1-person households, comprising 188.
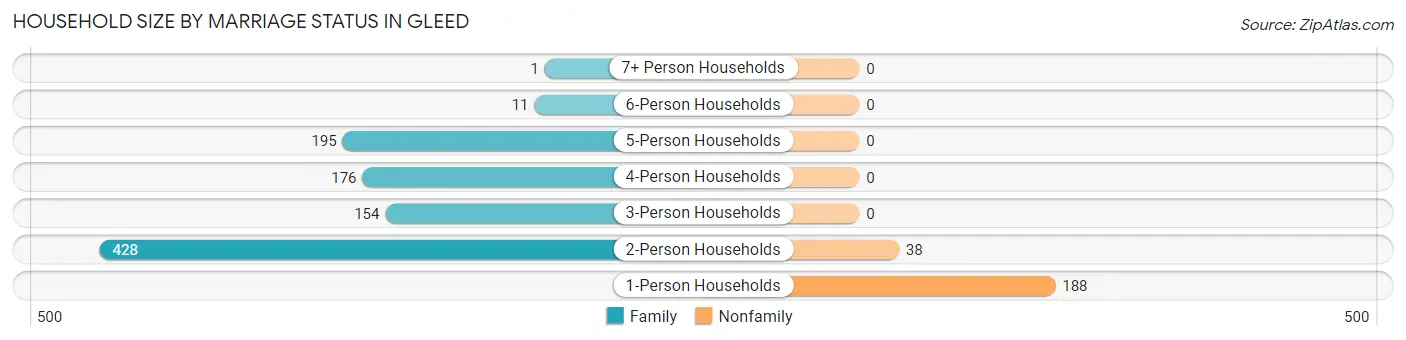
| Household Size | Family Households | Nonfamily Households |
| 1-Person Households | - | 188 (15.8%) |
| 2-Person Households | 428 (35.9%) | 38 (3.2%) |
| 3-Person Households | 154 (12.9%) | 0 (0.0%) |
| 4-Person Households | 176 (14.8%) | 0 (0.0%) |
| 5-Person Households | 195 (16.4%) | 0 (0.0%) |
| 6-Person Households | 11 (0.9%) | 0 (0.0%) |
| 7+ Person Households | 1 (0.1%) | 0 (0.0%) |
| Total | 965 (81.0%) | 226 (19.0%) |
Female Fertility in Gleed
Fertility by Age in Gleed
Average fertility rate in Gleed is 119.0 births per 1,000 women. Women in the age bracket of 20 to 34 years have the highest fertility rate with 319.0 births per 1,000 women. Women in the age bracket of 20 to 34 years acount for 100.0% of all women with births.
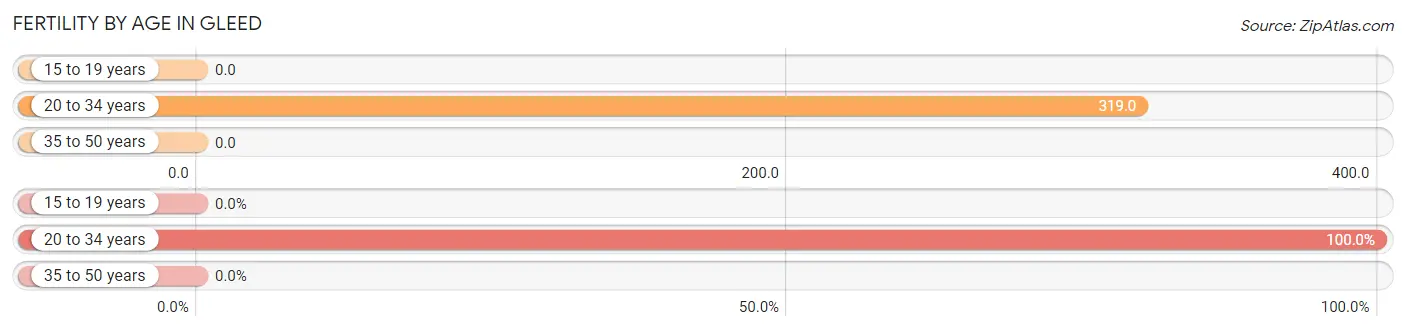
| Age Bracket | Women with Births | Births / 1,000 Women |
| 15 to 19 years | 0 (0.0%) | 0.0 |
| 20 to 34 years | 82 (100.0%) | 319.0 |
| 35 to 50 years | 0 (0.0%) | 0.0 |
| Total | 82 (100.0%) | 119.0 |
Fertility by Age by Marriage Status in Gleed
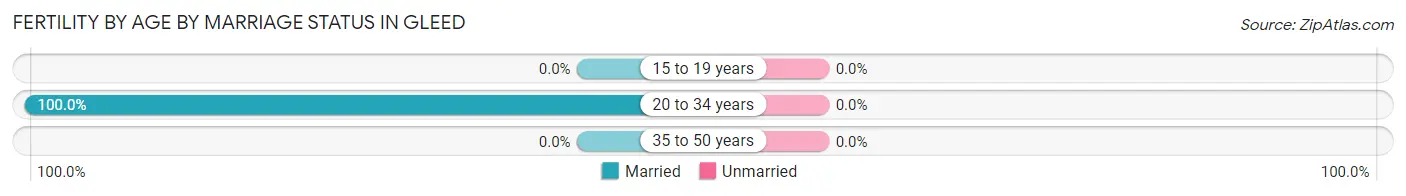
| Age Bracket | Married | Unmarried |
| 15 to 19 years | 0 (0.0%) | 0 (0.0%) |
| 20 to 34 years | 82 (100.0%) | 0 (0.0%) |
| 35 to 50 years | 0 (0.0%) | 0 (0.0%) |
| Total | 82 (100.0%) | 0 (0.0%) |
Fertility by Education in Gleed
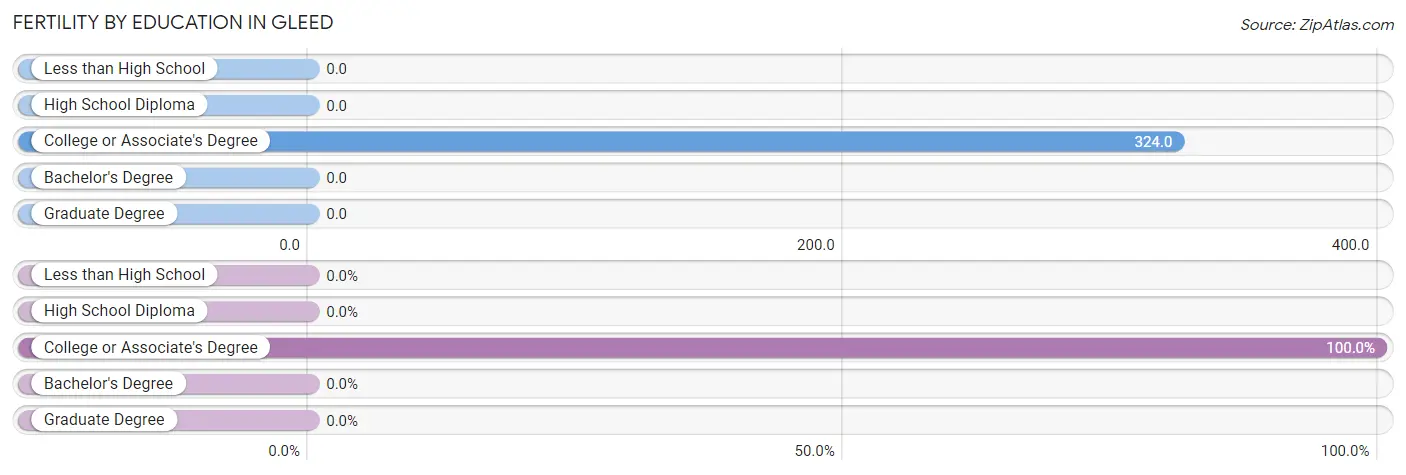
| Educational Attainment | Women with Births | Births / 1,000 Women |
| Less than High School | 0 (0.0%) | 0.0 |
| High School Diploma | 0 (0.0%) | 0.0 |
| College or Associate's Degree | 82 (100.0%) | 324.0 |
| Bachelor's Degree | 0 (0.0%) | 0.0 |
| Graduate Degree | 0 (0.0%) | 0.0 |
| Total | 82 (100.0%) | 119.0 |
Fertility by Education by Marriage Status in Gleed
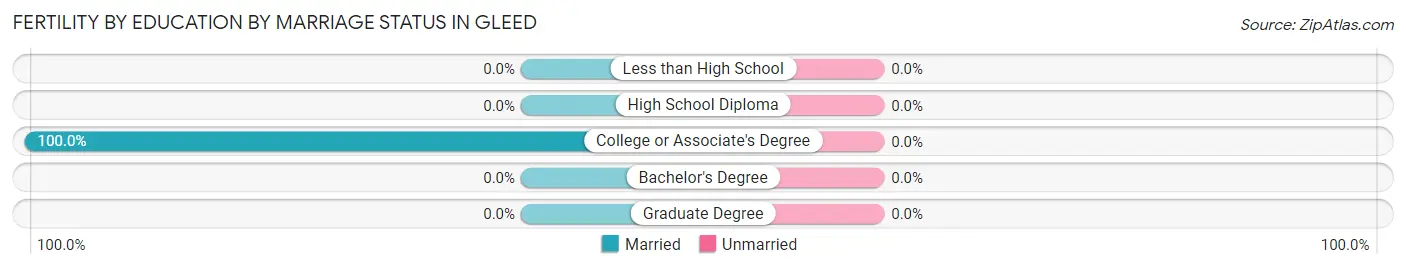
| Educational Attainment | Married | Unmarried |
| Less than High School | 0 (0.0%) | 0 (0.0%) |
| High School Diploma | 0 (0.0%) | 0 (0.0%) |
| College or Associate's Degree | 82 (100.0%) | 0 (0.0%) |
| Bachelor's Degree | 0 (0.0%) | 0 (0.0%) |
| Graduate Degree | 0 (0.0%) | 0 (0.0%) |
| Total | 82 (100.0%) | 0 (0.0%) |
Employment Characteristics in Gleed
Employment by Class of Employer in Gleed
Among the 1,382 employed individuals in Gleed, private company employees (776 | 56.1%), local government employees (165 | 11.9%), and state government employees (142 | 10.3%) make up the most common classes of employment.
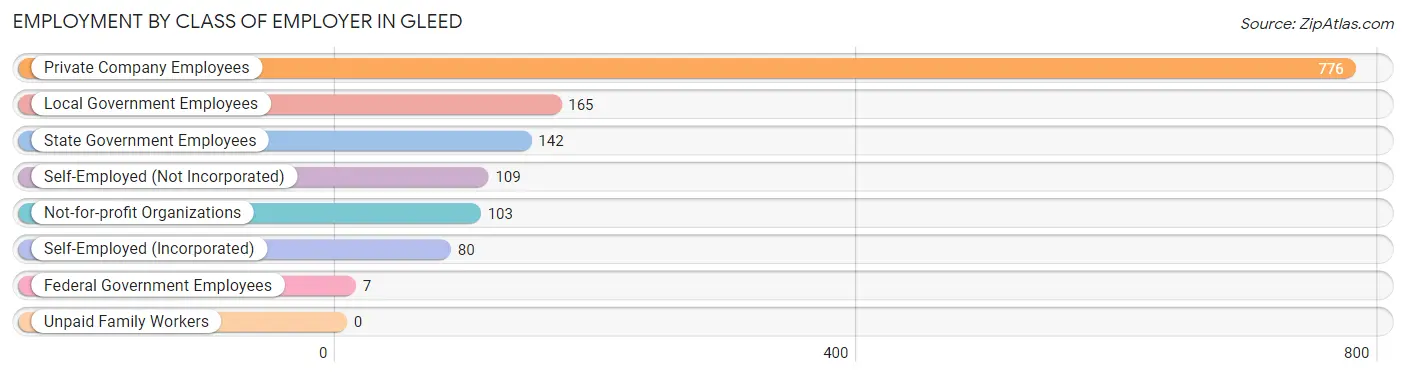
| Employer Class | # Employees | % Employees |
| Private Company Employees | 776 | 56.1% |
| Self-Employed (Incorporated) | 80 | 5.8% |
| Self-Employed (Not Incorporated) | 109 | 7.9% |
| Not-for-profit Organizations | 103 | 7.4% |
| Local Government Employees | 165 | 11.9% |
| State Government Employees | 142 | 10.3% |
| Federal Government Employees | 7 | 0.5% |
| Unpaid Family Workers | 0 | 0.0% |
| Total | 1,382 | 100.0% |
Employment Status by Age in Gleed
According to the labor force statistics for Gleed, out of the total population over 16 years of age (2,450), 63.4% or 1,553 individuals are in the labor force, with 5.3% or 82 of them unemployed. The age group with the highest labor force participation rate is 25 to 29 years, with 96.0% or 190 individuals in the labor force. Within the labor force, the 35 to 44 years age range has the highest percentage of unemployed individuals, with 18.1% or 53 of them being unemployed.
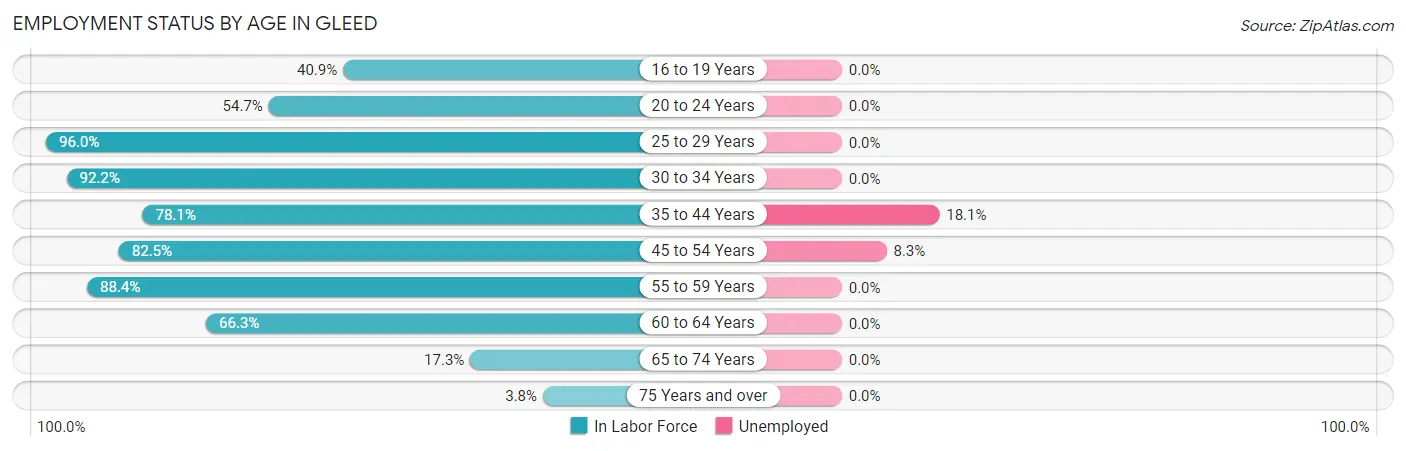
| Age Bracket | In Labor Force | Unemployed |
| 16 to 19 Years | 56 (40.9%) | 0 (0.0%) |
| 20 to 24 Years | 58 (54.7%) | 0 (0.0%) |
| 25 to 29 Years | 190 (96.0%) | 0 (0.0%) |
| 30 to 34 Years | 165 (92.2%) | 0 (0.0%) |
| 35 to 44 Years | 293 (78.1%) | 53 (18.1%) |
| 45 to 54 Years | 362 (82.5%) | 30 (8.3%) |
| 55 to 59 Years | 183 (88.4%) | 0 (0.0%) |
| 60 to 64 Years | 179 (66.3%) | 0 (0.0%) |
| 65 to 74 Years | 61 (17.3%) | 0 (0.0%) |
| 75 Years and over | 7 (3.8%) | 0 (0.0%) |
| Total | 1,553 (63.4%) | 82 (5.3%) |
Employment Status by Educational Attainment in Gleed
According to labor force statistics for Gleed, 82.3% of individuals (1,373) out of the total population between 25 and 64 years of age (1,668) are in the labor force, with 6.0% or 82 of them being unemployed. The group with the highest labor force participation rate are those with the educational attainment of high school diploma, with 89.0% or 564 individuals in the labor force. Within the labor force, individuals with less than high school education have the highest percentage of unemployment, with 37.0% or 57 of them being unemployed.
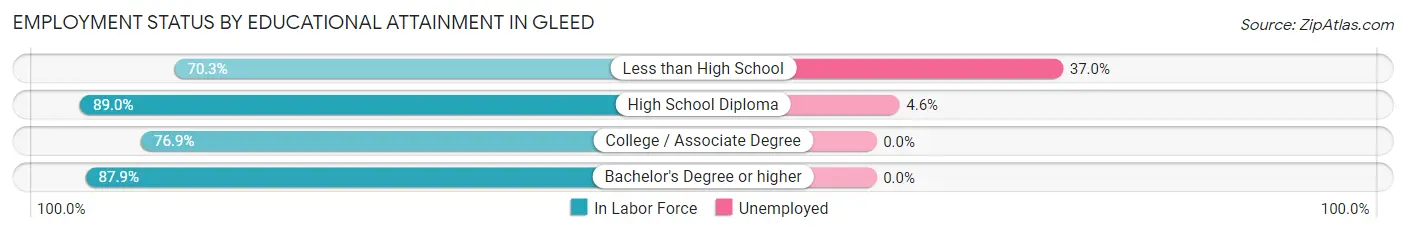
| Educational Attainment | In Labor Force | Unemployed |
| Less than High School | 154 (70.3%) | 81 (37.0%) |
| High School Diploma | 564 (89.0%) | 29 (4.6%) |
| College / Associate Degree | 437 (76.9%) | 0 (0.0%) |
| Bachelor's Degree or higher | 217 (87.9%) | 0 (0.0%) |
| Total | 1,373 (82.3%) | 100 (6.0%) |
Employment Occupations by Sex in Gleed
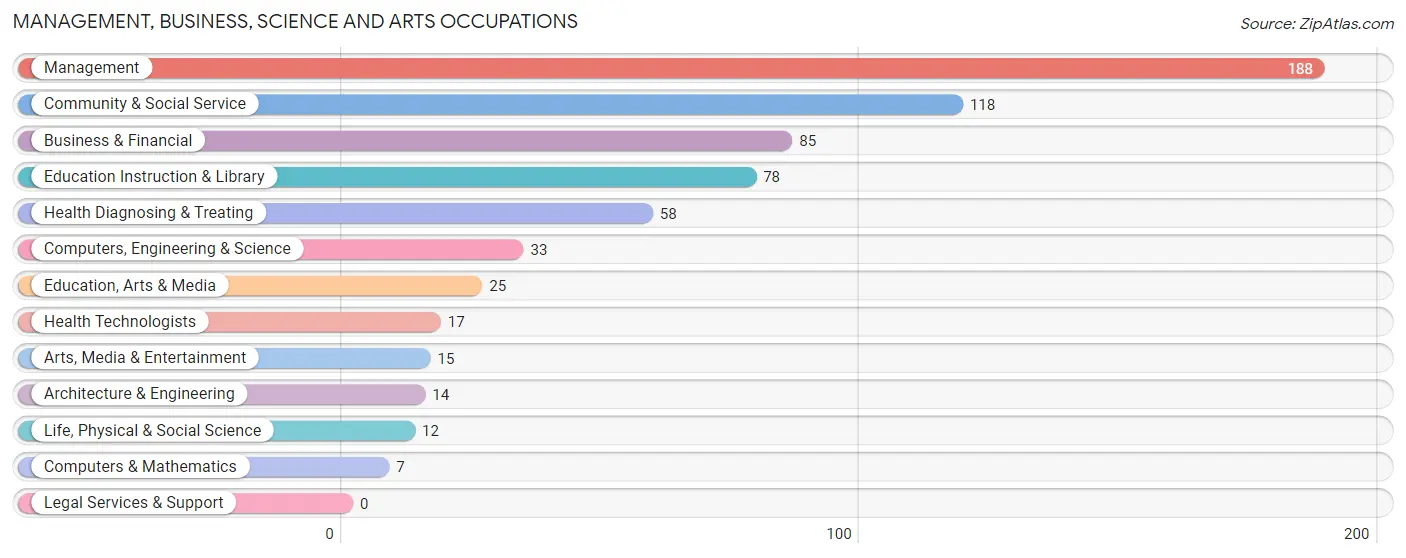
Management, Business, Science and Arts Occupations
The most common Management, Business, Science and Arts occupations in Gleed are Management (188 | 12.8%), Community & Social Service (118 | 8.0%), Business & Financial (85 | 5.8%), Education Instruction & Library (78 | 5.3%), and Health Diagnosing & Treating (58 | 3.9%).
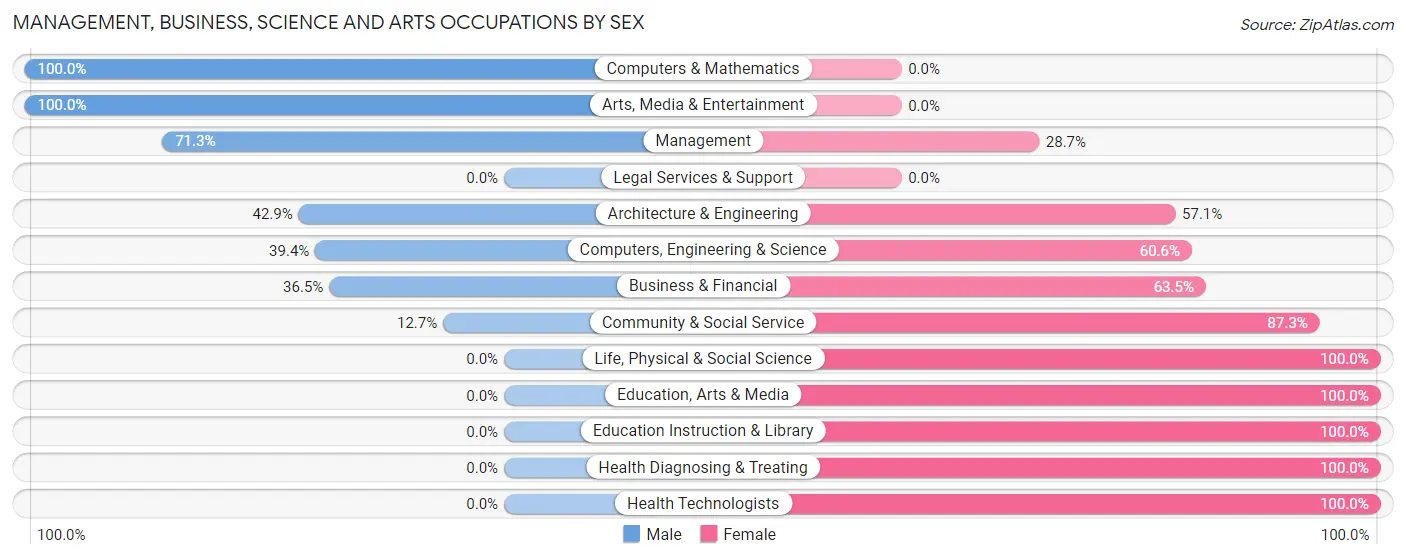
Management, Business, Science and Arts Occupations by Sex
Within the Management, Business, Science and Arts occupations in Gleed, the most male-oriented occupations are Computers & Mathematics (100.0%), Arts, Media & Entertainment (100.0%), and Management (71.3%), while the most female-oriented occupations are Life, Physical & Social Science (100.0%), Education, Arts & Media (100.0%), and Education Instruction & Library (100.0%).
| Occupation | Male | Female |
| Management | 134 (71.3%) | 54 (28.7%) |
| Business & Financial | 31 (36.5%) | 54 (63.5%) |
| Computers, Engineering & Science | 13 (39.4%) | 20 (60.6%) |
| Computers & Mathematics | 7 (100.0%) | 0 (0.0%) |
| Architecture & Engineering | 6 (42.9%) | 8 (57.1%) |
| Life, Physical & Social Science | 0 (0.0%) | 12 (100.0%) |
| Community & Social Service | 15 (12.7%) | 103 (87.3%) |
| Education, Arts & Media | 0 (0.0%) | 25 (100.0%) |
| Legal Services & Support | 0 (0.0%) | 0 (0.0%) |
| Education Instruction & Library | 0 (0.0%) | 78 (100.0%) |
| Arts, Media & Entertainment | 15 (100.0%) | 0 (0.0%) |
| Health Diagnosing & Treating | 0 (0.0%) | 58 (100.0%) |
| Health Technologists | 0 (0.0%) | 17 (100.0%) |
| Total (Category) | 193 (40.0%) | 289 (60.0%) |
| Total (Overall) | 797 (54.2%) | 674 (45.8%) |
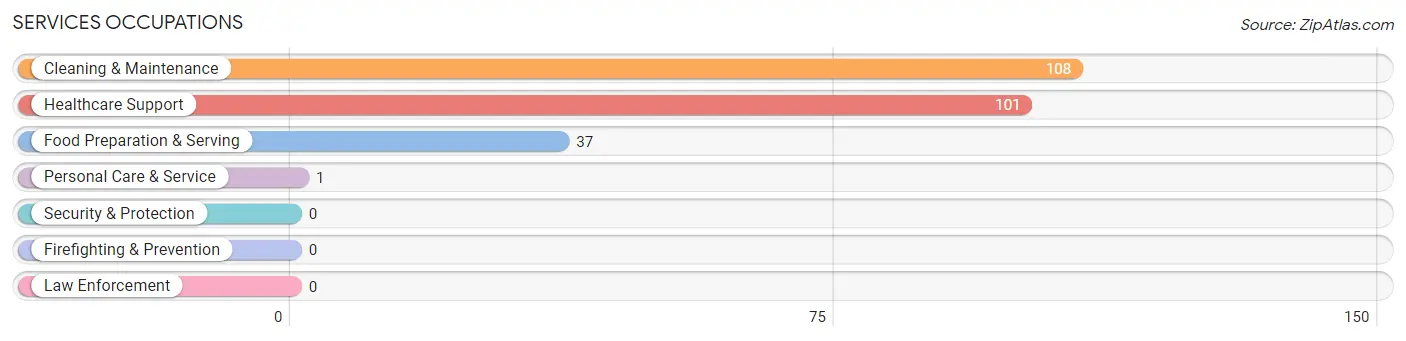
Services Occupations
The most common Services occupations in Gleed are Cleaning & Maintenance (108 | 7.3%), Healthcare Support (101 | 6.9%), Food Preparation & Serving (37 | 2.5%), and Personal Care & Service (1 | 0.1%).
Services Occupations by Sex
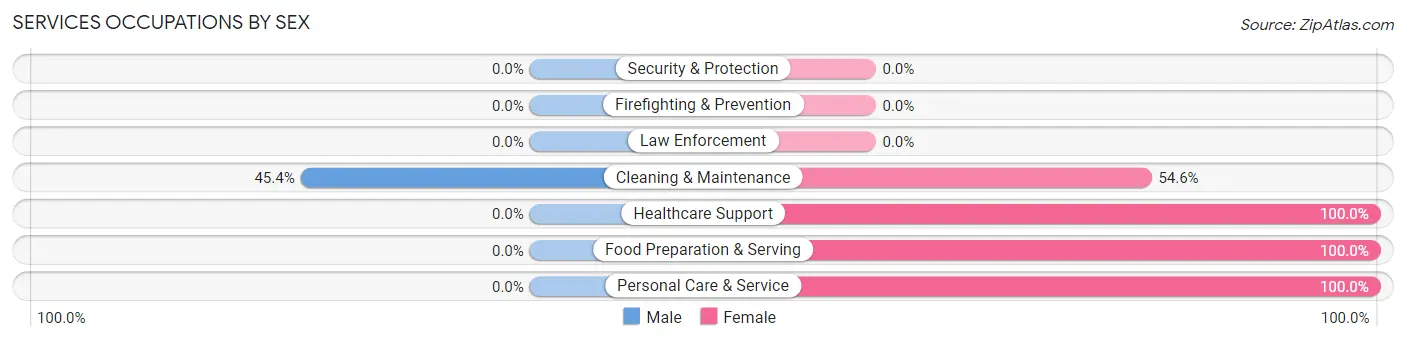
| Occupation | Male | Female |
| Healthcare Support | 0 (0.0%) | 101 (100.0%) |
| Security & Protection | 0 (0.0%) | 0 (0.0%) |
| Firefighting & Prevention | 0 (0.0%) | 0 (0.0%) |
| Law Enforcement | 0 (0.0%) | 0 (0.0%) |
| Food Preparation & Serving | 0 (0.0%) | 37 (100.0%) |
| Cleaning & Maintenance | 49 (45.4%) | 59 (54.6%) |
| Personal Care & Service | 0 (0.0%) | 1 (100.0%) |
| Total (Category) | 49 (19.8%) | 198 (80.2%) |
| Total (Overall) | 797 (54.2%) | 674 (45.8%) |
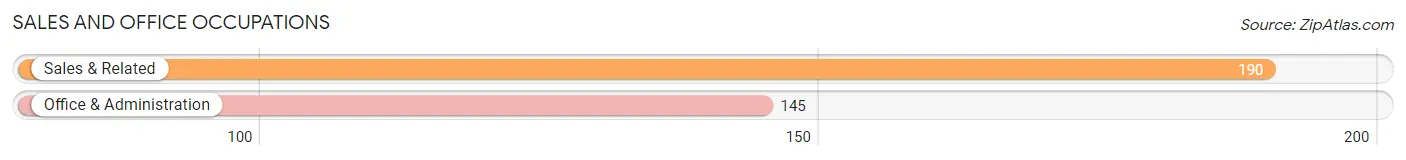
Sales and Office Occupations
The most common Sales and Office occupations in Gleed are Sales & Related (190 | 12.9%), and Office & Administration (145 | 9.9%).
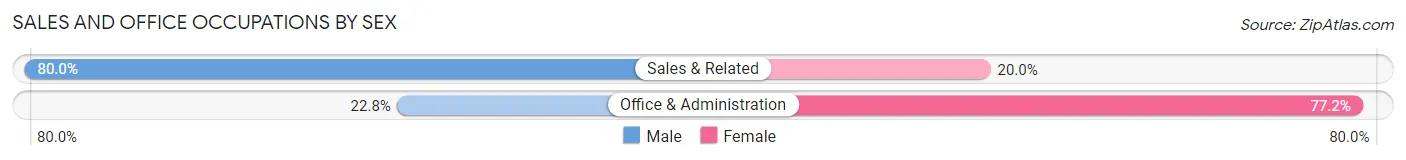
Sales and Office Occupations by Sex
| Occupation | Male | Female |
| Sales & Related | 152 (80.0%) | 38 (20.0%) |
| Office & Administration | 33 (22.8%) | 112 (77.2%) |
| Total (Category) | 185 (55.2%) | 150 (44.8%) |
| Total (Overall) | 797 (54.2%) | 674 (45.8%) |
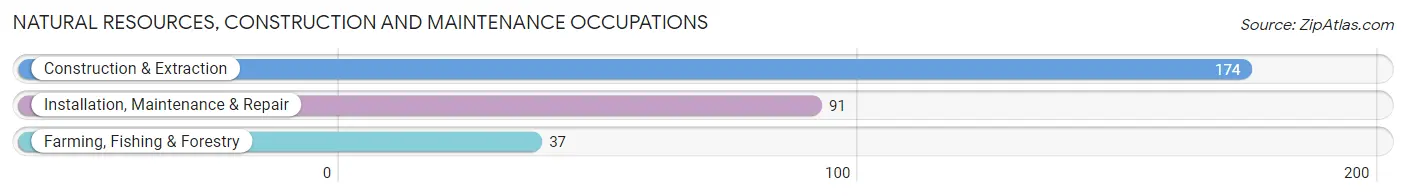
Natural Resources, Construction and Maintenance Occupations
The most common Natural Resources, Construction and Maintenance occupations in Gleed are Construction & Extraction (174 | 11.8%), Installation, Maintenance & Repair (91 | 6.2%), and Farming, Fishing & Forestry (37 | 2.5%).
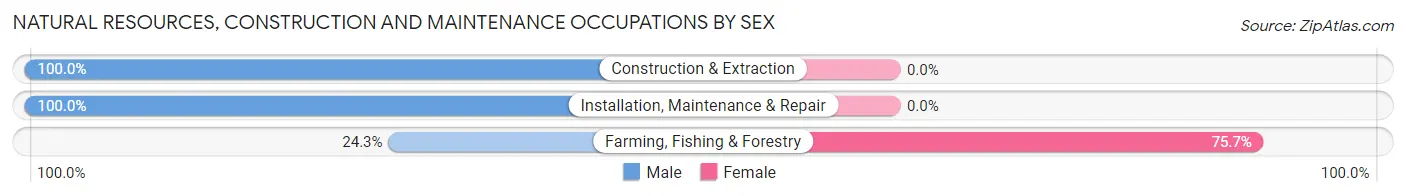
Natural Resources, Construction and Maintenance Occupations by Sex
| Occupation | Male | Female |
| Farming, Fishing & Forestry | 9 (24.3%) | 28 (75.7%) |
| Construction & Extraction | 174 (100.0%) | 0 (0.0%) |
| Installation, Maintenance & Repair | 91 (100.0%) | 0 (0.0%) |
| Total (Category) | 274 (90.7%) | 28 (9.3%) |
| Total (Overall) | 797 (54.2%) | 674 (45.8%) |
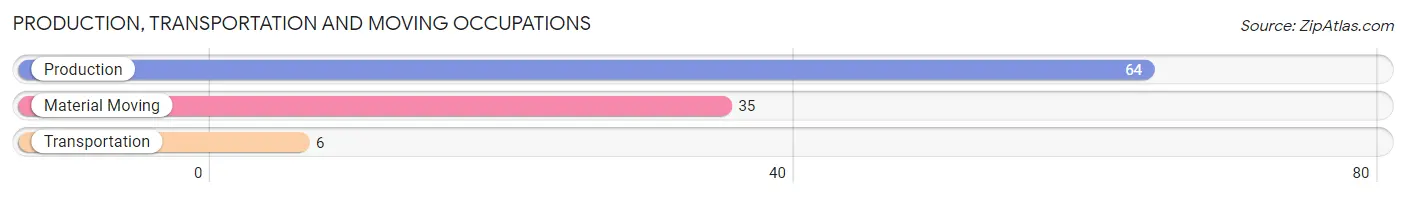
Production, Transportation and Moving Occupations
The most common Production, Transportation and Moving occupations in Gleed are Production (64 | 4.3%), Material Moving (35 | 2.4%), and Transportation (6 | 0.4%).
Production, Transportation and Moving Occupations by Sex
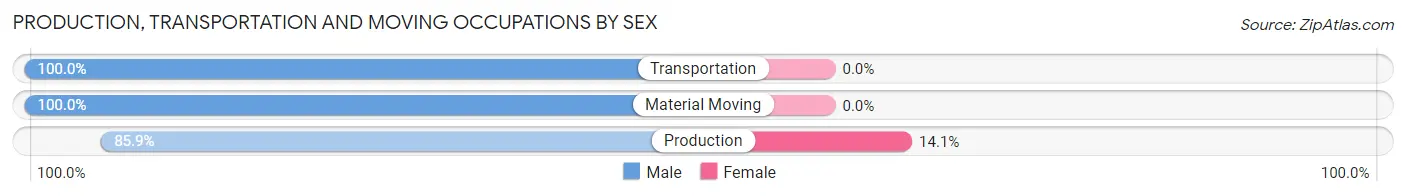
| Occupation | Male | Female |
| Production | 55 (85.9%) | 9 (14.1%) |
| Transportation | 6 (100.0%) | 0 (0.0%) |
| Material Moving | 35 (100.0%) | 0 (0.0%) |
| Total (Category) | 96 (91.4%) | 9 (8.6%) |
| Total (Overall) | 797 (54.2%) | 674 (45.8%) |
Employment Industries by Sex in Gleed
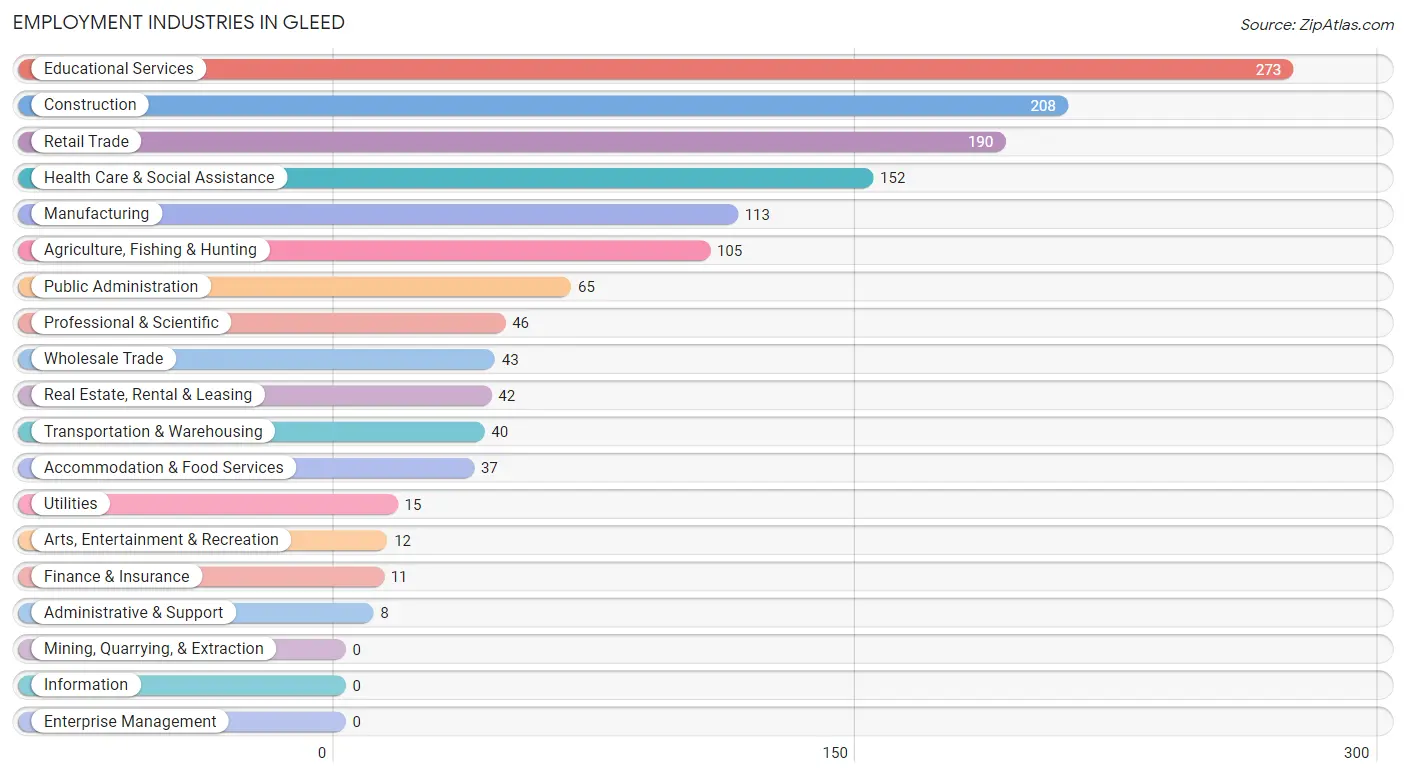
Employment Industries in Gleed
The major employment industries in Gleed include Educational Services (273 | 18.6%), Construction (208 | 14.1%), Retail Trade (190 | 12.9%), Health Care & Social Assistance (152 | 10.3%), and Manufacturing (113 | 7.7%).
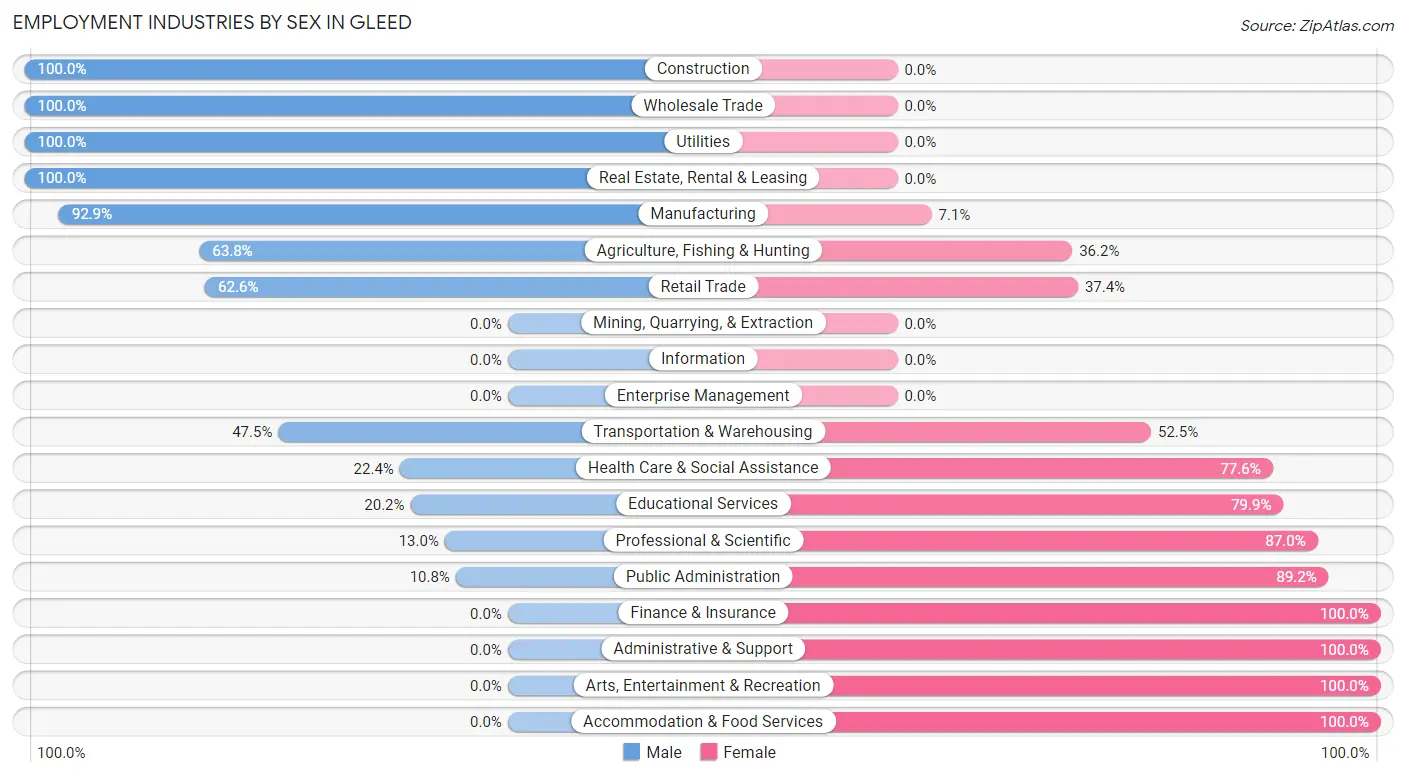
Employment Industries by Sex in Gleed
The Gleed industries that see more men than women are Construction (100.0%), Wholesale Trade (100.0%), and Utilities (100.0%), whereas the industries that tend to have a higher number of women are Finance & Insurance (100.0%), Administrative & Support (100.0%), and Arts, Entertainment & Recreation (100.0%).
| Industry | Male | Female |
| Agriculture, Fishing & Hunting | 67 (63.8%) | 38 (36.2%) |
| Mining, Quarrying, & Extraction | 0 (0.0%) | 0 (0.0%) |
| Construction | 208 (100.0%) | 0 (0.0%) |
| Manufacturing | 105 (92.9%) | 8 (7.1%) |
| Wholesale Trade | 43 (100.0%) | 0 (0.0%) |
| Retail Trade | 119 (62.6%) | 71 (37.4%) |
| Transportation & Warehousing | 19 (47.5%) | 21 (52.5%) |
| Utilities | 15 (100.0%) | 0 (0.0%) |
| Information | 0 (0.0%) | 0 (0.0%) |
| Finance & Insurance | 0 (0.0%) | 11 (100.0%) |
| Real Estate, Rental & Leasing | 42 (100.0%) | 0 (0.0%) |
| Professional & Scientific | 6 (13.0%) | 40 (87.0%) |
| Enterprise Management | 0 (0.0%) | 0 (0.0%) |
| Administrative & Support | 0 (0.0%) | 8 (100.0%) |
| Educational Services | 55 (20.2%) | 218 (79.8%) |
| Health Care & Social Assistance | 34 (22.4%) | 118 (77.6%) |
| Arts, Entertainment & Recreation | 0 (0.0%) | 12 (100.0%) |
| Accommodation & Food Services | 0 (0.0%) | 37 (100.0%) |
| Public Administration | 7 (10.8%) | 58 (89.2%) |
| Total | 797 (54.2%) | 674 (45.8%) |
Education in Gleed
School Enrollment in Gleed
The most common levels of schooling among the 759 students in Gleed are high school (206 | 27.1%), middle school (163 | 21.5%), and elementary school (154 | 20.3%).
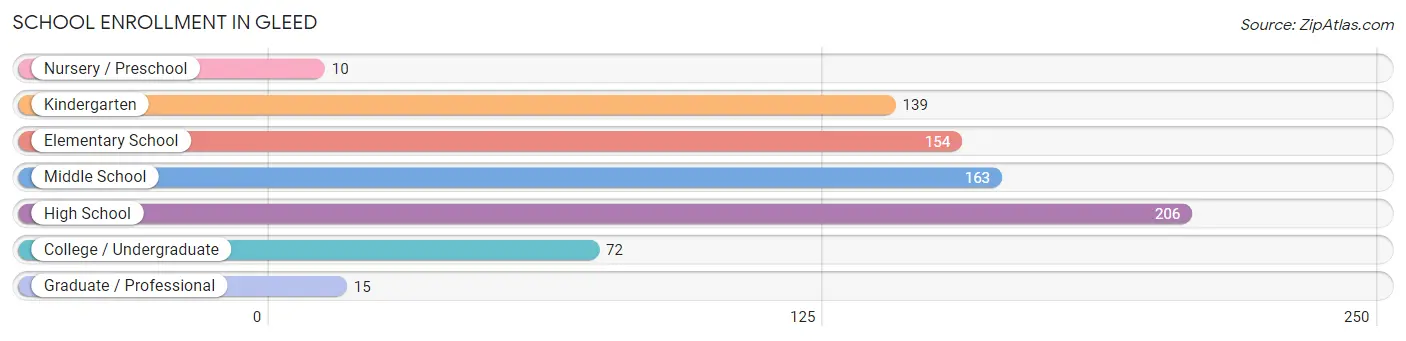
| School Level | # Students | % Students |
| Nursery / Preschool | 10 | 1.3% |
| Kindergarten | 139 | 18.3% |
| Elementary School | 154 | 20.3% |
| Middle School | 163 | 21.5% |
| High School | 206 | 27.1% |
| College / Undergraduate | 72 | 9.5% |
| Graduate / Professional | 15 | 2.0% |
| Total | 759 | 100.0% |
School Enrollment by Age by Funding Source in Gleed
Out of a total of 759 students who are enrolled in schools in Gleed, 84 (11.1%) attend a private institution, while the remaining 675 (88.9%) are enrolled in public schools. The age group of 10 to 14 year olds has the highest likelihood of being enrolled in private schools, with 56 (29.3% in the age bracket) enrolled. Conversely, the age group of 3 to 4 year olds has the lowest likelihood of being enrolled in a private school, with 10 (100.0% in the age bracket) attending a public institution.
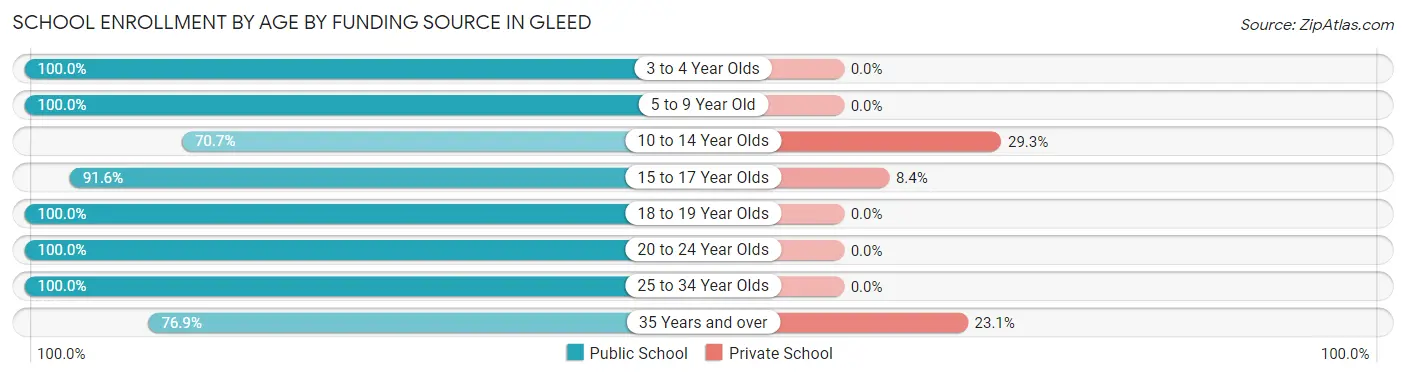
| Age Bracket | Public School | Private School |
| 3 to 4 Year Olds | 10 (100.0%) | 0 (0.0%) |
| 5 to 9 Year Old | 283 (100.0%) | 0 (0.0%) |
| 10 to 14 Year Olds | 135 (70.7%) | 56 (29.3%) |
| 15 to 17 Year Olds | 141 (91.6%) | 13 (8.4%) |
| 18 to 19 Year Olds | 27 (100.0%) | 0 (0.0%) |
| 20 to 24 Year Olds | 27 (100.0%) | 0 (0.0%) |
| 25 to 34 Year Olds | 2 (100.0%) | 0 (0.0%) |
| 35 Years and over | 50 (76.9%) | 15 (23.1%) |
| Total | 675 (88.9%) | 84 (11.1%) |
Educational Attainment by Field of Study in Gleed
Education (108 | 28.9%), business (58 | 15.5%), science & technology (42 | 11.2%), liberal arts & history (41 | 11.0%), and arts & humanities (30 | 8.0%) are the most common fields of study among 374 individuals in Gleed who have obtained a bachelor's degree or higher.
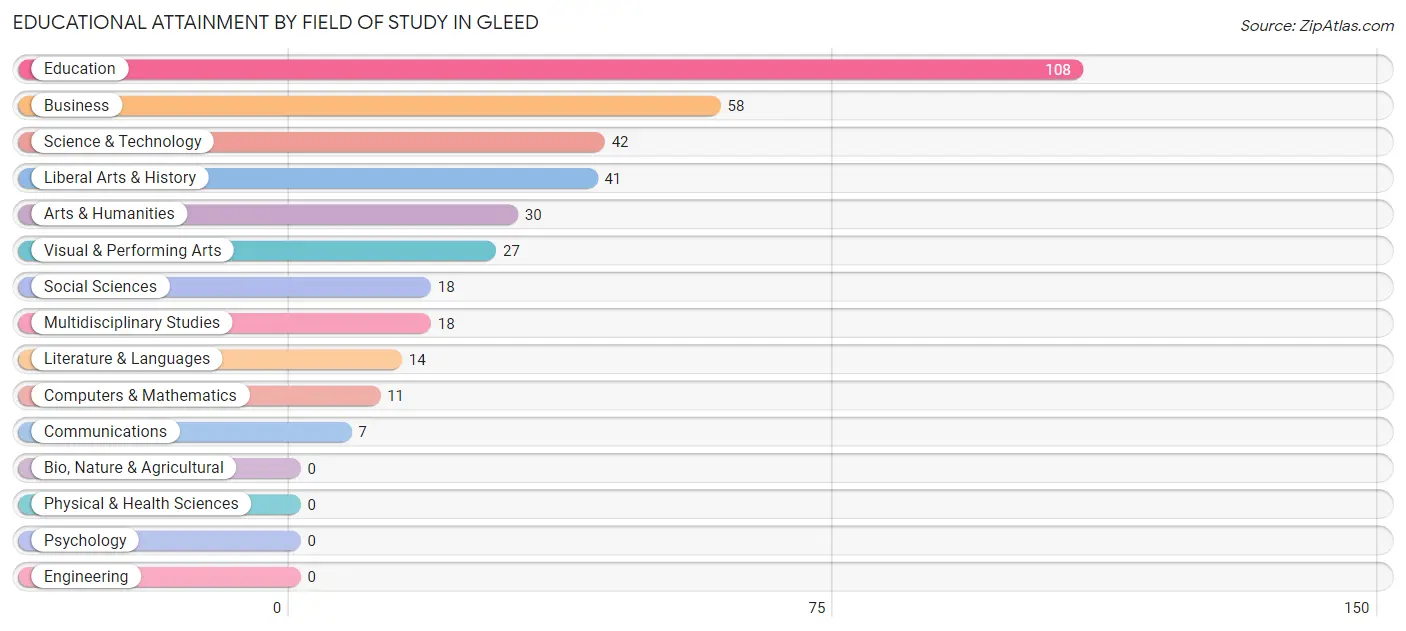
| Field of Study | # Graduates | % Graduates |
| Computers & Mathematics | 11 | 2.9% |
| Bio, Nature & Agricultural | 0 | 0.0% |
| Physical & Health Sciences | 0 | 0.0% |
| Psychology | 0 | 0.0% |
| Social Sciences | 18 | 4.8% |
| Engineering | 0 | 0.0% |
| Multidisciplinary Studies | 18 | 4.8% |
| Science & Technology | 42 | 11.2% |
| Business | 58 | 15.5% |
| Education | 108 | 28.9% |
| Literature & Languages | 14 | 3.7% |
| Liberal Arts & History | 41 | 11.0% |
| Visual & Performing Arts | 27 | 7.2% |
| Communications | 7 | 1.9% |
| Arts & Humanities | 30 | 8.0% |
| Total | 374 | 100.0% |
Transportation & Commute in Gleed
Vehicle Availability by Sex in Gleed
The most prevalent vehicle ownership categories in Gleed are males with 2 vehicles (416, accounting for 52.2%) and females with 2 vehicles (221, making up 71.1%).
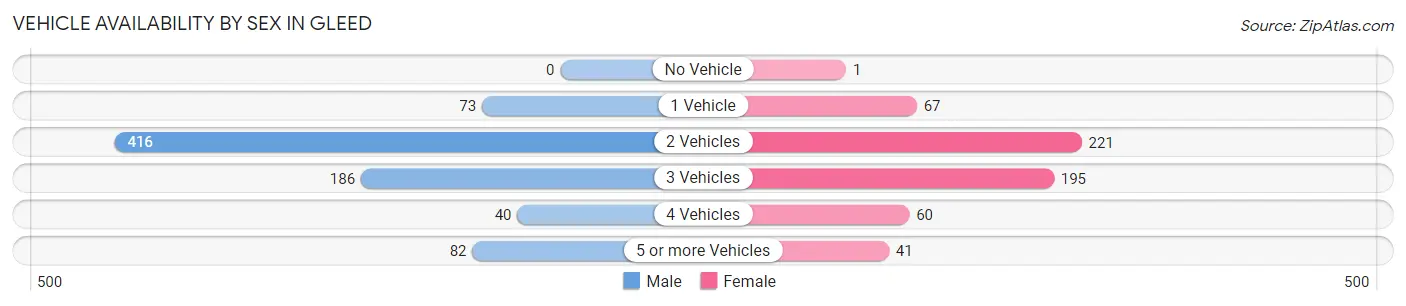
| Vehicles Available | Male | Female |
| No Vehicle | 0 (0.0%) | 1 (0.2%) |
| 1 Vehicle | 73 (9.2%) | 67 (11.5%) |
| 2 Vehicles | 416 (52.2%) | 221 (37.8%) |
| 3 Vehicles | 186 (23.3%) | 195 (33.3%) |
| 4 Vehicles | 40 (5.0%) | 60 (10.3%) |
| 5 or more Vehicles | 82 (10.3%) | 41 (7.0%) |
| Total | 797 (100.0%) | 585 (100.0%) |
Commute Time in Gleed
The most frequently occuring commute durations in Gleed are 15 to 19 minutes (449 commuters, 34.6%), 20 to 24 minutes (303 commuters, 23.4%), and 10 to 14 minutes (167 commuters, 12.9%).
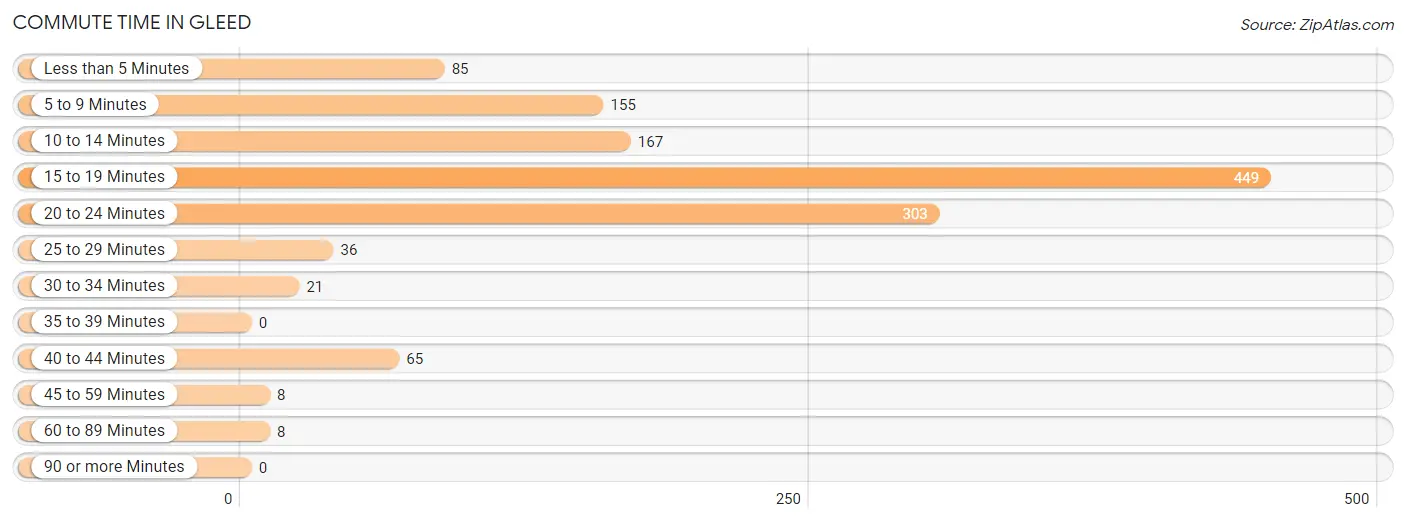
| Commute Time | # Commuters | % Commuters |
| Less than 5 Minutes | 85 | 6.6% |
| 5 to 9 Minutes | 155 | 11.9% |
| 10 to 14 Minutes | 167 | 12.9% |
| 15 to 19 Minutes | 449 | 34.6% |
| 20 to 24 Minutes | 303 | 23.4% |
| 25 to 29 Minutes | 36 | 2.8% |
| 30 to 34 Minutes | 21 | 1.6% |
| 35 to 39 Minutes | 0 | 0.0% |
| 40 to 44 Minutes | 65 | 5.0% |
| 45 to 59 Minutes | 8 | 0.6% |
| 60 to 89 Minutes | 8 | 0.6% |
| 90 or more Minutes | 0 | 0.0% |
Commute Time by Sex in Gleed
The most common commute times in Gleed are 15 to 19 minutes (203 commuters, 25.8%) for males and 15 to 19 minutes (246 commuters, 48.1%) for females.
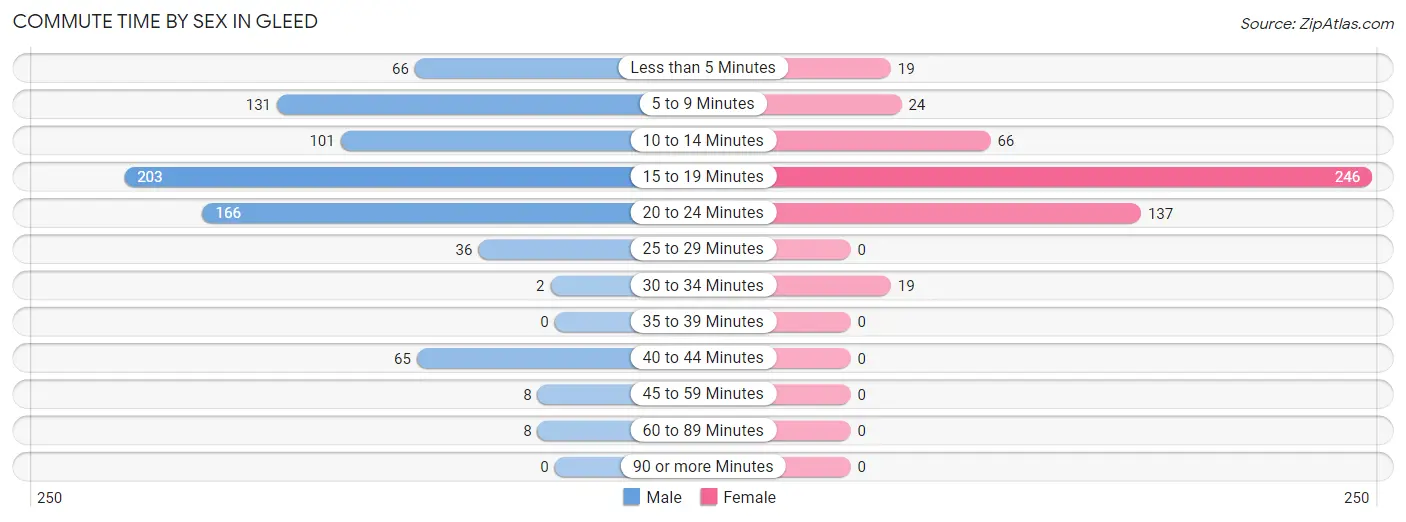
| Commute Time | Male | Female |
| Less than 5 Minutes | 66 (8.4%) | 19 (3.7%) |
| 5 to 9 Minutes | 131 (16.7%) | 24 (4.7%) |
| 10 to 14 Minutes | 101 (12.9%) | 66 (12.9%) |
| 15 to 19 Minutes | 203 (25.8%) | 246 (48.1%) |
| 20 to 24 Minutes | 166 (21.1%) | 137 (26.8%) |
| 25 to 29 Minutes | 36 (4.6%) | 0 (0.0%) |
| 30 to 34 Minutes | 2 (0.3%) | 19 (3.7%) |
| 35 to 39 Minutes | 0 (0.0%) | 0 (0.0%) |
| 40 to 44 Minutes | 65 (8.3%) | 0 (0.0%) |
| 45 to 59 Minutes | 8 (1.0%) | 0 (0.0%) |
| 60 to 89 Minutes | 8 (1.0%) | 0 (0.0%) |
| 90 or more Minutes | 0 (0.0%) | 0 (0.0%) |
Time of Departure to Work by Sex in Gleed
The most frequent times of departure to work in Gleed are 7:30 AM to 7:59 AM (194, 24.7%) for males and 7:00 AM to 7:29 AM (192, 37.6%) for females.
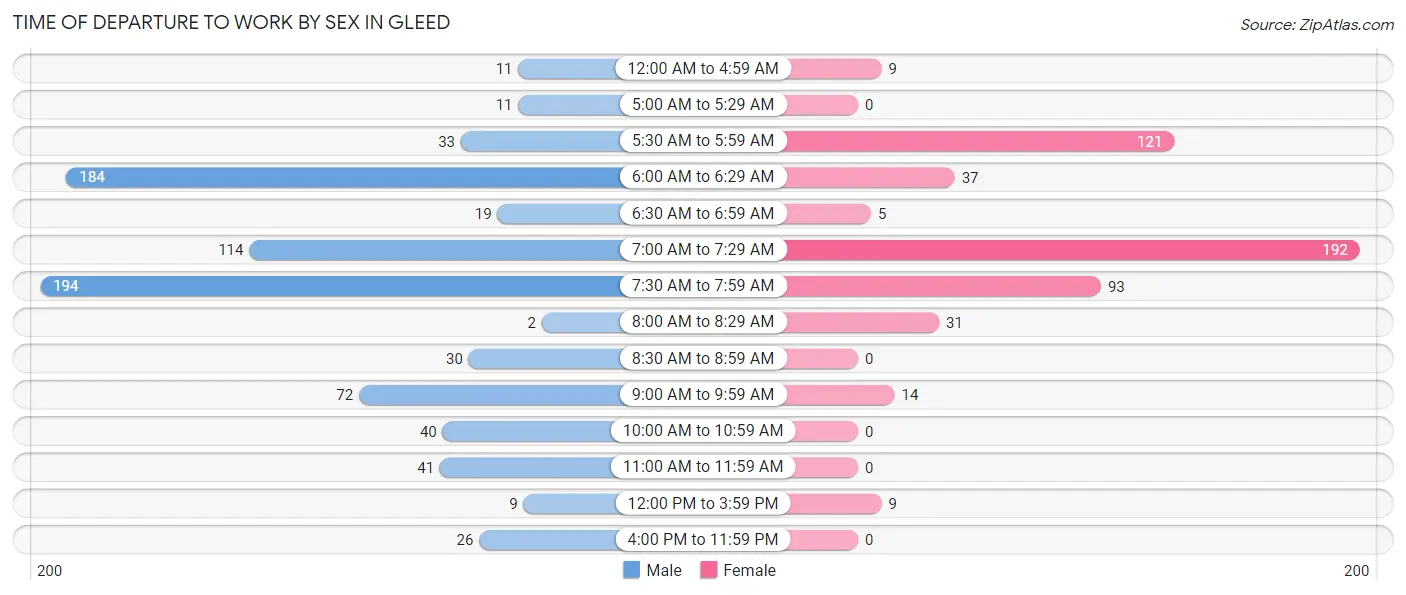
| Time of Departure | Male | Female |
| 12:00 AM to 4:59 AM | 11 (1.4%) | 9 (1.8%) |
| 5:00 AM to 5:29 AM | 11 (1.4%) | 0 (0.0%) |
| 5:30 AM to 5:59 AM | 33 (4.2%) | 121 (23.7%) |
| 6:00 AM to 6:29 AM | 184 (23.4%) | 37 (7.2%) |
| 6:30 AM to 6:59 AM | 19 (2.4%) | 5 (1.0%) |
| 7:00 AM to 7:29 AM | 114 (14.5%) | 192 (37.6%) |
| 7:30 AM to 7:59 AM | 194 (24.7%) | 93 (18.2%) |
| 8:00 AM to 8:29 AM | 2 (0.3%) | 31 (6.1%) |
| 8:30 AM to 8:59 AM | 30 (3.8%) | 0 (0.0%) |
| 9:00 AM to 9:59 AM | 72 (9.2%) | 14 (2.7%) |
| 10:00 AM to 10:59 AM | 40 (5.1%) | 0 (0.0%) |
| 11:00 AM to 11:59 AM | 41 (5.2%) | 0 (0.0%) |
| 12:00 PM to 3:59 PM | 9 (1.1%) | 9 (1.8%) |
| 4:00 PM to 11:59 PM | 26 (3.3%) | 0 (0.0%) |
| Total | 786 (100.0%) | 511 (100.0%) |
Housing Occupancy in Gleed
Occupancy by Ownership in Gleed
Of the total 1,191 dwellings in Gleed, owner-occupied units account for 1,023 (85.9%), while renter-occupied units make up 168 (14.1%).
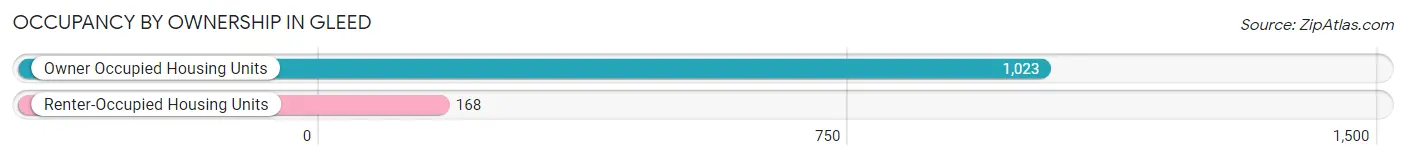
| Occupancy | # Housing Units | % Housing Units |
| Owner Occupied Housing Units | 1,023 | 85.9% |
| Renter-Occupied Housing Units | 168 | 14.1% |
| Total Occupied Housing Units | 1,191 | 100.0% |
Occupancy by Household Size in Gleed
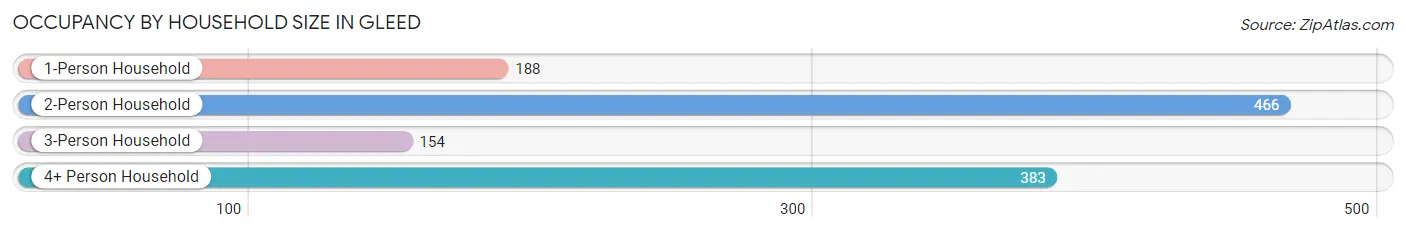
| Household Size | # Housing Units | % Housing Units |
| 1-Person Household | 188 | 15.8% |
| 2-Person Household | 466 | 39.1% |
| 3-Person Household | 154 | 12.9% |
| 4+ Person Household | 383 | 32.2% |
| Total Housing Units | 1,191 | 100.0% |
Occupancy by Ownership by Household Size in Gleed
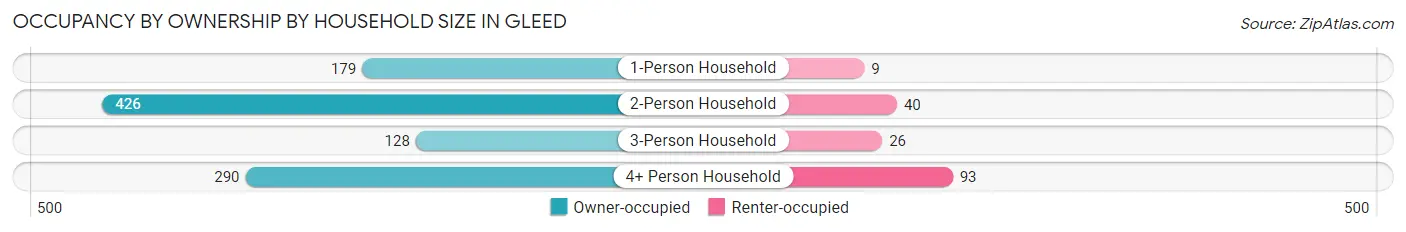
| Household Size | Owner-occupied | Renter-occupied |
| 1-Person Household | 179 (95.2%) | 9 (4.8%) |
| 2-Person Household | 426 (91.4%) | 40 (8.6%) |
| 3-Person Household | 128 (83.1%) | 26 (16.9%) |
| 4+ Person Household | 290 (75.7%) | 93 (24.3%) |
| Total Housing Units | 1,023 (85.9%) | 168 (14.1%) |
Occupancy by Educational Attainment in Gleed
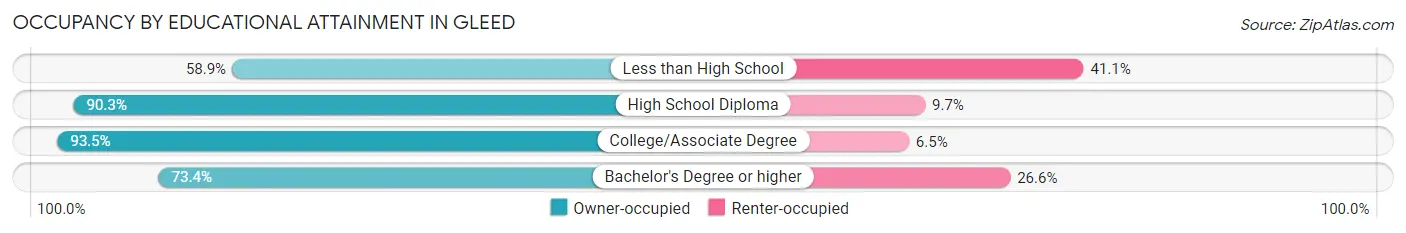
| Household Size | Owner-occupied | Renter-occupied |
| Less than High School | 53 (58.9%) | 37 (41.1%) |
| High School Diploma | 335 (90.3%) | 36 (9.7%) |
| College/Associate Degree | 461 (93.5%) | 32 (6.5%) |
| Bachelor's Degree or higher | 174 (73.4%) | 63 (26.6%) |
Occupancy by Age of Householder in Gleed
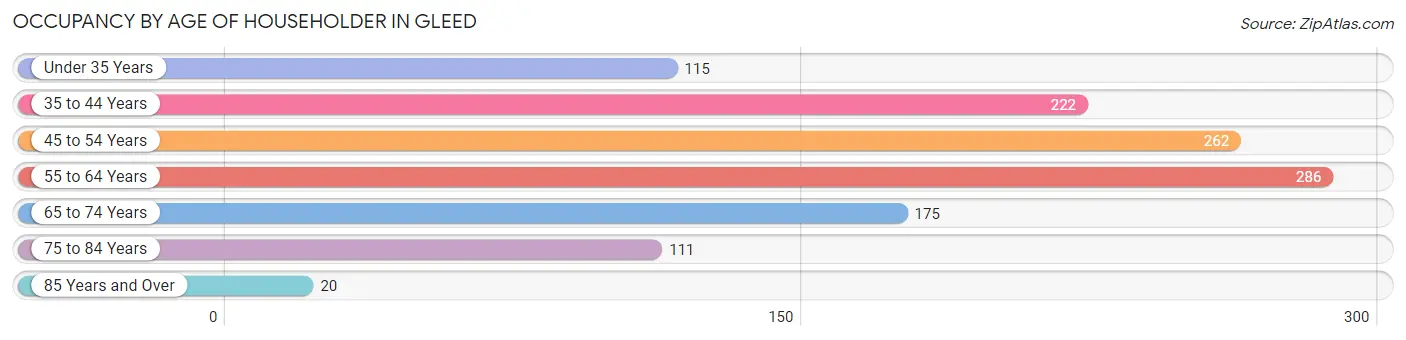
| Age Bracket | # Households | % Households |
| Under 35 Years | 115 | 9.7% |
| 35 to 44 Years | 222 | 18.6% |
| 45 to 54 Years | 262 | 22.0% |
| 55 to 64 Years | 286 | 24.0% |
| 65 to 74 Years | 175 | 14.7% |
| 75 to 84 Years | 111 | 9.3% |
| 85 Years and Over | 20 | 1.7% |
| Total | 1,191 | 100.0% |
Housing Finances in Gleed
Median Income by Occupancy in Gleed
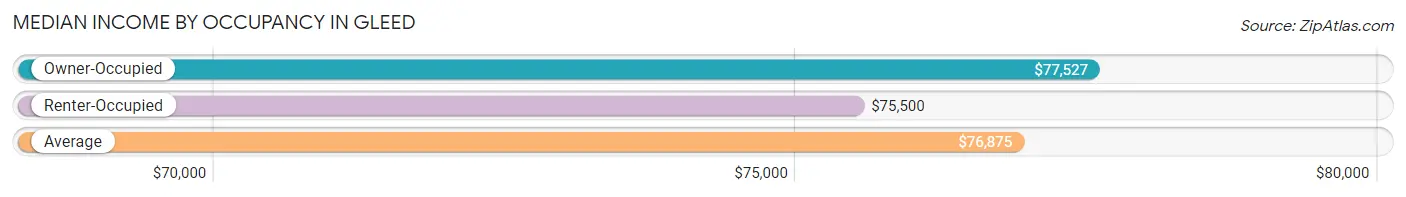
| Occupancy Type | # Households | Median Income |
| Owner-Occupied | 1,023 (85.9%) | $77,527 |
| Renter-Occupied | 168 (14.1%) | $75,500 |
| Average | 1,191 (100.0%) | $76,875 |
Occupancy by Householder Income Bracket in Gleed
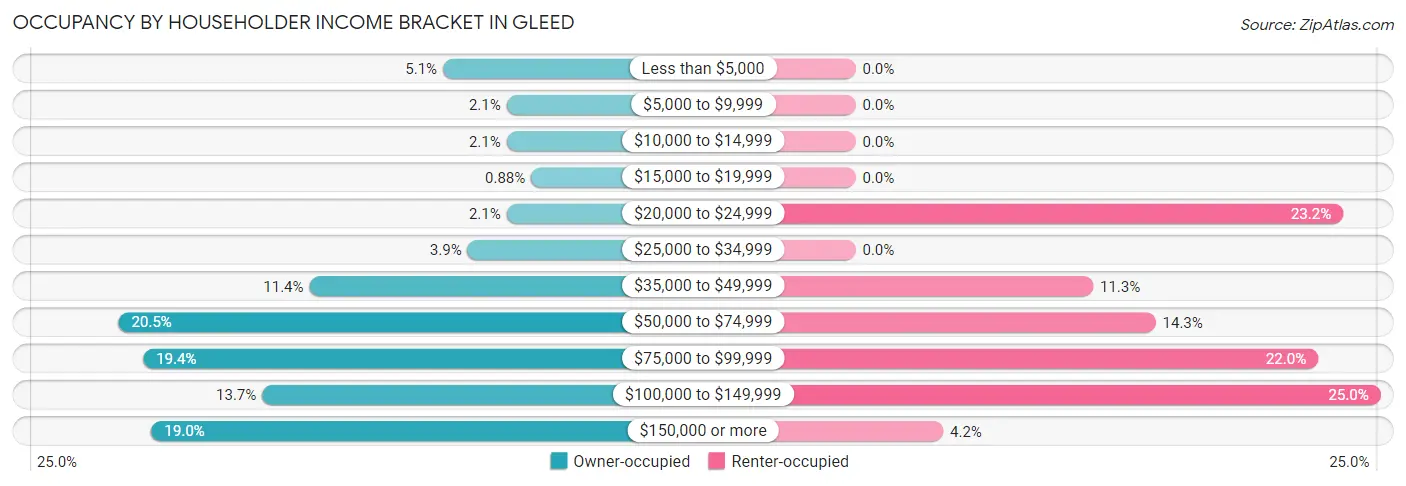
| Income Bracket | Owner-occupied | Renter-occupied |
| Less than $5,000 | 52 (5.1%) | 0 (0.0%) |
| $5,000 to $9,999 | 21 (2.1%) | 0 (0.0%) |
| $10,000 to $14,999 | 21 (2.1%) | 0 (0.0%) |
| $15,000 to $19,999 | 9 (0.9%) | 0 (0.0%) |
| $20,000 to $24,999 | 21 (2.1%) | 39 (23.2%) |
| $25,000 to $34,999 | 40 (3.9%) | 0 (0.0%) |
| $35,000 to $49,999 | 117 (11.4%) | 19 (11.3%) |
| $50,000 to $74,999 | 210 (20.5%) | 24 (14.3%) |
| $75,000 to $99,999 | 198 (19.4%) | 37 (22.0%) |
| $100,000 to $149,999 | 140 (13.7%) | 42 (25.0%) |
| $150,000 or more | 194 (19.0%) | 7 (4.2%) |
| Total | 1,023 (100.0%) | 168 (100.0%) |
Monthly Housing Cost Tiers in Gleed
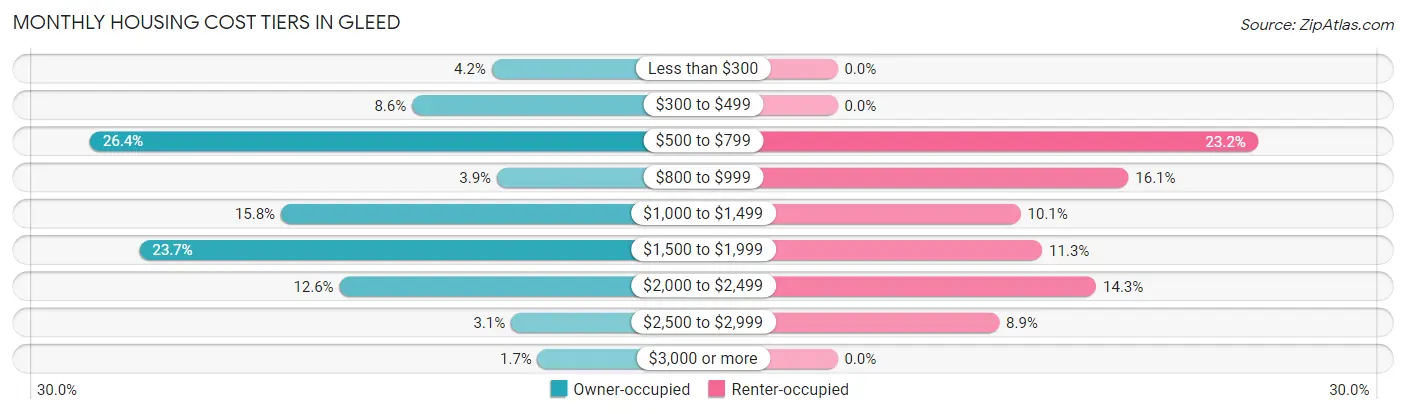
| Monthly Cost | Owner-occupied | Renter-occupied |
| Less than $300 | 43 (4.2%) | 0 (0.0%) |
| $300 to $499 | 88 (8.6%) | 0 (0.0%) |
| $500 to $799 | 270 (26.4%) | 39 (23.2%) |
| $800 to $999 | 40 (3.9%) | 27 (16.1%) |
| $1,000 to $1,499 | 162 (15.8%) | 17 (10.1%) |
| $1,500 to $1,999 | 242 (23.7%) | 19 (11.3%) |
| $2,000 to $2,499 | 129 (12.6%) | 24 (14.3%) |
| $2,500 to $2,999 | 32 (3.1%) | 15 (8.9%) |
| $3,000 or more | 17 (1.7%) | 0 (0.0%) |
| Total | 1,023 (100.0%) | 168 (100.0%) |
Physical Housing Characteristics in Gleed
Housing Structures in Gleed
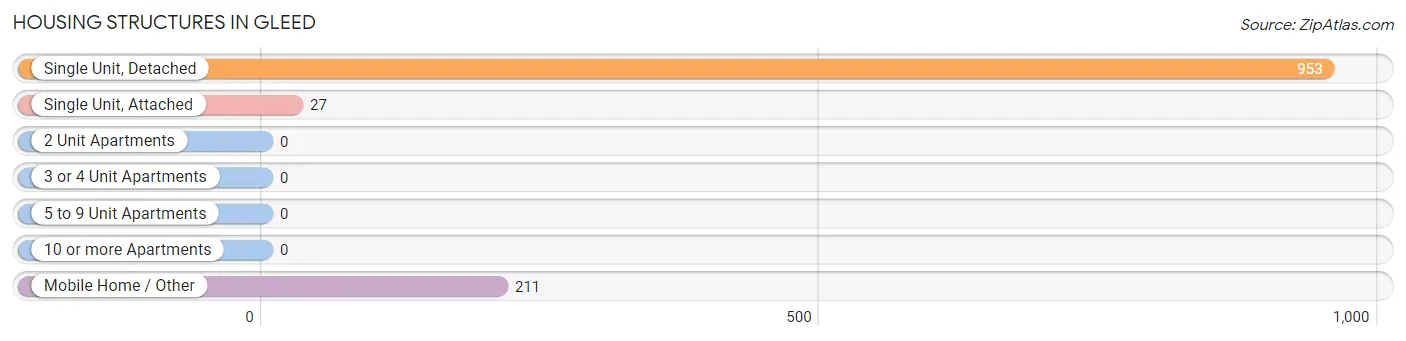
| Structure Type | # Housing Units | % Housing Units |
| Single Unit, Detached | 953 | 80.0% |
| Single Unit, Attached | 27 | 2.3% |
| 2 Unit Apartments | 0 | 0.0% |
| 3 or 4 Unit Apartments | 0 | 0.0% |
| 5 to 9 Unit Apartments | 0 | 0.0% |
| 10 or more Apartments | 0 | 0.0% |
| Mobile Home / Other | 211 | 17.7% |
| Total | 1,191 | 100.0% |
Housing Structures by Occupancy in Gleed
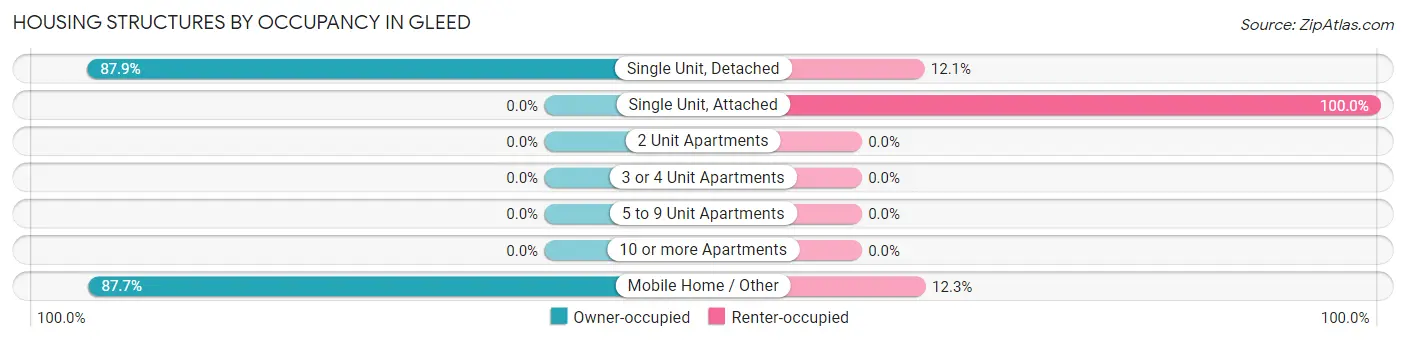
| Structure Type | Owner-occupied | Renter-occupied |
| Single Unit, Detached | 838 (87.9%) | 115 (12.1%) |
| Single Unit, Attached | 0 (0.0%) | 27 (100.0%) |
| 2 Unit Apartments | 0 (0.0%) | 0 (0.0%) |
| 3 or 4 Unit Apartments | 0 (0.0%) | 0 (0.0%) |
| 5 to 9 Unit Apartments | 0 (0.0%) | 0 (0.0%) |
| 10 or more Apartments | 0 (0.0%) | 0 (0.0%) |
| Mobile Home / Other | 185 (87.7%) | 26 (12.3%) |
| Total | 1,023 (85.9%) | 168 (14.1%) |
Housing Structures by Number of Rooms in Gleed
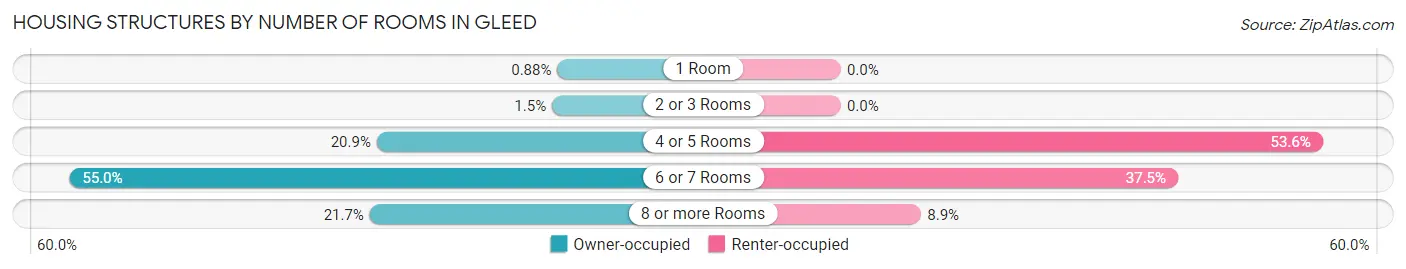
| Number of Rooms | Owner-occupied | Renter-occupied |
| 1 Room | 9 (0.9%) | 0 (0.0%) |
| 2 or 3 Rooms | 15 (1.5%) | 0 (0.0%) |
| 4 or 5 Rooms | 214 (20.9%) | 90 (53.6%) |
| 6 or 7 Rooms | 563 (55.0%) | 63 (37.5%) |
| 8 or more Rooms | 222 (21.7%) | 15 (8.9%) |
| Total | 1,023 (100.0%) | 168 (100.0%) |
Housing Structure by Heating Type in Gleed
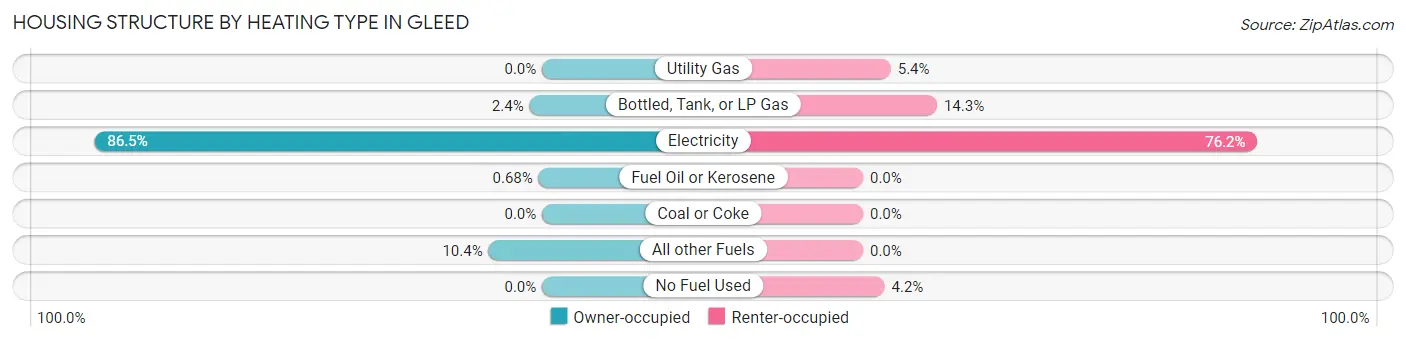
| Heating Type | Owner-occupied | Renter-occupied |
| Utility Gas | 0 (0.0%) | 9 (5.4%) |
| Bottled, Tank, or LP Gas | 25 (2.4%) | 24 (14.3%) |
| Electricity | 885 (86.5%) | 128 (76.2%) |
| Fuel Oil or Kerosene | 7 (0.7%) | 0 (0.0%) |
| Coal or Coke | 0 (0.0%) | 0 (0.0%) |
| All other Fuels | 106 (10.4%) | 0 (0.0%) |
| No Fuel Used | 0 (0.0%) | 7 (4.2%) |
| Total | 1,023 (100.0%) | 168 (100.0%) |
Household Vehicle Usage in Gleed
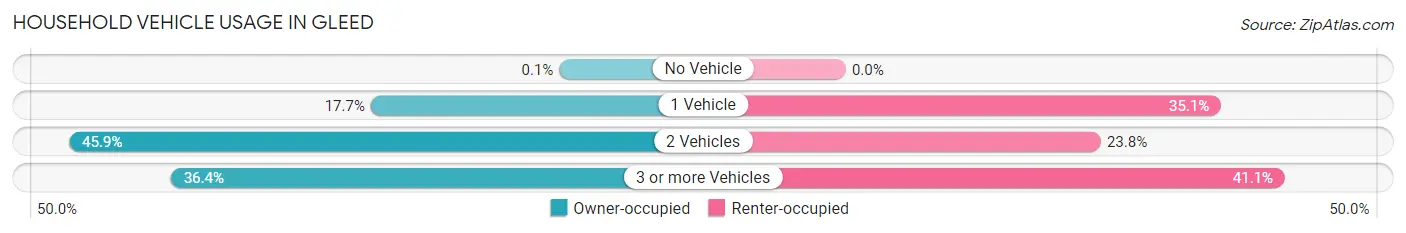
| Vehicles per Household | Owner-occupied | Renter-occupied |
| No Vehicle | 1 (0.1%) | 0 (0.0%) |
| 1 Vehicle | 181 (17.7%) | 59 (35.1%) |
| 2 Vehicles | 469 (45.9%) | 40 (23.8%) |
| 3 or more Vehicles | 372 (36.4%) | 69 (41.1%) |
| Total | 1,023 (100.0%) | 168 (100.0%) |
Real Estate & Mortgages in Gleed
Real Estate and Mortgage Overview in Gleed
| Characteristic | Without Mortgage | With Mortgage |
| Housing Units | 426 | 597 |
| Median Property Value | $286,400 | $285,000 |
| Median Household Income | $59,900 | $162 |
| Monthly Housing Costs | $599 | $17 |
| Real Estate Taxes | $2,432 | $0 |
Property Value by Mortgage Status in Gleed
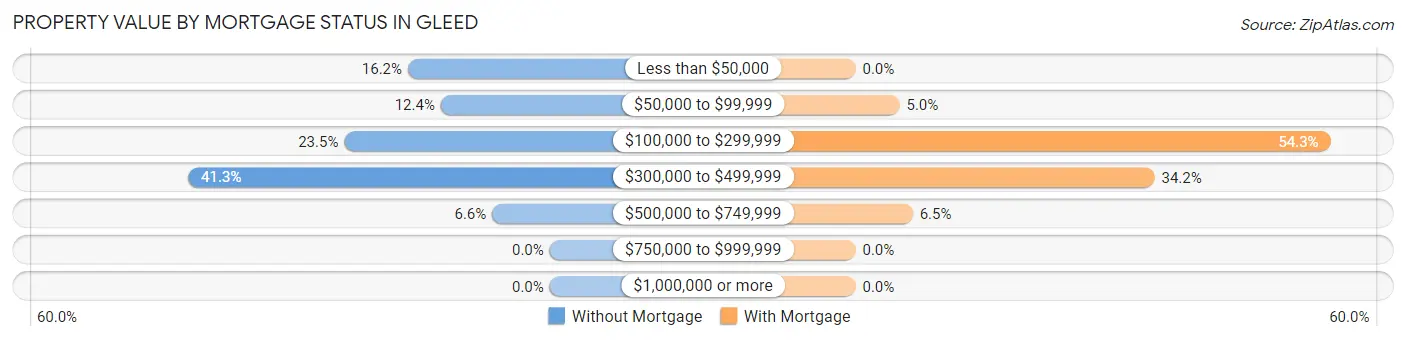
| Property Value | Without Mortgage | With Mortgage |
| Less than $50,000 | 69 (16.2%) | 0 (0.0%) |
| $50,000 to $99,999 | 53 (12.4%) | 30 (5.0%) |
| $100,000 to $299,999 | 100 (23.5%) | 324 (54.3%) |
| $300,000 to $499,999 | 176 (41.3%) | 204 (34.2%) |
| $500,000 to $749,999 | 28 (6.6%) | 39 (6.5%) |
| $750,000 to $999,999 | 0 (0.0%) | 0 (0.0%) |
| $1,000,000 or more | 0 (0.0%) | 0 (0.0%) |
| Total | 426 (100.0%) | 597 (100.0%) |
Household Income by Mortgage Status in Gleed
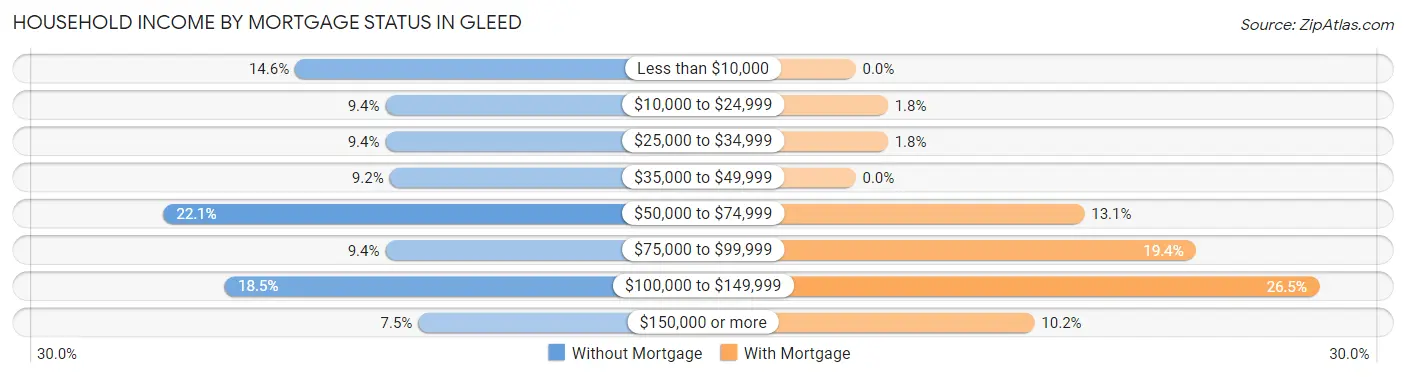
| Household Income | Without Mortgage | With Mortgage |
| Less than $10,000 | 62 (14.5%) | 0 (0.0%) |
| $10,000 to $24,999 | 40 (9.4%) | 11 (1.8%) |
| $25,000 to $34,999 | 40 (9.4%) | 11 (1.8%) |
| $35,000 to $49,999 | 39 (9.1%) | 0 (0.0%) |
| $50,000 to $74,999 | 94 (22.1%) | 78 (13.1%) |
| $75,000 to $99,999 | 40 (9.4%) | 116 (19.4%) |
| $100,000 to $149,999 | 79 (18.5%) | 158 (26.5%) |
| $150,000 or more | 32 (7.5%) | 61 (10.2%) |
| Total | 426 (100.0%) | 597 (100.0%) |
Property Value to Household Income Ratio in Gleed
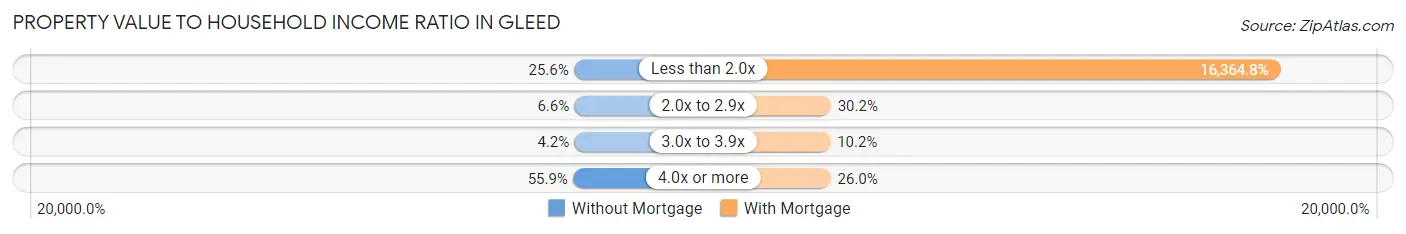
| Value-to-Income Ratio | Without Mortgage | With Mortgage |
| Less than 2.0x | 109 (25.6%) | 97,698 (16,364.8%) |
| 2.0x to 2.9x | 28 (6.6%) | 180 (30.1%) |
| 3.0x to 3.9x | 18 (4.2%) | 61 (10.2%) |
| 4.0x or more | 238 (55.9%) | 155 (26.0%) |
| Total | 426 (100.0%) | 597 (100.0%) |
Real Estate Taxes by Mortgage Status in Gleed
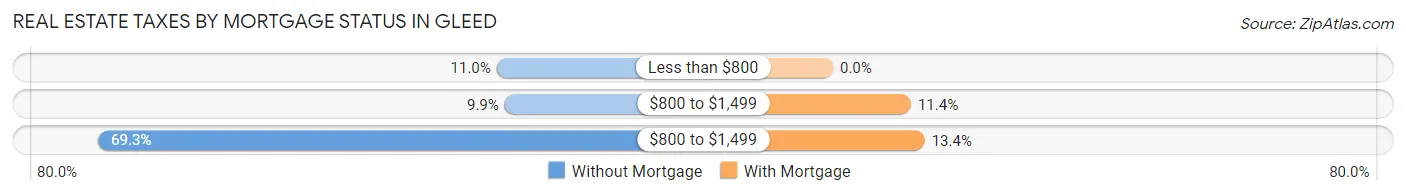
| Property Taxes | Without Mortgage | With Mortgage |
| Less than $800 | 47 (11.0%) | 0 (0.0%) |
| $800 to $1,499 | 42 (9.9%) | 68 (11.4%) |
| $800 to $1,499 | 295 (69.3%) | 80 (13.4%) |
| Total | 426 (100.0%) | 597 (100.0%) |
Health & Disability in Gleed
Health Insurance Coverage by Age in Gleed
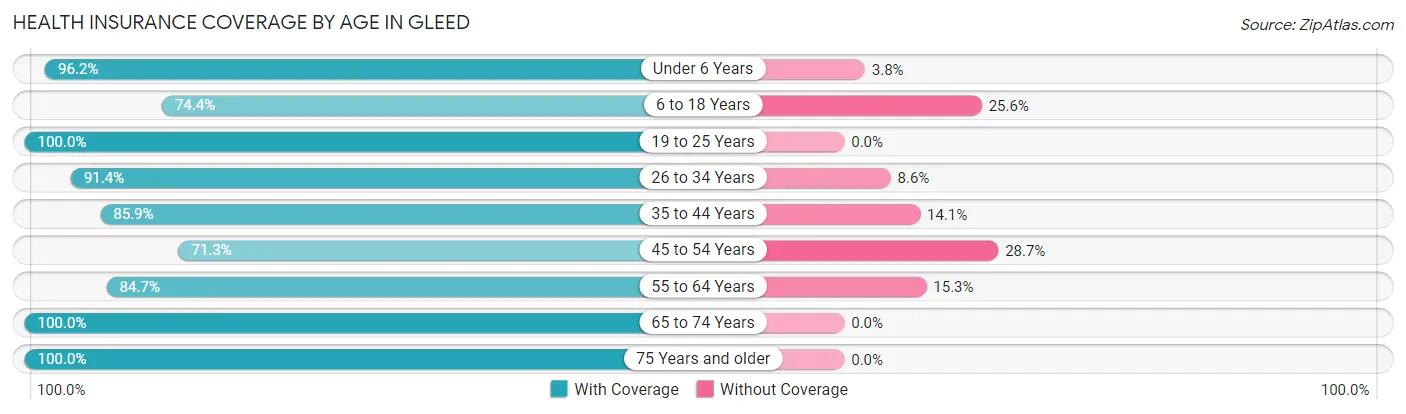
| Age Bracket | With Coverage | Without Coverage |
| Under 6 Years | 251 (96.2%) | 10 (3.8%) |
| 6 to 18 Years | 453 (74.4%) | 156 (25.6%) |
| 19 to 25 Years | 218 (100.0%) | 0 (0.0%) |
| 26 to 34 Years | 286 (91.4%) | 27 (8.6%) |
| 35 to 44 Years | 322 (85.9%) | 53 (14.1%) |
| 45 to 54 Years | 313 (71.3%) | 126 (28.7%) |
| 55 to 64 Years | 404 (84.7%) | 73 (15.3%) |
| 65 to 74 Years | 353 (100.0%) | 0 (0.0%) |
| 75 Years and older | 181 (100.0%) | 0 (0.0%) |
| Total | 2,781 (86.2%) | 445 (13.8%) |
Health Insurance Coverage by Citizenship Status in Gleed
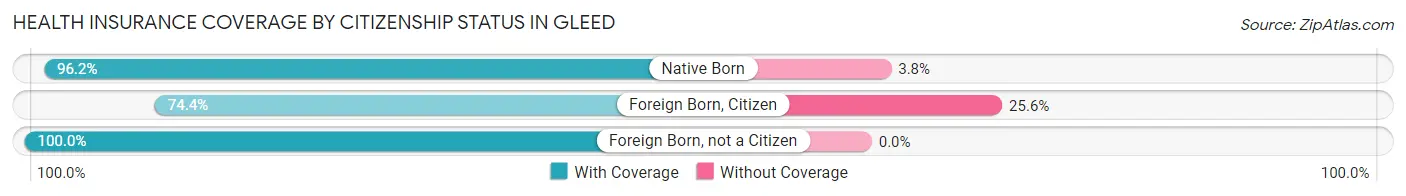
| Citizenship Status | With Coverage | Without Coverage |
| Native Born | 251 (96.2%) | 10 (3.8%) |
| Foreign Born, Citizen | 453 (74.4%) | 156 (25.6%) |
| Foreign Born, not a Citizen | 218 (100.0%) | 0 (0.0%) |
Health Insurance Coverage by Household Income in Gleed
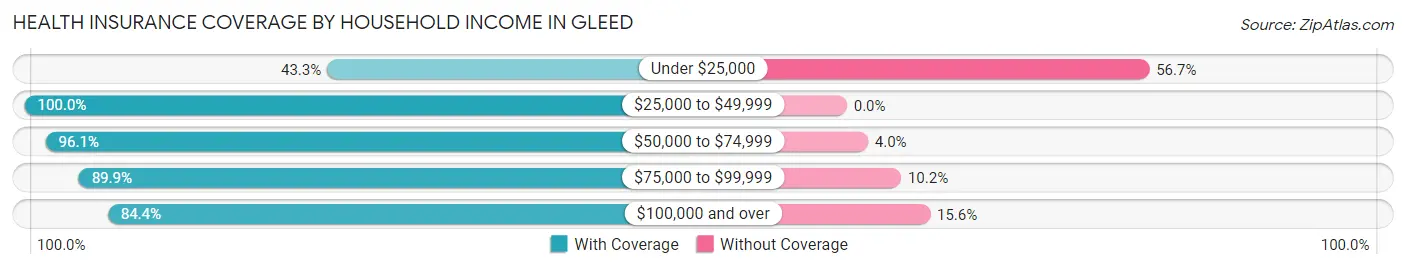
| Household Income | With Coverage | Without Coverage |
| Under $25,000 | 127 (43.3%) | 166 (56.7%) |
| $25,000 to $49,999 | 361 (100.0%) | 0 (0.0%) |
| $50,000 to $74,999 | 608 (96.1%) | 25 (4.0%) |
| $75,000 to $99,999 | 770 (89.8%) | 87 (10.2%) |
| $100,000 and over | 904 (84.4%) | 167 (15.6%) |
Public vs Private Health Insurance Coverage by Age in Gleed
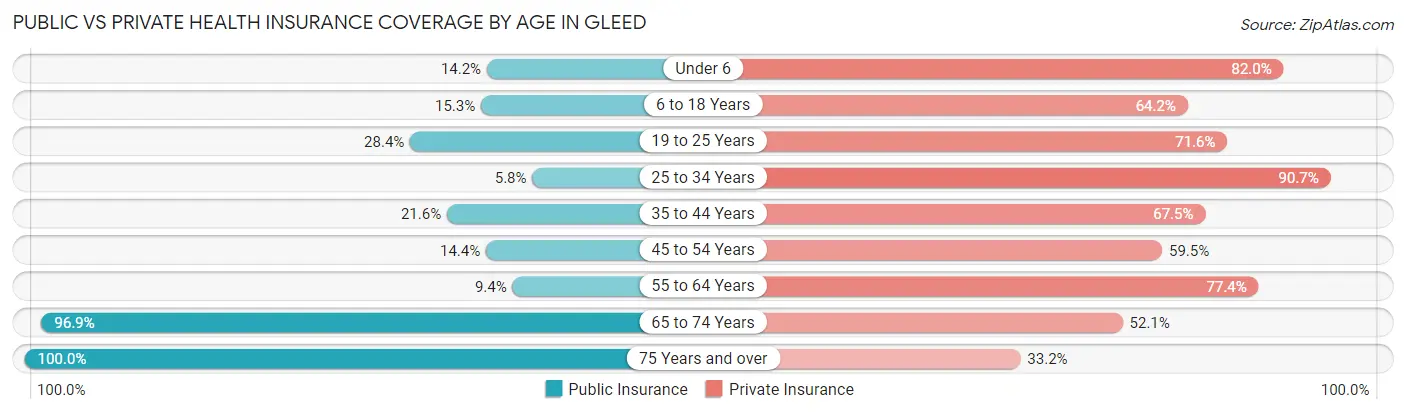
| Age Bracket | Public Insurance | Private Insurance |
| Under 6 | 37 (14.2%) | 214 (82.0%) |
| 6 to 18 Years | 93 (15.3%) | 391 (64.2%) |
| 19 to 25 Years | 62 (28.4%) | 156 (71.6%) |
| 25 to 34 Years | 18 (5.8%) | 284 (90.7%) |
| 35 to 44 Years | 81 (21.6%) | 253 (67.5%) |
| 45 to 54 Years | 63 (14.3%) | 261 (59.5%) |
| 55 to 64 Years | 45 (9.4%) | 369 (77.4%) |
| 65 to 74 Years | 342 (96.9%) | 184 (52.1%) |
| 75 Years and over | 181 (100.0%) | 60 (33.2%) |
| Total | 922 (28.6%) | 2,172 (67.3%) |
Disability Status by Sex by Age in Gleed
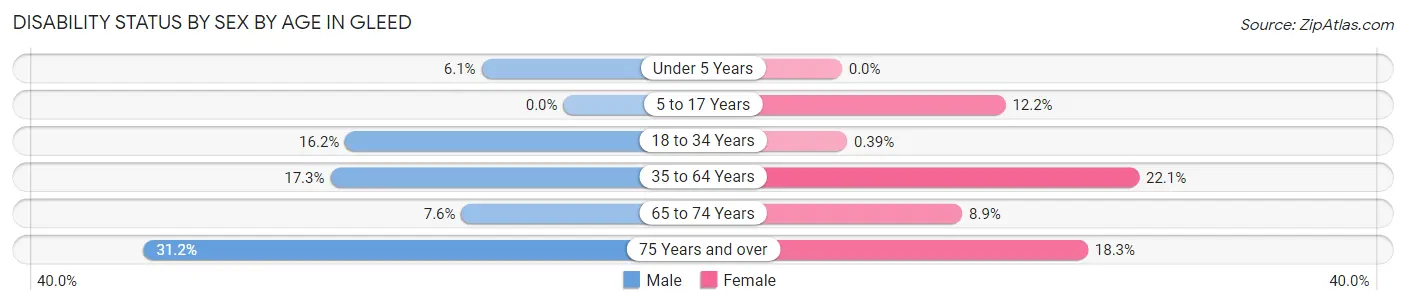
| Age Bracket | Male | Female |
| Under 5 Years | 9 (6.1%) | 0 (0.0%) |
| 5 to 17 Years | 0 (0.0%) | 43 (12.1%) |
| 18 to 34 Years | 46 (16.2%) | 1 (0.4%) |
| 35 to 64 Years | 123 (17.3%) | 128 (22.1%) |
| 65 to 74 Years | 14 (7.6%) | 15 (8.9%) |
| 75 Years and over | 24 (31.2%) | 19 (18.3%) |
Disability Class by Sex by Age in Gleed
Disability Class: Hearing Difficulty
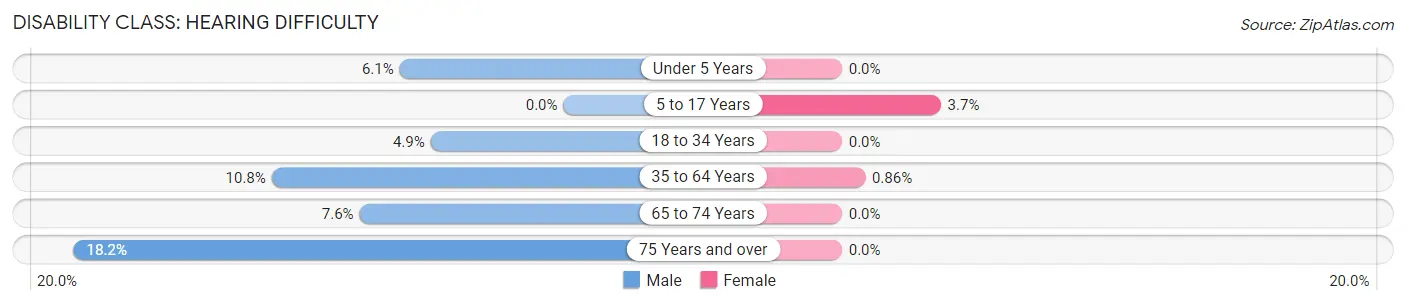
| Age Bracket | Male | Female |
| Under 5 Years | 9 (6.1%) | 0 (0.0%) |
| 5 to 17 Years | 0 (0.0%) | 13 (3.7%) |
| 18 to 34 Years | 14 (4.9%) | 0 (0.0%) |
| 35 to 64 Years | 77 (10.8%) | 5 (0.9%) |
| 65 to 74 Years | 14 (7.6%) | 0 (0.0%) |
| 75 Years and over | 14 (18.2%) | 0 (0.0%) |
Disability Class: Vision Difficulty
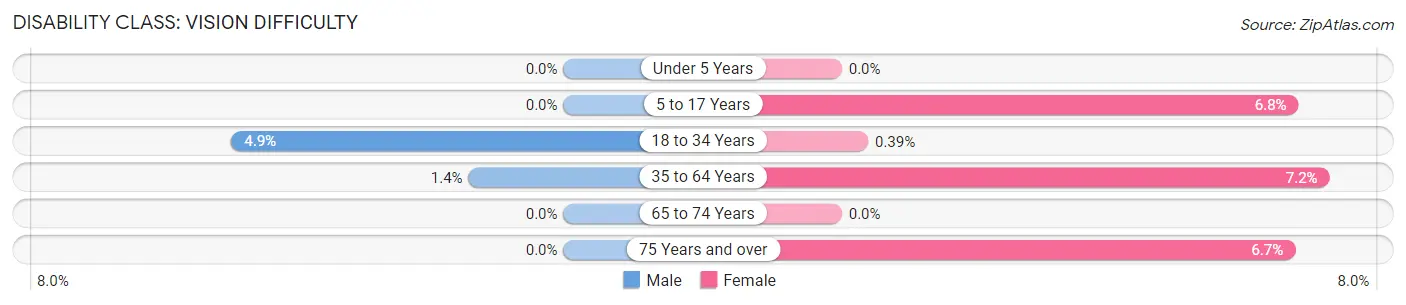
| Age Bracket | Male | Female |
| Under 5 Years | 0 (0.0%) | 0 (0.0%) |
| 5 to 17 Years | 0 (0.0%) | 24 (6.8%) |
| 18 to 34 Years | 14 (4.9%) | 1 (0.4%) |
| 35 to 64 Years | 10 (1.4%) | 42 (7.2%) |
| 65 to 74 Years | 0 (0.0%) | 0 (0.0%) |
| 75 Years and over | 0 (0.0%) | 7 (6.7%) |
Disability Class: Cognitive Difficulty
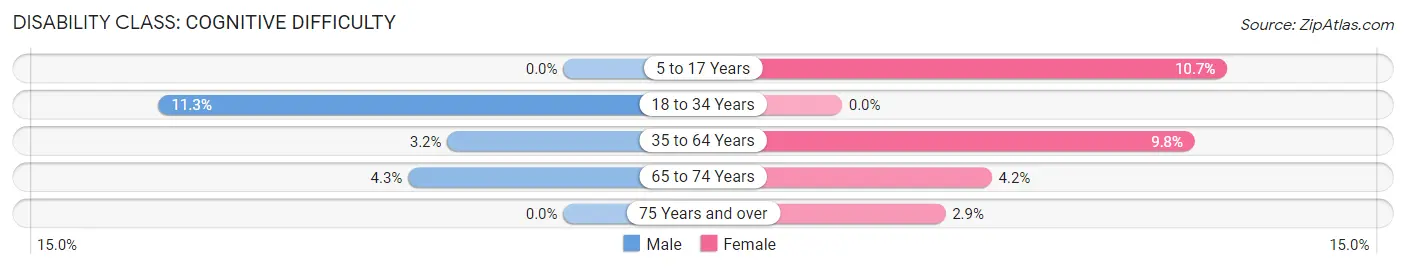
| Age Bracket | Male | Female |
| 5 to 17 Years | 0 (0.0%) | 38 (10.7%) |
| 18 to 34 Years | 32 (11.3%) | 0 (0.0%) |
| 35 to 64 Years | 23 (3.2%) | 57 (9.8%) |
| 65 to 74 Years | 8 (4.3%) | 7 (4.2%) |
| 75 Years and over | 0 (0.0%) | 3 (2.9%) |
Disability Class: Ambulatory Difficulty
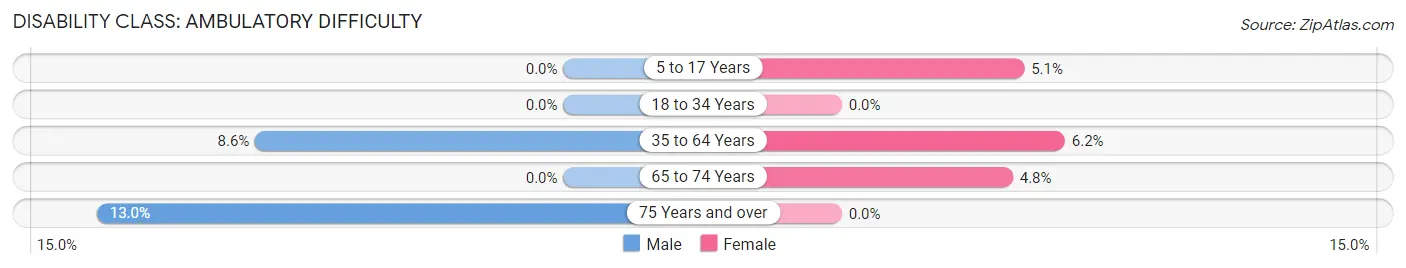
| Age Bracket | Male | Female |
| 5 to 17 Years | 0 (0.0%) | 18 (5.1%) |
| 18 to 34 Years | 0 (0.0%) | 0 (0.0%) |
| 35 to 64 Years | 61 (8.6%) | 36 (6.2%) |
| 65 to 74 Years | 0 (0.0%) | 8 (4.8%) |
| 75 Years and over | 10 (13.0%) | 0 (0.0%) |
Disability Class: Self-Care Difficulty
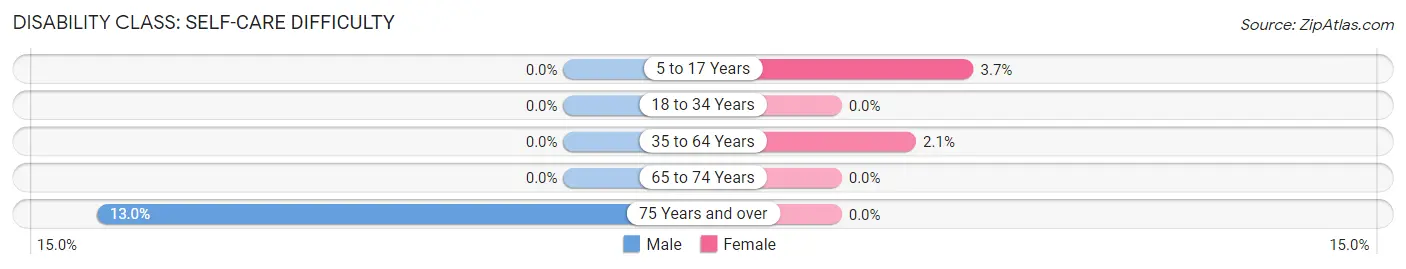
| Age Bracket | Male | Female |
| 5 to 17 Years | 0 (0.0%) | 13 (3.7%) |
| 18 to 34 Years | 0 (0.0%) | 0 (0.0%) |
| 35 to 64 Years | 0 (0.0%) | 12 (2.1%) |
| 65 to 74 Years | 0 (0.0%) | 0 (0.0%) |
| 75 Years and over | 10 (13.0%) | 0 (0.0%) |
Technology Access in Gleed
Computing Device Access in Gleed
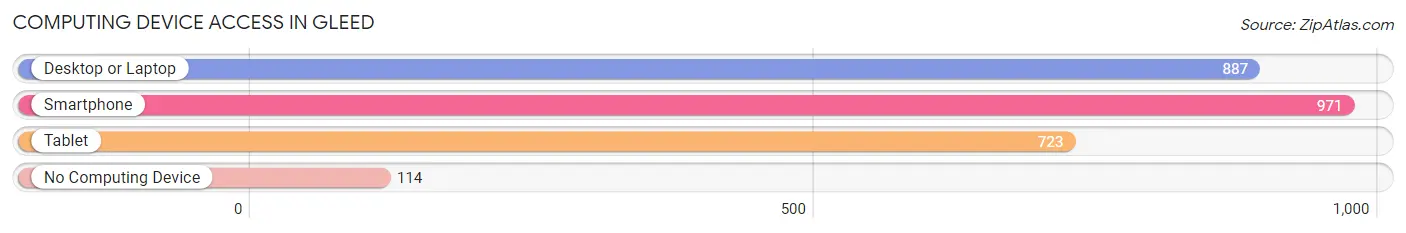
| Device Type | # Households | % Households |
| Desktop or Laptop | 887 | 74.5% |
| Smartphone | 971 | 81.5% |
| Tablet | 723 | 60.7% |
| No Computing Device | 114 | 9.6% |
| Total | 1,191 | 100.0% |
Internet Access in Gleed
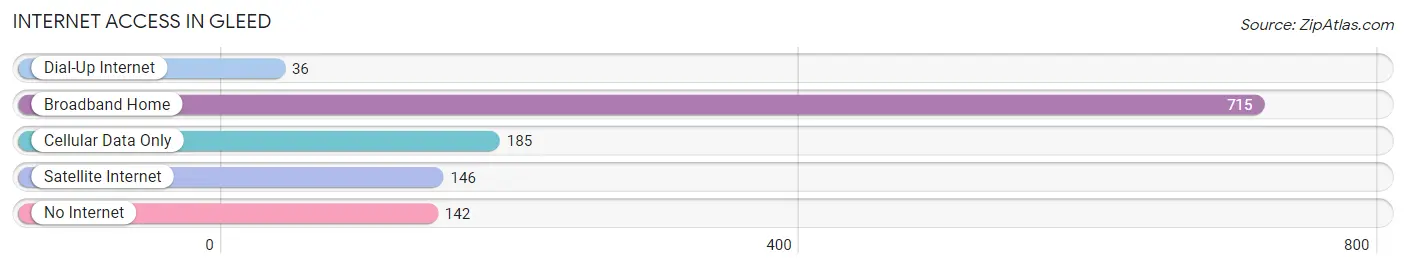
| Internet Type | # Households | % Households |
| Dial-Up Internet | 36 | 3.0% |
| Broadband Home | 715 | 60.0% |
| Cellular Data Only | 185 | 15.5% |
| Satellite Internet | 146 | 12.3% |
| No Internet | 142 | 11.9% |
| Total | 1,191 | 100.0% |
Gleed Summary
Gleed is an unincorporated community located in Yakima County, Washington, United States. It is situated in the foothills of the Cascade Mountains, approximately 8 miles east of Yakima. The population of Gleed was estimated to be around 200 people in 2000.
History
Gleed was first settled in the late 1800s by homesteaders who were attracted to the area by its fertile soil and abundant water. The first post office was established in 1891 and the town was officially incorporated in 1909. The name “Gleed” is derived from the Native American word for “valley”.
The town was originally a farming community, with many of the residents growing apples, cherries, and other fruits. In the early 1900s, the town was also home to a sawmill and a brickyard.
Geography
Gleed is located in the foothills of the Cascade Mountains, approximately 8 miles east of Yakima. The town is situated at an elevation of 1,890 feet and is surrounded by rolling hills and lush forests. The climate is semi-arid, with hot summers and cold winters.
The town is located near several recreational areas, including the Yakima River, the Yakima Valley, and the Cascade Mountains. The nearby Yakima River provides opportunities for fishing, boating, and swimming.
Economy
Gleed’s economy is largely based on agriculture. The town is home to several fruit orchards, as well as a few small businesses. The town also has a few restaurants and a grocery store.
Demographics
As of the 2000 census, the population of Gleed was estimated to be around 200 people. The racial makeup of the town was 94.5% White, 0.5% African American, 0.5% Native American, 0.5% Asian, and 4% from other races. The median household income was $30,000.
Conclusion
Gleed is a small, rural community located in the foothills of the Cascade Mountains in Yakima County, Washington. The town has a long history of farming and is home to several fruit orchards. The population of Gleed was estimated to be around 200 people in 2000. The town’s economy is largely based on agriculture, with a few small businesses and restaurants.
Common Questions
What is Per Capita Income in Gleed?
Per Capita income in Gleed is $33,390.
What is the Median Family Income in Gleed?
Median Family Income in Gleed is $86,026.
What is the Median Household income in Gleed?
Median Household Income in Gleed is $76,875.
What is Income or Wage Gap in Gleed?
Income or Wage Gap in Gleed is 0.7%.
Women in Gleed earn 99.3 cents for every dollar earned by a man.
What is Inequality or Gini Index in Gleed?
Inequality or Gini Index in Gleed is 0.37.
What is the Total Population of Gleed?
Total Population of Gleed is 3,231.
What is the Total Male Population of Gleed?
Total Male Population of Gleed is 1,679.
What is the Total Female Population of Gleed?
Total Female Population of Gleed is 1,552.
What is the Ratio of Males per 100 Females in Gleed?
There are 108.18 Males per 100 Females in Gleed.
What is the Ratio of Females per 100 Males in Gleed?
There are 92.44 Females per 100 Males in Gleed.
What is the Median Population Age in Gleed?
Median Population Age in Gleed is 41.3 Years.
What is the Average Family Size in Gleed
Average Family Size in Gleed is 3.0 People.
What is the Average Household Size in Gleed
Average Household Size in Gleed is 2.7 People.
How Large is the Labor Force in Gleed?
There are 1,553 People in the Labor Forcein in Gleed.
What is the Percentage of People in the Labor Force in Gleed?
63.4% of People are in the Labor Force in Gleed.
What is the Unemployment Rate in Gleed?
Unemployment Rate in Gleed is 5.3%.