St John, WA Map & Demographics
St John Map
St John Overview
$27,894
PER CAPITA INCOME
$84,250
AVG FAMILY INCOME
$64,750
AVG HOUSEHOLD INCOME
26.9%
WAGE / INCOME GAP [ % ]
73.1¢/ $1
WAGE / INCOME GAP [ $ ]
0.39
INEQUALITY / GINI INDEX
612
TOTAL POPULATION
272
MALE POPULATION
340
FEMALE POPULATION
80.00
MALES / 100 FEMALES
125.00
FEMALES / 100 MALES
55.5
MEDIAN AGE
3.4
AVG FAMILY SIZE
2.5
AVG HOUSEHOLD SIZE
193
LABOR FORCE [ PEOPLE ]
38.5%
PERCENT IN LABOR FORCE
8.6%
UNEMPLOYMENT RATE
Income in St John
Income Overview in St John
Per Capita Income in St John is $27,894, while median incomes of families and households are $84,250 and $64,750 respectively.
| Characteristic | Number | Measure |
| Per Capita Income | 612 | $27,894 |
| Median Family Income | 141 | $84,250 |
| Mean Family Income | 141 | $93,433 |
| Median Household Income | 247 | $64,750 |
| Mean Household Income | 247 | $68,732 |
| Income Deficit | 141 | $0 |
| Wage / Income Gap (%) | 612 | 26.91% |
| Wage / Income Gap ($) | 612 | 73.09¢ per $1 |
| Gini / Inequality Index | 612 | 0.39 |
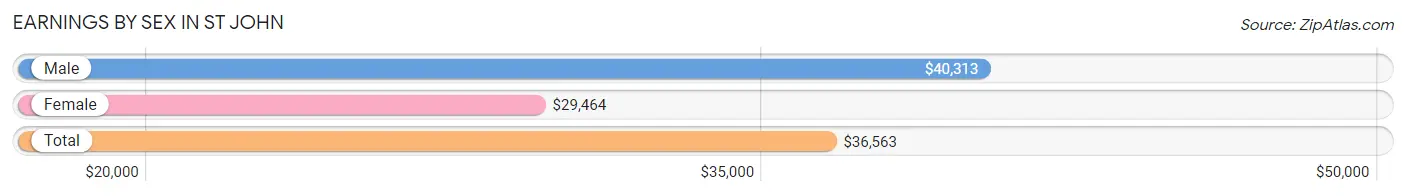
Earnings by Sex in St John
Average Earnings in St John are $36,563, $40,313 for men and $29,464 for women, a difference of 26.9%.
| Sex | Number | Average Earnings |
| Male | 126 (54.5%) | $40,313 |
| Female | 105 (45.5%) | $29,464 |
| Total | 231 (100.0%) | $36,563 |
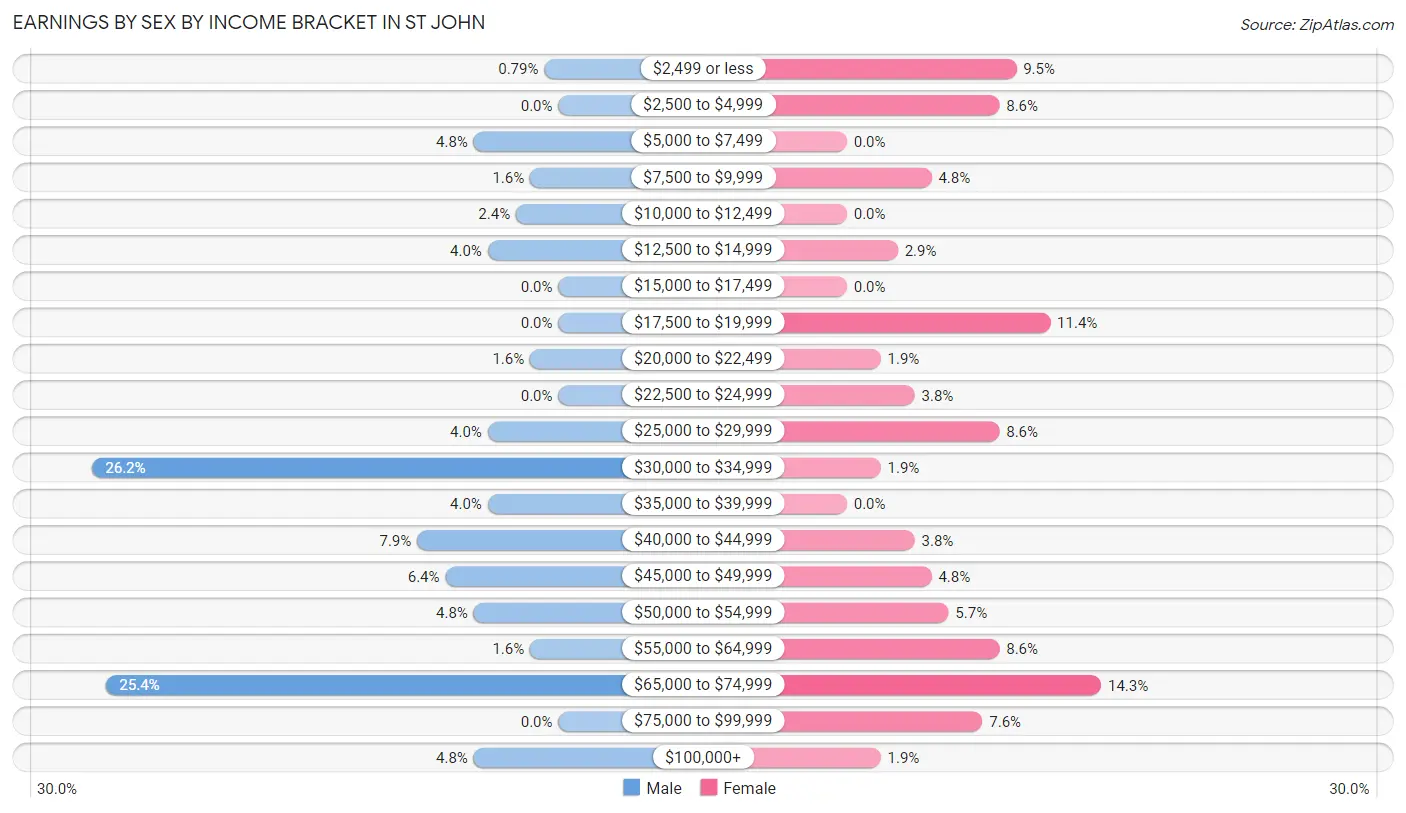
Earnings by Sex by Income Bracket in St John
The most common earnings brackets in St John are $30,000 to $34,999 for men (33 | 26.2%) and $65,000 to $74,999 for women (15 | 14.3%).
| Income | Male | Female |
| $2,499 or less | 1 (0.8%) | 10 (9.5%) |
| $2,500 to $4,999 | 0 (0.0%) | 9 (8.6%) |
| $5,000 to $7,499 | 6 (4.8%) | 0 (0.0%) |
| $7,500 to $9,999 | 2 (1.6%) | 5 (4.8%) |
| $10,000 to $12,499 | 3 (2.4%) | 0 (0.0%) |
| $12,500 to $14,999 | 5 (4.0%) | 3 (2.9%) |
| $15,000 to $17,499 | 0 (0.0%) | 0 (0.0%) |
| $17,500 to $19,999 | 0 (0.0%) | 12 (11.4%) |
| $20,000 to $22,499 | 2 (1.6%) | 2 (1.9%) |
| $22,500 to $24,999 | 0 (0.0%) | 4 (3.8%) |
| $25,000 to $29,999 | 5 (4.0%) | 9 (8.6%) |
| $30,000 to $34,999 | 33 (26.2%) | 2 (1.9%) |
| $35,000 to $39,999 | 5 (4.0%) | 0 (0.0%) |
| $40,000 to $44,999 | 10 (7.9%) | 4 (3.8%) |
| $45,000 to $49,999 | 8 (6.4%) | 5 (4.8%) |
| $50,000 to $54,999 | 6 (4.8%) | 6 (5.7%) |
| $55,000 to $64,999 | 2 (1.6%) | 9 (8.6%) |
| $65,000 to $74,999 | 32 (25.4%) | 15 (14.3%) |
| $75,000 to $99,999 | 0 (0.0%) | 8 (7.6%) |
| $100,000+ | 6 (4.8%) | 2 (1.9%) |
| Total | 126 (100.0%) | 105 (100.0%) |
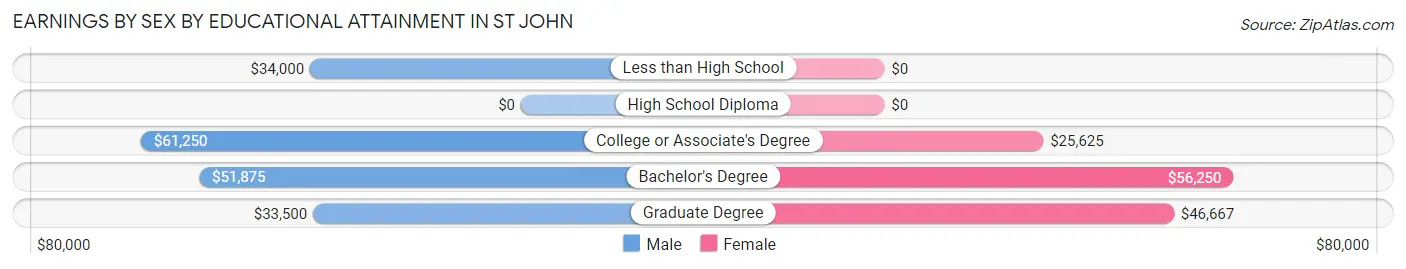
Earnings by Sex by Educational Attainment in St John
Average earnings in St John are $42,031 for men and $33,750 for women, a difference of 19.7%. Men with an educational attainment of college or associate's degree enjoy the highest average annual earnings of $61,250, while those with graduate degree education earn the least with $33,500. Women with an educational attainment of bachelor's degree earn the most with the average annual earnings of $56,250, while those with college or associate's degree education have the smallest earnings of $25,625.
| Educational Attainment | Male Income | Female Income |
| Less than High School | $34,000 | $0 |
| High School Diploma | - | - |
| College or Associate's Degree | $61,250 | $25,625 |
| Bachelor's Degree | $51,875 | $56,250 |
| Graduate Degree | $33,500 | $46,667 |
| Total | $42,031 | $33,750 |
Family Income in St John
Family Income Brackets in St John
According to the St John family income data, there are 46 families falling into the $75,000 to $99,999 income range, which is the most common income bracket and makes up 32.6% of all families.
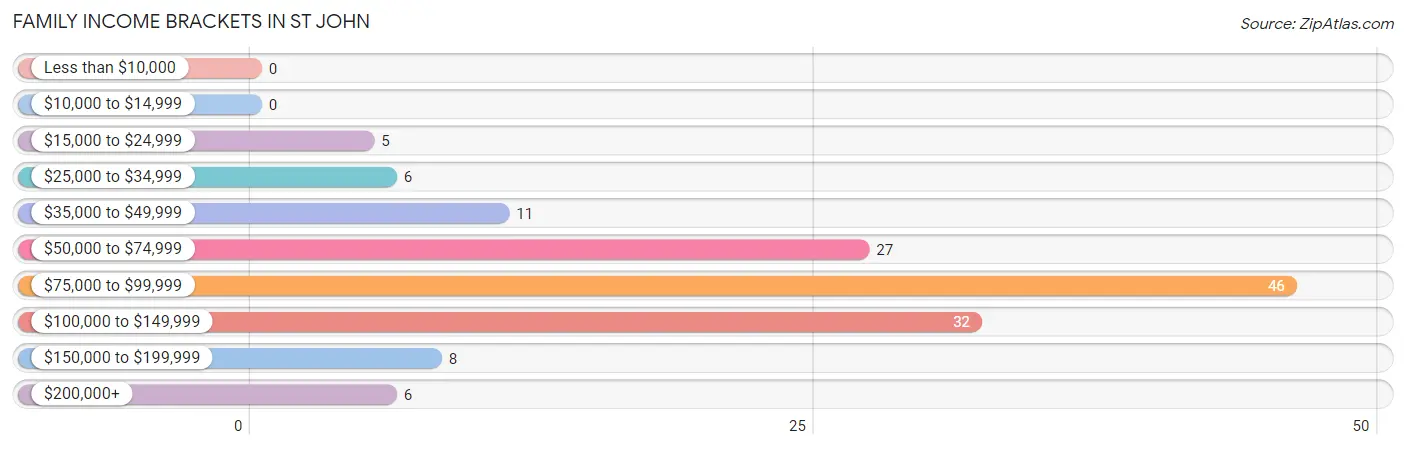
| Income Bracket | # Families | % Families |
| Less than $10,000 | 0 | 0.0% |
| $10,000 to $14,999 | 0 | 0.0% |
| $15,000 to $24,999 | 5 | 3.5% |
| $25,000 to $34,999 | 6 | 4.3% |
| $35,000 to $49,999 | 11 | 7.8% |
| $50,000 to $74,999 | 27 | 19.1% |
| $75,000 to $99,999 | 46 | 32.6% |
| $100,000 to $149,999 | 32 | 22.7% |
| $150,000 to $199,999 | 8 | 5.7% |
| $200,000+ | 6 | 4.3% |
Family Income by Famaliy Size in St John
4-person families (17 | 12.1%) account for the highest median family income in St John with $89,375 per family, while 2-person families (77 | 54.6%) have the highest median income of $39,062 per family member.
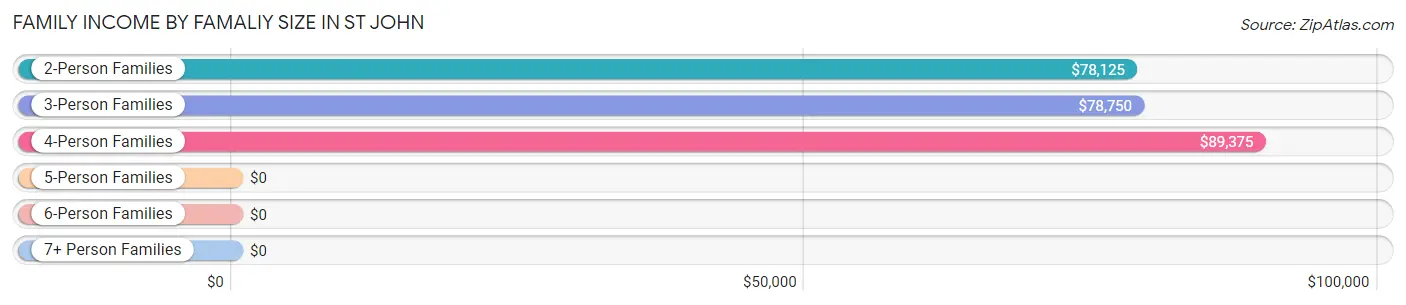
| Income Bracket | # Families | Median Income |
| 2-Person Families | 77 (54.6%) | $78,125 |
| 3-Person Families | 25 (17.7%) | $78,750 |
| 4-Person Families | 17 (12.1%) | $89,375 |
| 5-Person Families | 12 (8.5%) | $0 |
| 6-Person Families | 0 (0.0%) | $0 |
| 7+ Person Families | 10 (7.1%) | $0 |
| Total | 141 (100.0%) | $84,250 |
Family Income by Number of Earners in St John
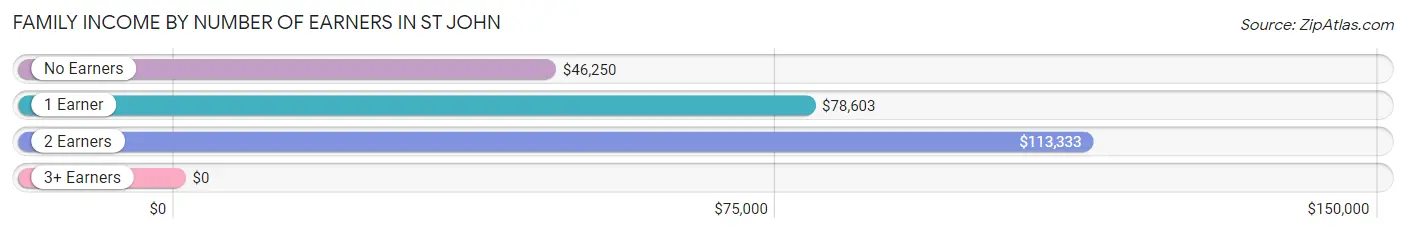
| Number of Earners | # Families | Median Income |
| No Earners | 24 (17.0%) | $46,250 |
| 1 Earner | 55 (39.0%) | $78,603 |
| 2 Earners | 60 (42.5%) | $113,333 |
| 3+ Earners | 2 (1.4%) | $0 |
| Total | 141 (100.0%) | $84,250 |
Household Income in St John
Household Income Brackets in St John
With 46 households falling in the category, the $75,000 to $99,999 income range is the most frequent in St John, accounting for 18.6% of all households. In contrast, only 1 households (0.4%) fall into the $10,000 to $14,999 income bracket, making it the least populous group.

| Income Bracket | # Households | % Households |
| Less than $10,000 | 18 | 7.3% |
| $10,000 to $14,999 | 1 | 0.4% |
| $15,000 to $24,999 | 41 | 16.6% |
| $25,000 to $34,999 | 13 | 5.3% |
| $35,000 to $49,999 | 28 | 11.3% |
| $50,000 to $74,999 | 45 | 18.2% |
| $75,000 to $99,999 | 46 | 18.6% |
| $100,000 to $149,999 | 41 | 16.6% |
| $150,000 to $199,999 | 8 | 3.2% |
| $200,000+ | 6 | 2.4% |
Household Income by Householder Age in St John
The median household income in St John is $64,750, with the highest median household income of $99,886 found in the 25 to 44 years age bracket for the primary householder. A total of 57 households (23.1%) fall into this category. Meanwhile, the 15 to 24 years age bracket for the primary householder has the lowest median household income of $0, with 5 households (2.0%) in this group.
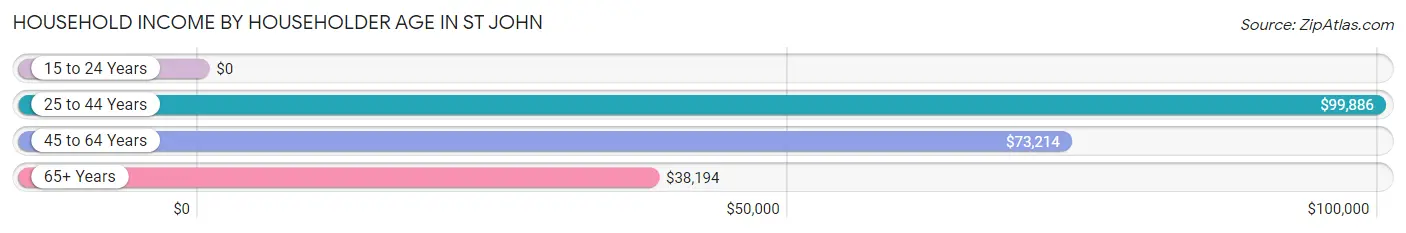
| Income Bracket | # Households | Median Income |
| 15 to 24 Years | 5 (2.0%) | $0 |
| 25 to 44 Years | 57 (23.1%) | $99,886 |
| 45 to 64 Years | 54 (21.9%) | $73,214 |
| 65+ Years | 131 (53.0%) | $38,194 |
| Total | 247 (100.0%) | $64,750 |
Poverty in St John
Income Below Poverty by Sex and Age in St John
With 12.9% poverty level for males and 8.2% for females among the residents of St John, 55 to 64 year old males and 25 to 34 year old females are the most vulnerable to poverty, with 10 males (30.3%) and 6 females (21.4%) in their respective age groups living below the poverty level.
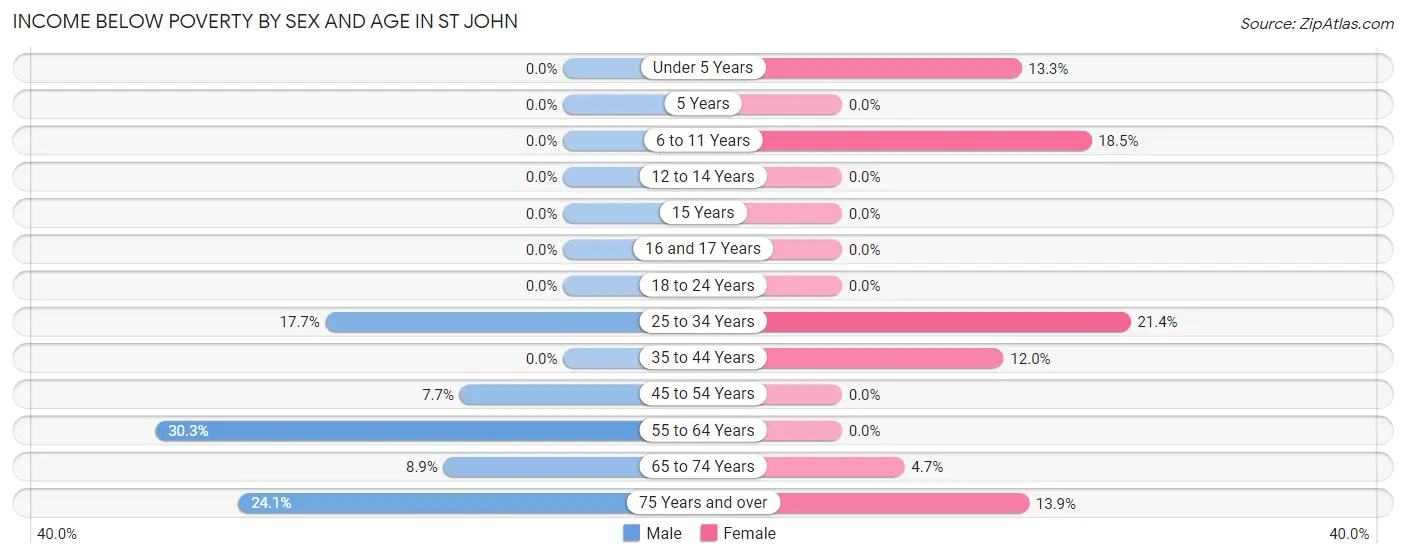
| Age Bracket | Male | Female |
| Under 5 Years | 0 (0.0%) | 2 (13.3%) |
| 5 Years | 0 (0.0%) | 0 (0.0%) |
| 6 to 11 Years | 0 (0.0%) | 5 (18.5%) |
| 12 to 14 Years | 0 (0.0%) | 0 (0.0%) |
| 15 Years | 0 (0.0%) | 0 (0.0%) |
| 16 and 17 Years | 0 (0.0%) | 0 (0.0%) |
| 18 to 24 Years | 0 (0.0%) | 0 (0.0%) |
| 25 to 34 Years | 6 (17.6%) | 6 (21.4%) |
| 35 to 44 Years | 0 (0.0%) | 3 (12.0%) |
| 45 to 54 Years | 1 (7.7%) | 0 (0.0%) |
| 55 to 64 Years | 10 (30.3%) | 0 (0.0%) |
| 65 to 74 Years | 4 (8.9%) | 2 (4.6%) |
| 75 Years and over | 14 (24.1%) | 10 (13.9%) |
| Total | 35 (12.9%) | 28 (8.2%) |
Income Above Poverty by Sex and Age in St John
According to the poverty statistics in St John, males aged under 5 years and females aged 5 years are the age groups that are most secure financially, with 100.0% of males and 100.0% of females in these age groups living above the poverty line.
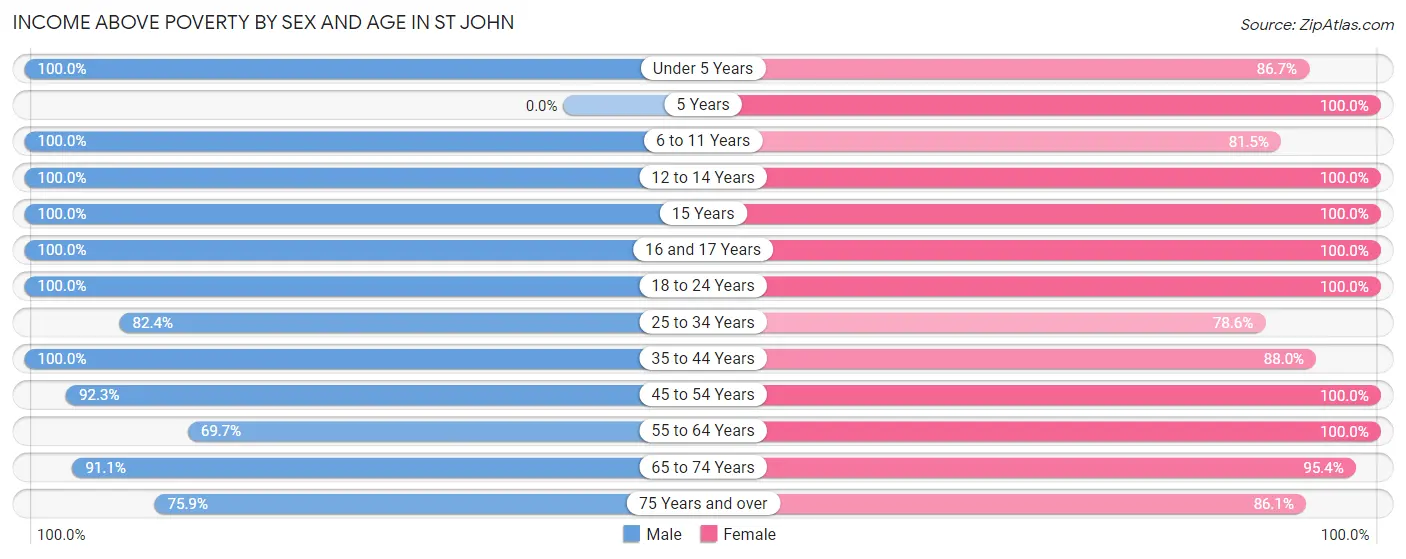
| Age Bracket | Male | Female |
| Under 5 Years | 14 (100.0%) | 13 (86.7%) |
| 5 Years | 0 (0.0%) | 2 (100.0%) |
| 6 to 11 Years | 19 (100.0%) | 22 (81.5%) |
| 12 to 14 Years | 7 (100.0%) | 19 (100.0%) |
| 15 Years | 6 (100.0%) | 2 (100.0%) |
| 16 and 17 Years | 8 (100.0%) | 8 (100.0%) |
| 18 to 24 Years | 11 (100.0%) | 2 (100.0%) |
| 25 to 34 Years | 28 (82.4%) | 22 (78.6%) |
| 35 to 44 Years | 24 (100.0%) | 22 (88.0%) |
| 45 to 54 Years | 12 (92.3%) | 13 (100.0%) |
| 55 to 64 Years | 23 (69.7%) | 84 (100.0%) |
| 65 to 74 Years | 41 (91.1%) | 41 (95.4%) |
| 75 Years and over | 44 (75.9%) | 62 (86.1%) |
| Total | 237 (87.1%) | 312 (91.8%) |
Income Below Poverty Among Married-Couple Families in St John
The poverty statistics for married-couple families in St John show that 4.0% or 5 of the total 125 families live below the poverty line. Families with 1 or 2 children have the highest poverty rate of 11.8%, comprising of 2 families. On the other hand, families with 3 or 4 children have the lowest poverty rate of 0.0%, which includes 0 families.
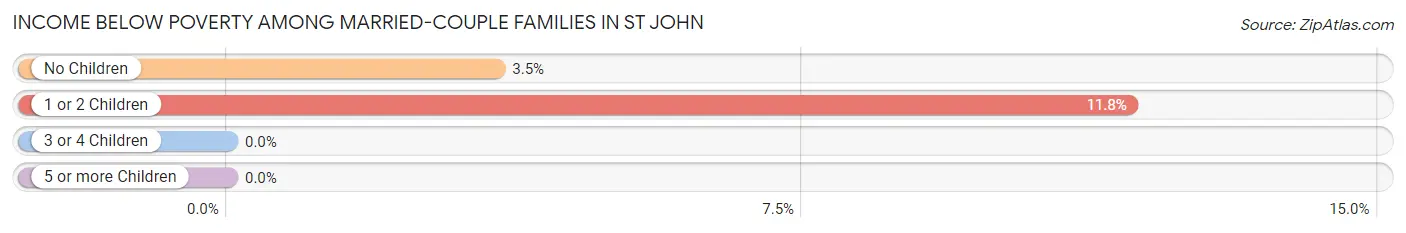
| Children | Above Poverty | Below Poverty |
| No Children | 83 (96.5%) | 3 (3.5%) |
| 1 or 2 Children | 15 (88.2%) | 2 (11.8%) |
| 3 or 4 Children | 12 (100.0%) | 0 (0.0%) |
| 5 or more Children | 10 (100.0%) | 0 (0.0%) |
| Total | 120 (96.0%) | 5 (4.0%) |
Income Below Poverty Among Single-Parent Households in St John
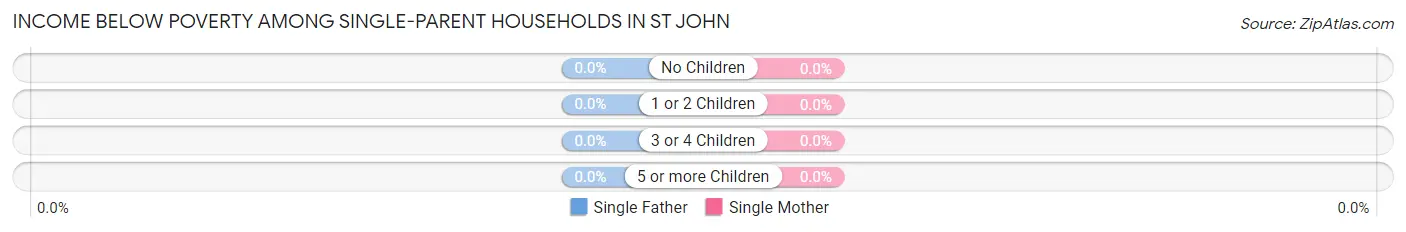
| Children | Single Father | Single Mother |
| No Children | 0 (0.0%) | 0 (0.0%) |
| 1 or 2 Children | 0 (0.0%) | 0 (0.0%) |
| 3 or 4 Children | 0 (0.0%) | 0 (0.0%) |
| 5 or more Children | 0 (0.0%) | 0 (0.0%) |
| Total | 0 (0.0%) | 0 (0.0%) |
Income Below Poverty Among Married-Couple vs Single-Parent Households in St John
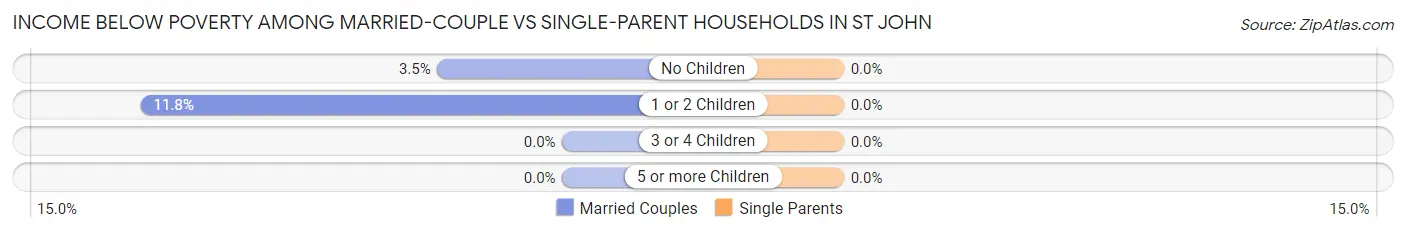
| Children | Married-Couple Families | Single-Parent Households |
| No Children | 3 (3.5%) | 0 (0.0%) |
| 1 or 2 Children | 2 (11.8%) | 0 (0.0%) |
| 3 or 4 Children | 0 (0.0%) | 0 (0.0%) |
| 5 or more Children | 0 (0.0%) | 0 (0.0%) |
| Total | 5 (4.0%) | 0 (0.0%) |
Race in St John
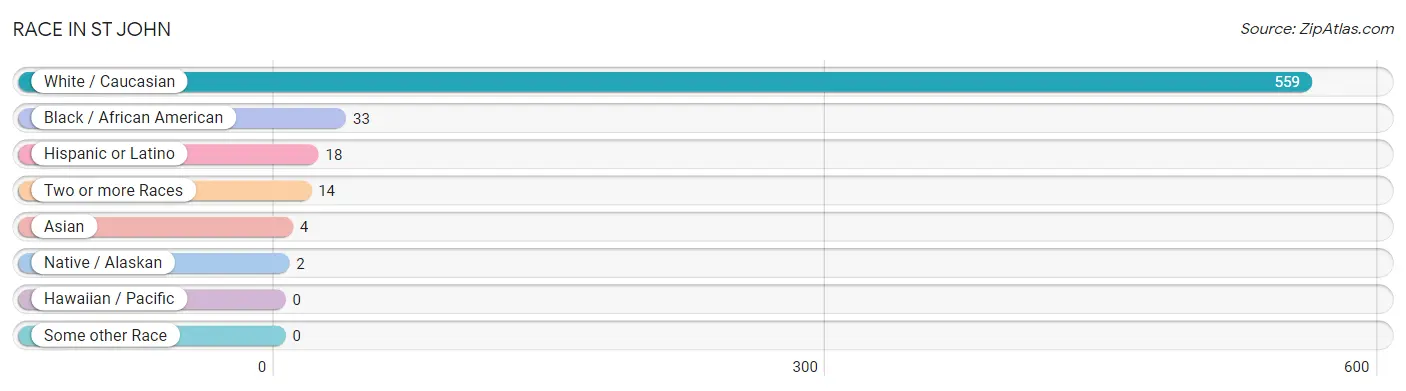
The most populous races in St John are White / Caucasian (559 | 91.3%), Black / African American (33 | 5.4%), and Hispanic or Latino (18 | 2.9%).
| Race | # Population | % Population |
| Asian | 4 | 0.6% |
| Black / African American | 33 | 5.4% |
| Hawaiian / Pacific | 0 | 0.0% |
| Hispanic or Latino | 18 | 2.9% |
| Native / Alaskan | 2 | 0.3% |
| White / Caucasian | 559 | 91.3% |
| Two or more Races | 14 | 2.3% |
| Some other Race | 0 | 0.0% |
| Total | 612 | 100.0% |
Ancestry in St John
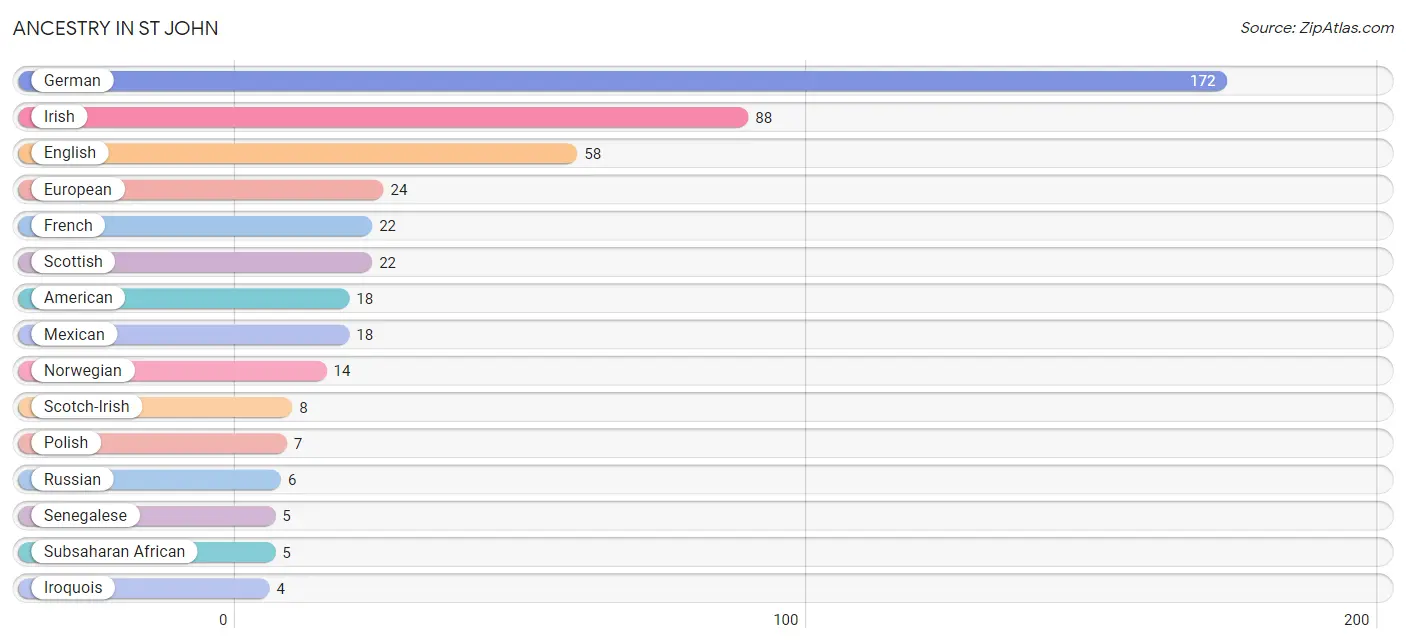
The most populous ancestries reported in St John are German (172 | 28.1%), Irish (88 | 14.4%), English (58 | 9.5%), European (24 | 3.9%), and French (22 | 3.6%), together accounting for 59.5% of all St John residents.
| Ancestry | # Population | % Population |
| American | 18 | 2.9% |
| Bhutanese | 2 | 0.3% |
| British | 3 | 0.5% |
| Central American Indian | 2 | 0.3% |
| Dutch | 2 | 0.3% |
| English | 58 | 9.5% |
| European | 24 | 3.9% |
| French | 22 | 3.6% |
| German | 172 | 28.1% |
| Iranian | 2 | 0.3% |
| Irish | 88 | 14.4% |
| Iroquois | 4 | 0.6% |
| Italian | 3 | 0.5% |
| Mexican | 18 | 2.9% |
| Norwegian | 14 | 2.3% |
| Polish | 7 | 1.1% |
| Portuguese | 2 | 0.3% |
| Russian | 6 | 1.0% |
| Scandinavian | 2 | 0.3% |
| Scotch-Irish | 8 | 1.3% |
| Scottish | 22 | 3.6% |
| Senegalese | 5 | 0.8% |
| Sri Lankan | 2 | 0.3% |
| Subsaharan African | 5 | 0.8% |
| Welsh | 2 | 0.3% | View All 25 Rows |
Immigrants in St John
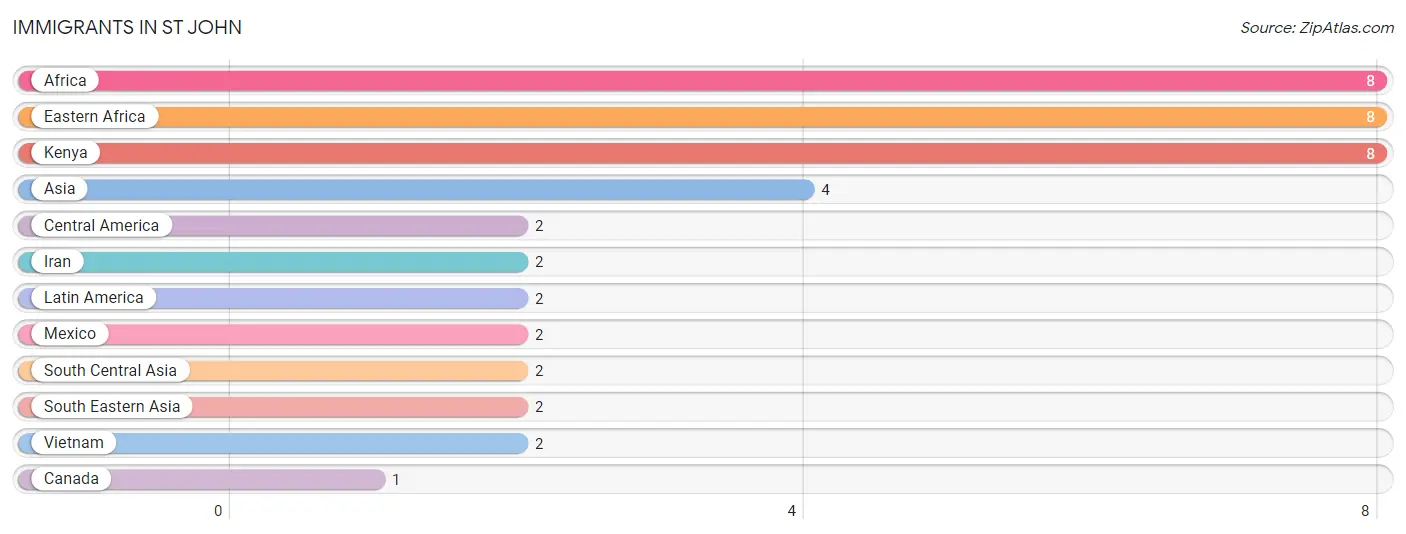
The most numerous immigrant groups reported in St John came from Africa (8 | 1.3%), Eastern Africa (8 | 1.3%), Kenya (8 | 1.3%), Asia (4 | 0.6%), and Central America (2 | 0.3%), together accounting for 4.9% of all St John residents.
| Immigration Origin | # Population | % Population |
| Africa | 8 | 1.3% |
| Asia | 4 | 0.6% |
| Canada | 1 | 0.2% |
| Central America | 2 | 0.3% |
| Eastern Africa | 8 | 1.3% |
| Iran | 2 | 0.3% |
| Kenya | 8 | 1.3% |
| Latin America | 2 | 0.3% |
| Mexico | 2 | 0.3% |
| South Central Asia | 2 | 0.3% |
| South Eastern Asia | 2 | 0.3% |
| Vietnam | 2 | 0.3% | View All 12 Rows |
Sex and Age in St John
Sex and Age in St John
The most populous age groups in St John are 75 to 79 Years (38 | 14.0%) for men and 55 to 59 Years (69 | 20.3%) for women.
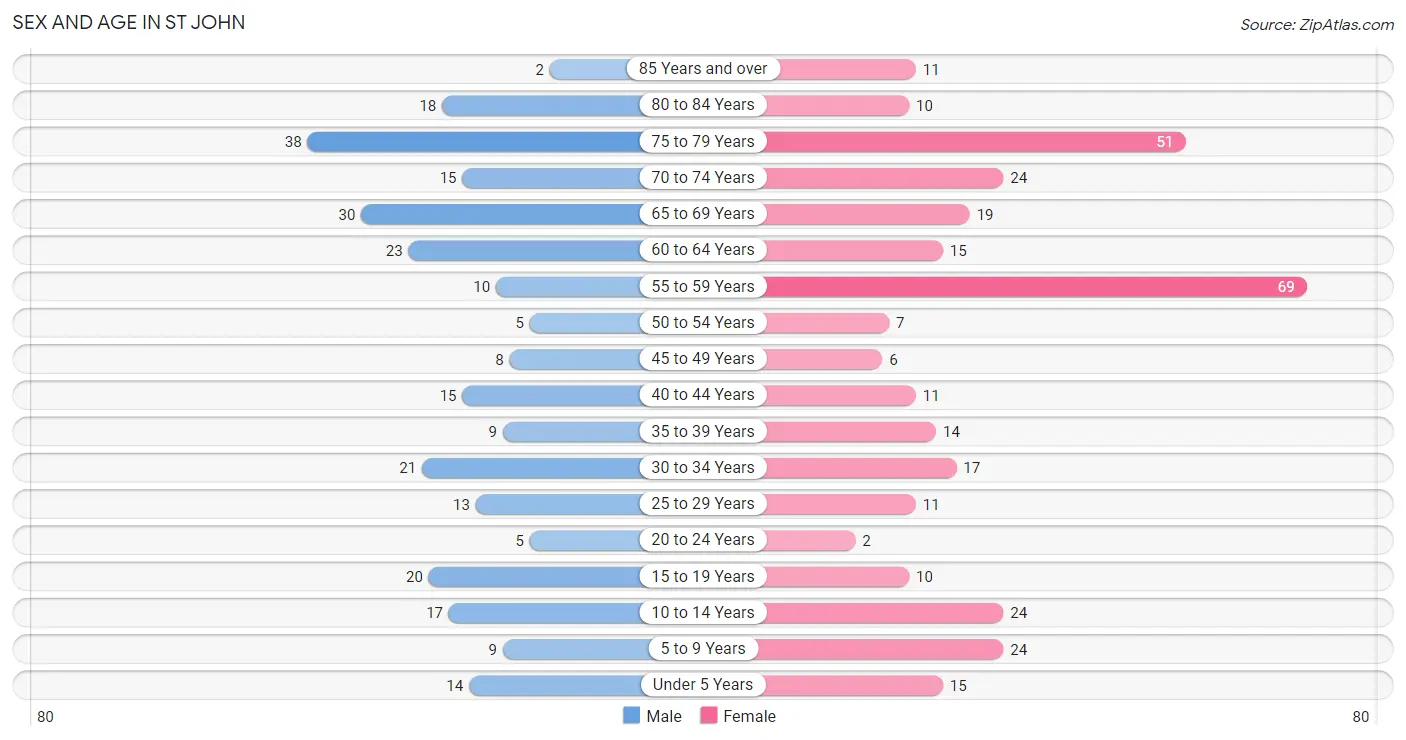
| Age Bracket | Male | Female |
| Under 5 Years | 14 (5.1%) | 15 (4.4%) |
| 5 to 9 Years | 9 (3.3%) | 24 (7.1%) |
| 10 to 14 Years | 17 (6.2%) | 24 (7.1%) |
| 15 to 19 Years | 20 (7.3%) | 10 (2.9%) |
| 20 to 24 Years | 5 (1.8%) | 2 (0.6%) |
| 25 to 29 Years | 13 (4.8%) | 11 (3.2%) |
| 30 to 34 Years | 21 (7.7%) | 17 (5.0%) |
| 35 to 39 Years | 9 (3.3%) | 14 (4.1%) |
| 40 to 44 Years | 15 (5.5%) | 11 (3.2%) |
| 45 to 49 Years | 8 (2.9%) | 6 (1.8%) |
| 50 to 54 Years | 5 (1.8%) | 7 (2.1%) |
| 55 to 59 Years | 10 (3.7%) | 69 (20.3%) |
| 60 to 64 Years | 23 (8.5%) | 15 (4.4%) |
| 65 to 69 Years | 30 (11.0%) | 19 (5.6%) |
| 70 to 74 Years | 15 (5.5%) | 24 (7.1%) |
| 75 to 79 Years | 38 (14.0%) | 51 (15.0%) |
| 80 to 84 Years | 18 (6.6%) | 10 (2.9%) |
| 85 Years and over | 2 (0.7%) | 11 (3.2%) |
| Total | 272 (100.0%) | 340 (100.0%) |
Families and Households in St John
Median Family Size in St John
The median family size in St John is 3.35 persons per family, with single male/father families (2 | 1.4%) accounting for the largest median family size of 3.5 persons per family. On the other hand, single female/mother families (14 | 9.9%) represent the smallest median family size with 3.14 persons per family.
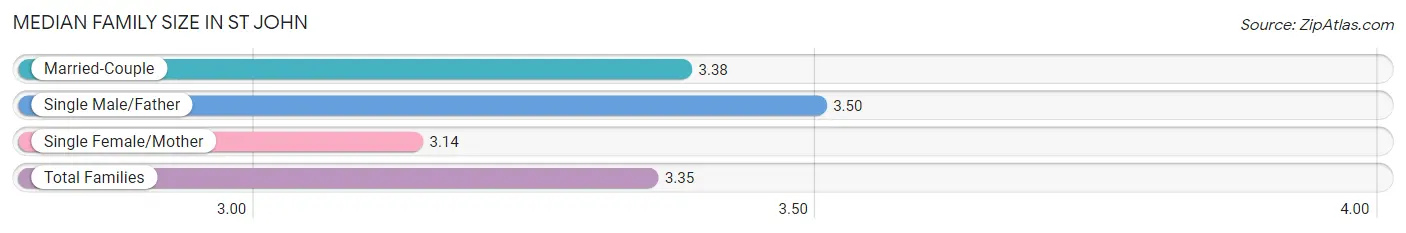
| Family Type | # Families | Family Size |
| Married-Couple | 125 (88.6%) | 3.38 |
| Single Male/Father | 2 (1.4%) | 3.50 |
| Single Female/Mother | 14 (9.9%) | 3.14 |
| Total Families | 141 (100.0%) | 3.35 |
Median Household Size in St John
The median household size in St John is 2.48 persons per household, with single male/father households (2 | 0.8%) accounting for the largest median household size of 4.5 persons per household. non-family households (106 | 42.9%) represent the smallest median household size with 1.06 persons per household.
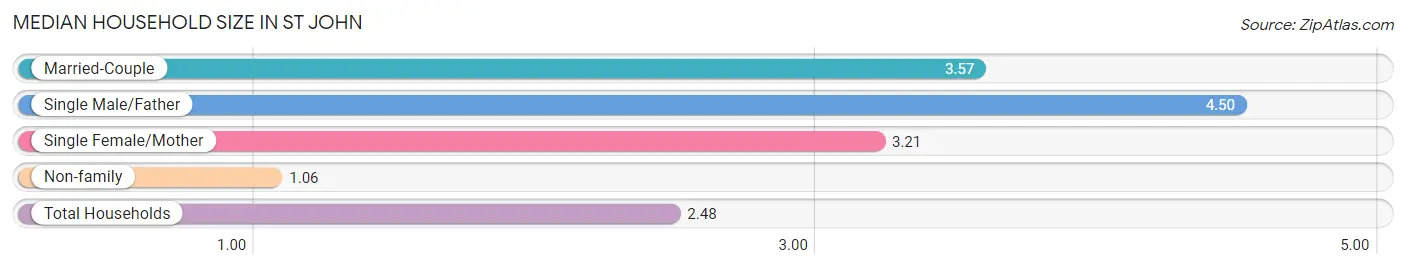
| Household Type | # Households | Household Size |
| Married-Couple | 125 (50.6%) | 3.57 |
| Single Male/Father | 2 (0.8%) | 4.50 |
| Single Female/Mother | 14 (5.7%) | 3.21 |
| Non-family | 106 (42.9%) | 1.06 |
| Total Households | 247 (100.0%) | 2.48 |
Household Size by Marriage Status in St John
Out of a total of 247 households in St John, 141 (57.1%) are family households, while 106 (42.9%) are nonfamily households. The most numerous type of family households are 2-person households, comprising 77, and the most common type of nonfamily households are 1-person households, comprising 97.
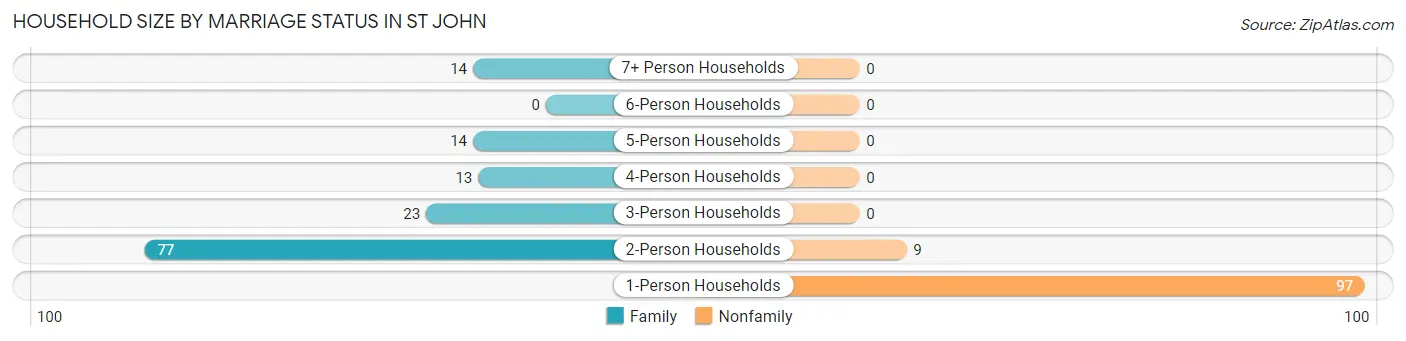
| Household Size | Family Households | Nonfamily Households |
| 1-Person Households | - | 97 (39.3%) |
| 2-Person Households | 77 (31.2%) | 9 (3.6%) |
| 3-Person Households | 23 (9.3%) | 0 (0.0%) |
| 4-Person Households | 13 (5.3%) | 0 (0.0%) |
| 5-Person Households | 14 (5.7%) | 0 (0.0%) |
| 6-Person Households | 0 (0.0%) | 0 (0.0%) |
| 7+ Person Households | 14 (5.7%) | 0 (0.0%) |
| Total | 141 (57.1%) | 106 (42.9%) |
Female Fertility in St John
Fertility by Age in St John
| Age Bracket | Women with Births | Births / 1,000 Women |
| 15 to 19 years | 0 (0.0%) | 0.0 |
| 20 to 34 years | 0 (0.0%) | 0.0 |
| 35 to 50 years | 0 (0.0%) | 0.0 |
| Total | 0 (0.0%) | 0.0 |
Fertility by Age by Marriage Status in St John
| Age Bracket | Married | Unmarried |
| 15 to 19 years | 0 (0.0%) | 0 (0.0%) |
| 20 to 34 years | 0 (0.0%) | 0 (0.0%) |
| 35 to 50 years | 0 (0.0%) | 0 (0.0%) |
| Total | 0 (0.0%) | 0 (0.0%) |
Fertility by Education in St John
| Educational Attainment | Women with Births | Births / 1,000 Women |
| Less than High School | 0 (0.0%) | 0.0 |
| High School Diploma | 0 (0.0%) | 0.0 |
| College or Associate's Degree | 0 (0.0%) | 0.0 |
| Bachelor's Degree | 0 (0.0%) | 0.0 |
| Graduate Degree | 0 (0.0%) | 0.0 |
| Total | 0 (0.0%) | 0.0 |
Fertility by Education by Marriage Status in St John
| Educational Attainment | Married | Unmarried |
| Less than High School | 0 (0.0%) | 0 (0.0%) |
| High School Diploma | 0 (0.0%) | 0 (0.0%) |
| College or Associate's Degree | 0 (0.0%) | 0 (0.0%) |
| Bachelor's Degree | 0 (0.0%) | 0 (0.0%) |
| Graduate Degree | 0 (0.0%) | 0 (0.0%) |
| Total | 0 (0.0%) | 0 (0.0%) |
Employment Characteristics in St John
Employment by Class of Employer in St John
Among the 177 employed individuals in St John, private company employees (95 | 53.7%), local government employees (21 | 11.9%), and federal government employees (17 | 9.6%) make up the most common classes of employment.
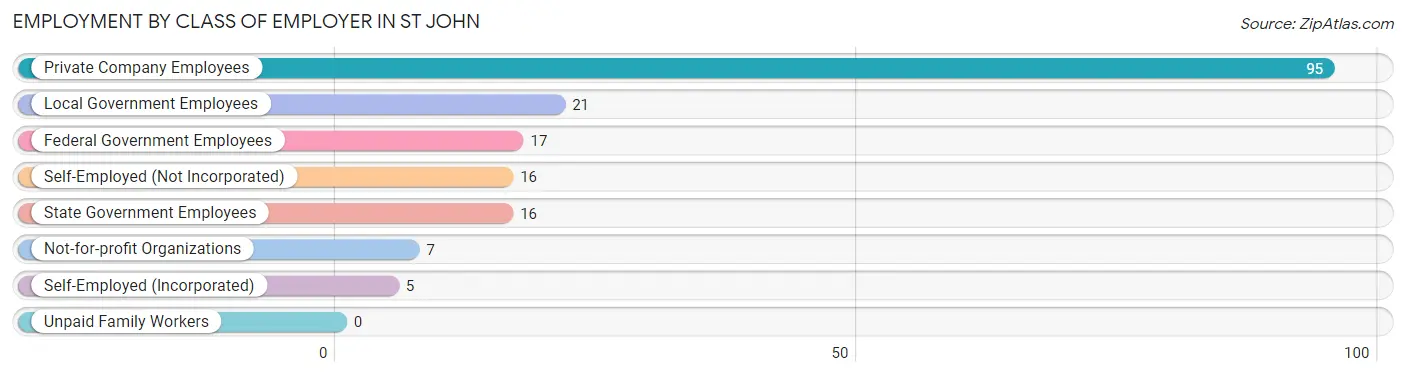
| Employer Class | # Employees | % Employees |
| Private Company Employees | 95 | 53.7% |
| Self-Employed (Incorporated) | 5 | 2.8% |
| Self-Employed (Not Incorporated) | 16 | 9.0% |
| Not-for-profit Organizations | 7 | 4.0% |
| Local Government Employees | 21 | 11.9% |
| State Government Employees | 16 | 9.0% |
| Federal Government Employees | 17 | 9.6% |
| Unpaid Family Workers | 0 | 0.0% |
| Total | 177 | 100.0% |
Employment Status by Age in St John
According to the labor force statistics for St John, out of the total population over 16 years of age (501), 38.5% or 193 individuals are in the labor force, with 8.6% or 17 of them unemployed. The age group with the highest labor force participation rate is 20 to 24 years, with 100.0% or 7 individuals in the labor force. Within the labor force, the 25 to 29 years age range has the highest percentage of unemployed individuals, with 40.9% or 9 of them being unemployed.
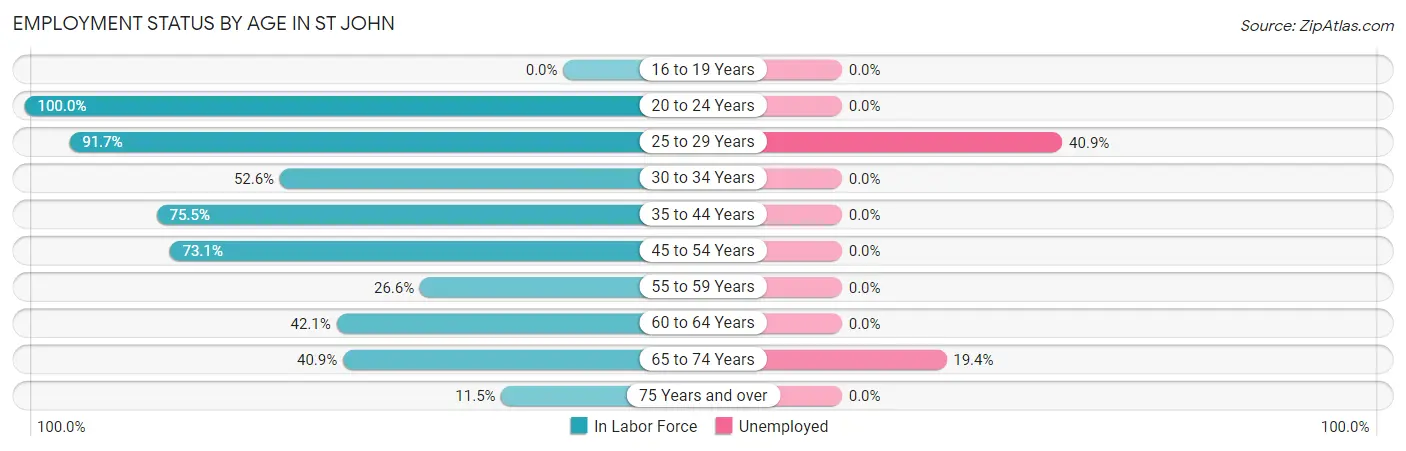
| Age Bracket | In Labor Force | Unemployed |
| 16 to 19 Years | 0 (0.0%) | 0 (0.0%) |
| 20 to 24 Years | 7 (100.0%) | 0 (0.0%) |
| 25 to 29 Years | 22 (91.7%) | 9 (40.9%) |
| 30 to 34 Years | 20 (52.6%) | 0 (0.0%) |
| 35 to 44 Years | 37 (75.5%) | 0 (0.0%) |
| 45 to 54 Years | 19 (73.1%) | 0 (0.0%) |
| 55 to 59 Years | 21 (26.6%) | 0 (0.0%) |
| 60 to 64 Years | 16 (42.1%) | 0 (0.0%) |
| 65 to 74 Years | 36 (40.9%) | 7 (19.4%) |
| 75 Years and over | 15 (11.5%) | 0 (0.0%) |
| Total | 193 (38.5%) | 17 (8.6%) |
Employment Status by Educational Attainment in St John
According to labor force statistics for St John, 53.1% of individuals (135) out of the total population between 25 and 64 years of age (254) are in the labor force, with 7.0% or 9 of them being unemployed. The group with the highest labor force participation rate are those with the educational attainment of bachelor's degree or higher, with 84.2% or 48 individuals in the labor force. Within the labor force, individuals with college / associate degree education have the highest percentage of unemployment, with 14.3% or 10 of them being unemployed.
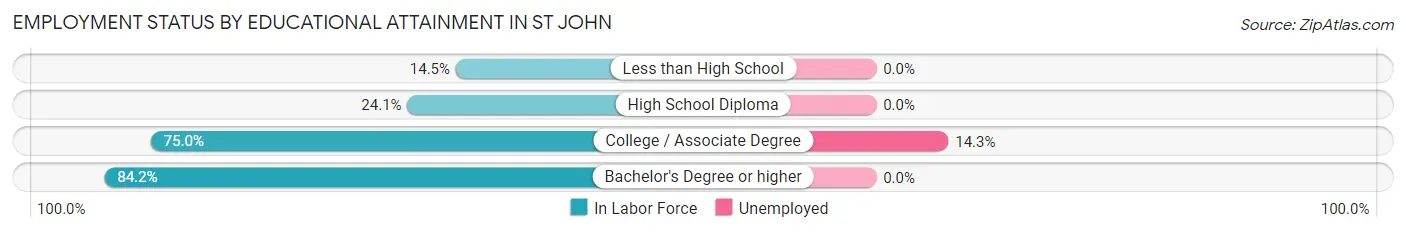
| Educational Attainment | In Labor Force | Unemployed |
| Less than High School | 11 (14.5%) | 0 (0.0%) |
| High School Diploma | 7 (24.1%) | 0 (0.0%) |
| College / Associate Degree | 69 (75.0%) | 13 (14.3%) |
| Bachelor's Degree or higher | 48 (84.2%) | 0 (0.0%) |
| Total | 135 (53.1%) | 18 (7.0%) |
Employment Occupations by Sex in St John
Management, Business, Science and Arts Occupations
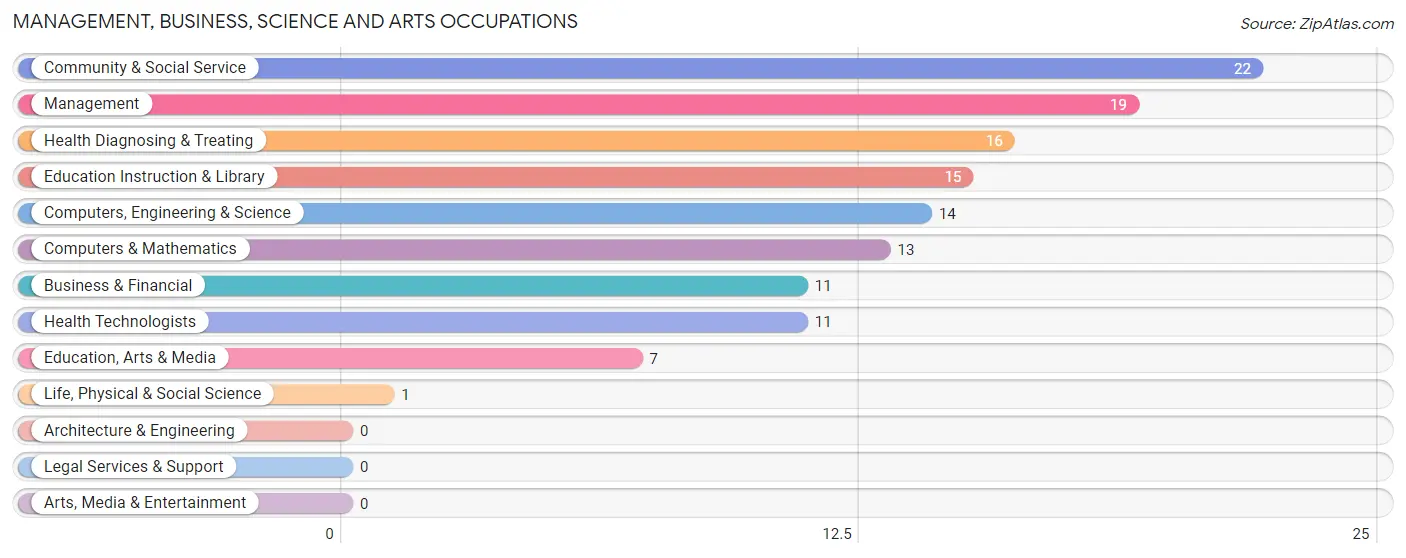
The most common Management, Business, Science and Arts occupations in St John are Community & Social Service (22 | 12.9%), Management (19 | 11.1%), Health Diagnosing & Treating (16 | 9.4%), Education Instruction & Library (15 | 8.8%), and Computers, Engineering & Science (14 | 8.2%).
Management, Business, Science and Arts Occupations by Sex
Within the Management, Business, Science and Arts occupations in St John, the most male-oriented occupations are Education, Arts & Media (100.0%), Management (78.9%), and Computers & Mathematics (69.2%), while the most female-oriented occupations are Life, Physical & Social Science (100.0%), Health Technologists (100.0%), and Health Diagnosing & Treating (87.5%).
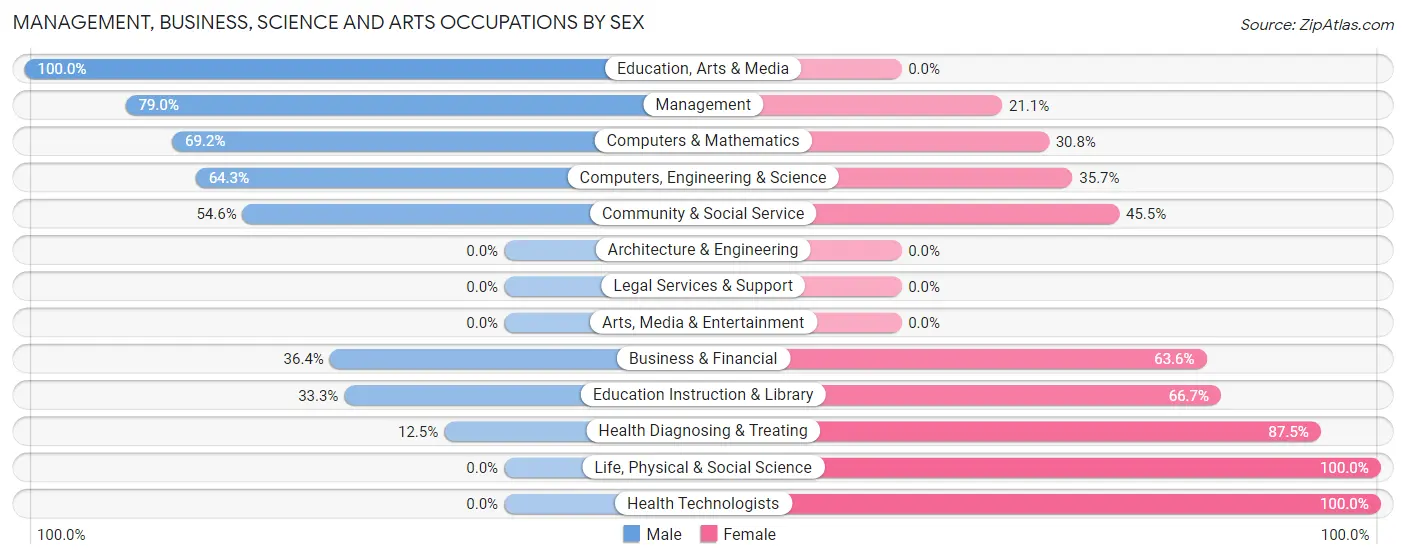
| Occupation | Male | Female |
| Management | 15 (78.9%) | 4 (21.0%) |
| Business & Financial | 4 (36.4%) | 7 (63.6%) |
| Computers, Engineering & Science | 9 (64.3%) | 5 (35.7%) |
| Computers & Mathematics | 9 (69.2%) | 4 (30.8%) |
| Architecture & Engineering | 0 (0.0%) | 0 (0.0%) |
| Life, Physical & Social Science | 0 (0.0%) | 1 (100.0%) |
| Community & Social Service | 12 (54.5%) | 10 (45.5%) |
| Education, Arts & Media | 7 (100.0%) | 0 (0.0%) |
| Legal Services & Support | 0 (0.0%) | 0 (0.0%) |
| Education Instruction & Library | 5 (33.3%) | 10 (66.7%) |
| Arts, Media & Entertainment | 0 (0.0%) | 0 (0.0%) |
| Health Diagnosing & Treating | 2 (12.5%) | 14 (87.5%) |
| Health Technologists | 0 (0.0%) | 11 (100.0%) |
| Total (Category) | 42 (51.2%) | 40 (48.8%) |
| Total (Overall) | 97 (56.7%) | 74 (43.3%) |
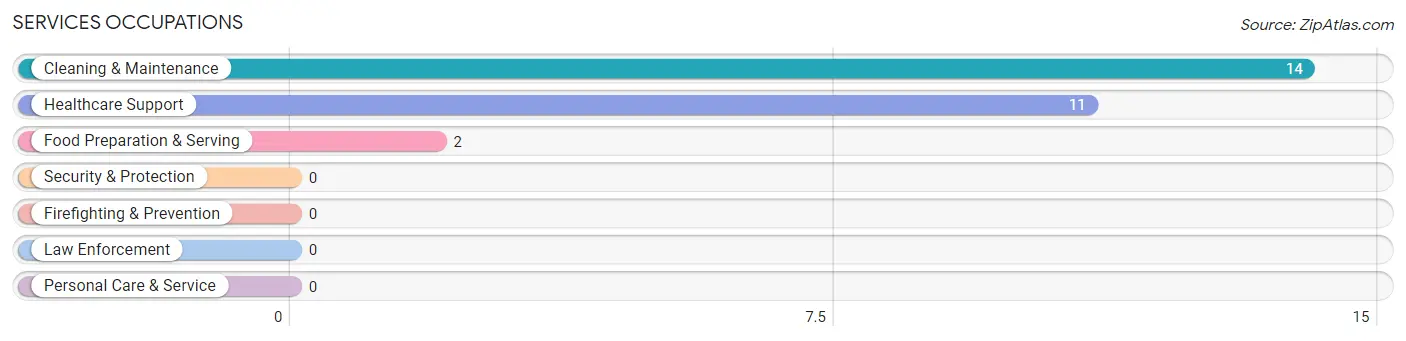
Services Occupations
The most common Services occupations in St John are Cleaning & Maintenance (14 | 8.2%), Healthcare Support (11 | 6.4%), and Food Preparation & Serving (2 | 1.2%).
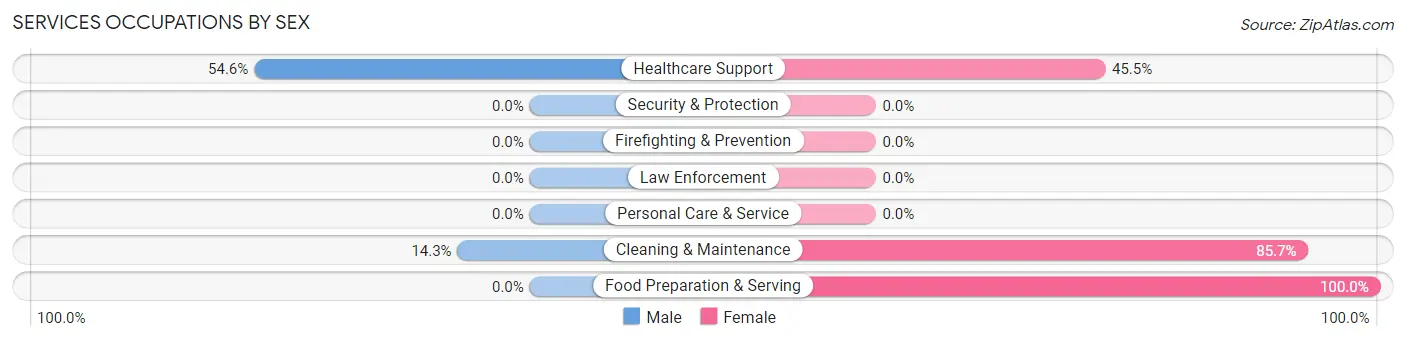
Services Occupations by Sex
Within the Services occupations in St John, the most male-oriented occupations are Healthcare Support (54.5%), and Cleaning & Maintenance (14.3%), while the most female-oriented occupations are Food Preparation & Serving (100.0%), Cleaning & Maintenance (85.7%), and Healthcare Support (45.5%).
| Occupation | Male | Female |
| Healthcare Support | 6 (54.5%) | 5 (45.5%) |
| Security & Protection | 0 (0.0%) | 0 (0.0%) |
| Firefighting & Prevention | 0 (0.0%) | 0 (0.0%) |
| Law Enforcement | 0 (0.0%) | 0 (0.0%) |
| Food Preparation & Serving | 0 (0.0%) | 2 (100.0%) |
| Cleaning & Maintenance | 2 (14.3%) | 12 (85.7%) |
| Personal Care & Service | 0 (0.0%) | 0 (0.0%) |
| Total (Category) | 8 (29.6%) | 19 (70.4%) |
| Total (Overall) | 97 (56.7%) | 74 (43.3%) |
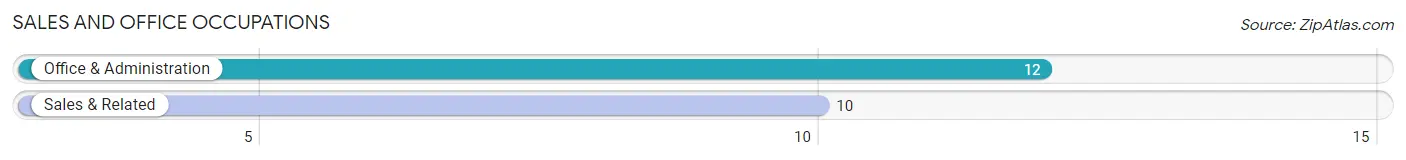
Sales and Office Occupations
The most common Sales and Office occupations in St John are Office & Administration (12 | 7.0%), and Sales & Related (10 | 5.9%).
Sales and Office Occupations by Sex
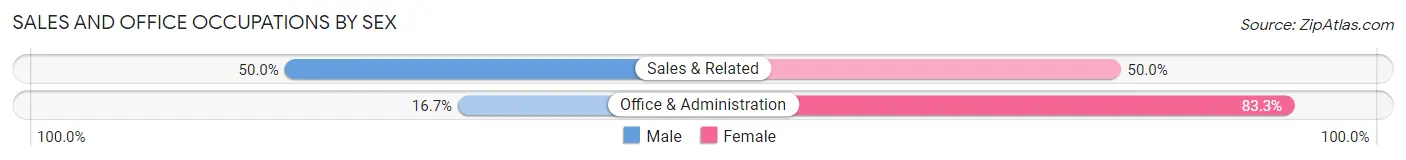
| Occupation | Male | Female |
| Sales & Related | 5 (50.0%) | 5 (50.0%) |
| Office & Administration | 2 (16.7%) | 10 (83.3%) |
| Total (Category) | 7 (31.8%) | 15 (68.2%) |
| Total (Overall) | 97 (56.7%) | 74 (43.3%) |
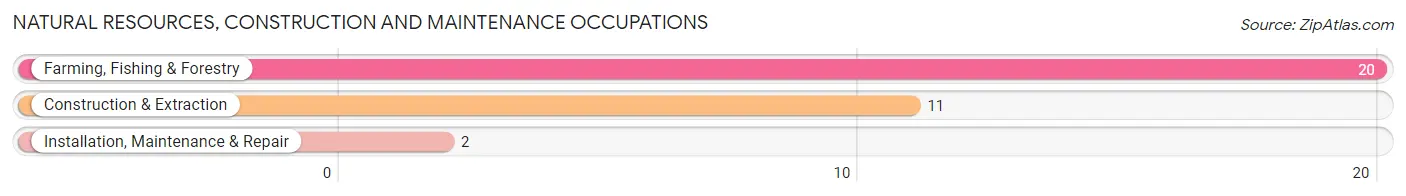
Natural Resources, Construction and Maintenance Occupations
The most common Natural Resources, Construction and Maintenance occupations in St John are Farming, Fishing & Forestry (20 | 11.7%), Construction & Extraction (11 | 6.4%), and Installation, Maintenance & Repair (2 | 1.2%).
Natural Resources, Construction and Maintenance Occupations by Sex
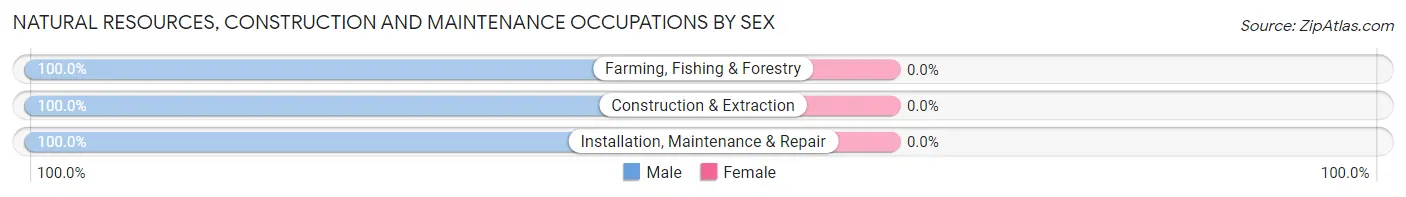
| Occupation | Male | Female |
| Farming, Fishing & Forestry | 20 (100.0%) | 0 (0.0%) |
| Construction & Extraction | 11 (100.0%) | 0 (0.0%) |
| Installation, Maintenance & Repair | 2 (100.0%) | 0 (0.0%) |
| Total (Category) | 33 (100.0%) | 0 (0.0%) |
| Total (Overall) | 97 (56.7%) | 74 (43.3%) |
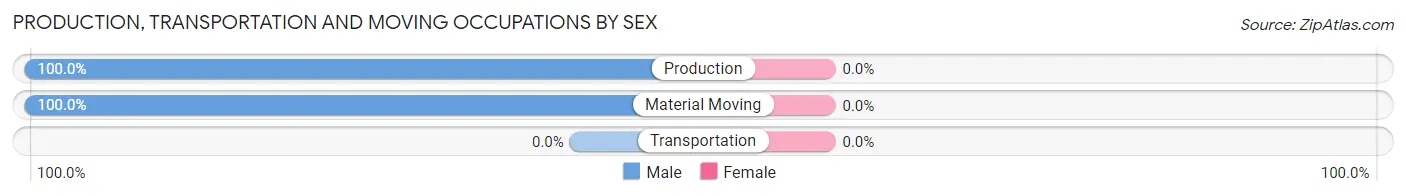
Production, Transportation and Moving Occupations
The most common Production, Transportation and Moving occupations in St John are Production (5 | 2.9%), and Material Moving (2 | 1.2%).
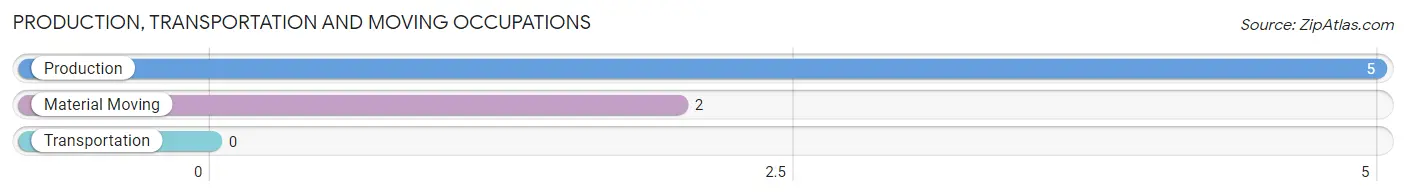
Production, Transportation and Moving Occupations by Sex
| Occupation | Male | Female |
| Production | 5 (100.0%) | 0 (0.0%) |
| Transportation | 0 (0.0%) | 0 (0.0%) |
| Material Moving | 2 (100.0%) | 0 (0.0%) |
| Total (Category) | 7 (100.0%) | 0 (0.0%) |
| Total (Overall) | 97 (56.7%) | 74 (43.3%) |
Employment Industries by Sex in St John
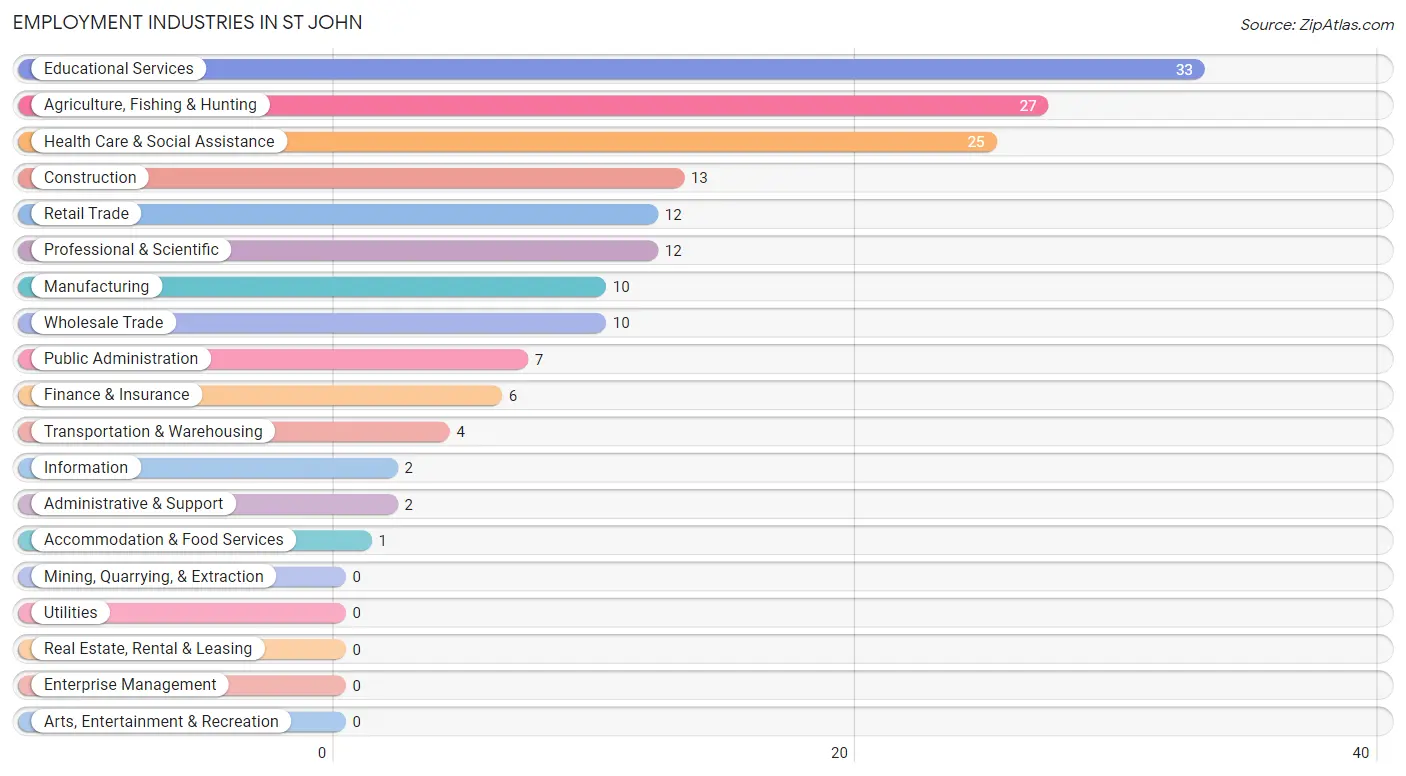
Employment Industries in St John
The major employment industries in St John include Educational Services (33 | 19.3%), Agriculture, Fishing & Hunting (27 | 15.8%), Health Care & Social Assistance (25 | 14.6%), Construction (13 | 7.6%), and Retail Trade (12 | 7.0%).
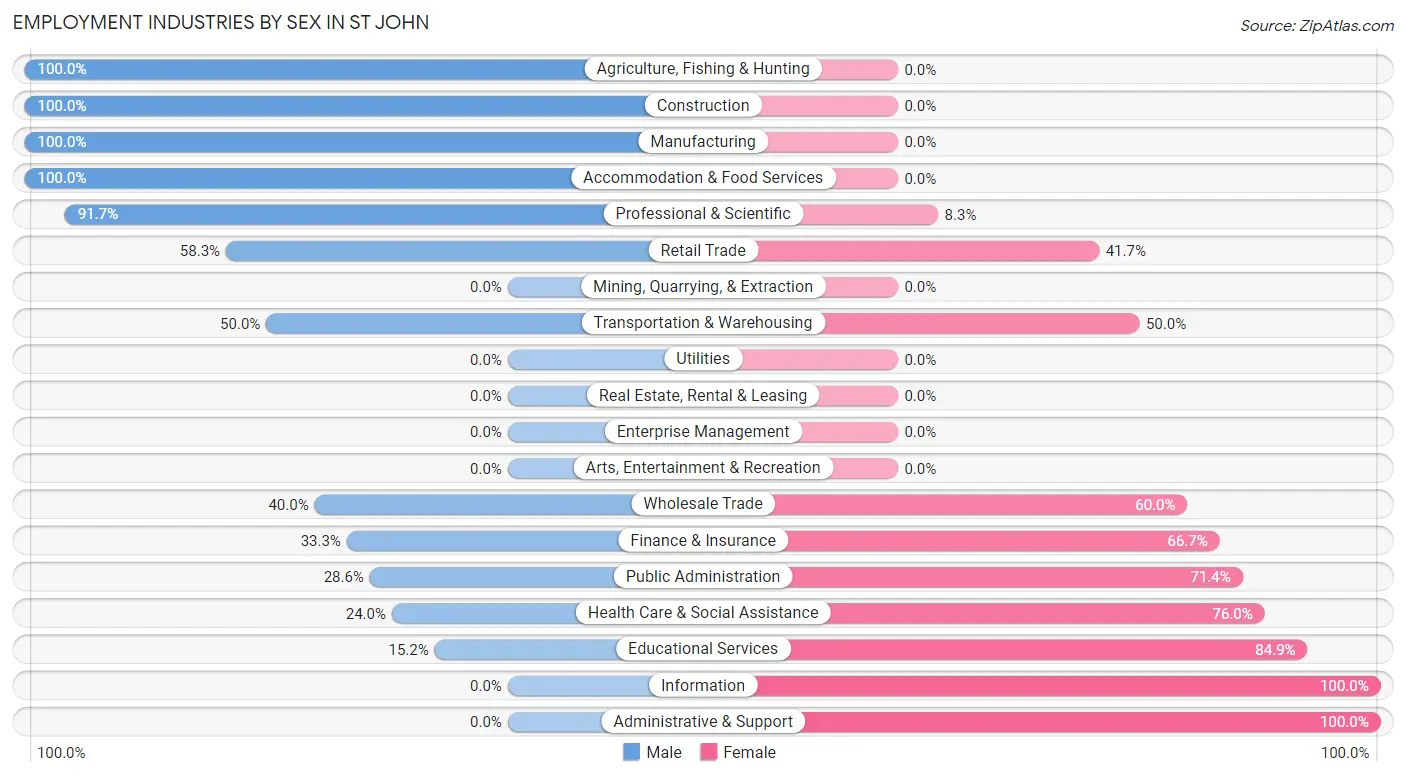
Employment Industries by Sex in St John
The St John industries that see more men than women are Agriculture, Fishing & Hunting (100.0%), Construction (100.0%), and Manufacturing (100.0%), whereas the industries that tend to have a higher number of women are Information (100.0%), Administrative & Support (100.0%), and Educational Services (84.9%).
| Industry | Male | Female |
| Agriculture, Fishing & Hunting | 27 (100.0%) | 0 (0.0%) |
| Mining, Quarrying, & Extraction | 0 (0.0%) | 0 (0.0%) |
| Construction | 13 (100.0%) | 0 (0.0%) |
| Manufacturing | 10 (100.0%) | 0 (0.0%) |
| Wholesale Trade | 4 (40.0%) | 6 (60.0%) |
| Retail Trade | 7 (58.3%) | 5 (41.7%) |
| Transportation & Warehousing | 2 (50.0%) | 2 (50.0%) |
| Utilities | 0 (0.0%) | 0 (0.0%) |
| Information | 0 (0.0%) | 2 (100.0%) |
| Finance & Insurance | 2 (33.3%) | 4 (66.7%) |
| Real Estate, Rental & Leasing | 0 (0.0%) | 0 (0.0%) |
| Professional & Scientific | 11 (91.7%) | 1 (8.3%) |
| Enterprise Management | 0 (0.0%) | 0 (0.0%) |
| Administrative & Support | 0 (0.0%) | 2 (100.0%) |
| Educational Services | 5 (15.1%) | 28 (84.9%) |
| Health Care & Social Assistance | 6 (24.0%) | 19 (76.0%) |
| Arts, Entertainment & Recreation | 0 (0.0%) | 0 (0.0%) |
| Accommodation & Food Services | 1 (100.0%) | 0 (0.0%) |
| Public Administration | 2 (28.6%) | 5 (71.4%) |
| Total | 97 (56.7%) | 74 (43.3%) |
Education in St John
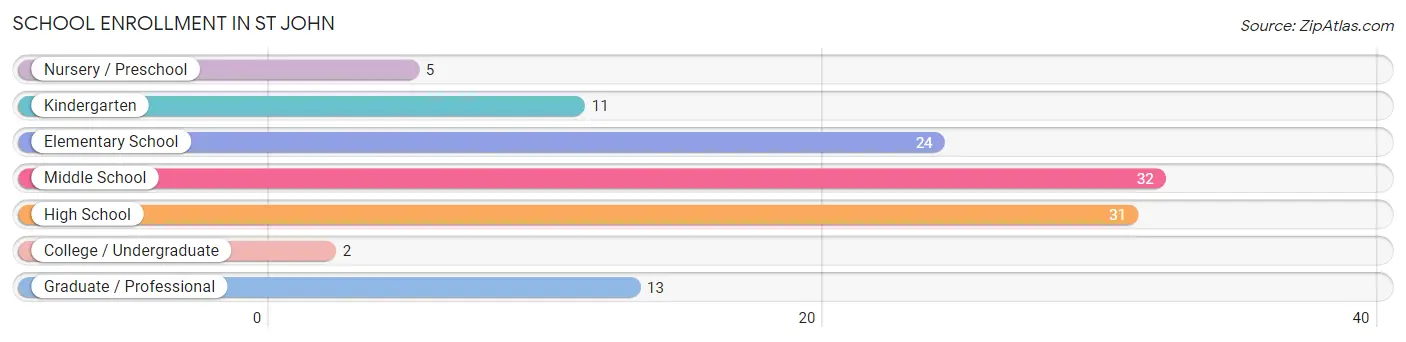
School Enrollment in St John
The most common levels of schooling among the 118 students in St John are middle school (32 | 27.1%), high school (31 | 26.3%), and elementary school (24 | 20.3%).
| School Level | # Students | % Students |
| Nursery / Preschool | 5 | 4.2% |
| Kindergarten | 11 | 9.3% |
| Elementary School | 24 | 20.3% |
| Middle School | 32 | 27.1% |
| High School | 31 | 26.3% |
| College / Undergraduate | 2 | 1.7% |
| Graduate / Professional | 13 | 11.0% |
| Total | 118 | 100.0% |
School Enrollment by Age by Funding Source in St John
Out of a total of 118 students who are enrolled in schools in St John, 2 (1.7%) attend a private institution, while the remaining 116 (98.3%) are enrolled in public schools. The age group of 35 years and over has the highest likelihood of being enrolled in private schools, with 2 (20.0% in the age bracket) enrolled. Conversely, the age group of 3 to 4 year olds has the lowest likelihood of being enrolled in a private school, with 5 (100.0% in the age bracket) attending a public institution.
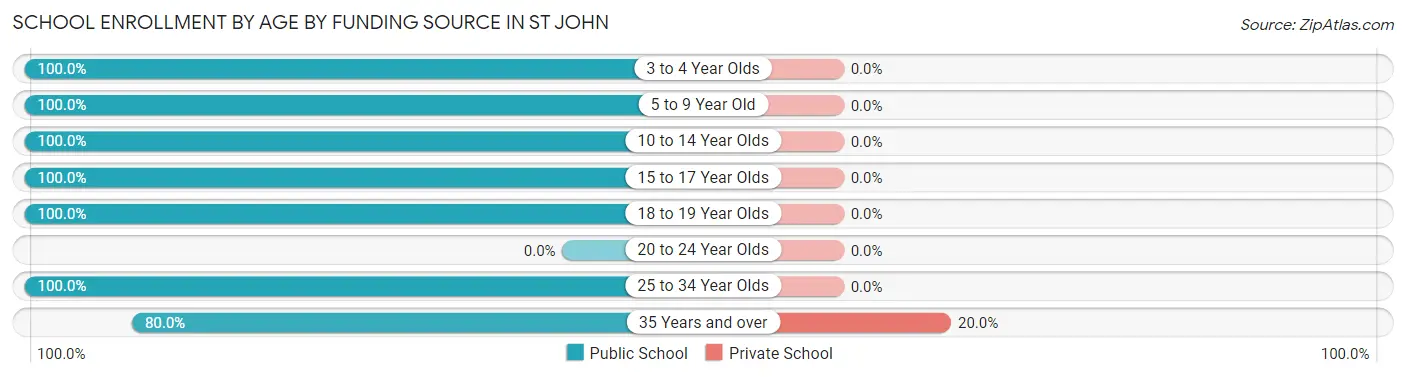
| Age Bracket | Public School | Private School |
| 3 to 4 Year Olds | 5 (100.0%) | 0 (0.0%) |
| 5 to 9 Year Old | 33 (100.0%) | 0 (0.0%) |
| 10 to 14 Year Olds | 35 (100.0%) | 0 (0.0%) |
| 15 to 17 Year Olds | 24 (100.0%) | 0 (0.0%) |
| 18 to 19 Year Olds | 6 (100.0%) | 0 (0.0%) |
| 20 to 24 Year Olds | 0 (0.0%) | 0 (0.0%) |
| 25 to 34 Year Olds | 5 (100.0%) | 0 (0.0%) |
| 35 Years and over | 8 (80.0%) | 2 (20.0%) |
| Total | 116 (98.3%) | 2 (1.7%) |
Educational Attainment by Field of Study in St John
Education (53 | 36.5%), science & technology (20 | 13.8%), bio, nature & agricultural (17 | 11.7%), business (16 | 11.0%), and liberal arts & history (12 | 8.3%) are the most common fields of study among 145 individuals in St John who have obtained a bachelor's degree or higher.
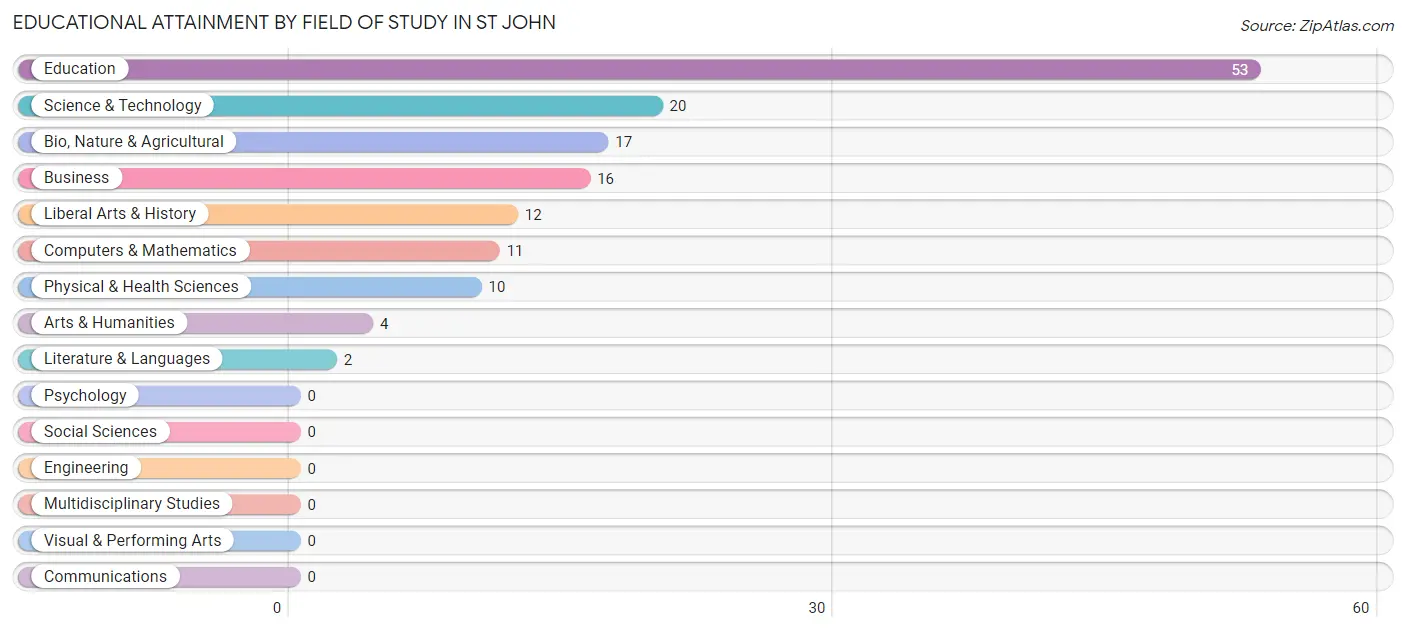
| Field of Study | # Graduates | % Graduates |
| Computers & Mathematics | 11 | 7.6% |
| Bio, Nature & Agricultural | 17 | 11.7% |
| Physical & Health Sciences | 10 | 6.9% |
| Psychology | 0 | 0.0% |
| Social Sciences | 0 | 0.0% |
| Engineering | 0 | 0.0% |
| Multidisciplinary Studies | 0 | 0.0% |
| Science & Technology | 20 | 13.8% |
| Business | 16 | 11.0% |
| Education | 53 | 36.5% |
| Literature & Languages | 2 | 1.4% |
| Liberal Arts & History | 12 | 8.3% |
| Visual & Performing Arts | 0 | 0.0% |
| Communications | 0 | 0.0% |
| Arts & Humanities | 4 | 2.8% |
| Total | 145 | 100.0% |
Transportation & Commute in St John
Vehicle Availability by Sex in St John
The most prevalent vehicle ownership categories in St John are males with 2 vehicles (44, accounting for 42.7%) and females with 2 vehicles (32, making up 59.5%).
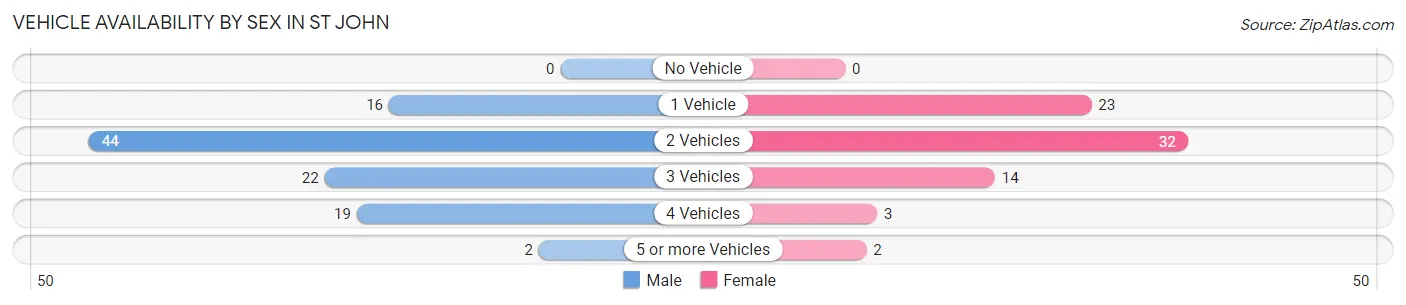
| Vehicles Available | Male | Female |
| No Vehicle | 0 (0.0%) | 0 (0.0%) |
| 1 Vehicle | 16 (15.5%) | 23 (31.1%) |
| 2 Vehicles | 44 (42.7%) | 32 (43.2%) |
| 3 Vehicles | 22 (21.4%) | 14 (18.9%) |
| 4 Vehicles | 19 (18.4%) | 3 (4.1%) |
| 5 or more Vehicles | 2 (1.9%) | 2 (2.7%) |
| Total | 103 (100.0%) | 74 (100.0%) |
Commute Time in St John
The most frequently occuring commute durations in St John are less than 5 minutes (37 commuters, 25.7%), 5 to 9 minutes (32 commuters, 22.2%), and 30 to 34 minutes (29 commuters, 20.1%).
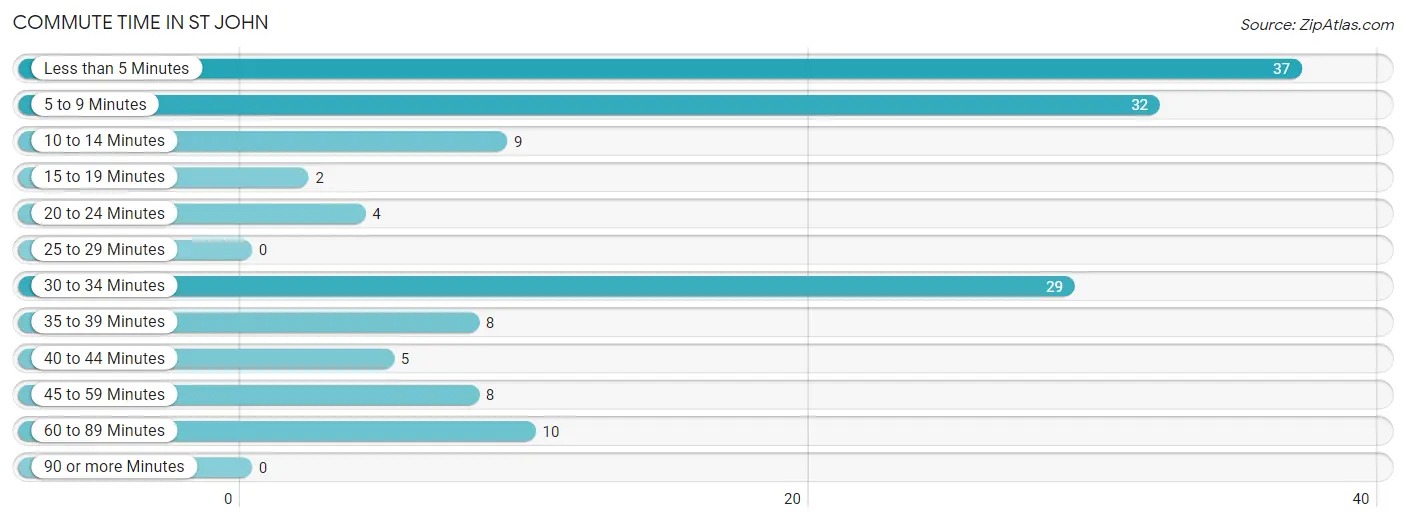
| Commute Time | # Commuters | % Commuters |
| Less than 5 Minutes | 37 | 25.7% |
| 5 to 9 Minutes | 32 | 22.2% |
| 10 to 14 Minutes | 9 | 6.2% |
| 15 to 19 Minutes | 2 | 1.4% |
| 20 to 24 Minutes | 4 | 2.8% |
| 25 to 29 Minutes | 0 | 0.0% |
| 30 to 34 Minutes | 29 | 20.1% |
| 35 to 39 Minutes | 8 | 5.6% |
| 40 to 44 Minutes | 5 | 3.5% |
| 45 to 59 Minutes | 8 | 5.6% |
| 60 to 89 Minutes | 10 | 6.9% |
| 90 or more Minutes | 0 | 0.0% |
Commute Time by Sex in St John
The most common commute times in St John are less than 5 minutes (20 commuters, 26.7%) for males and 5 to 9 minutes (18 commuters, 26.1%) for females.
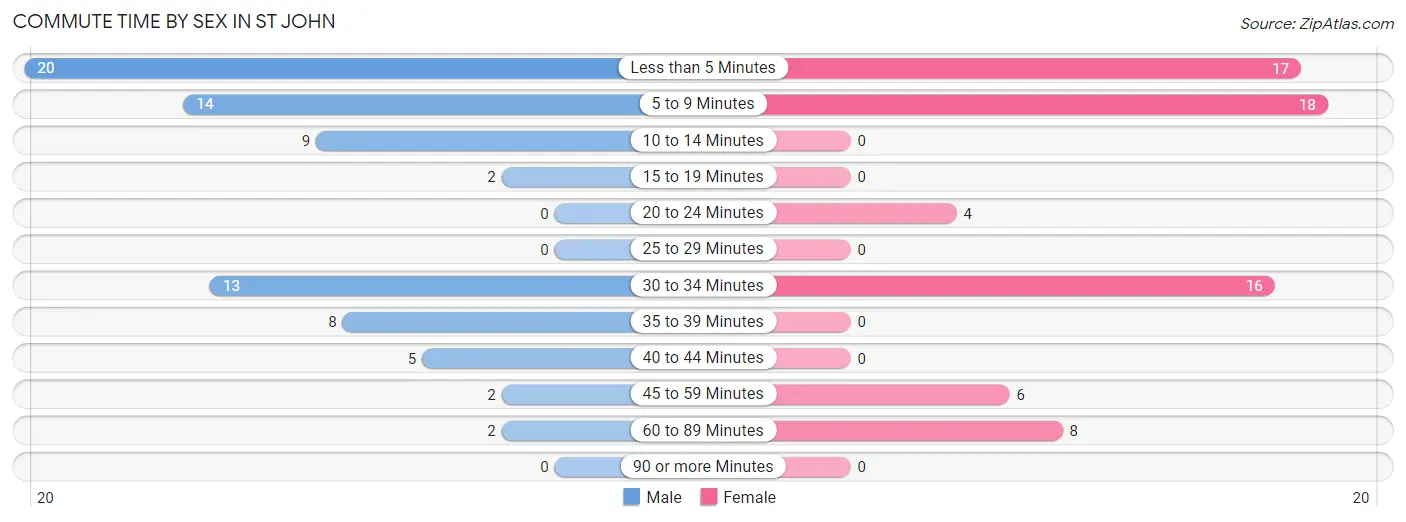
| Commute Time | Male | Female |
| Less than 5 Minutes | 20 (26.7%) | 17 (24.6%) |
| 5 to 9 Minutes | 14 (18.7%) | 18 (26.1%) |
| 10 to 14 Minutes | 9 (12.0%) | 0 (0.0%) |
| 15 to 19 Minutes | 2 (2.7%) | 0 (0.0%) |
| 20 to 24 Minutes | 0 (0.0%) | 4 (5.8%) |
| 25 to 29 Minutes | 0 (0.0%) | 0 (0.0%) |
| 30 to 34 Minutes | 13 (17.3%) | 16 (23.2%) |
| 35 to 39 Minutes | 8 (10.7%) | 0 (0.0%) |
| 40 to 44 Minutes | 5 (6.7%) | 0 (0.0%) |
| 45 to 59 Minutes | 2 (2.7%) | 6 (8.7%) |
| 60 to 89 Minutes | 2 (2.7%) | 8 (11.6%) |
| 90 or more Minutes | 0 (0.0%) | 0 (0.0%) |
Time of Departure to Work by Sex in St John
The most frequent times of departure to work in St John are 7:00 AM to 7:29 AM (15, 20.0%) for males and 7:30 AM to 7:59 AM (15, 21.7%) for females.
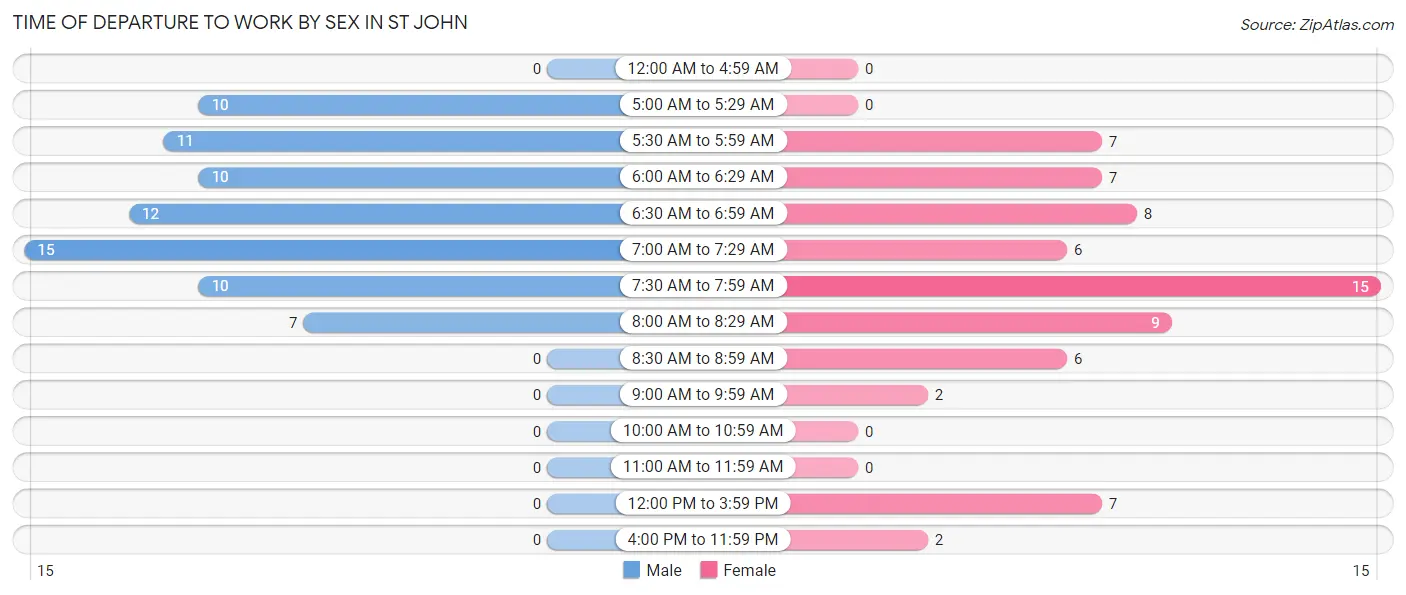
| Time of Departure | Male | Female |
| 12:00 AM to 4:59 AM | 0 (0.0%) | 0 (0.0%) |
| 5:00 AM to 5:29 AM | 10 (13.3%) | 0 (0.0%) |
| 5:30 AM to 5:59 AM | 11 (14.7%) | 7 (10.1%) |
| 6:00 AM to 6:29 AM | 10 (13.3%) | 7 (10.1%) |
| 6:30 AM to 6:59 AM | 12 (16.0%) | 8 (11.6%) |
| 7:00 AM to 7:29 AM | 15 (20.0%) | 6 (8.7%) |
| 7:30 AM to 7:59 AM | 10 (13.3%) | 15 (21.7%) |
| 8:00 AM to 8:29 AM | 7 (9.3%) | 9 (13.0%) |
| 8:30 AM to 8:59 AM | 0 (0.0%) | 6 (8.7%) |
| 9:00 AM to 9:59 AM | 0 (0.0%) | 2 (2.9%) |
| 10:00 AM to 10:59 AM | 0 (0.0%) | 0 (0.0%) |
| 11:00 AM to 11:59 AM | 0 (0.0%) | 0 (0.0%) |
| 12:00 PM to 3:59 PM | 0 (0.0%) | 7 (10.1%) |
| 4:00 PM to 11:59 PM | 0 (0.0%) | 2 (2.9%) |
| Total | 75 (100.0%) | 69 (100.0%) |
Housing Occupancy in St John
Occupancy by Ownership in St John
Of the total 247 dwellings in St John, owner-occupied units account for 190 (76.9%), while renter-occupied units make up 57 (23.1%).
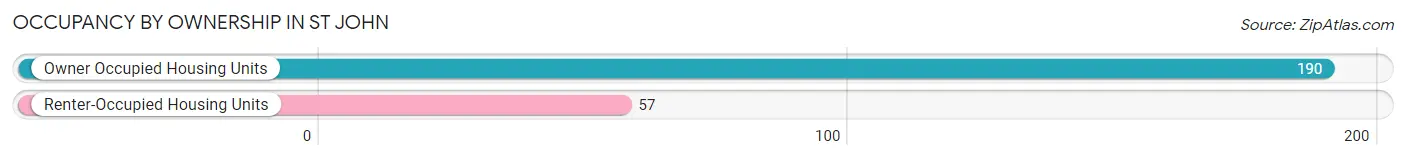
| Occupancy | # Housing Units | % Housing Units |
| Owner Occupied Housing Units | 190 | 76.9% |
| Renter-Occupied Housing Units | 57 | 23.1% |
| Total Occupied Housing Units | 247 | 100.0% |
Occupancy by Household Size in St John
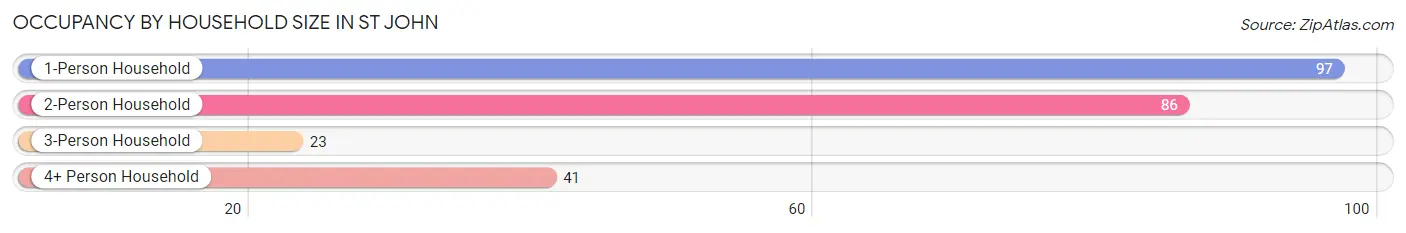
| Household Size | # Housing Units | % Housing Units |
| 1-Person Household | 97 | 39.3% |
| 2-Person Household | 86 | 34.8% |
| 3-Person Household | 23 | 9.3% |
| 4+ Person Household | 41 | 16.6% |
| Total Housing Units | 247 | 100.0% |
Occupancy by Ownership by Household Size in St John
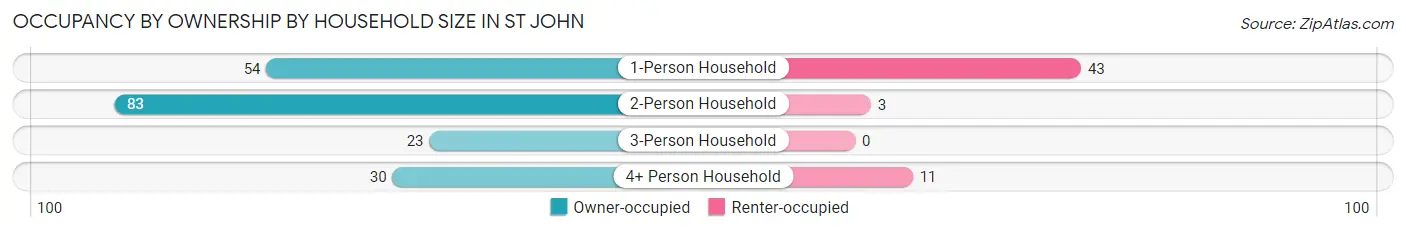
| Household Size | Owner-occupied | Renter-occupied |
| 1-Person Household | 54 (55.7%) | 43 (44.3%) |
| 2-Person Household | 83 (96.5%) | 3 (3.5%) |
| 3-Person Household | 23 (100.0%) | 0 (0.0%) |
| 4+ Person Household | 30 (73.2%) | 11 (26.8%) |
| Total Housing Units | 190 (76.9%) | 57 (23.1%) |
Occupancy by Educational Attainment in St John
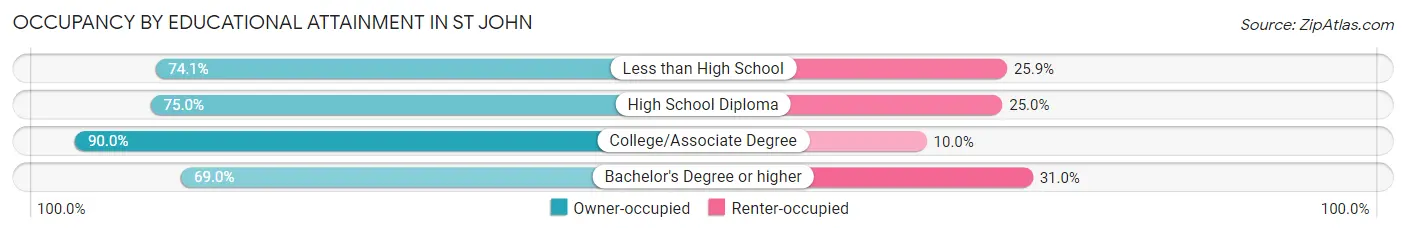
| Household Size | Owner-occupied | Renter-occupied |
| Less than High School | 40 (74.1%) | 14 (25.9%) |
| High School Diploma | 27 (75.0%) | 9 (25.0%) |
| College/Associate Degree | 63 (90.0%) | 7 (10.0%) |
| Bachelor's Degree or higher | 60 (69.0%) | 27 (31.0%) |
Occupancy by Age of Householder in St John
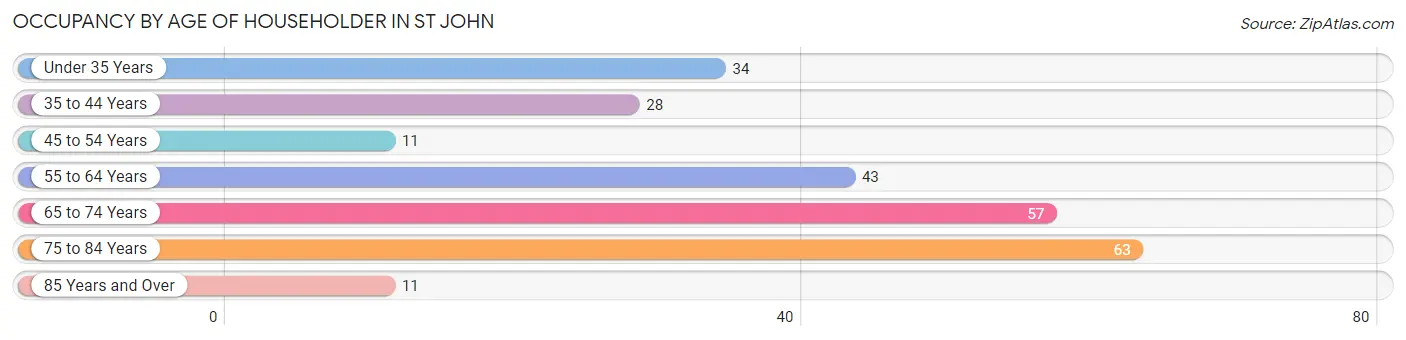
| Age Bracket | # Households | % Households |
| Under 35 Years | 34 | 13.8% |
| 35 to 44 Years | 28 | 11.3% |
| 45 to 54 Years | 11 | 4.4% |
| 55 to 64 Years | 43 | 17.4% |
| 65 to 74 Years | 57 | 23.1% |
| 75 to 84 Years | 63 | 25.5% |
| 85 Years and Over | 11 | 4.4% |
| Total | 247 | 100.0% |
Housing Finances in St John
Median Income by Occupancy in St John
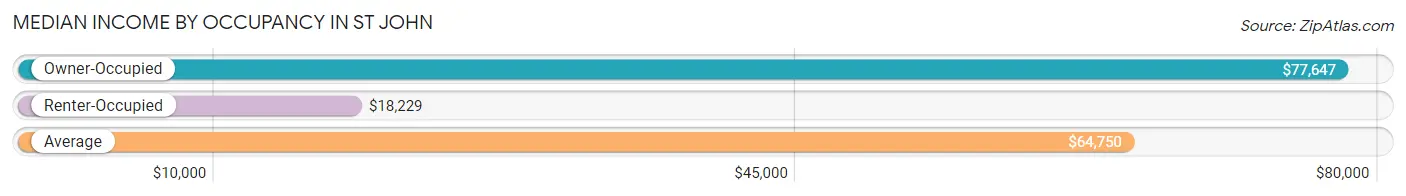
| Occupancy Type | # Households | Median Income |
| Owner-Occupied | 190 (76.9%) | $77,647 |
| Renter-Occupied | 57 (23.1%) | $18,229 |
| Average | 247 (100.0%) | $64,750 |
Occupancy by Householder Income Bracket in St John
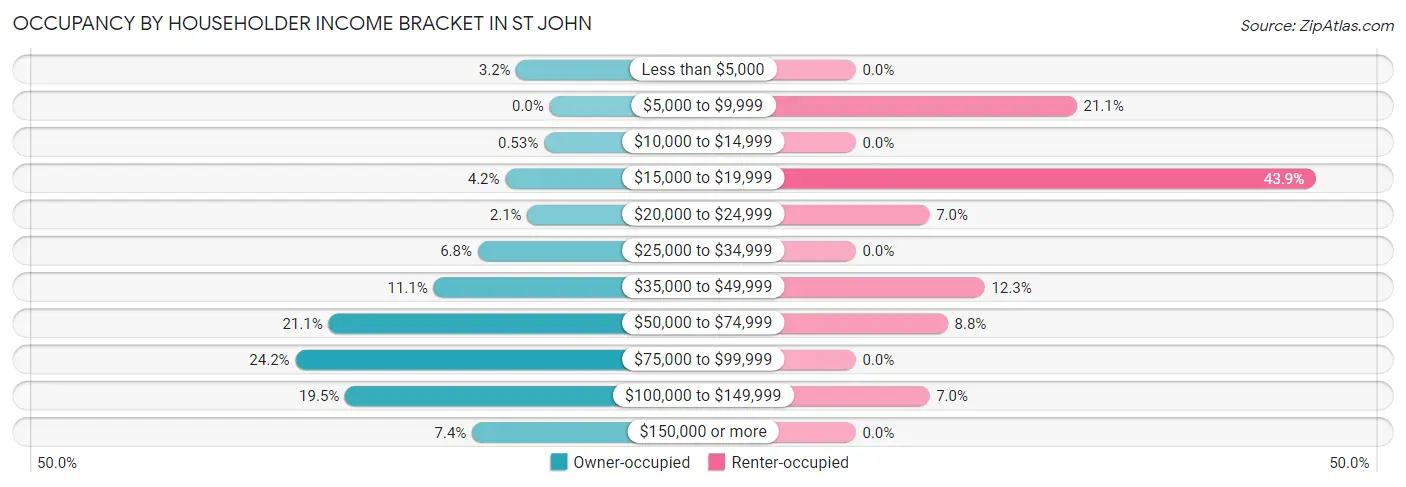
| Income Bracket | Owner-occupied | Renter-occupied |
| Less than $5,000 | 6 (3.2%) | 0 (0.0%) |
| $5,000 to $9,999 | 0 (0.0%) | 12 (21.0%) |
| $10,000 to $14,999 | 1 (0.5%) | 0 (0.0%) |
| $15,000 to $19,999 | 8 (4.2%) | 25 (43.9%) |
| $20,000 to $24,999 | 4 (2.1%) | 4 (7.0%) |
| $25,000 to $34,999 | 13 (6.8%) | 0 (0.0%) |
| $35,000 to $49,999 | 21 (11.1%) | 7 (12.3%) |
| $50,000 to $74,999 | 40 (21.0%) | 5 (8.8%) |
| $75,000 to $99,999 | 46 (24.2%) | 0 (0.0%) |
| $100,000 to $149,999 | 37 (19.5%) | 4 (7.0%) |
| $150,000 or more | 14 (7.4%) | 0 (0.0%) |
| Total | 190 (100.0%) | 57 (100.0%) |
Monthly Housing Cost Tiers in St John
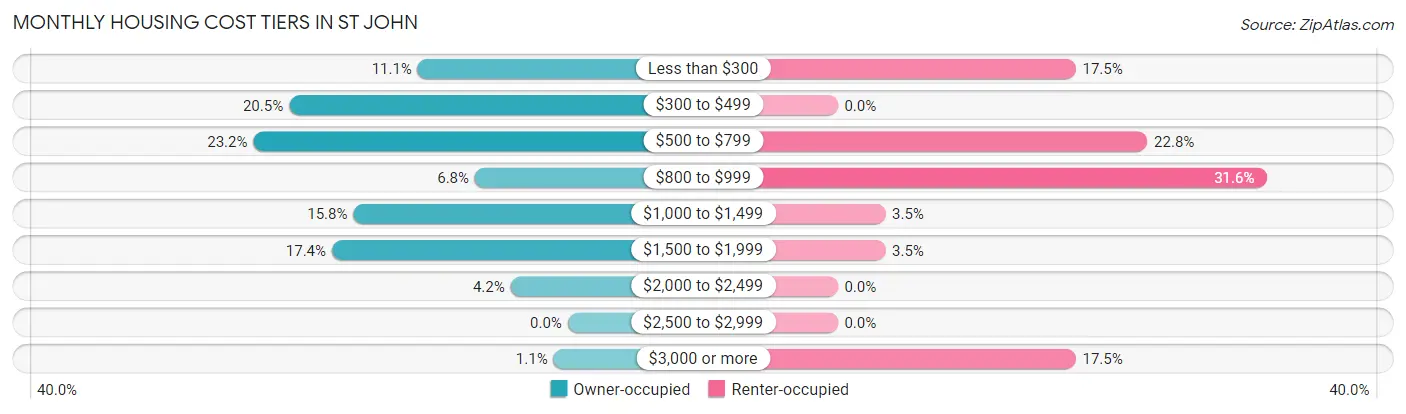
| Monthly Cost | Owner-occupied | Renter-occupied |
| Less than $300 | 21 (11.1%) | 10 (17.5%) |
| $300 to $499 | 39 (20.5%) | 0 (0.0%) |
| $500 to $799 | 44 (23.2%) | 13 (22.8%) |
| $800 to $999 | 13 (6.8%) | 18 (31.6%) |
| $1,000 to $1,499 | 30 (15.8%) | 2 (3.5%) |
| $1,500 to $1,999 | 33 (17.4%) | 2 (3.5%) |
| $2,000 to $2,499 | 8 (4.2%) | 0 (0.0%) |
| $2,500 to $2,999 | 0 (0.0%) | 0 (0.0%) |
| $3,000 or more | 2 (1.1%) | 10 (17.5%) |
| Total | 190 (100.0%) | 57 (100.0%) |
Physical Housing Characteristics in St John
Housing Structures in St John
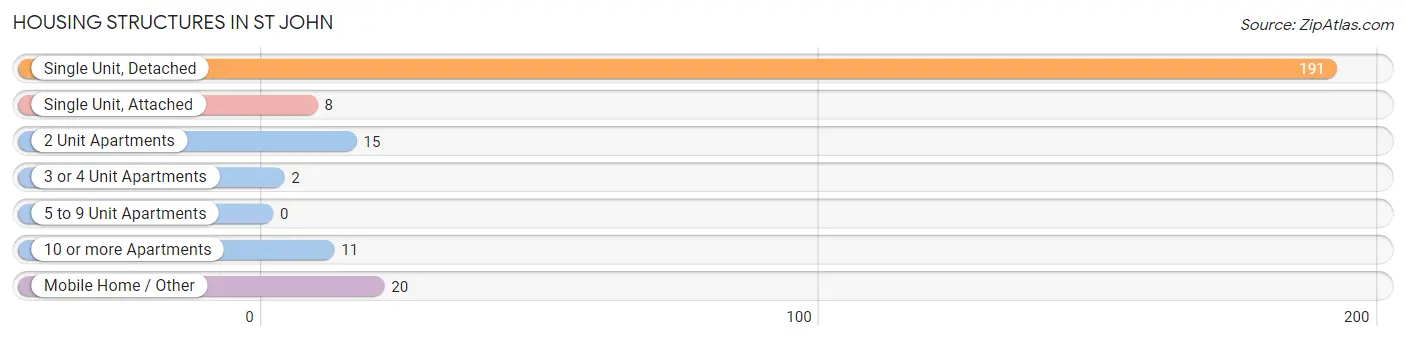
| Structure Type | # Housing Units | % Housing Units |
| Single Unit, Detached | 191 | 77.3% |
| Single Unit, Attached | 8 | 3.2% |
| 2 Unit Apartments | 15 | 6.1% |
| 3 or 4 Unit Apartments | 2 | 0.8% |
| 5 to 9 Unit Apartments | 0 | 0.0% |
| 10 or more Apartments | 11 | 4.4% |
| Mobile Home / Other | 20 | 8.1% |
| Total | 247 | 100.0% |
Housing Structures by Occupancy in St John
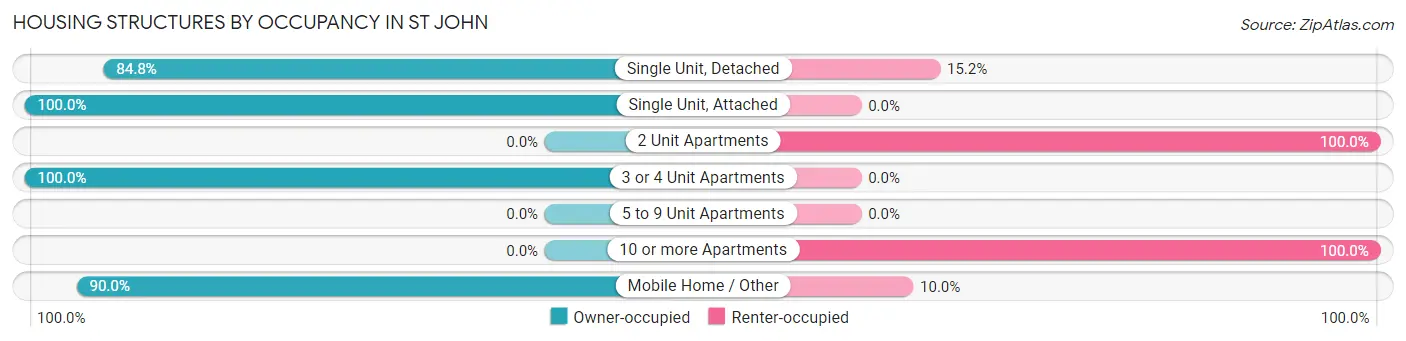
| Structure Type | Owner-occupied | Renter-occupied |
| Single Unit, Detached | 162 (84.8%) | 29 (15.2%) |
| Single Unit, Attached | 8 (100.0%) | 0 (0.0%) |
| 2 Unit Apartments | 0 (0.0%) | 15 (100.0%) |
| 3 or 4 Unit Apartments | 2 (100.0%) | 0 (0.0%) |
| 5 to 9 Unit Apartments | 0 (0.0%) | 0 (0.0%) |
| 10 or more Apartments | 0 (0.0%) | 11 (100.0%) |
| Mobile Home / Other | 18 (90.0%) | 2 (10.0%) |
| Total | 190 (76.9%) | 57 (23.1%) |
Housing Structures by Number of Rooms in St John
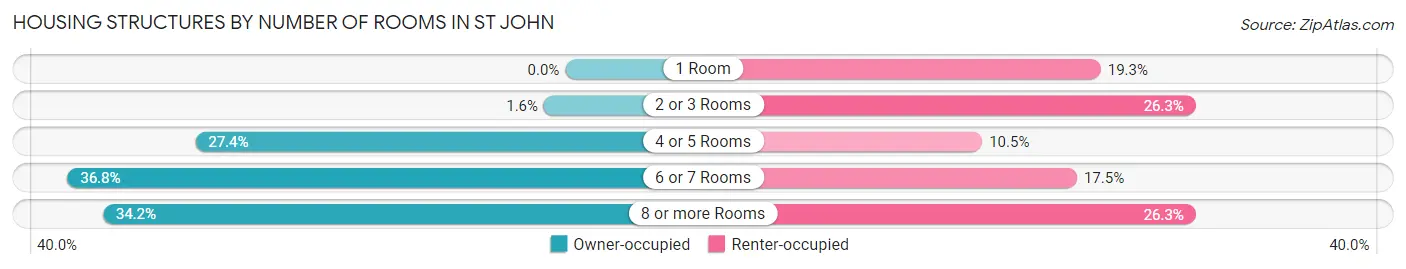
| Number of Rooms | Owner-occupied | Renter-occupied |
| 1 Room | 0 (0.0%) | 11 (19.3%) |
| 2 or 3 Rooms | 3 (1.6%) | 15 (26.3%) |
| 4 or 5 Rooms | 52 (27.4%) | 6 (10.5%) |
| 6 or 7 Rooms | 70 (36.8%) | 10 (17.5%) |
| 8 or more Rooms | 65 (34.2%) | 15 (26.3%) |
| Total | 190 (100.0%) | 57 (100.0%) |
Housing Structure by Heating Type in St John
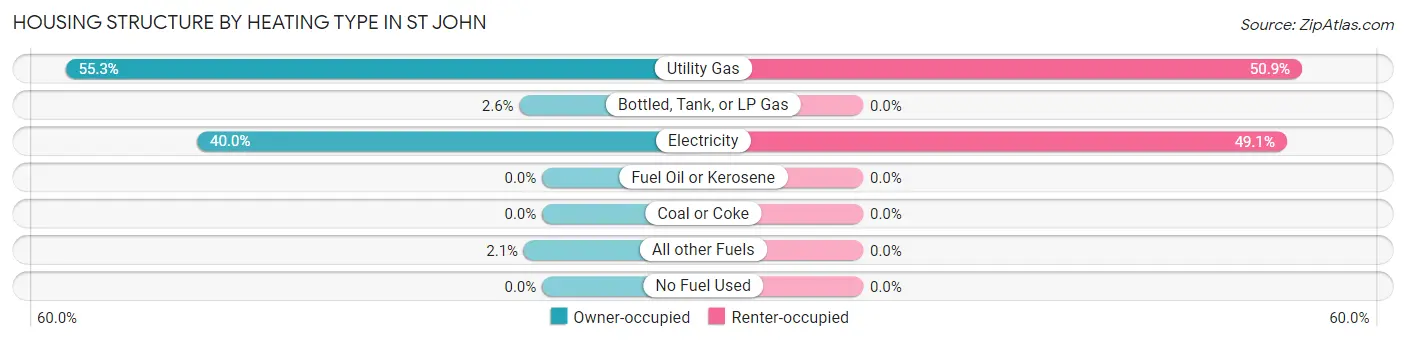
| Heating Type | Owner-occupied | Renter-occupied |
| Utility Gas | 105 (55.3%) | 29 (50.9%) |
| Bottled, Tank, or LP Gas | 5 (2.6%) | 0 (0.0%) |
| Electricity | 76 (40.0%) | 28 (49.1%) |
| Fuel Oil or Kerosene | 0 (0.0%) | 0 (0.0%) |
| Coal or Coke | 0 (0.0%) | 0 (0.0%) |
| All other Fuels | 4 (2.1%) | 0 (0.0%) |
| No Fuel Used | 0 (0.0%) | 0 (0.0%) |
| Total | 190 (100.0%) | 57 (100.0%) |
Household Vehicle Usage in St John
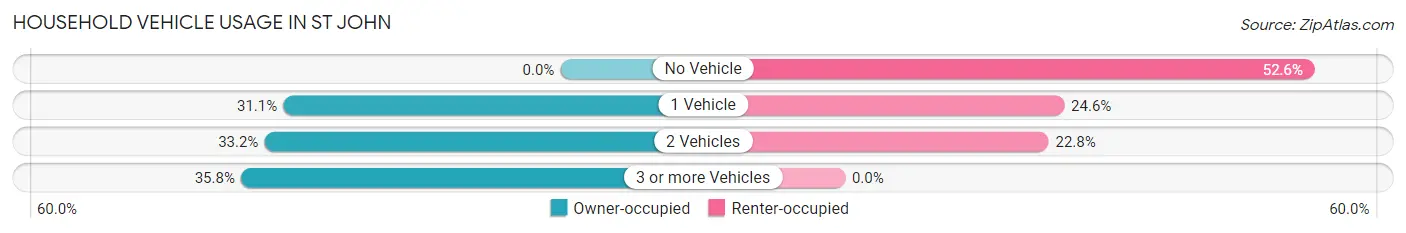
| Vehicles per Household | Owner-occupied | Renter-occupied |
| No Vehicle | 0 (0.0%) | 30 (52.6%) |
| 1 Vehicle | 59 (31.0%) | 14 (24.6%) |
| 2 Vehicles | 63 (33.2%) | 13 (22.8%) |
| 3 or more Vehicles | 68 (35.8%) | 0 (0.0%) |
| Total | 190 (100.0%) | 57 (100.0%) |
Real Estate & Mortgages in St John
Real Estate and Mortgage Overview in St John
| Characteristic | Without Mortgage | With Mortgage |
| Housing Units | 84 | 106 |
| Median Property Value | $193,800 | $173,200 |
| Median Household Income | $55,000 | $10 |
| Monthly Housing Costs | $436 | $0 |
| Real Estate Taxes | $1,771 | $9 |
Property Value by Mortgage Status in St John
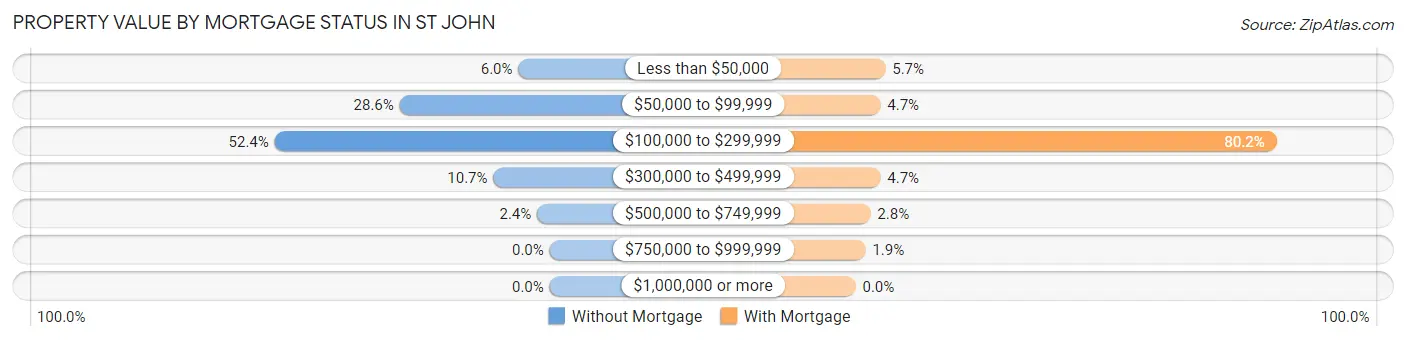
| Property Value | Without Mortgage | With Mortgage |
| Less than $50,000 | 5 (5.9%) | 6 (5.7%) |
| $50,000 to $99,999 | 24 (28.6%) | 5 (4.7%) |
| $100,000 to $299,999 | 44 (52.4%) | 85 (80.2%) |
| $300,000 to $499,999 | 9 (10.7%) | 5 (4.7%) |
| $500,000 to $749,999 | 2 (2.4%) | 3 (2.8%) |
| $750,000 to $999,999 | 0 (0.0%) | 2 (1.9%) |
| $1,000,000 or more | 0 (0.0%) | 0 (0.0%) |
| Total | 84 (100.0%) | 106 (100.0%) |
Household Income by Mortgage Status in St John
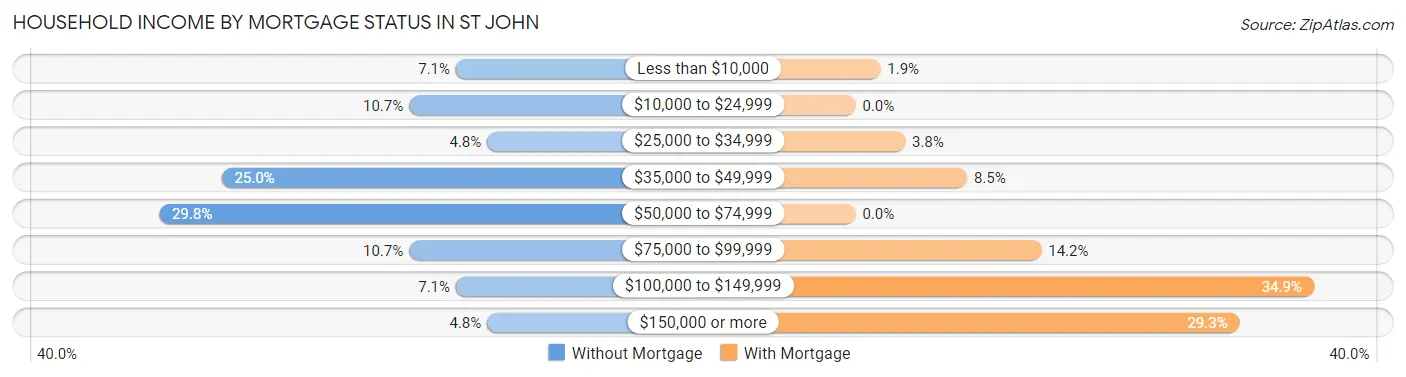
| Household Income | Without Mortgage | With Mortgage |
| Less than $10,000 | 6 (7.1%) | 2 (1.9%) |
| $10,000 to $24,999 | 9 (10.7%) | 0 (0.0%) |
| $25,000 to $34,999 | 4 (4.8%) | 4 (3.8%) |
| $35,000 to $49,999 | 21 (25.0%) | 9 (8.5%) |
| $50,000 to $74,999 | 25 (29.8%) | 0 (0.0%) |
| $75,000 to $99,999 | 9 (10.7%) | 15 (14.1%) |
| $100,000 to $149,999 | 6 (7.1%) | 37 (34.9%) |
| $150,000 or more | 4 (4.8%) | 31 (29.2%) |
| Total | 84 (100.0%) | 106 (100.0%) |
Property Value to Household Income Ratio in St John
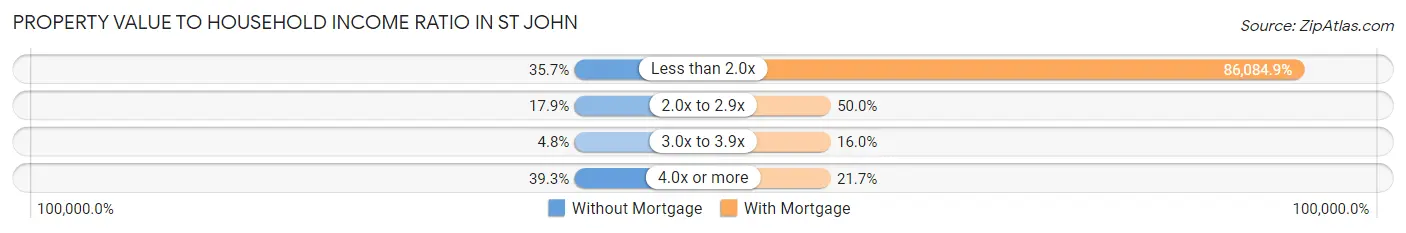
| Value-to-Income Ratio | Without Mortgage | With Mortgage |
| Less than 2.0x | 30 (35.7%) | 91,250 (86,084.9%) |
| 2.0x to 2.9x | 15 (17.9%) | 53 (50.0%) |
| 3.0x to 3.9x | 4 (4.8%) | 17 (16.0%) |
| 4.0x or more | 33 (39.3%) | 23 (21.7%) |
| Total | 84 (100.0%) | 106 (100.0%) |
Real Estate Taxes by Mortgage Status in St John
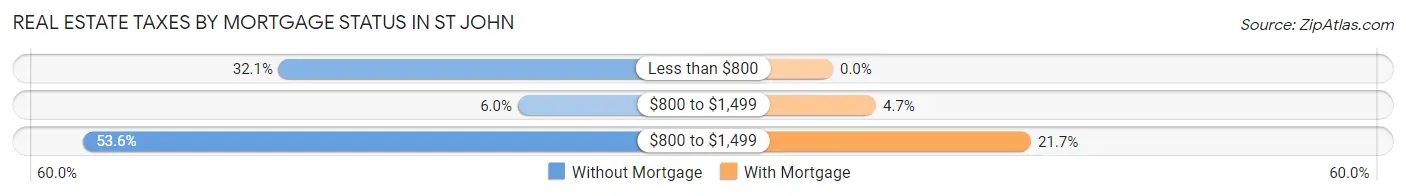
| Property Taxes | Without Mortgage | With Mortgage |
| Less than $800 | 27 (32.1%) | 0 (0.0%) |
| $800 to $1,499 | 5 (5.9%) | 5 (4.7%) |
| $800 to $1,499 | 45 (53.6%) | 23 (21.7%) |
| Total | 84 (100.0%) | 106 (100.0%) |
Health & Disability in St John
Health Insurance Coverage by Age in St John
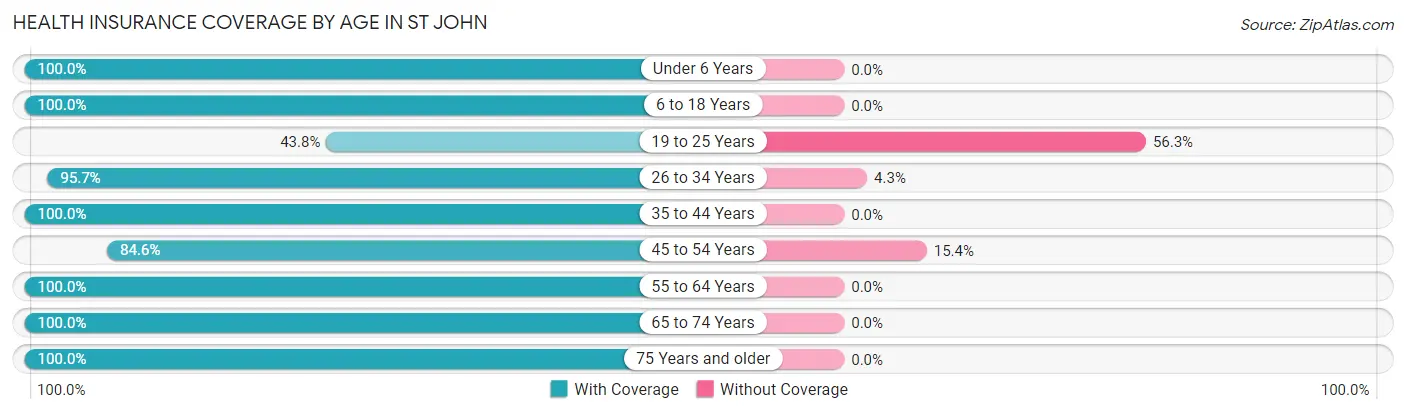
| Age Bracket | With Coverage | Without Coverage |
| Under 6 Years | 31 (100.0%) | 0 (0.0%) |
| 6 to 18 Years | 102 (100.0%) | 0 (0.0%) |
| 19 to 25 Years | 7 (43.8%) | 9 (56.2%) |
| 26 to 34 Years | 45 (95.7%) | 2 (4.3%) |
| 35 to 44 Years | 49 (100.0%) | 0 (0.0%) |
| 45 to 54 Years | 22 (84.6%) | 4 (15.4%) |
| 55 to 64 Years | 117 (100.0%) | 0 (0.0%) |
| 65 to 74 Years | 88 (100.0%) | 0 (0.0%) |
| 75 Years and older | 130 (100.0%) | 0 (0.0%) |
| Total | 591 (97.5%) | 15 (2.5%) |
Health Insurance Coverage by Citizenship Status in St John
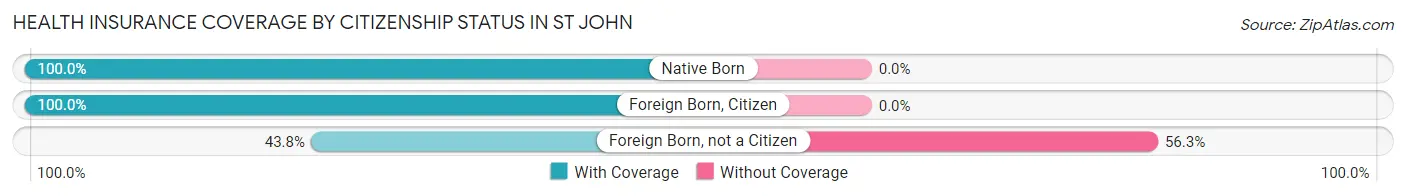
| Citizenship Status | With Coverage | Without Coverage |
| Native Born | 31 (100.0%) | 0 (0.0%) |
| Foreign Born, Citizen | 102 (100.0%) | 0 (0.0%) |
| Foreign Born, not a Citizen | 7 (43.8%) | 9 (56.2%) |
Health Insurance Coverage by Household Income in St John
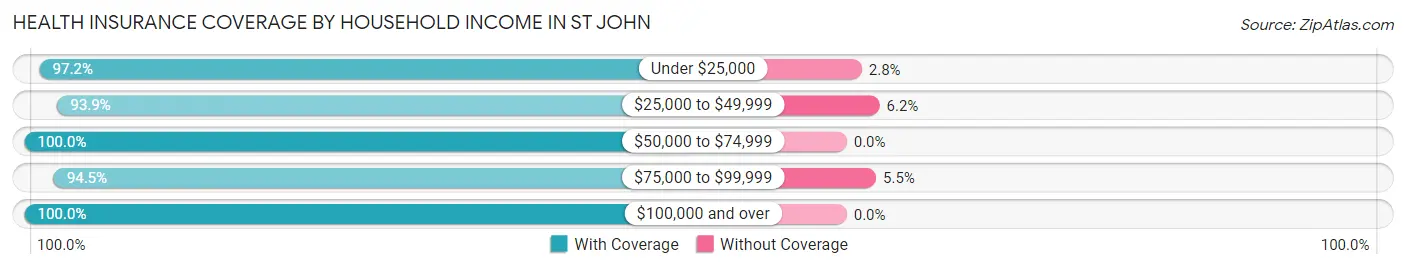
| Household Income | With Coverage | Without Coverage |
| Under $25,000 | 69 (97.2%) | 2 (2.8%) |
| $25,000 to $49,999 | 61 (93.9%) | 4 (6.1%) |
| $50,000 to $74,999 | 83 (100.0%) | 0 (0.0%) |
| $75,000 to $99,999 | 155 (94.5%) | 9 (5.5%) |
| $100,000 and over | 223 (100.0%) | 0 (0.0%) |
Public vs Private Health Insurance Coverage by Age in St John
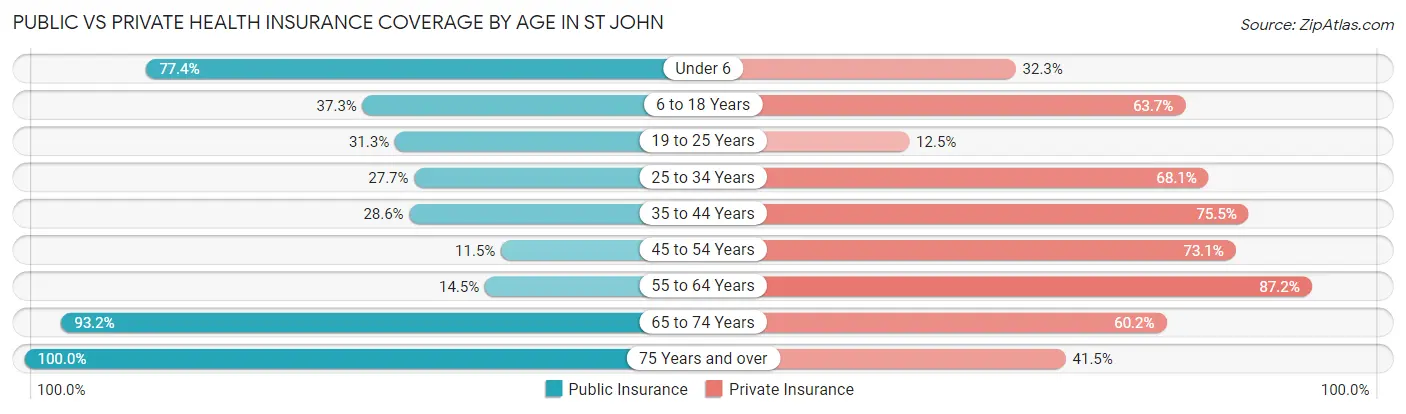
| Age Bracket | Public Insurance | Private Insurance |
| Under 6 | 24 (77.4%) | 10 (32.3%) |
| 6 to 18 Years | 38 (37.2%) | 65 (63.7%) |
| 19 to 25 Years | 5 (31.2%) | 2 (12.5%) |
| 25 to 34 Years | 13 (27.7%) | 32 (68.1%) |
| 35 to 44 Years | 14 (28.6%) | 37 (75.5%) |
| 45 to 54 Years | 3 (11.5%) | 19 (73.1%) |
| 55 to 64 Years | 17 (14.5%) | 102 (87.2%) |
| 65 to 74 Years | 82 (93.2%) | 53 (60.2%) |
| 75 Years and over | 130 (100.0%) | 54 (41.5%) |
| Total | 326 (53.8%) | 374 (61.7%) |
Disability Status by Sex by Age in St John
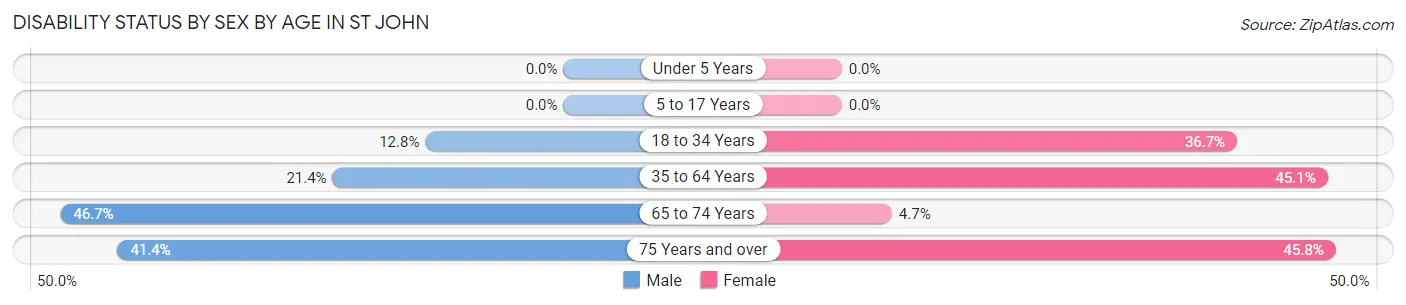
| Age Bracket | Male | Female |
| Under 5 Years | 0 (0.0%) | 0 (0.0%) |
| 5 to 17 Years | 0 (0.0%) | 0 (0.0%) |
| 18 to 34 Years | 5 (12.8%) | 11 (36.7%) |
| 35 to 64 Years | 15 (21.4%) | 55 (45.1%) |
| 65 to 74 Years | 21 (46.7%) | 2 (4.6%) |
| 75 Years and over | 24 (41.4%) | 33 (45.8%) |
Disability Class by Sex by Age in St John
Disability Class: Hearing Difficulty
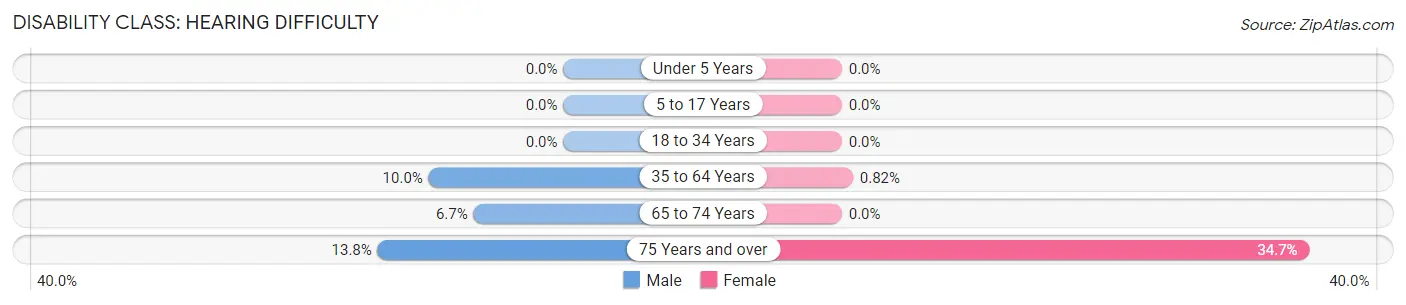
| Age Bracket | Male | Female |
| Under 5 Years | 0 (0.0%) | 0 (0.0%) |
| 5 to 17 Years | 0 (0.0%) | 0 (0.0%) |
| 18 to 34 Years | 0 (0.0%) | 0 (0.0%) |
| 35 to 64 Years | 7 (10.0%) | 1 (0.8%) |
| 65 to 74 Years | 3 (6.7%) | 0 (0.0%) |
| 75 Years and over | 8 (13.8%) | 25 (34.7%) |
Disability Class: Vision Difficulty
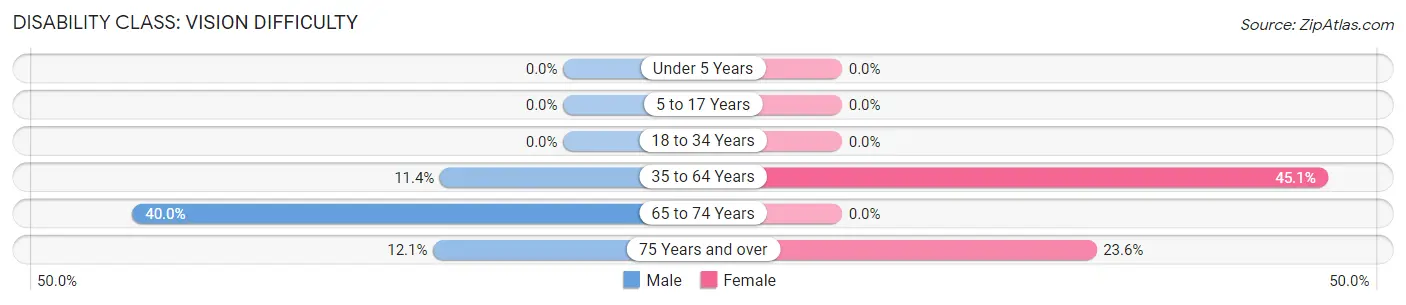
| Age Bracket | Male | Female |
| Under 5 Years | 0 (0.0%) | 0 (0.0%) |
| 5 to 17 Years | 0 (0.0%) | 0 (0.0%) |
| 18 to 34 Years | 0 (0.0%) | 0 (0.0%) |
| 35 to 64 Years | 8 (11.4%) | 55 (45.1%) |
| 65 to 74 Years | 18 (40.0%) | 0 (0.0%) |
| 75 Years and over | 7 (12.1%) | 17 (23.6%) |
Disability Class: Cognitive Difficulty
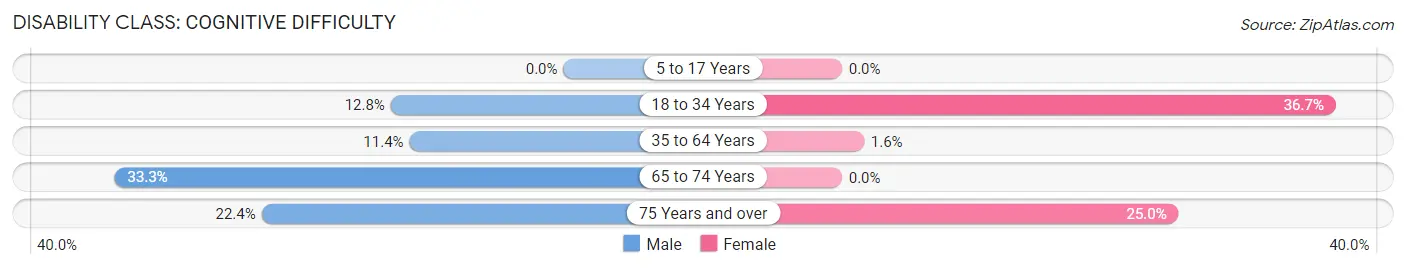
| Age Bracket | Male | Female |
| 5 to 17 Years | 0 (0.0%) | 0 (0.0%) |
| 18 to 34 Years | 5 (12.8%) | 11 (36.7%) |
| 35 to 64 Years | 8 (11.4%) | 2 (1.6%) |
| 65 to 74 Years | 15 (33.3%) | 0 (0.0%) |
| 75 Years and over | 13 (22.4%) | 18 (25.0%) |
Disability Class: Ambulatory Difficulty
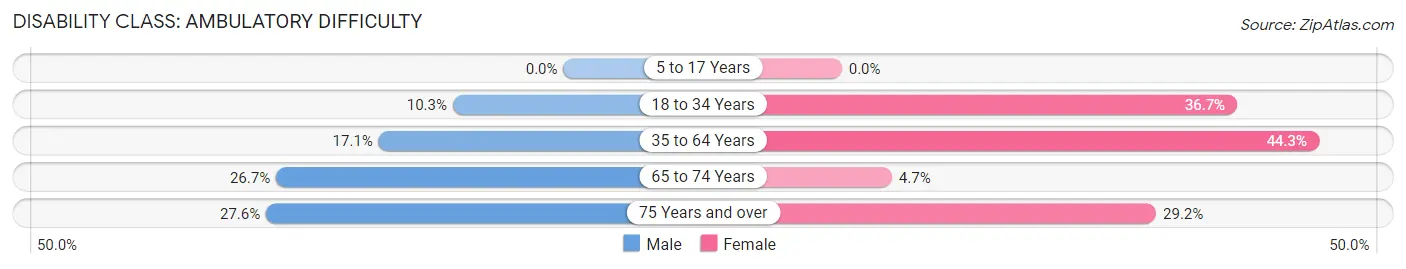
| Age Bracket | Male | Female |
| 5 to 17 Years | 0 (0.0%) | 0 (0.0%) |
| 18 to 34 Years | 4 (10.3%) | 11 (36.7%) |
| 35 to 64 Years | 12 (17.1%) | 54 (44.3%) |
| 65 to 74 Years | 12 (26.7%) | 2 (4.6%) |
| 75 Years and over | 16 (27.6%) | 21 (29.2%) |
Disability Class: Self-Care Difficulty
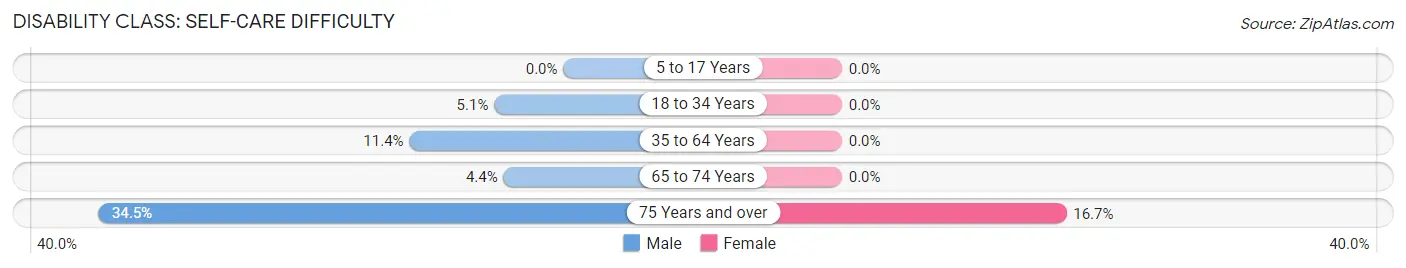
| Age Bracket | Male | Female |
| 5 to 17 Years | 0 (0.0%) | 0 (0.0%) |
| 18 to 34 Years | 2 (5.1%) | 0 (0.0%) |
| 35 to 64 Years | 8 (11.4%) | 0 (0.0%) |
| 65 to 74 Years | 2 (4.4%) | 0 (0.0%) |
| 75 Years and over | 20 (34.5%) | 12 (16.7%) |
Technology Access in St John
Computing Device Access in St John
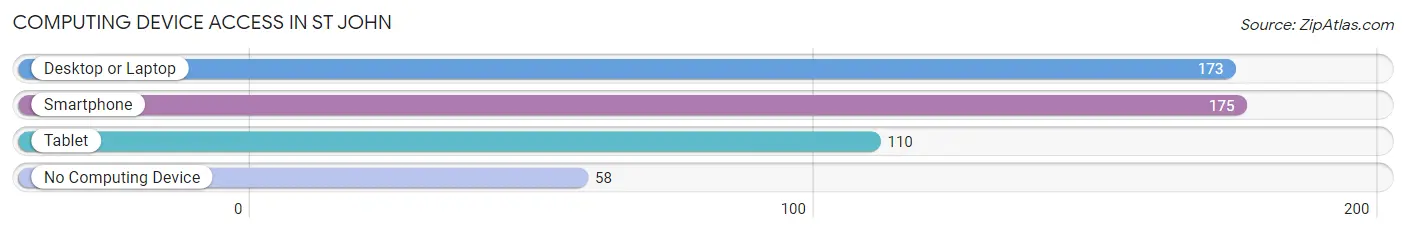
| Device Type | # Households | % Households |
| Desktop or Laptop | 173 | 70.0% |
| Smartphone | 175 | 70.9% |
| Tablet | 110 | 44.5% |
| No Computing Device | 58 | 23.5% |
| Total | 247 | 100.0% |
Internet Access in St John
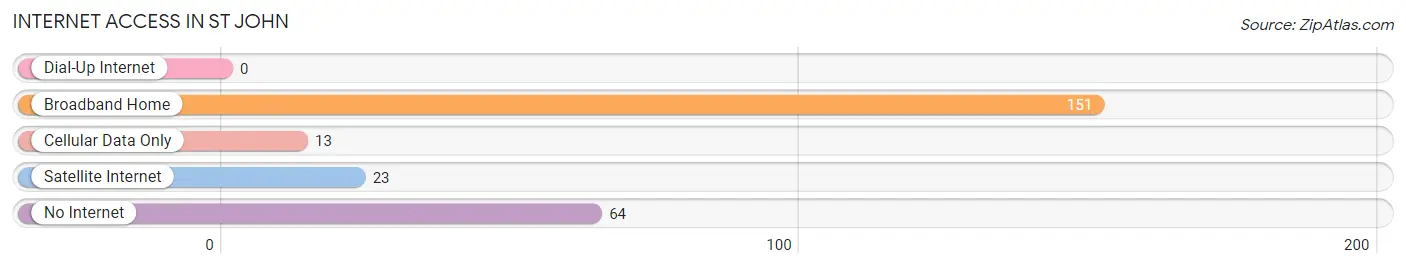
| Internet Type | # Households | % Households |
| Dial-Up Internet | 0 | 0.0% |
| Broadband Home | 151 | 61.1% |
| Cellular Data Only | 13 | 5.3% |
| Satellite Internet | 23 | 9.3% |
| No Internet | 64 | 25.9% |
| Total | 247 | 100.0% |
St John Summary
St John is a small city located in the state of Washington, United States. It is situated in the northwest corner of the state, near the border with Canada. The city is located in the county of Whatcom, and is part of the Bellingham metropolitan area. The population of St John was estimated to be 8,845 in 2019.
History
St John was founded in 1858 by a group of settlers from the Midwest. The city was named after John St John, a prominent local politician. The settlers were attracted to the area due to its abundance of natural resources, including timber, fish, and minerals.
The city quickly grew and became an important center for the lumber industry. In 1891, the St John Lumber Company was established, and it quickly became one of the largest lumber companies in the region. The company was responsible for the construction of many of the city’s buildings, including the St John Hotel, which is still standing today.
The city was also an important center for the fishing industry. In the early 1900s, the St John Fish Company was established, and it quickly became one of the largest fish companies in the region. The company was responsible for the construction of many of the city’s docks and canneries.
Geography
St John is located in the northwest corner of Washington, near the border with Canada. The city is situated on the banks of the Nooksack River, and is surrounded by mountains and forests. The city has a total area of 4.3 square miles, and has a population density of 2,072 people per square mile.
The climate in St John is mild and temperate. The average temperature in the summer is around 70 degrees Fahrenheit, and the average temperature in the winter is around 40 degrees Fahrenheit. The city receives an average of 37 inches of precipitation per year.
Economy
St John’s economy is largely based on the lumber and fishing industries. The city is home to several lumber mills, and the St John Lumber Company is still one of the largest employers in the city. The fishing industry is also an important part of the city’s economy, and the St John Fish Company is one of the largest employers in the city.
The city is also home to several small businesses, including restaurants, retail stores, and professional services. The city is also home to several educational institutions, including Western Washington University and Whatcom Community College.
Demographics
St John has a population of 8,845 people, according to the 2019 census. The city has a median age of 39.7 years, and the median household income is $50,945. The city is predominantly white, with a population that is 79.3% white, 8.2% Hispanic or Latino, 5.2% Asian, and 4.3% African American. The city also has a large Native American population, with a population that is 4.2% Native American.
St John is a small city with a rich history and a diverse population. The city is home to several industries, including lumber and fishing, and is home to several educational institutions. The city has a population of 8,845 people, and has a median household income of $50,945. The city is predominantly white, with a population that is 79.3% white, 8.2% Hispanic or Latino, 5.2% Asian, and 4.3% African American. The city also has a large Native American population, with a population that is 4.2% Native American.
Common Questions
What is Per Capita Income in St John?
Per Capita income in St John is $27,894.
What is the Median Family Income in St John?
Median Family Income in St John is $84,250.
What is the Median Household income in St John?
Median Household Income in St John is $64,750.
What is Income or Wage Gap in St John?
Income or Wage Gap in St John is 26.9%.
Women in St John earn 73.1 cents for every dollar earned by a man.
What is Inequality or Gini Index in St John?
Inequality or Gini Index in St John is 0.39.
What is the Total Population of St John?
Total Population of St John is 612.
What is the Total Male Population of St John?
Total Male Population of St John is 272.
What is the Total Female Population of St John?
Total Female Population of St John is 340.
What is the Ratio of Males per 100 Females in St John?
There are 80.00 Males per 100 Females in St John.
What is the Ratio of Females per 100 Males in St John?
There are 125.00 Females per 100 Males in St John.
What is the Median Population Age in St John?
Median Population Age in St John is 55.5 Years.
What is the Average Family Size in St John
Average Family Size in St John is 3.4 People.
What is the Average Household Size in St John
Average Household Size in St John is 2.5 People.
How Large is the Labor Force in St John?
There are 193 People in the Labor Forcein in St John.
What is the Percentage of People in the Labor Force in St John?
38.5% of People are in the Labor Force in St John.
What is the Unemployment Rate in St John?
Unemployment Rate in St John is 8.6%.