Port Angeles, WA Map & Demographics
Port Angeles Map
Port Angeles Overview
$33,807
PER CAPITA INCOME
$74,946
AVG FAMILY INCOME
$60,212
AVG HOUSEHOLD INCOME
22.2%
WAGE / INCOME GAP [ % ]
77.8¢/ $1
WAGE / INCOME GAP [ $ ]
$13,225
FAMILY INCOME DEFICIT
0.43
INEQUALITY / GINI INDEX
20,007
TOTAL POPULATION
10,035
MALE POPULATION
9,972
FEMALE POPULATION
100.63
MALES / 100 FEMALES
99.37
FEMALES / 100 MALES
41.3
MEDIAN AGE
2.8
AVG FAMILY SIZE
2.1
AVG HOUSEHOLD SIZE
9,568
LABOR FORCE [ PEOPLE ]
57.2%
PERCENT IN LABOR FORCE
5.7%
UNEMPLOYMENT RATE
Port Angeles Area Codes
Income in Port Angeles
Income Overview in Port Angeles
Per Capita Income in Port Angeles is $33,807, while median incomes of families and households are $74,946 and $60,212 respectively.
| Characteristic | Number | Measure |
| Per Capita Income | 20,007 | $33,807 |
| Median Family Income | 4,888 | $74,946 |
| Mean Family Income | 4,888 | $90,192 |
| Median Household Income | 9,087 | $60,212 |
| Mean Household Income | 9,087 | $73,099 |
| Income Deficit | 4,888 | $13,225 |
| Wage / Income Gap (%) | 20,007 | 22.22% |
| Wage / Income Gap ($) | 20,007 | 77.78¢ per $1 |
| Gini / Inequality Index | 20,007 | 0.43 |
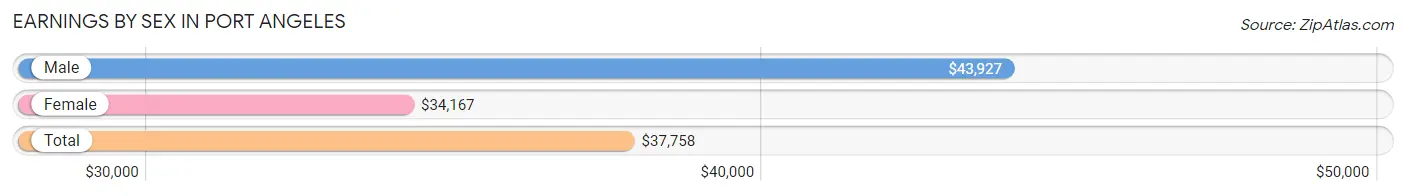
Earnings by Sex in Port Angeles
Average Earnings in Port Angeles are $37,758, $43,927 for men and $34,167 for women, a difference of 22.2%.
| Sex | Number | Average Earnings |
| Male | 5,153 (50.6%) | $43,927 |
| Female | 5,024 (49.4%) | $34,167 |
| Total | 10,177 (100.0%) | $37,758 |
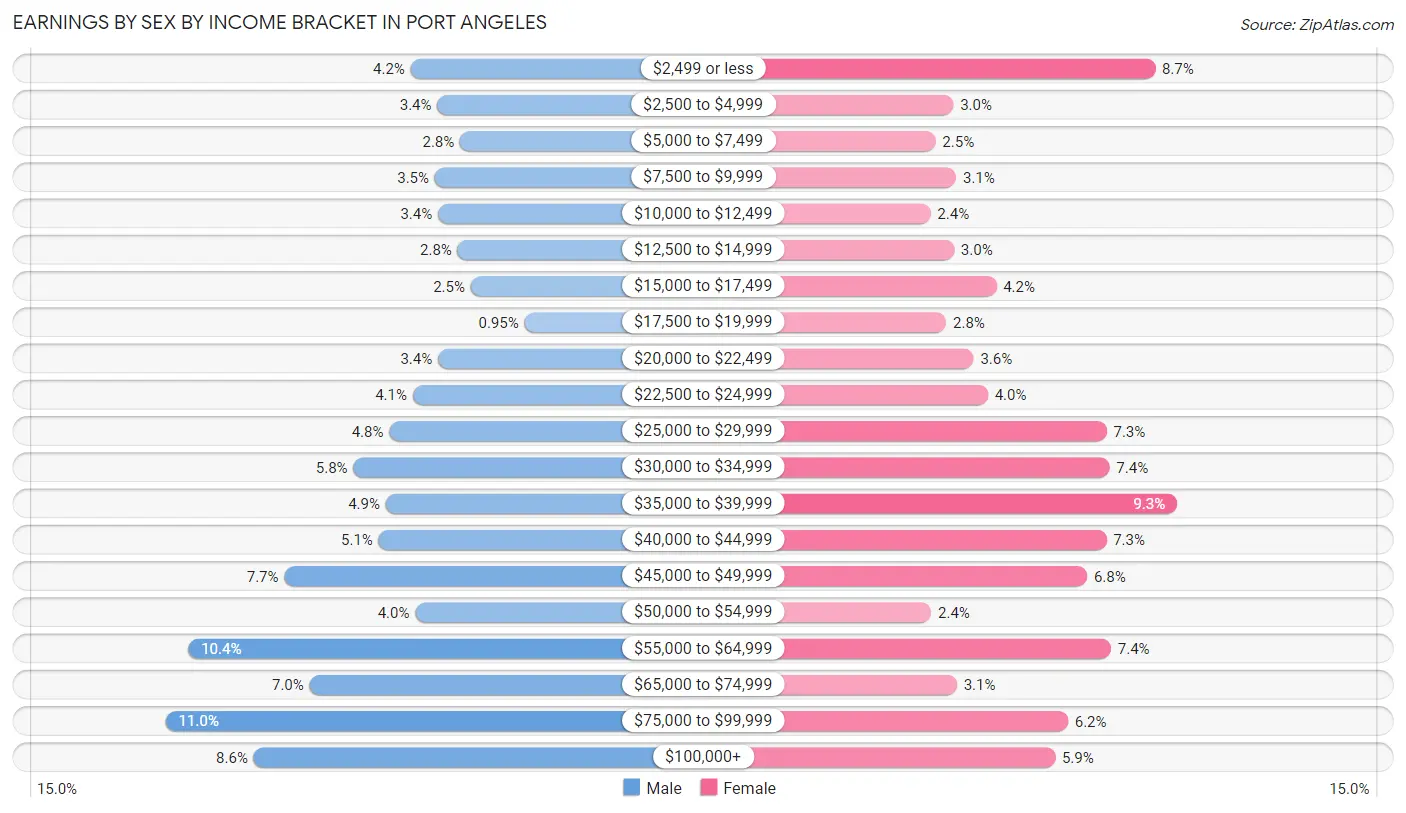
Earnings by Sex by Income Bracket in Port Angeles
The most common earnings brackets in Port Angeles are $75,000 to $99,999 for men (569 | 11.0%) and $35,000 to $39,999 for women (466 | 9.3%).
| Income | Male | Female |
| $2,499 or less | 214 (4.2%) | 435 (8.7%) |
| $2,500 to $4,999 | 175 (3.4%) | 150 (3.0%) |
| $5,000 to $7,499 | 142 (2.8%) | 125 (2.5%) |
| $7,500 to $9,999 | 179 (3.5%) | 154 (3.1%) |
| $10,000 to $12,499 | 174 (3.4%) | 118 (2.4%) |
| $12,500 to $14,999 | 146 (2.8%) | 151 (3.0%) |
| $15,000 to $17,499 | 127 (2.5%) | 211 (4.2%) |
| $17,500 to $19,999 | 49 (0.9%) | 140 (2.8%) |
| $20,000 to $22,499 | 174 (3.4%) | 179 (3.6%) |
| $22,500 to $24,999 | 211 (4.1%) | 199 (4.0%) |
| $25,000 to $29,999 | 245 (4.8%) | 367 (7.3%) |
| $30,000 to $34,999 | 297 (5.8%) | 371 (7.4%) |
| $35,000 to $39,999 | 250 (4.9%) | 466 (9.3%) |
| $40,000 to $44,999 | 260 (5.1%) | 366 (7.3%) |
| $45,000 to $49,999 | 397 (7.7%) | 339 (6.8%) |
| $50,000 to $54,999 | 207 (4.0%) | 119 (2.4%) |
| $55,000 to $64,999 | 536 (10.4%) | 373 (7.4%) |
| $65,000 to $74,999 | 360 (7.0%) | 155 (3.1%) |
| $75,000 to $99,999 | 569 (11.0%) | 312 (6.2%) |
| $100,000+ | 441 (8.6%) | 294 (5.9%) |
| Total | 5,153 (100.0%) | 5,024 (100.0%) |
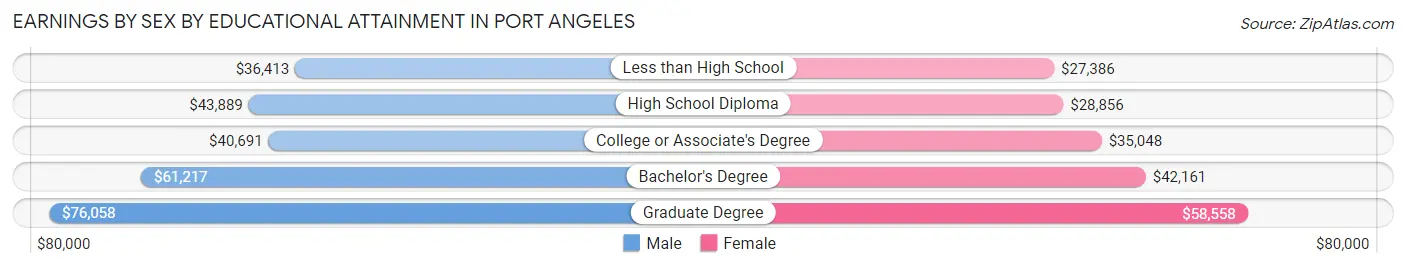
Earnings by Sex by Educational Attainment in Port Angeles
Average earnings in Port Angeles are $46,489 for men and $38,214 for women, a difference of 17.8%. Men with an educational attainment of graduate degree enjoy the highest average annual earnings of $76,058, while those with less than high school education earn the least with $36,413. Women with an educational attainment of graduate degree earn the most with the average annual earnings of $58,558, while those with less than high school education have the smallest earnings of $27,386.
| Educational Attainment | Male Income | Female Income |
| Less than High School | $36,413 | $27,386 |
| High School Diploma | $43,889 | $28,856 |
| College or Associate's Degree | $40,691 | $35,048 |
| Bachelor's Degree | $61,217 | $42,161 |
| Graduate Degree | $76,058 | $58,558 |
| Total | $46,489 | $38,214 |
Family Income in Port Angeles
Family Income Brackets in Port Angeles
According to the Port Angeles family income data, there are 1,139 families falling into the $50,000 to $74,999 income range, which is the most common income bracket and makes up 23.3% of all families. Conversely, the $10,000 to $14,999 income bracket is the least frequent group with only 39 families (0.8%) belonging to this category.
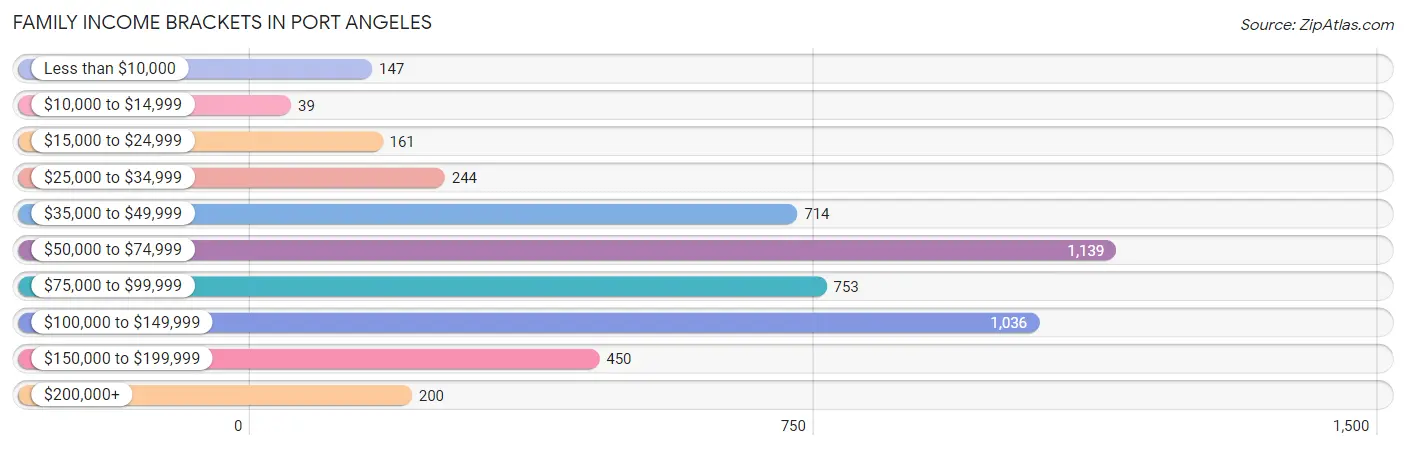
| Income Bracket | # Families | % Families |
| Less than $10,000 | 147 | 3.0% |
| $10,000 to $14,999 | 39 | 0.8% |
| $15,000 to $24,999 | 161 | 3.3% |
| $25,000 to $34,999 | 244 | 5.0% |
| $35,000 to $49,999 | 714 | 14.6% |
| $50,000 to $74,999 | 1,139 | 23.3% |
| $75,000 to $99,999 | 753 | 15.4% |
| $100,000 to $149,999 | 1,036 | 21.2% |
| $150,000 to $199,999 | 450 | 9.2% |
| $200,000+ | 200 | 4.1% |
Family Income by Famaliy Size in Port Angeles
4-person families (784 | 16.0%) account for the highest median family income in Port Angeles with $92,763 per family, while 2-person families (2,814 | 57.6%) have the highest median income of $36,436 per family member.
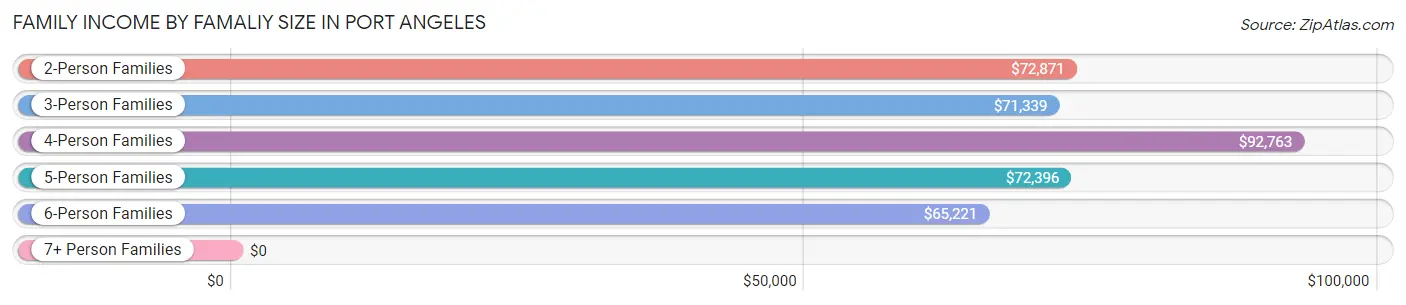
| Income Bracket | # Families | Median Income |
| 2-Person Families | 2,814 (57.6%) | $72,871 |
| 3-Person Families | 932 (19.1%) | $71,339 |
| 4-Person Families | 784 (16.0%) | $92,763 |
| 5-Person Families | 269 (5.5%) | $72,396 |
| 6-Person Families | 63 (1.3%) | $65,221 |
| 7+ Person Families | 26 (0.5%) | $0 |
| Total | 4,888 (100.0%) | $74,946 |
Family Income by Number of Earners in Port Angeles
The median family income in Port Angeles is $74,946, with families comprising 2 earners (2,033) having the highest median family income of $102,781, while families with 1 earner (1,729) have the lowest median family income of $56,004, accounting for 41.6% and 35.4% of families, respectively.
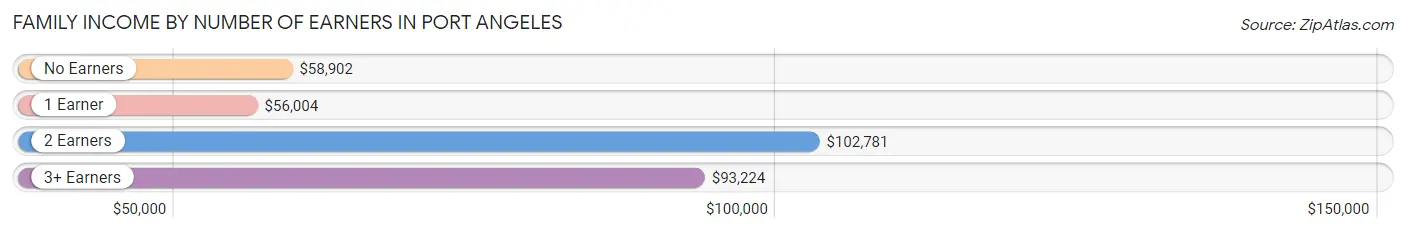
| Number of Earners | # Families | Median Income |
| No Earners | 815 (16.7%) | $58,902 |
| 1 Earner | 1,729 (35.4%) | $56,004 |
| 2 Earners | 2,033 (41.6%) | $102,781 |
| 3+ Earners | 311 (6.4%) | $93,224 |
| Total | 4,888 (100.0%) | $74,946 |
Household Income in Port Angeles
Household Income Brackets in Port Angeles
With 1,781 households falling in the category, the $50,000 to $74,999 income range is the most frequent in Port Angeles, accounting for 19.6% of all households. In contrast, only 345 households (3.8%) fall into the $200,000+ income bracket, making it the least populous group.
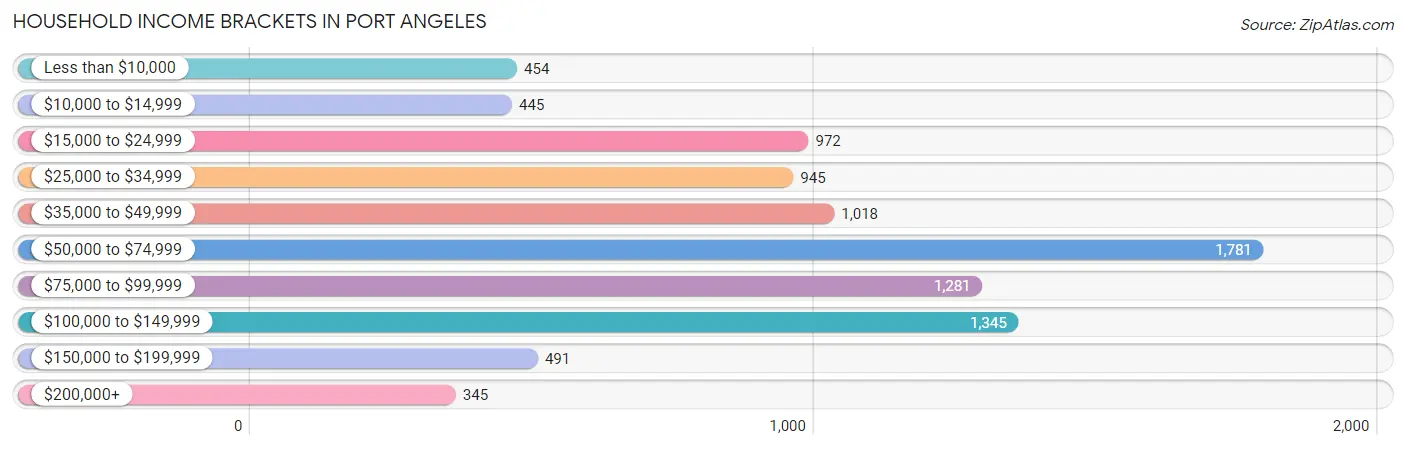
| Income Bracket | # Households | % Households |
| Less than $10,000 | 454 | 5.0% |
| $10,000 to $14,999 | 445 | 4.9% |
| $15,000 to $24,999 | 972 | 10.7% |
| $25,000 to $34,999 | 945 | 10.4% |
| $35,000 to $49,999 | 1,018 | 11.2% |
| $50,000 to $74,999 | 1,781 | 19.6% |
| $75,000 to $99,999 | 1,281 | 14.1% |
| $100,000 to $149,999 | 1,345 | 14.8% |
| $150,000 to $199,999 | 491 | 5.4% |
| $200,000+ | 345 | 3.8% |
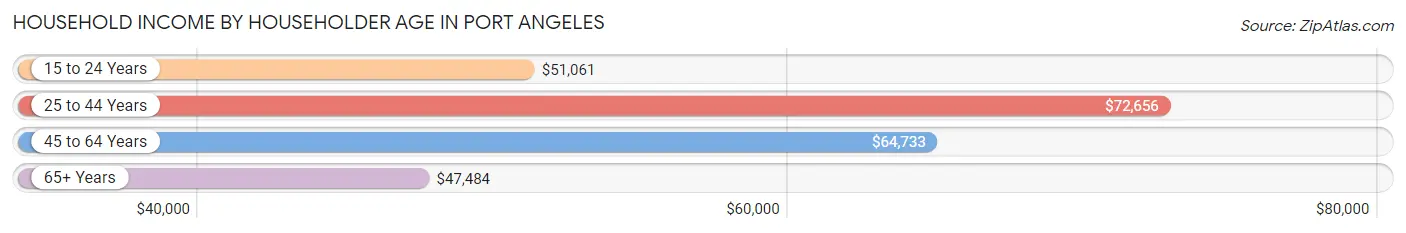
Household Income by Householder Age in Port Angeles
The median household income in Port Angeles is $60,212, with the highest median household income of $72,656 found in the 25 to 44 years age bracket for the primary householder. A total of 2,850 households (31.4%) fall into this category. Meanwhile, the 65+ years age bracket for the primary householder has the lowest median household income of $47,484, with 3,047 households (33.5%) in this group.
| Income Bracket | # Households | Median Income |
| 15 to 24 Years | 292 (3.2%) | $51,061 |
| 25 to 44 Years | 2,850 (31.4%) | $72,656 |
| 45 to 64 Years | 2,898 (31.9%) | $64,733 |
| 65+ Years | 3,047 (33.5%) | $47,484 |
| Total | 9,087 (100.0%) | $60,212 |
Poverty in Port Angeles
Income Below Poverty by Sex and Age in Port Angeles
With 11.0% poverty level for males and 10.9% for females among the residents of Port Angeles, 15 year old males and 55 to 64 year old females are the most vulnerable to poverty, with 29 males (60.4%) and 210 females (15.2%) in their respective age groups living below the poverty level.
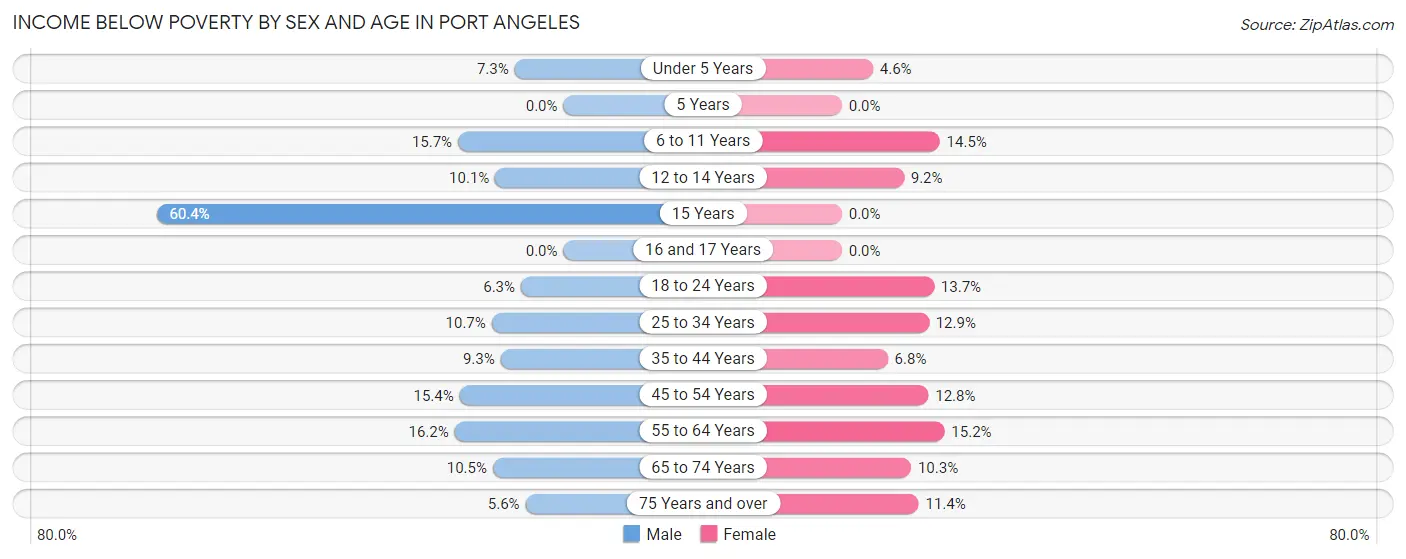
| Age Bracket | Male | Female |
| Under 5 Years | 35 (7.2%) | 21 (4.6%) |
| 5 Years | 0 (0.0%) | 0 (0.0%) |
| 6 to 11 Years | 108 (15.7%) | 67 (14.5%) |
| 12 to 14 Years | 24 (10.1%) | 40 (9.2%) |
| 15 Years | 29 (60.4%) | 0 (0.0%) |
| 16 and 17 Years | 0 (0.0%) | 0 (0.0%) |
| 18 to 24 Years | 54 (6.3%) | 93 (13.7%) |
| 25 to 34 Years | 173 (10.6%) | 171 (12.9%) |
| 35 to 44 Years | 111 (9.3%) | 86 (6.8%) |
| 45 to 54 Years | 165 (15.4%) | 127 (12.8%) |
| 55 to 64 Years | 200 (16.2%) | 210 (15.2%) |
| 65 to 74 Years | 140 (10.5%) | 135 (10.3%) |
| 75 Years and over | 37 (5.6%) | 122 (11.4%) |
| Total | 1,076 (11.0%) | 1,072 (10.9%) |
Income Above Poverty by Sex and Age in Port Angeles
According to the poverty statistics in Port Angeles, males aged 5 years and females aged 5 years are the age groups that are most secure financially, with 100.0% of males and 100.0% of females in these age groups living above the poverty line.
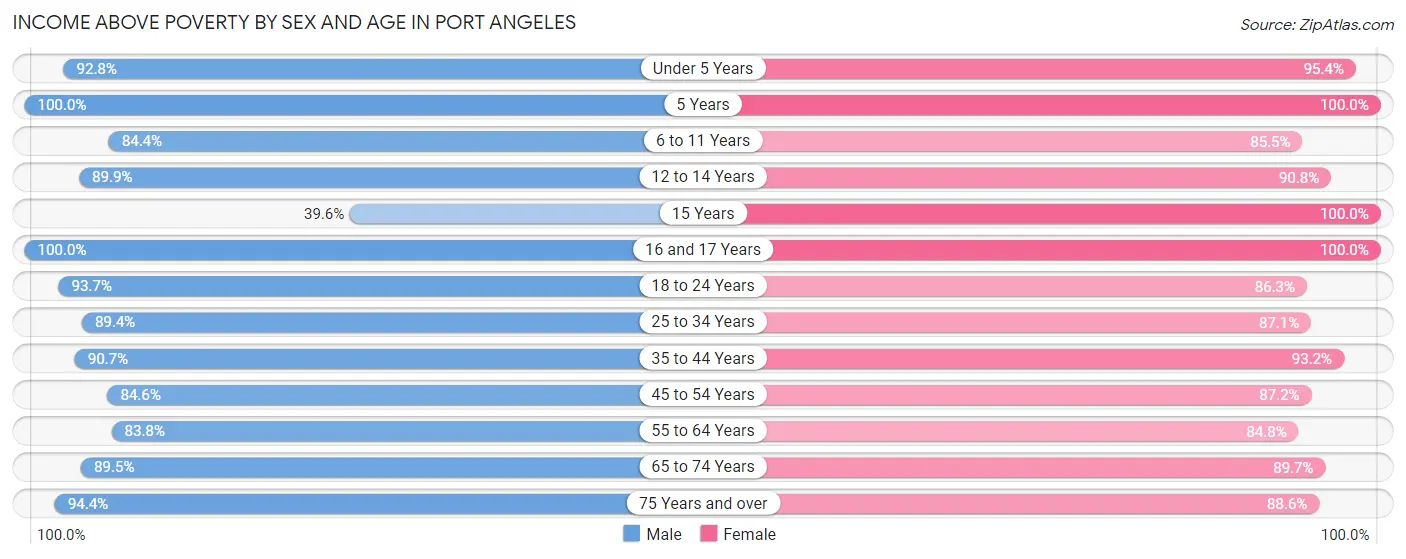
| Age Bracket | Male | Female |
| Under 5 Years | 448 (92.7%) | 435 (95.4%) |
| 5 Years | 112 (100.0%) | 75 (100.0%) |
| 6 to 11 Years | 582 (84.4%) | 394 (85.5%) |
| 12 to 14 Years | 213 (89.9%) | 395 (90.8%) |
| 15 Years | 19 (39.6%) | 180 (100.0%) |
| 16 and 17 Years | 245 (100.0%) | 192 (100.0%) |
| 18 to 24 Years | 802 (93.7%) | 587 (86.3%) |
| 25 to 34 Years | 1,452 (89.3%) | 1,154 (87.1%) |
| 35 to 44 Years | 1,080 (90.7%) | 1,176 (93.2%) |
| 45 to 54 Years | 906 (84.6%) | 862 (87.2%) |
| 55 to 64 Years | 1,038 (83.8%) | 1,168 (84.8%) |
| 65 to 74 Years | 1,197 (89.5%) | 1,179 (89.7%) |
| 75 Years and over | 620 (94.4%) | 948 (88.6%) |
| Total | 8,714 (89.0%) | 8,745 (89.1%) |
Income Below Poverty Among Married-Couple Families in Port Angeles
The poverty statistics for married-couple families in Port Angeles show that 1.5% or 53 of the total 3,577 families live below the poverty line. Families with no children have the highest poverty rate of 1.9%, comprising of 46 families. On the other hand, families with 3 or 4 children have the lowest poverty rate of 0.0%, which includes 0 families.
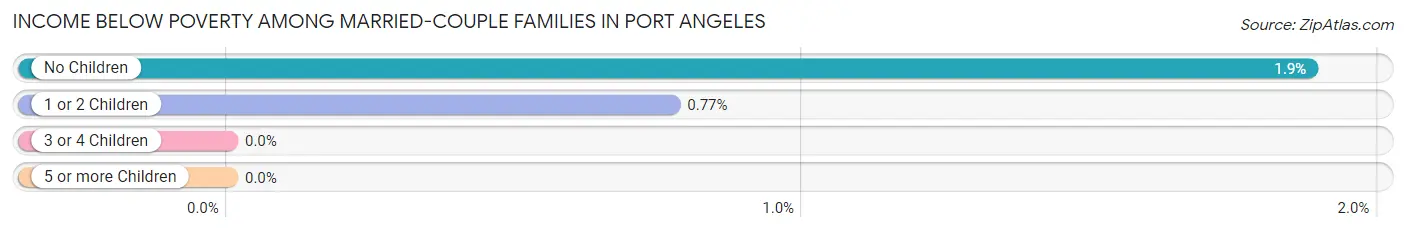
| Children | Above Poverty | Below Poverty |
| No Children | 2,401 (98.1%) | 46 (1.9%) |
| 1 or 2 Children | 906 (99.2%) | 7 (0.8%) |
| 3 or 4 Children | 211 (100.0%) | 0 (0.0%) |
| 5 or more Children | 6 (100.0%) | 0 (0.0%) |
| Total | 3,524 (98.5%) | 53 (1.5%) |
Income Below Poverty Among Single-Parent Households in Port Angeles
According to the poverty data in Port Angeles, 16.8% or 69 single-father households and 14.6% or 132 single-mother households are living below the poverty line. Among single-father households, those with 5 or more children have the highest poverty rate, with 13 households (61.9%) experiencing poverty. Likewise, among single-mother households, those with 3 or 4 children have the highest poverty rate, with 13 households (17.1%) falling below the poverty line.
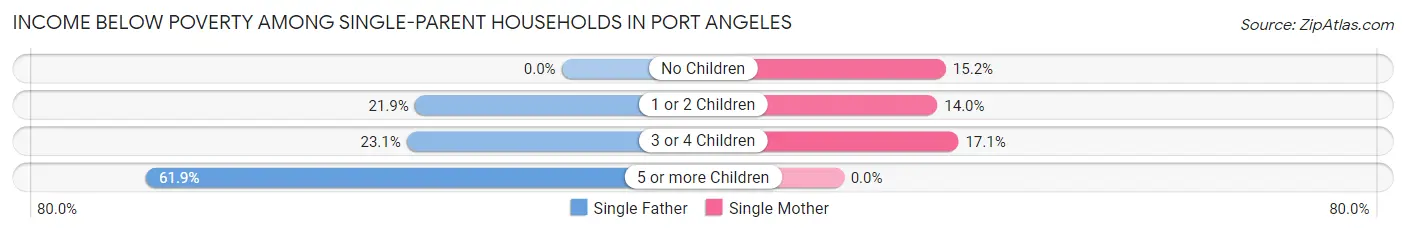
| Children | Single Father | Single Mother |
| No Children | 0 (0.0%) | 46 (15.2%) |
| 1 or 2 Children | 44 (21.9%) | 73 (14.0%) |
| 3 or 4 Children | 12 (23.1%) | 13 (17.1%) |
| 5 or more Children | 13 (61.9%) | 0 (0.0%) |
| Total | 69 (16.8%) | 132 (14.6%) |
Income Below Poverty Among Married-Couple vs Single-Parent Households in Port Angeles
The poverty data for Port Angeles shows that 53 of the married-couple family households (1.5%) and 201 of the single-parent households (15.3%) are living below the poverty level. Within the married-couple family households, those with no children have the highest poverty rate, with 46 households (1.9%) falling below the poverty line. Among the single-parent households, those with 5 or more children have the highest poverty rate, with 13 household (61.9%) living below poverty.
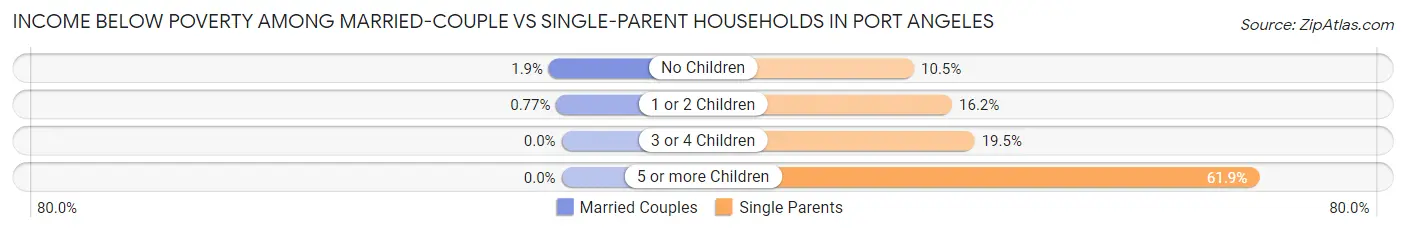
| Children | Married-Couple Families | Single-Parent Households |
| No Children | 46 (1.9%) | 46 (10.5%) |
| 1 or 2 Children | 7 (0.8%) | 117 (16.2%) |
| 3 or 4 Children | 0 (0.0%) | 25 (19.5%) |
| 5 or more Children | 0 (0.0%) | 13 (61.9%) |
| Total | 53 (1.5%) | 201 (15.3%) |
Race in Port Angeles
The most populous races in Port Angeles are White / Caucasian (16,815 | 84.1%), Hispanic or Latino (1,727 | 8.6%), and Two or more Races (1,676 | 8.4%).
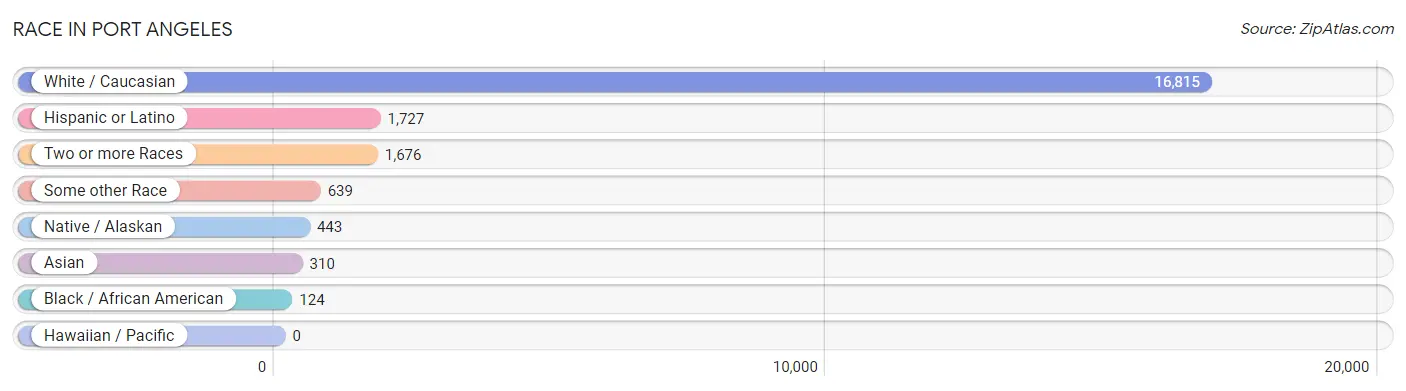
| Race | # Population | % Population |
| Asian | 310 | 1.5% |
| Black / African American | 124 | 0.6% |
| Hawaiian / Pacific | 0 | 0.0% |
| Hispanic or Latino | 1,727 | 8.6% |
| Native / Alaskan | 443 | 2.2% |
| White / Caucasian | 16,815 | 84.1% |
| Two or more Races | 1,676 | 8.4% |
| Some other Race | 639 | 3.2% |
| Total | 20,007 | 100.0% |
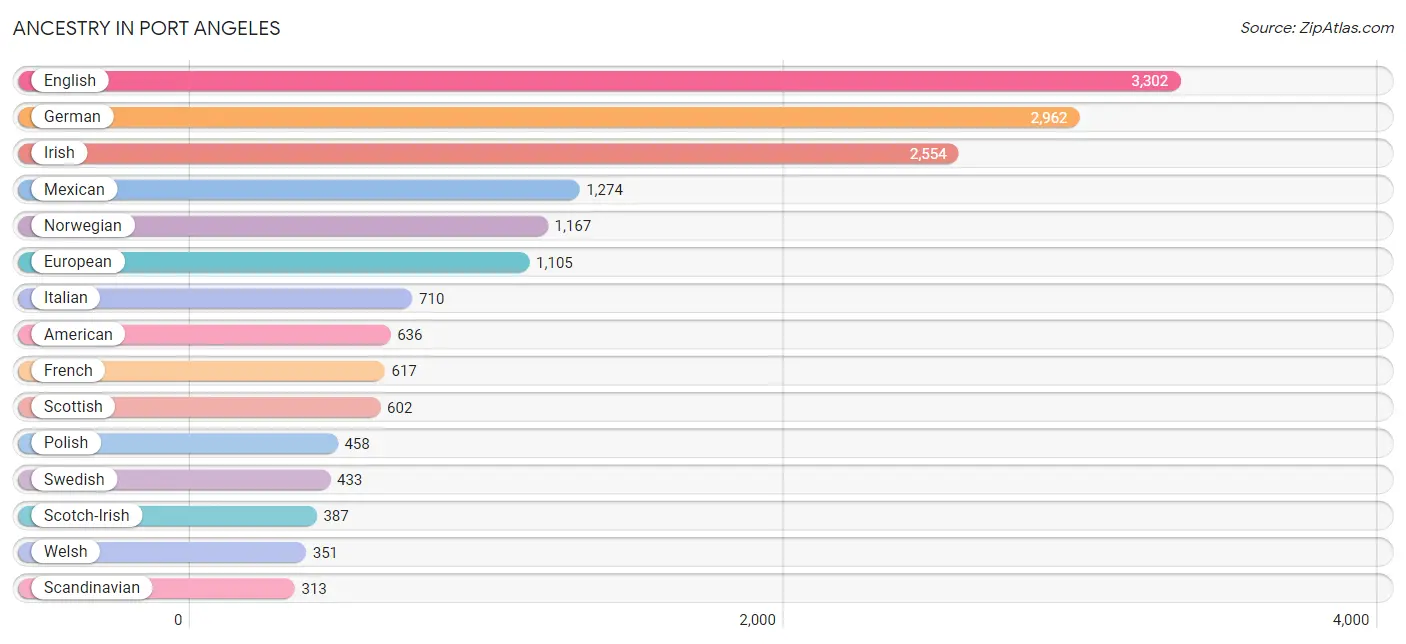
Ancestry in Port Angeles
The most populous ancestries reported in Port Angeles are English (3,302 | 16.5%), German (2,962 | 14.8%), Irish (2,554 | 12.8%), Mexican (1,274 | 6.4%), and Norwegian (1,167 | 5.8%), together accounting for 56.3% of all Port Angeles residents.
| Ancestry | # Population | % Population |
| Alaska Native | 15 | 0.1% |
| Aleut | 35 | 0.2% |
| American | 636 | 3.2% |
| Arab | 27 | 0.1% |
| Armenian | 5 | 0.0% |
| Austrian | 34 | 0.2% |
| Bahamian | 40 | 0.2% |
| Bhutanese | 93 | 0.5% |
| Blackfeet | 11 | 0.1% |
| Bolivian | 25 | 0.1% |
| British | 239 | 1.2% |
| Burmese | 72 | 0.4% |
| Canadian | 84 | 0.4% |
| Central American | 180 | 0.9% |
| Cherokee | 134 | 0.7% |
| Chilean | 17 | 0.1% |
| Chippewa | 65 | 0.3% |
| Colombian | 36 | 0.2% |
| Croatian | 38 | 0.2% |
| Czech | 70 | 0.4% |
| Danish | 141 | 0.7% |
| Dominican | 37 | 0.2% |
| Dutch | 254 | 1.3% |
| Dutch West Indian | 10 | 0.1% |
| Eastern European | 93 | 0.5% |
| Ecuadorian | 30 | 0.2% |
| English | 3,302 | 16.5% |
| European | 1,105 | 5.5% |
| Finnish | 54 | 0.3% |
| French | 617 | 3.1% |
| French American Indian | 8 | 0.0% |
| French Canadian | 166 | 0.8% |
| German | 2,962 | 14.8% |
| Greek | 49 | 0.2% |
| Haitian | 19 | 0.1% |
| Honduran | 82 | 0.4% |
| Hungarian | 68 | 0.3% |
| Indian (Asian) | 160 | 0.8% |
| Irish | 2,554 | 12.8% |
| Iroquois | 7 | 0.0% |
| Italian | 710 | 3.5% |
| Jamaican | 26 | 0.1% |
| Japanese | 8 | 0.0% |
| Korean | 89 | 0.4% |
| Laotian | 42 | 0.2% |
| Latvian | 8 | 0.0% |
| Lithuanian | 16 | 0.1% |
| Maltese | 8 | 0.0% |
| Mexican | 1,274 | 6.4% |
| Mexican American Indian | 10 | 0.1% |
| Native Hawaiian | 3 | 0.0% |
| Navajo | 60 | 0.3% |
| Nicaraguan | 83 | 0.4% |
| Nigerian | 43 | 0.2% |
| Northern European | 67 | 0.3% |
| Norwegian | 1,167 | 5.8% |
| Pakistani | 21 | 0.1% |
| Panamanian | 15 | 0.1% |
| Pennsylvania German | 34 | 0.2% |
| Polish | 458 | 2.3% |
| Portuguese | 89 | 0.4% |
| Puerto Rican | 52 | 0.3% |
| Puget Sound Salish | 82 | 0.4% |
| Romanian | 25 | 0.1% |
| Russian | 146 | 0.7% |
| Scandinavian | 313 | 1.6% |
| Scotch-Irish | 387 | 1.9% |
| Scottish | 602 | 3.0% |
| Serbian | 12 | 0.1% |
| Sioux | 43 | 0.2% |
| Slavic | 25 | 0.1% |
| Slovak | 33 | 0.2% |
| Slovene | 8 | 0.0% |
| South American | 108 | 0.5% |
| South American Indian | 9 | 0.0% |
| Spaniard | 20 | 0.1% |
| Spanish | 14 | 0.1% |
| Sri Lankan | 59 | 0.3% |
| Subsaharan African | 61 | 0.3% |
| Swedish | 433 | 2.2% |
| Swiss | 111 | 0.5% |
| Syrian | 27 | 0.1% |
| Thai | 25 | 0.1% |
| Tlingit-Haida | 70 | 0.4% |
| Turkish | 118 | 0.6% |
| Ukrainian | 53 | 0.3% |
| Welsh | 351 | 1.8% |
| Yaqui | 21 | 0.1% | View All 88 Rows |
Immigrants in Port Angeles
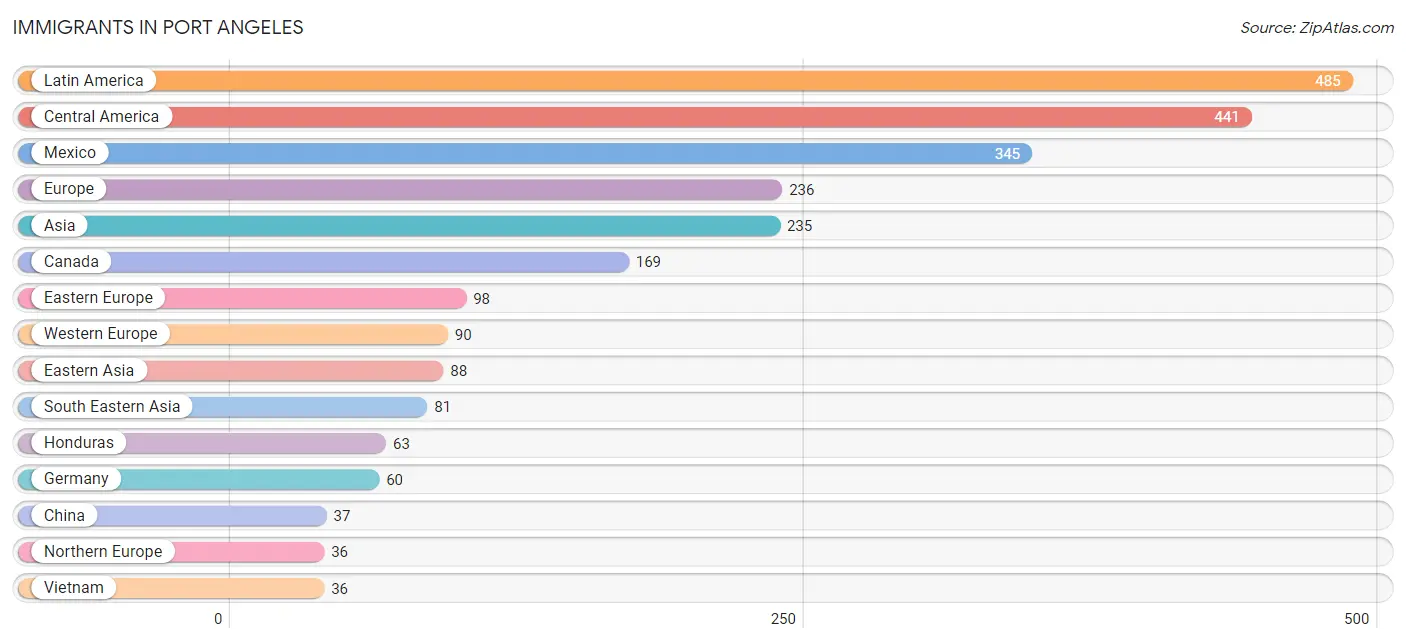
The most numerous immigrant groups reported in Port Angeles came from Latin America (485 | 2.4%), Central America (441 | 2.2%), Mexico (345 | 1.7%), Europe (236 | 1.2%), and Asia (235 | 1.2%), together accounting for 8.7% of all Port Angeles residents.
| Immigration Origin | # Population | % Population |
| Asia | 235 | 1.2% |
| Cambodia | 8 | 0.0% |
| Canada | 169 | 0.8% |
| Caribbean | 27 | 0.1% |
| Central America | 441 | 2.2% |
| Chile | 17 | 0.1% |
| China | 37 | 0.2% |
| Eastern Asia | 88 | 0.4% |
| Eastern Europe | 98 | 0.5% |
| England | 21 | 0.1% |
| Europe | 236 | 1.2% |
| Germany | 60 | 0.3% |
| Guatemala | 19 | 0.1% |
| Haiti | 19 | 0.1% |
| Honduras | 63 | 0.3% |
| India | 25 | 0.1% |
| Italy | 12 | 0.1% |
| Jamaica | 8 | 0.0% |
| Japan | 20 | 0.1% |
| Korea | 31 | 0.2% |
| Latin America | 485 | 2.4% |
| Lithuania | 9 | 0.0% |
| Mexico | 345 | 1.7% |
| Moldova | 11 | 0.1% |
| Netherlands | 30 | 0.2% |
| Nicaragua | 14 | 0.1% |
| Northern Europe | 36 | 0.2% |
| Oceania | 7 | 0.0% |
| Philippines | 24 | 0.1% |
| Poland | 17 | 0.1% |
| Russia | 9 | 0.0% |
| South America | 17 | 0.1% |
| South Central Asia | 25 | 0.1% |
| South Eastern Asia | 81 | 0.4% |
| Southern Europe | 12 | 0.1% |
| Taiwan | 17 | 0.1% |
| Thailand | 13 | 0.1% |
| Vietnam | 36 | 0.2% |
| Western Europe | 90 | 0.4% | View All 39 Rows |
Sex and Age in Port Angeles
Sex and Age in Port Angeles
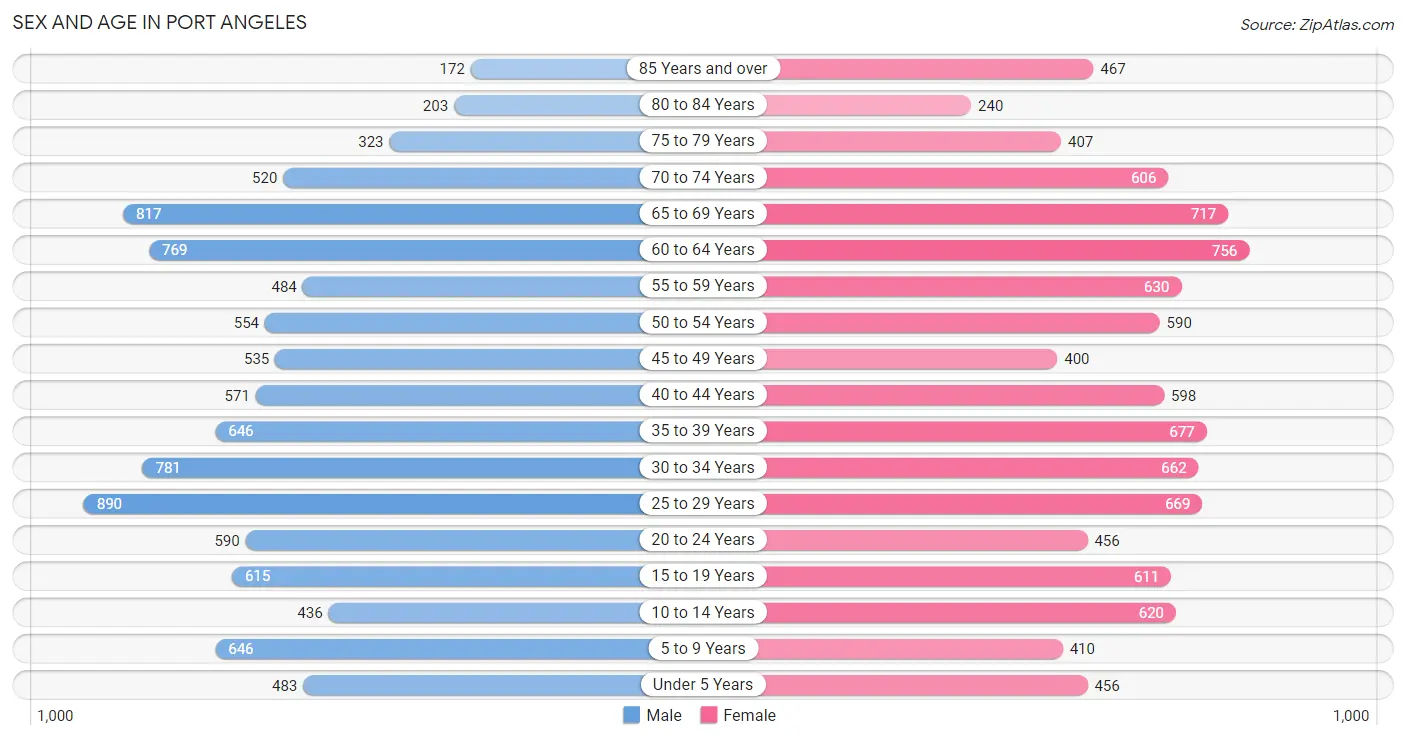
The most populous age groups in Port Angeles are 25 to 29 Years (890 | 8.9%) for men and 60 to 64 Years (756 | 7.6%) for women.
| Age Bracket | Male | Female |
| Under 5 Years | 483 (4.8%) | 456 (4.6%) |
| 5 to 9 Years | 646 (6.4%) | 410 (4.1%) |
| 10 to 14 Years | 436 (4.3%) | 620 (6.2%) |
| 15 to 19 Years | 615 (6.1%) | 611 (6.1%) |
| 20 to 24 Years | 590 (5.9%) | 456 (4.6%) |
| 25 to 29 Years | 890 (8.9%) | 669 (6.7%) |
| 30 to 34 Years | 781 (7.8%) | 662 (6.6%) |
| 35 to 39 Years | 646 (6.4%) | 677 (6.8%) |
| 40 to 44 Years | 571 (5.7%) | 598 (6.0%) |
| 45 to 49 Years | 535 (5.3%) | 400 (4.0%) |
| 50 to 54 Years | 554 (5.5%) | 590 (5.9%) |
| 55 to 59 Years | 484 (4.8%) | 630 (6.3%) |
| 60 to 64 Years | 769 (7.7%) | 756 (7.6%) |
| 65 to 69 Years | 817 (8.1%) | 717 (7.2%) |
| 70 to 74 Years | 520 (5.2%) | 606 (6.1%) |
| 75 to 79 Years | 323 (3.2%) | 407 (4.1%) |
| 80 to 84 Years | 203 (2.0%) | 240 (2.4%) |
| 85 Years and over | 172 (1.7%) | 467 (4.7%) |
| Total | 10,035 (100.0%) | 9,972 (100.0%) |
Families and Households in Port Angeles
Median Family Size in Port Angeles
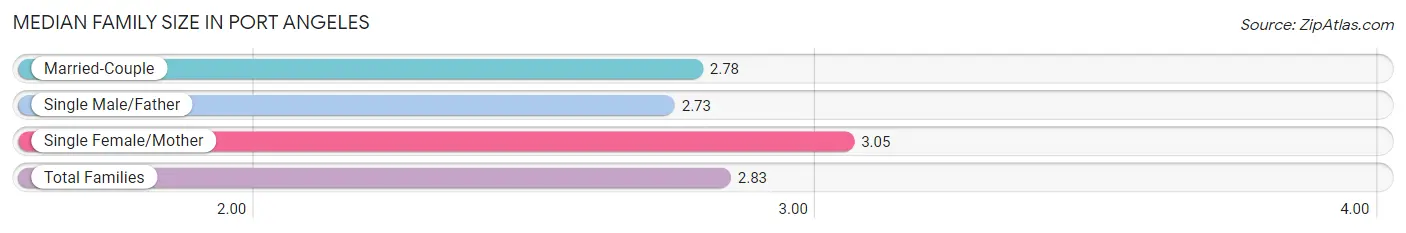
The median family size in Port Angeles is 2.83 persons per family, with single female/mother families (901 | 18.4%) accounting for the largest median family size of 3.05 persons per family. On the other hand, single male/father families (410 | 8.4%) represent the smallest median family size with 2.73 persons per family.
| Family Type | # Families | Family Size |
| Married-Couple | 3,577 (73.2%) | 2.78 |
| Single Male/Father | 410 (8.4%) | 2.73 |
| Single Female/Mother | 901 (18.4%) | 3.05 |
| Total Families | 4,888 (100.0%) | 2.83 |
Median Household Size in Port Angeles
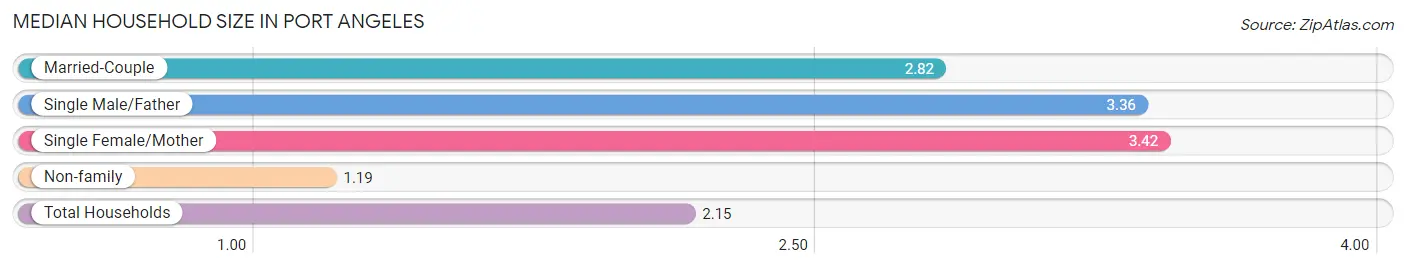
The median household size in Port Angeles is 2.15 persons per household, with single female/mother households (901 | 9.9%) accounting for the largest median household size of 3.42 persons per household. non-family households (4,199 | 46.2%) represent the smallest median household size with 1.19 persons per household.
| Household Type | # Households | Household Size |
| Married-Couple | 3,577 (39.4%) | 2.82 |
| Single Male/Father | 410 (4.5%) | 3.36 |
| Single Female/Mother | 901 (9.9%) | 3.42 |
| Non-family | 4,199 (46.2%) | 1.19 |
| Total Households | 9,087 (100.0%) | 2.15 |
Household Size by Marriage Status in Port Angeles
Out of a total of 9,087 households in Port Angeles, 4,888 (53.8%) are family households, while 4,199 (46.2%) are nonfamily households. The most numerous type of family households are 2-person households, comprising 2,606, and the most common type of nonfamily households are 1-person households, comprising 3,555.
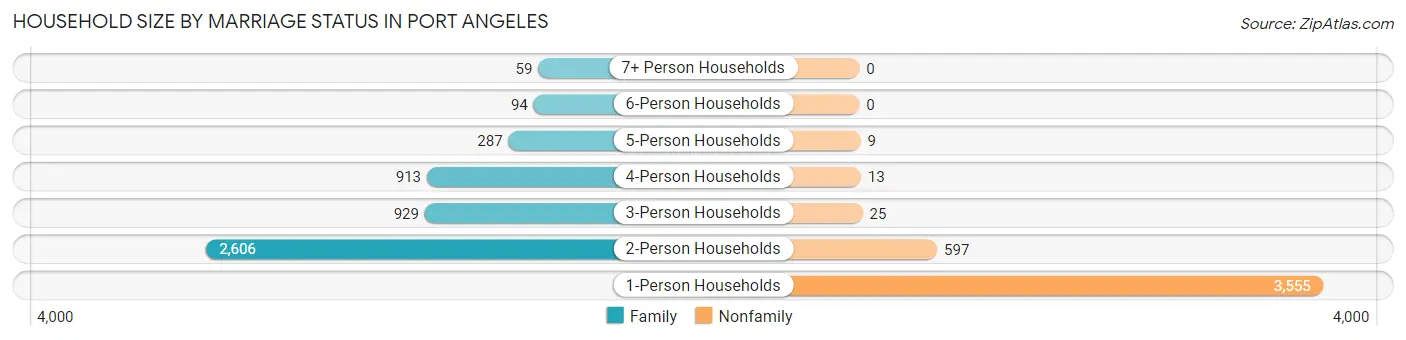
| Household Size | Family Households | Nonfamily Households |
| 1-Person Households | - | 3,555 (39.1%) |
| 2-Person Households | 2,606 (28.7%) | 597 (6.6%) |
| 3-Person Households | 929 (10.2%) | 25 (0.3%) |
| 4-Person Households | 913 (10.1%) | 13 (0.1%) |
| 5-Person Households | 287 (3.2%) | 9 (0.1%) |
| 6-Person Households | 94 (1.0%) | 0 (0.0%) |
| 7+ Person Households | 59 (0.6%) | 0 (0.0%) |
| Total | 4,888 (53.8%) | 4,199 (46.2%) |
Female Fertility in Port Angeles
Fertility by Age in Port Angeles
Average fertility rate in Port Angeles is 62.0 births per 1,000 women. Women in the age bracket of 20 to 34 years have the highest fertility rate with 124.0 births per 1,000 women. Women in the age bracket of 20 to 34 years acount for 85.0% of all women with births.
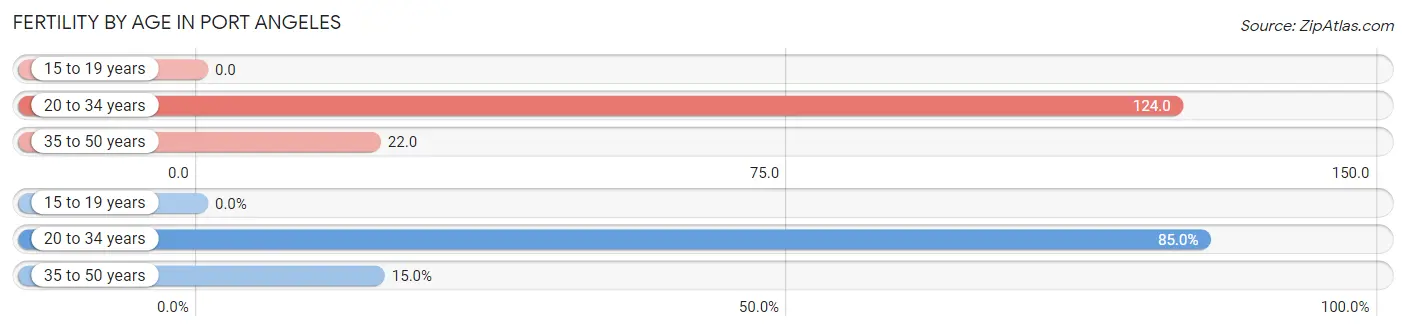
| Age Bracket | Women with Births | Births / 1,000 Women |
| 15 to 19 years | 0 (0.0%) | 0.0 |
| 20 to 34 years | 221 (85.0%) | 124.0 |
| 35 to 50 years | 39 (15.0%) | 22.0 |
| Total | 260 (100.0%) | 62.0 |
Fertility by Age by Marriage Status in Port Angeles
54.2% of women with births (260) in Port Angeles are married. The highest percentage of unmarried women with births falls into 20 to 34 years age bracket with 48.0% of them unmarried at the time of birth, while the lowest percentage of unmarried women with births belong to 35 to 50 years age bracket with 33.3% of them unmarried.
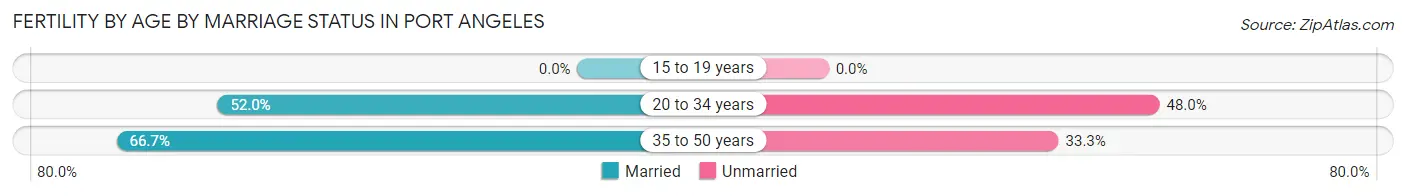
| Age Bracket | Married | Unmarried |
| 15 to 19 years | 0 (0.0%) | 0 (0.0%) |
| 20 to 34 years | 115 (52.0%) | 106 (48.0%) |
| 35 to 50 years | 26 (66.7%) | 13 (33.3%) |
| Total | 141 (54.2%) | 119 (45.8%) |
Fertility by Education in Port Angeles
Average fertility rate in Port Angeles is 62.0 births per 1,000 women. Women with the education attainment of high school diploma have the highest fertility rate of 84.0 births per 1,000 women, while women with the education attainment of graduate degree have the lowest fertility at 15.0 births per 1,000 women. Women with the education attainment of college or associate's degree represent 41.5% of all women with births.
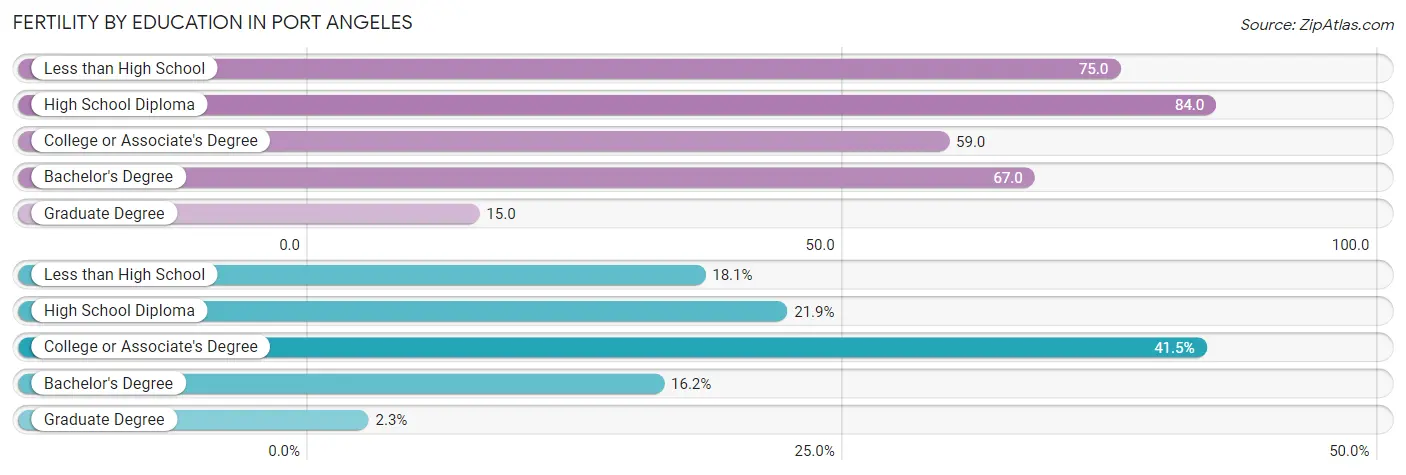
| Educational Attainment | Women with Births | Births / 1,000 Women |
| Less than High School | 47 (18.1%) | 75.0 |
| High School Diploma | 57 (21.9%) | 84.0 |
| College or Associate's Degree | 108 (41.5%) | 59.0 |
| Bachelor's Degree | 42 (16.2%) | 67.0 |
| Graduate Degree | 6 (2.3%) | 15.0 |
| Total | 260 (100.0%) | 62.0 |
Fertility by Education by Marriage Status in Port Angeles
45.8% of women with births in Port Angeles are unmarried. Women with the educational attainment of bachelor's degree are most likely to be married with 100.0% of them married at childbirth, while women with the educational attainment of less than high school are least likely to be married with 100.0% of them unmarried at childbirth.
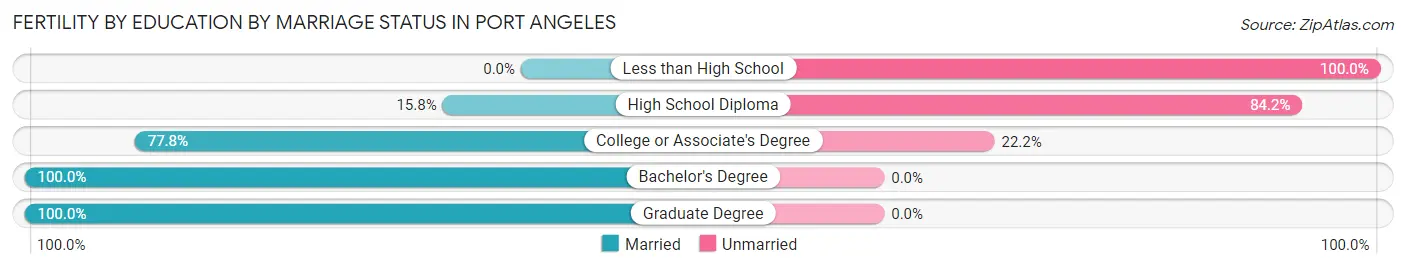
| Educational Attainment | Married | Unmarried |
| Less than High School | 0 (0.0%) | 47 (100.0%) |
| High School Diploma | 9 (15.8%) | 48 (84.2%) |
| College or Associate's Degree | 84 (77.8%) | 24 (22.2%) |
| Bachelor's Degree | 42 (100.0%) | 0 (0.0%) |
| Graduate Degree | 6 (100.0%) | 0 (0.0%) |
| Total | 141 (54.2%) | 119 (45.8%) |
Employment Characteristics in Port Angeles
Employment by Class of Employer in Port Angeles
Among the 8,926 employed individuals in Port Angeles, private company employees (4,975 | 55.7%), local government employees (1,012 | 11.3%), and not-for-profit organizations (913 | 10.2%) make up the most common classes of employment.
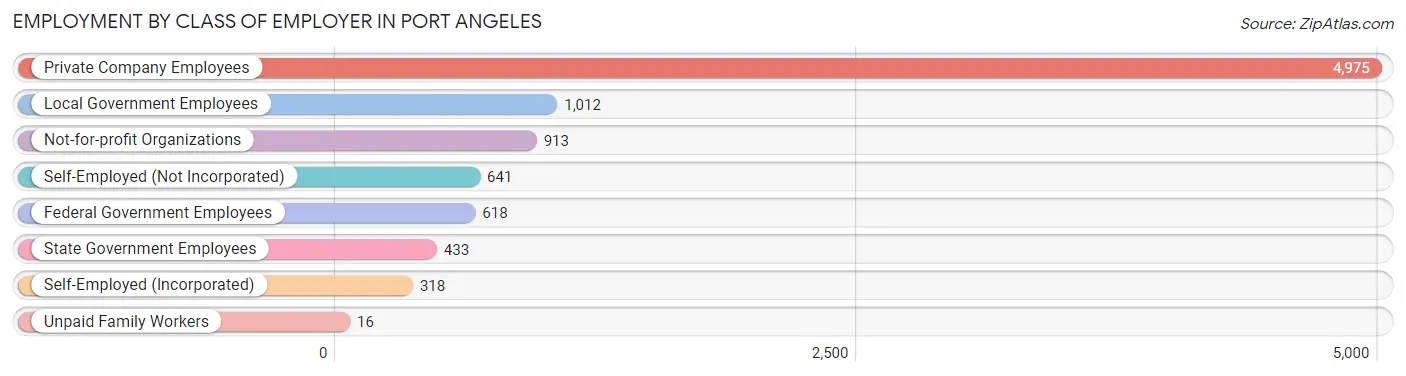
| Employer Class | # Employees | % Employees |
| Private Company Employees | 4,975 | 55.7% |
| Self-Employed (Incorporated) | 318 | 3.6% |
| Self-Employed (Not Incorporated) | 641 | 7.2% |
| Not-for-profit Organizations | 913 | 10.2% |
| Local Government Employees | 1,012 | 11.3% |
| State Government Employees | 433 | 4.9% |
| Federal Government Employees | 618 | 6.9% |
| Unpaid Family Workers | 16 | 0.2% |
| Total | 8,926 | 100.0% |
Employment Status by Age in Port Angeles
According to the labor force statistics for Port Angeles, out of the total population over 16 years of age (16,728), 57.2% or 9,568 individuals are in the labor force, with 5.7% or 545 of them unemployed. The age group with the highest labor force participation rate is 35 to 44 years, with 83.2% or 2,073 individuals in the labor force. Within the labor force, the 16 to 19 years age range has the highest percentage of unemployed individuals, with 18.4% or 89 of them being unemployed.
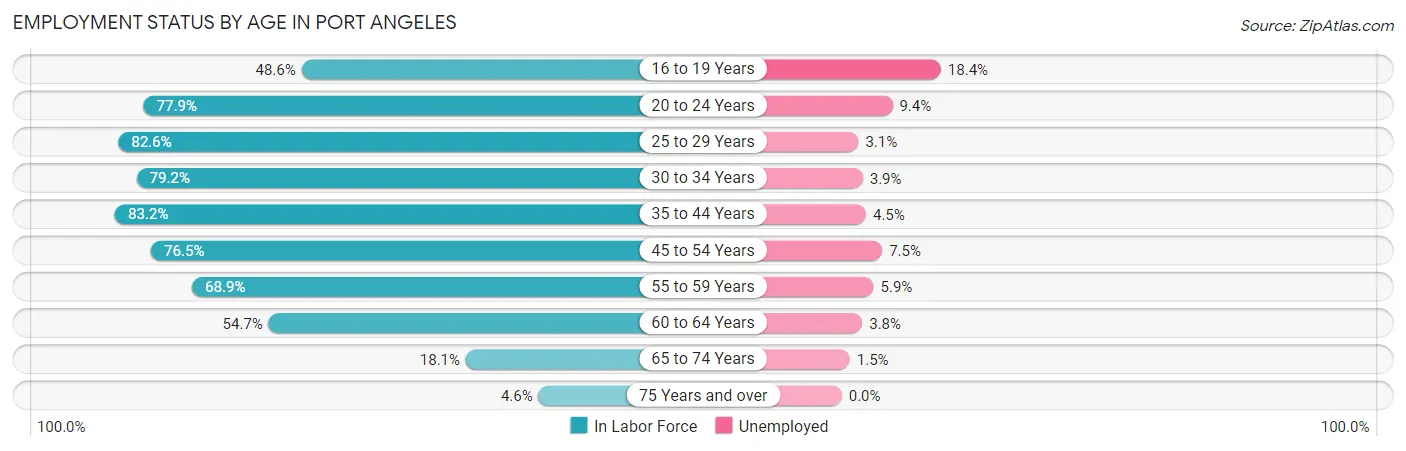
| Age Bracket | In Labor Force | Unemployed |
| 16 to 19 Years | 485 (48.6%) | 89 (18.4%) |
| 20 to 24 Years | 815 (77.9%) | 77 (9.4%) |
| 25 to 29 Years | 1,288 (82.6%) | 40 (3.1%) |
| 30 to 34 Years | 1,143 (79.2%) | 45 (3.9%) |
| 35 to 44 Years | 2,073 (83.2%) | 93 (4.5%) |
| 45 to 54 Years | 1,590 (76.5%) | 119 (7.5%) |
| 55 to 59 Years | 768 (68.9%) | 45 (5.9%) |
| 60 to 64 Years | 834 (54.7%) | 32 (3.8%) |
| 65 to 74 Years | 481 (18.1%) | 7 (1.5%) |
| 75 Years and over | 83 (4.6%) | 0 (0.0%) |
| Total | 9,568 (57.2%) | 545 (5.7%) |
Employment Status by Educational Attainment in Port Angeles
According to labor force statistics for Port Angeles, 75.4% of individuals (7,700) out of the total population between 25 and 64 years of age (10,212) are in the labor force, with 4.9% or 377 of them being unemployed. The group with the highest labor force participation rate are those with the educational attainment of bachelor's degree or higher, with 86.3% or 2,397 individuals in the labor force. Within the labor force, individuals with less than high school education have the highest percentage of unemployment, with 9.0% or 34 of them being unemployed.
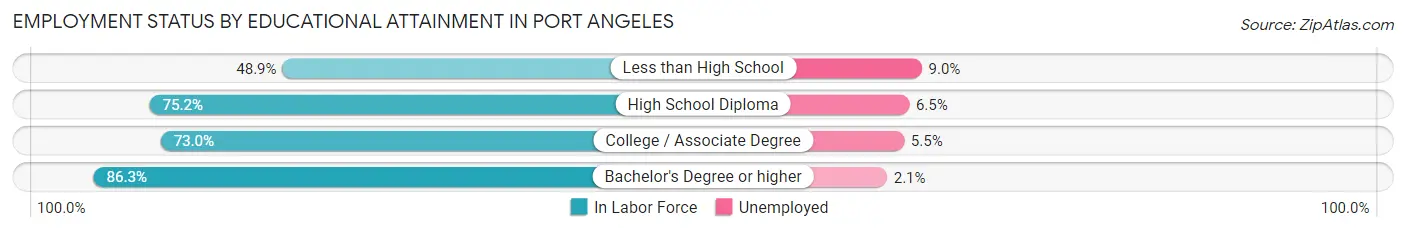
| Educational Attainment | In Labor Force | Unemployed |
| Less than High School | 379 (48.9%) | 70 (9.0%) |
| High School Diploma | 1,927 (75.2%) | 167 (6.5%) |
| College / Associate Degree | 2,991 (73.0%) | 225 (5.5%) |
| Bachelor's Degree or higher | 2,397 (86.3%) | 58 (2.1%) |
| Total | 7,700 (75.4%) | 500 (4.9%) |
Employment Occupations by Sex in Port Angeles
Management, Business, Science and Arts Occupations
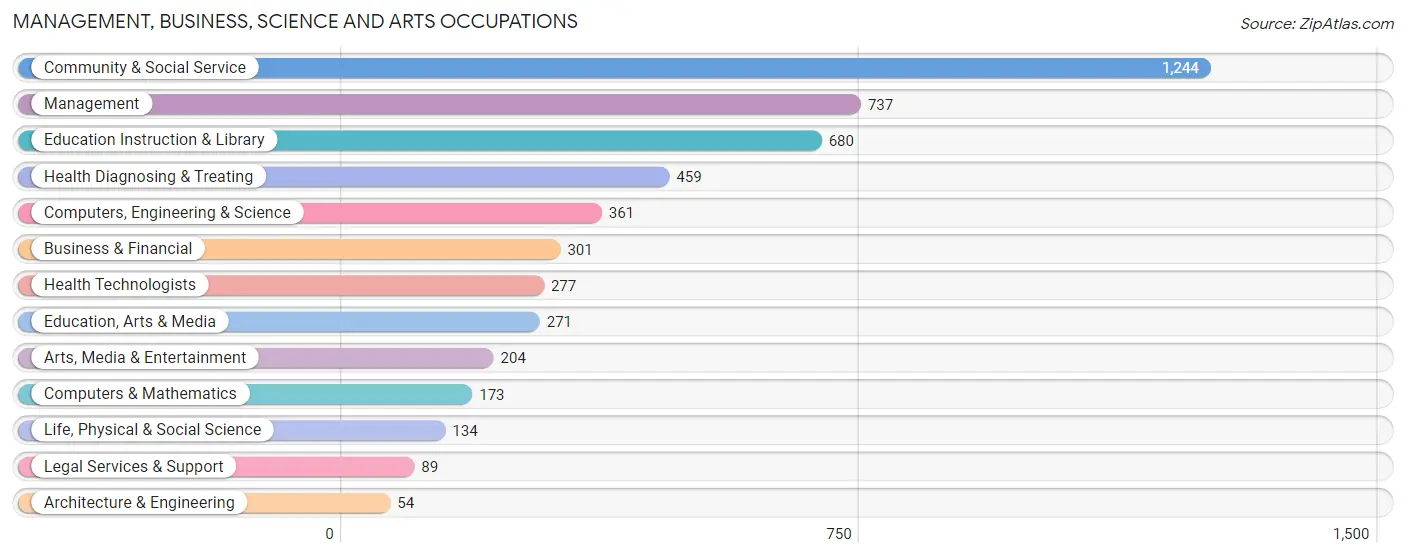
The most common Management, Business, Science and Arts occupations in Port Angeles are Community & Social Service (1,244 | 14.3%), Management (737 | 8.5%), Education Instruction & Library (680 | 7.8%), Health Diagnosing & Treating (459 | 5.3%), and Computers, Engineering & Science (361 | 4.2%).
Management, Business, Science and Arts Occupations by Sex
Within the Management, Business, Science and Arts occupations in Port Angeles, the most male-oriented occupations are Architecture & Engineering (100.0%), Computers & Mathematics (71.7%), and Computers, Engineering & Science (68.1%), while the most female-oriented occupations are Health Diagnosing & Treating (87.2%), Health Technologists (85.6%), and Education, Arts & Media (67.5%).
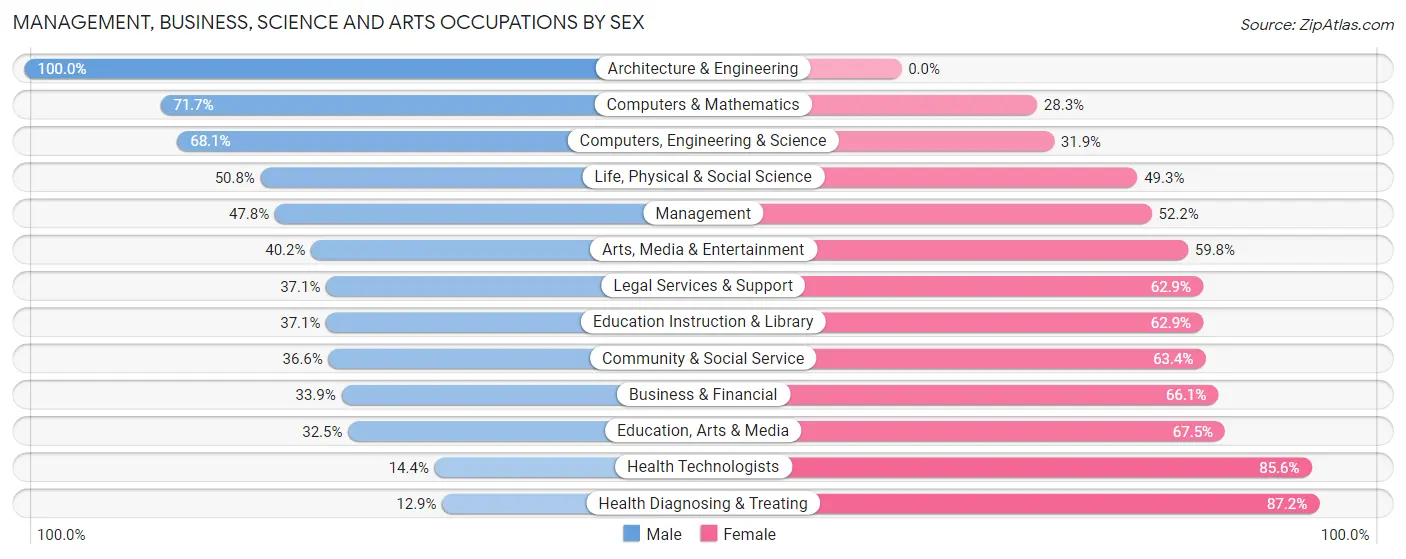
| Occupation | Male | Female |
| Management | 352 (47.8%) | 385 (52.2%) |
| Business & Financial | 102 (33.9%) | 199 (66.1%) |
| Computers, Engineering & Science | 246 (68.1%) | 115 (31.9%) |
| Computers & Mathematics | 124 (71.7%) | 49 (28.3%) |
| Architecture & Engineering | 54 (100.0%) | 0 (0.0%) |
| Life, Physical & Social Science | 68 (50.7%) | 66 (49.2%) |
| Community & Social Service | 455 (36.6%) | 789 (63.4%) |
| Education, Arts & Media | 88 (32.5%) | 183 (67.5%) |
| Legal Services & Support | 33 (37.1%) | 56 (62.9%) |
| Education Instruction & Library | 252 (37.1%) | 428 (62.9%) |
| Arts, Media & Entertainment | 82 (40.2%) | 122 (59.8%) |
| Health Diagnosing & Treating | 59 (12.9%) | 400 (87.2%) |
| Health Technologists | 40 (14.4%) | 237 (85.6%) |
| Total (Category) | 1,214 (39.1%) | 1,888 (60.9%) |
| Total (Overall) | 4,191 (48.2%) | 4,508 (51.8%) |
Services Occupations
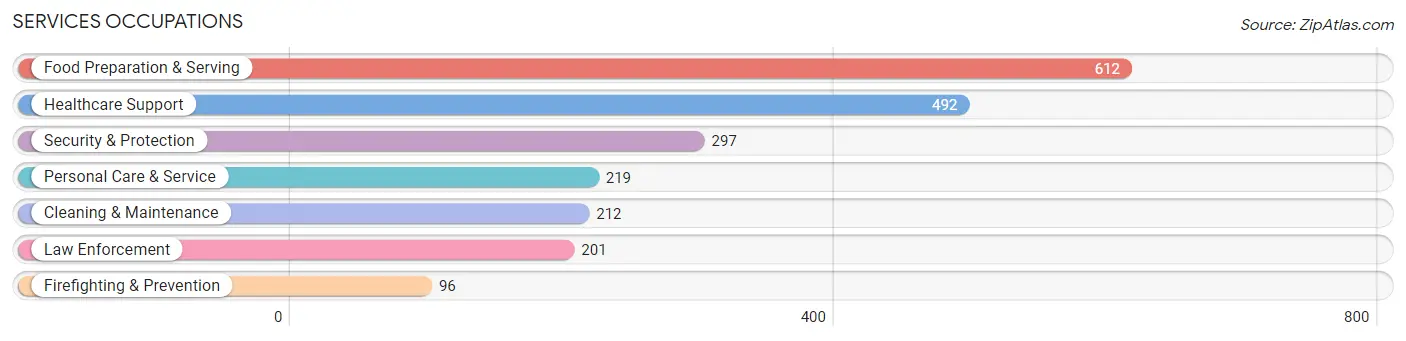
The most common Services occupations in Port Angeles are Food Preparation & Serving (612 | 7.0%), Healthcare Support (492 | 5.7%), Security & Protection (297 | 3.4%), Personal Care & Service (219 | 2.5%), and Cleaning & Maintenance (212 | 2.4%).
Services Occupations by Sex
Within the Services occupations in Port Angeles, the most male-oriented occupations are Law Enforcement (87.6%), Security & Protection (83.5%), and Firefighting & Prevention (75.0%), while the most female-oriented occupations are Personal Care & Service (90.4%), Healthcare Support (79.5%), and Food Preparation & Serving (55.1%).
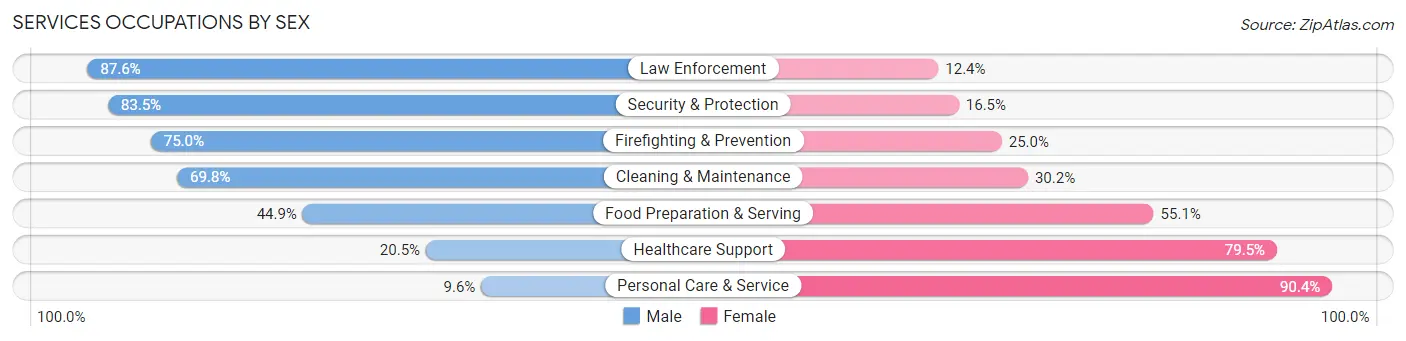
| Occupation | Male | Female |
| Healthcare Support | 101 (20.5%) | 391 (79.5%) |
| Security & Protection | 248 (83.5%) | 49 (16.5%) |
| Firefighting & Prevention | 72 (75.0%) | 24 (25.0%) |
| Law Enforcement | 176 (87.6%) | 25 (12.4%) |
| Food Preparation & Serving | 275 (44.9%) | 337 (55.1%) |
| Cleaning & Maintenance | 148 (69.8%) | 64 (30.2%) |
| Personal Care & Service | 21 (9.6%) | 198 (90.4%) |
| Total (Category) | 793 (43.3%) | 1,039 (56.7%) |
| Total (Overall) | 4,191 (48.2%) | 4,508 (51.8%) |
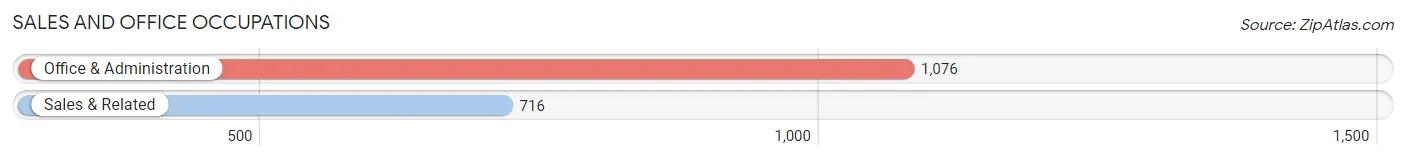
Sales and Office Occupations
The most common Sales and Office occupations in Port Angeles are Office & Administration (1,076 | 12.4%), and Sales & Related (716 | 8.2%).
Sales and Office Occupations by Sex
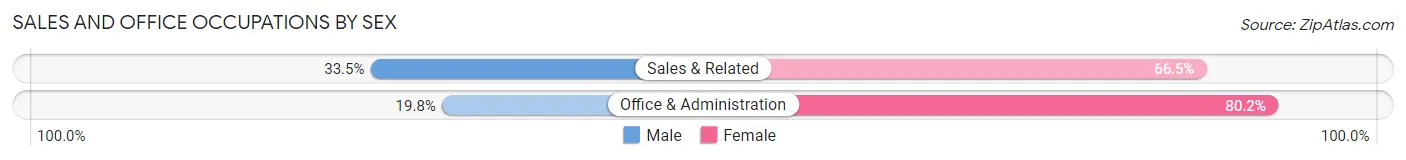
| Occupation | Male | Female |
| Sales & Related | 240 (33.5%) | 476 (66.5%) |
| Office & Administration | 213 (19.8%) | 863 (80.2%) |
| Total (Category) | 453 (25.3%) | 1,339 (74.7%) |
| Total (Overall) | 4,191 (48.2%) | 4,508 (51.8%) |
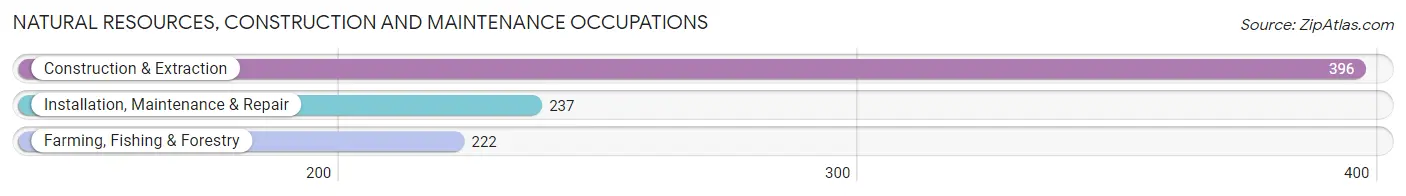
Natural Resources, Construction and Maintenance Occupations
The most common Natural Resources, Construction and Maintenance occupations in Port Angeles are Construction & Extraction (396 | 4.5%), Installation, Maintenance & Repair (237 | 2.7%), and Farming, Fishing & Forestry (222 | 2.5%).
Natural Resources, Construction and Maintenance Occupations by Sex
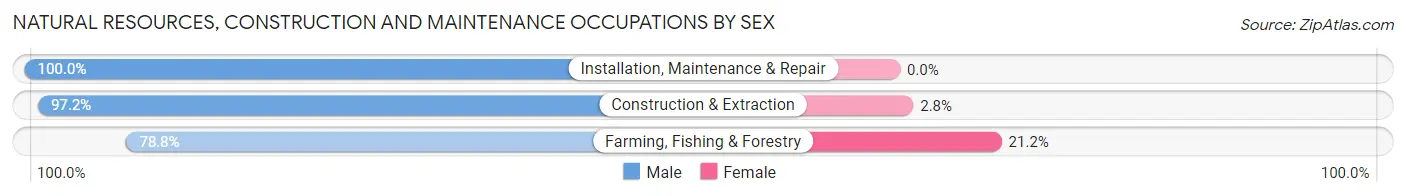
| Occupation | Male | Female |
| Farming, Fishing & Forestry | 175 (78.8%) | 47 (21.2%) |
| Construction & Extraction | 385 (97.2%) | 11 (2.8%) |
| Installation, Maintenance & Repair | 237 (100.0%) | 0 (0.0%) |
| Total (Category) | 797 (93.2%) | 58 (6.8%) |
| Total (Overall) | 4,191 (48.2%) | 4,508 (51.8%) |
Production, Transportation and Moving Occupations
The most common Production, Transportation and Moving occupations in Port Angeles are Production (457 | 5.2%), Material Moving (338 | 3.9%), and Transportation (323 | 3.7%).
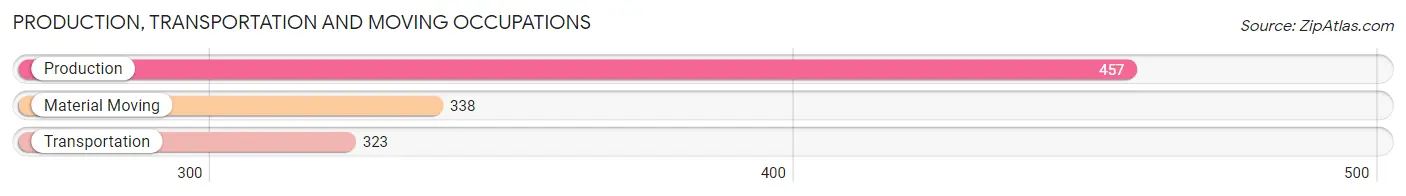
Production, Transportation and Moving Occupations by Sex
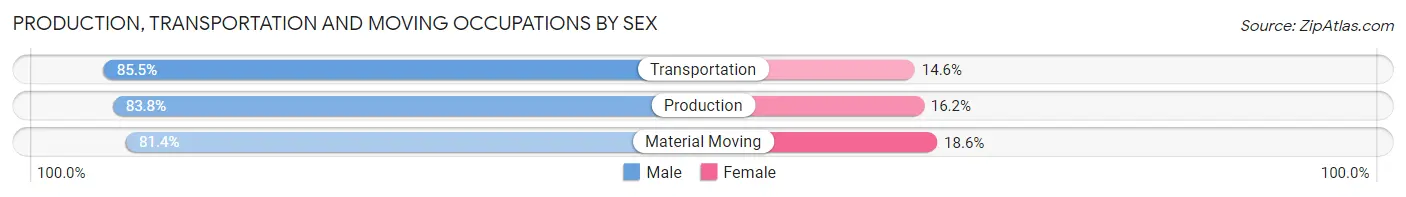
| Occupation | Male | Female |
| Production | 383 (83.8%) | 74 (16.2%) |
| Transportation | 276 (85.5%) | 47 (14.5%) |
| Material Moving | 275 (81.4%) | 63 (18.6%) |
| Total (Category) | 934 (83.5%) | 184 (16.5%) |
| Total (Overall) | 4,191 (48.2%) | 4,508 (51.8%) |
Employment Industries by Sex in Port Angeles
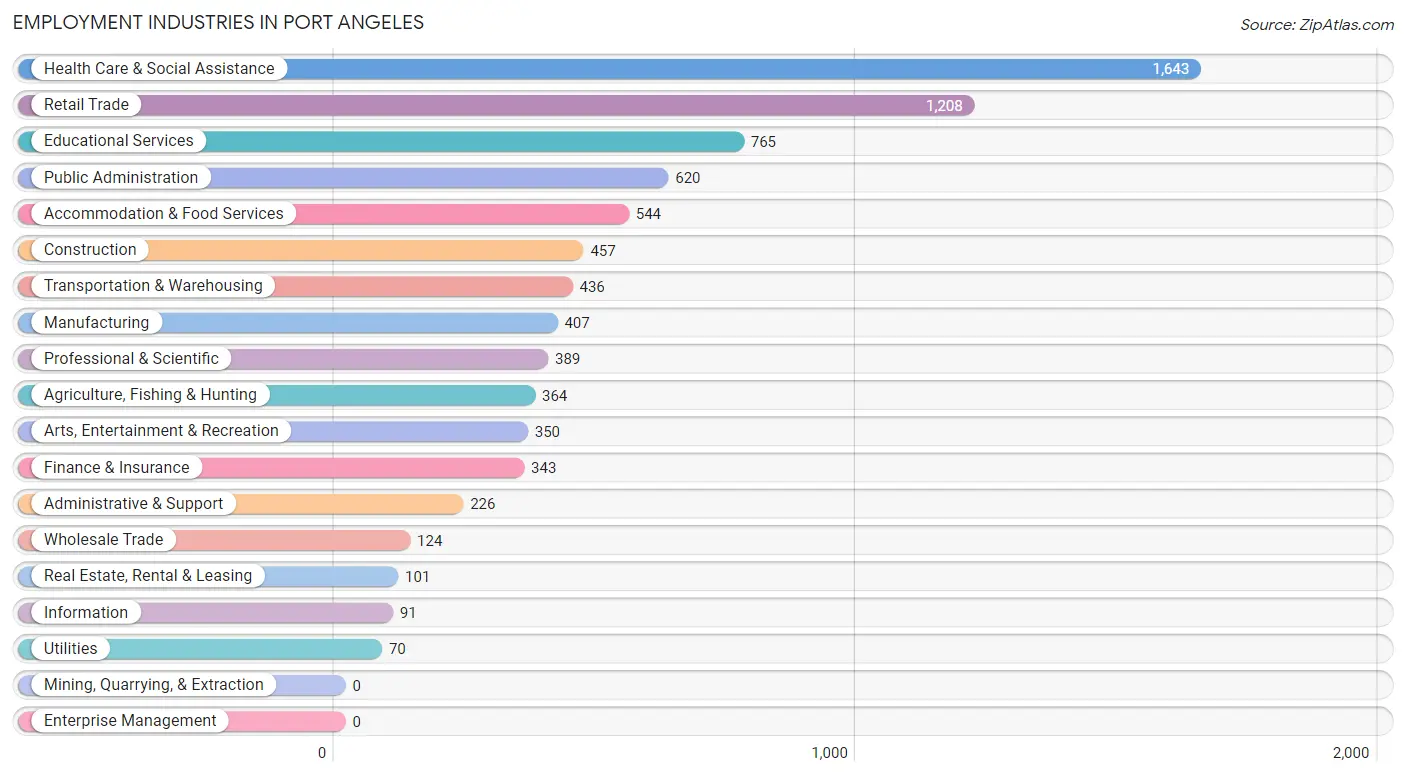
Employment Industries in Port Angeles
The major employment industries in Port Angeles include Health Care & Social Assistance (1,643 | 18.9%), Retail Trade (1,208 | 13.9%), Educational Services (765 | 8.8%), Public Administration (620 | 7.1%), and Accommodation & Food Services (544 | 6.2%).
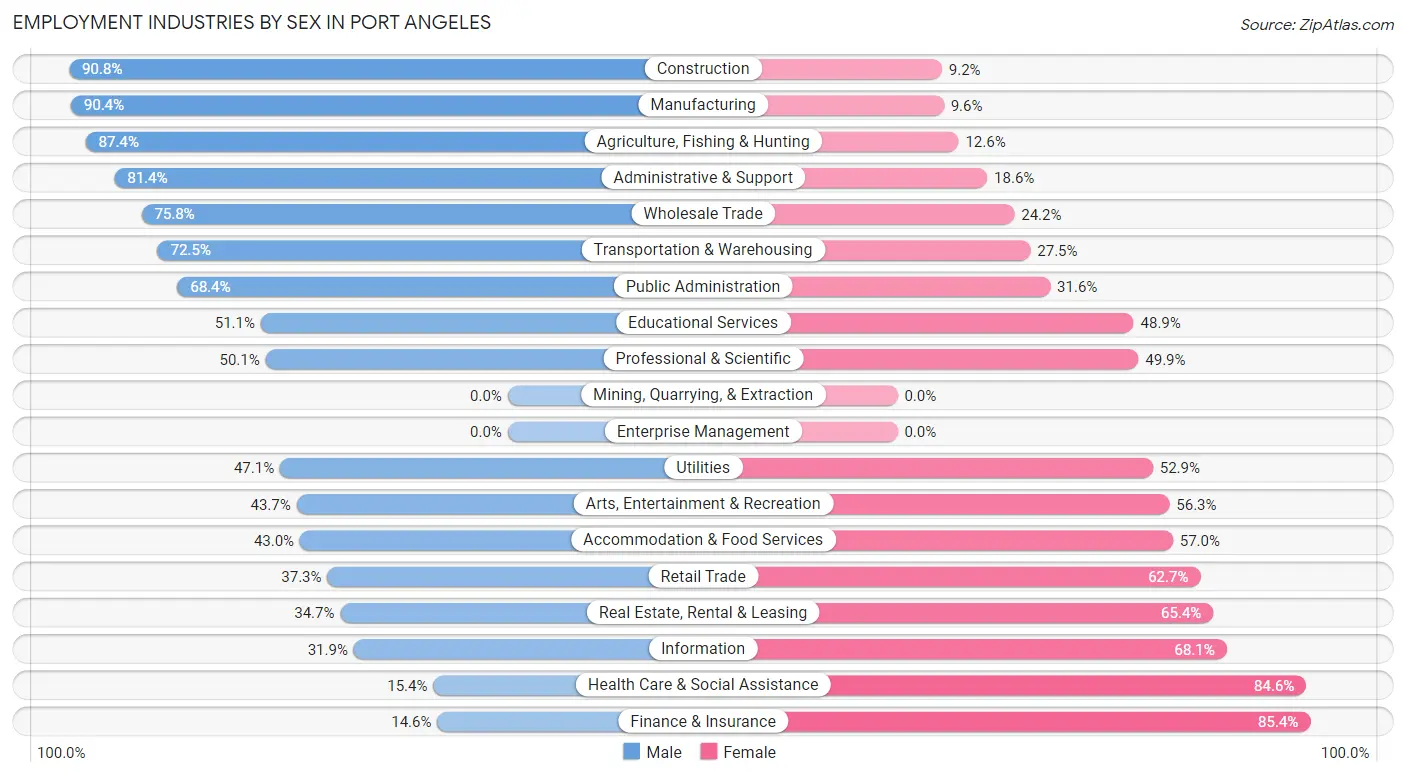
Employment Industries by Sex in Port Angeles
The Port Angeles industries that see more men than women are Construction (90.8%), Manufacturing (90.4%), and Agriculture, Fishing & Hunting (87.4%), whereas the industries that tend to have a higher number of women are Finance & Insurance (85.4%), Health Care & Social Assistance (84.6%), and Information (68.1%).
| Industry | Male | Female |
| Agriculture, Fishing & Hunting | 318 (87.4%) | 46 (12.6%) |
| Mining, Quarrying, & Extraction | 0 (0.0%) | 0 (0.0%) |
| Construction | 415 (90.8%) | 42 (9.2%) |
| Manufacturing | 368 (90.4%) | 39 (9.6%) |
| Wholesale Trade | 94 (75.8%) | 30 (24.2%) |
| Retail Trade | 451 (37.3%) | 757 (62.7%) |
| Transportation & Warehousing | 316 (72.5%) | 120 (27.5%) |
| Utilities | 33 (47.1%) | 37 (52.9%) |
| Information | 29 (31.9%) | 62 (68.1%) |
| Finance & Insurance | 50 (14.6%) | 293 (85.4%) |
| Real Estate, Rental & Leasing | 35 (34.6%) | 66 (65.3%) |
| Professional & Scientific | 195 (50.1%) | 194 (49.9%) |
| Enterprise Management | 0 (0.0%) | 0 (0.0%) |
| Administrative & Support | 184 (81.4%) | 42 (18.6%) |
| Educational Services | 391 (51.1%) | 374 (48.9%) |
| Health Care & Social Assistance | 253 (15.4%) | 1,390 (84.6%) |
| Arts, Entertainment & Recreation | 153 (43.7%) | 197 (56.3%) |
| Accommodation & Food Services | 234 (43.0%) | 310 (57.0%) |
| Public Administration | 424 (68.4%) | 196 (31.6%) |
| Total | 4,191 (48.2%) | 4,508 (51.8%) |
Education in Port Angeles
School Enrollment in Port Angeles
The most common levels of schooling among the 3,792 students in Port Angeles are middle school (872 | 23.0%), college / undergraduate (825 | 21.8%), and high school (791 | 20.9%).
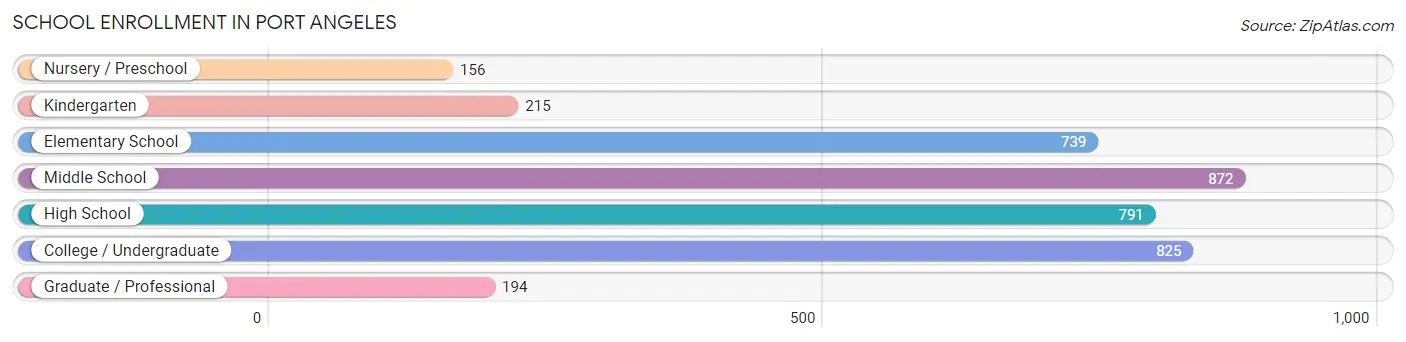
| School Level | # Students | % Students |
| Nursery / Preschool | 156 | 4.1% |
| Kindergarten | 215 | 5.7% |
| Elementary School | 739 | 19.5% |
| Middle School | 872 | 23.0% |
| High School | 791 | 20.9% |
| College / Undergraduate | 825 | 21.8% |
| Graduate / Professional | 194 | 5.1% |
| Total | 3,792 | 100.0% |
School Enrollment by Age by Funding Source in Port Angeles
Out of a total of 3,792 students who are enrolled in schools in Port Angeles, 531 (14.0%) attend a private institution, while the remaining 3,261 (86.0%) are enrolled in public schools. The age group of 3 to 4 year olds has the highest likelihood of being enrolled in private schools, with 80 (59.7% in the age bracket) enrolled. Conversely, the age group of 15 to 17 year olds has the lowest likelihood of being enrolled in a private school, with 600 (95.5% in the age bracket) attending a public institution.
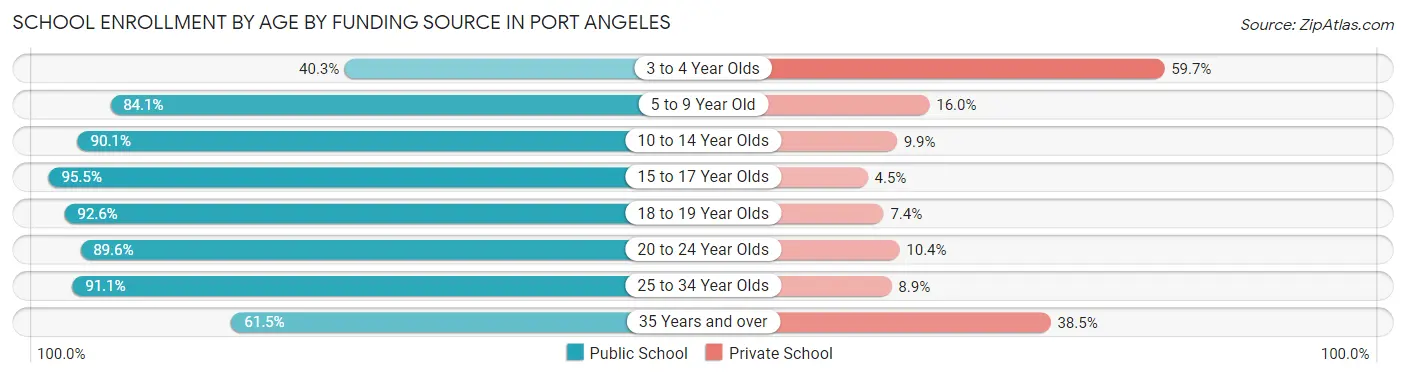
| Age Bracket | Public School | Private School |
| 3 to 4 Year Olds | 54 (40.3%) | 80 (59.7%) |
| 5 to 9 Year Old | 780 (84.1%) | 148 (16.0%) |
| 10 to 14 Year Olds | 921 (90.1%) | 101 (9.9%) |
| 15 to 17 Year Olds | 600 (95.5%) | 28 (4.5%) |
| 18 to 19 Year Olds | 262 (92.6%) | 21 (7.4%) |
| 20 to 24 Year Olds | 242 (89.6%) | 28 (10.4%) |
| 25 to 34 Year Olds | 246 (91.1%) | 24 (8.9%) |
| 35 Years and over | 158 (61.5%) | 99 (38.5%) |
| Total | 3,261 (86.0%) | 531 (14.0%) |
Educational Attainment by Field of Study in Port Angeles
Education (813 | 16.2%), bio, nature & agricultural (703 | 14.0%), business (678 | 13.5%), arts & humanities (457 | 9.1%), and science & technology (417 | 8.3%) are the most common fields of study among 5,026 individuals in Port Angeles who have obtained a bachelor's degree or higher.
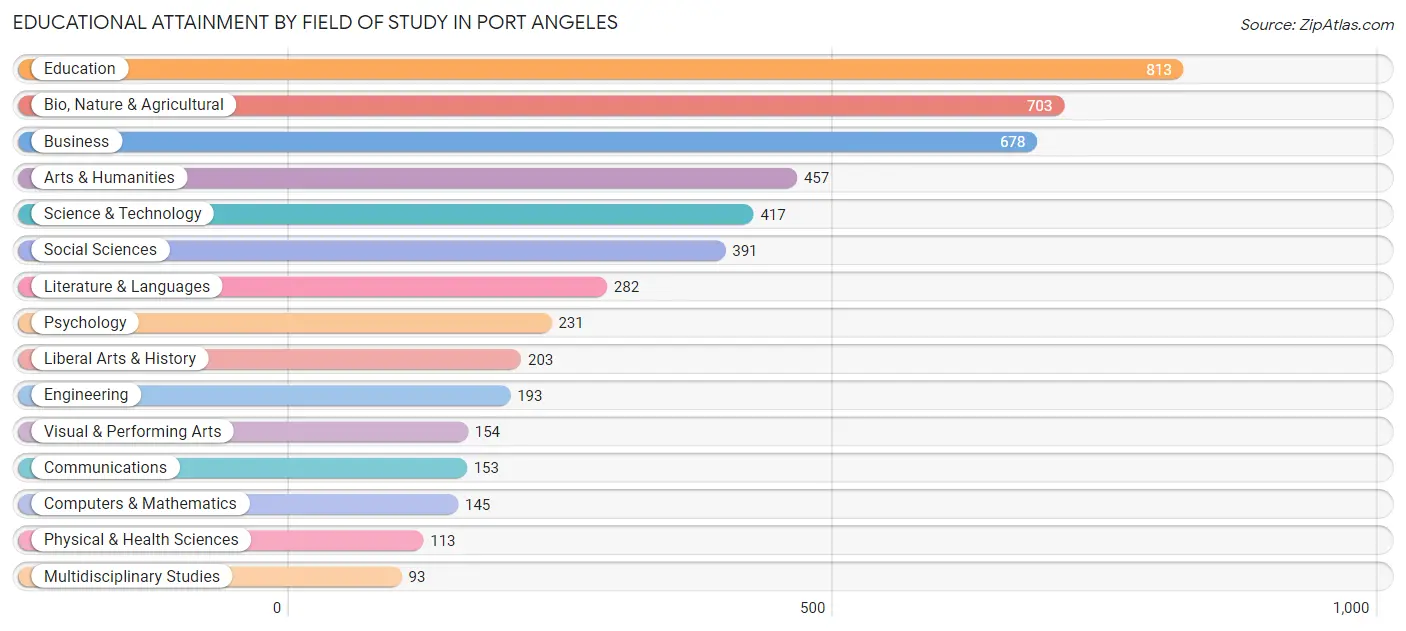
| Field of Study | # Graduates | % Graduates |
| Computers & Mathematics | 145 | 2.9% |
| Bio, Nature & Agricultural | 703 | 14.0% |
| Physical & Health Sciences | 113 | 2.2% |
| Psychology | 231 | 4.6% |
| Social Sciences | 391 | 7.8% |
| Engineering | 193 | 3.8% |
| Multidisciplinary Studies | 93 | 1.8% |
| Science & Technology | 417 | 8.3% |
| Business | 678 | 13.5% |
| Education | 813 | 16.2% |
| Literature & Languages | 282 | 5.6% |
| Liberal Arts & History | 203 | 4.0% |
| Visual & Performing Arts | 154 | 3.1% |
| Communications | 153 | 3.0% |
| Arts & Humanities | 457 | 9.1% |
| Total | 5,026 | 100.0% |
Transportation & Commute in Port Angeles
Vehicle Availability by Sex in Port Angeles
The most prevalent vehicle ownership categories in Port Angeles are males with 2 vehicles (1,949, accounting for 44.1%) and females with 2 vehicles (1,669, making up 44.0%).
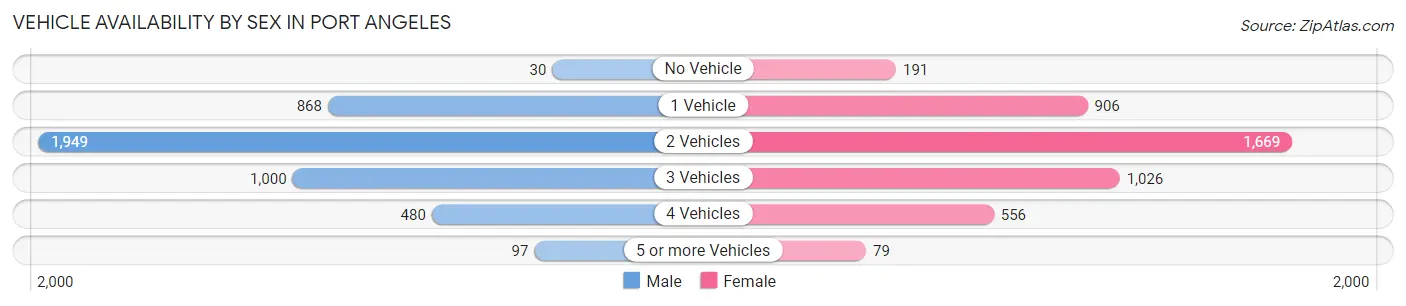
| Vehicles Available | Male | Female |
| No Vehicle | 30 (0.7%) | 191 (4.3%) |
| 1 Vehicle | 868 (19.6%) | 906 (20.5%) |
| 2 Vehicles | 1,949 (44.1%) | 1,669 (37.7%) |
| 3 Vehicles | 1,000 (22.6%) | 1,026 (23.2%) |
| 4 Vehicles | 480 (10.8%) | 556 (12.6%) |
| 5 or more Vehicles | 97 (2.2%) | 79 (1.8%) |
| Total | 4,424 (100.0%) | 4,427 (100.0%) |
Commute Time in Port Angeles
The most frequently occuring commute durations in Port Angeles are 5 to 9 minutes (2,044 commuters, 25.2%), 10 to 14 minutes (1,918 commuters, 23.6%), and 15 to 19 minutes (890 commuters, 11.0%).
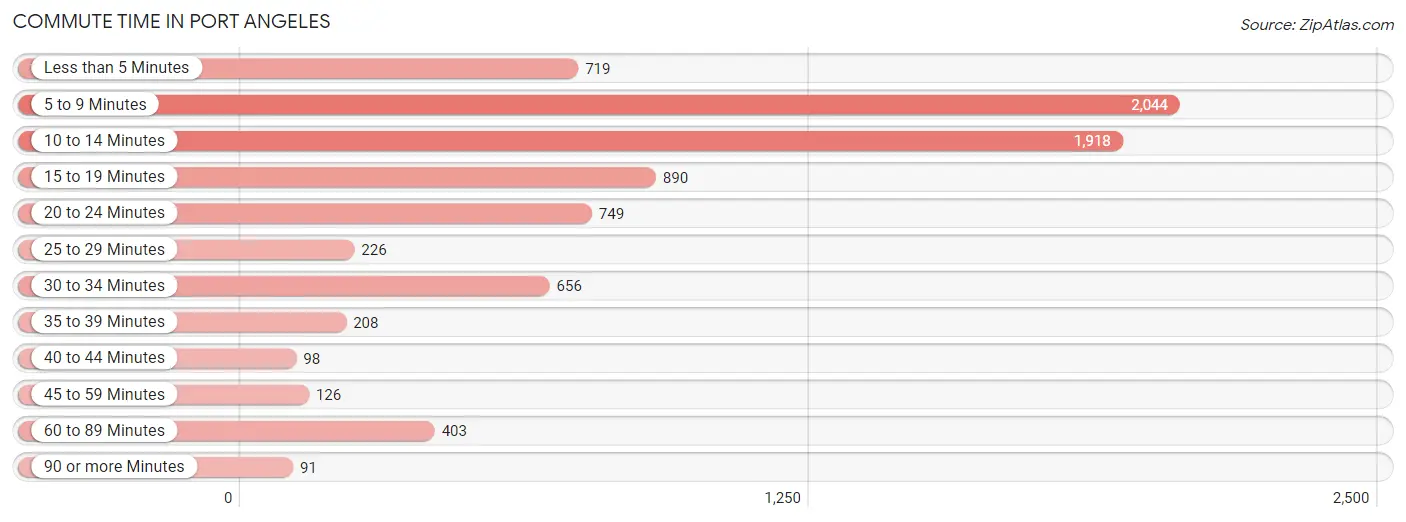
| Commute Time | # Commuters | % Commuters |
| Less than 5 Minutes | 719 | 8.8% |
| 5 to 9 Minutes | 2,044 | 25.2% |
| 10 to 14 Minutes | 1,918 | 23.6% |
| 15 to 19 Minutes | 890 | 11.0% |
| 20 to 24 Minutes | 749 | 9.2% |
| 25 to 29 Minutes | 226 | 2.8% |
| 30 to 34 Minutes | 656 | 8.1% |
| 35 to 39 Minutes | 208 | 2.6% |
| 40 to 44 Minutes | 98 | 1.2% |
| 45 to 59 Minutes | 126 | 1.5% |
| 60 to 89 Minutes | 403 | 5.0% |
| 90 or more Minutes | 91 | 1.1% |
Commute Time by Sex in Port Angeles
The most common commute times in Port Angeles are 10 to 14 minutes (1,115 commuters, 26.9%) for males and 5 to 9 minutes (1,079 commuters, 27.1%) for females.
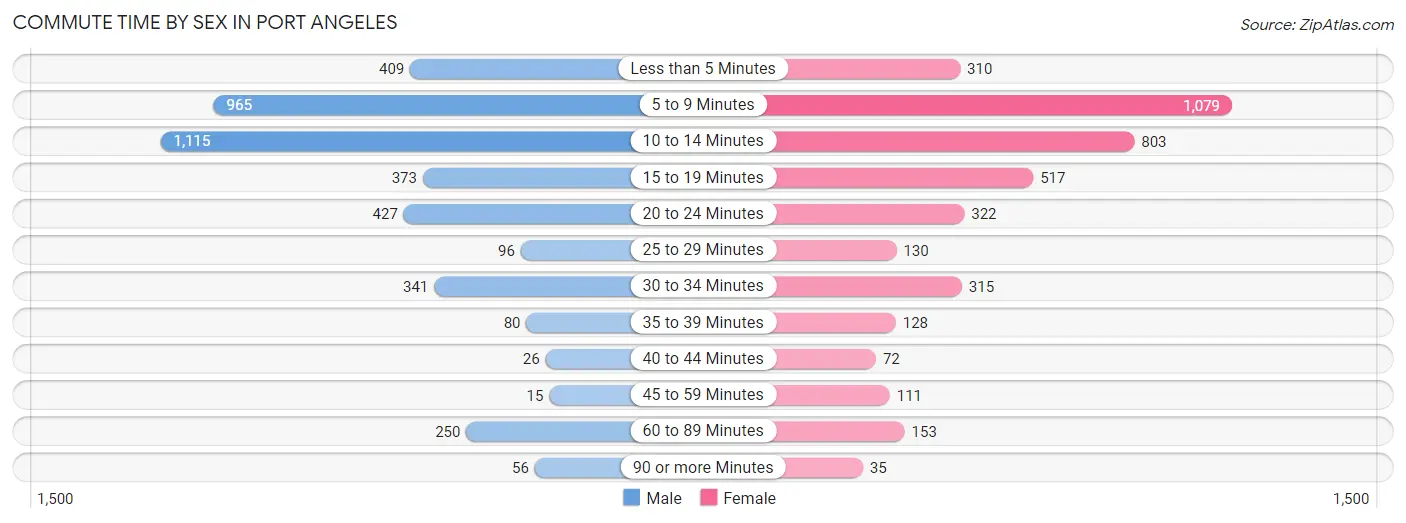
| Commute Time | Male | Female |
| Less than 5 Minutes | 409 (9.9%) | 310 (7.8%) |
| 5 to 9 Minutes | 965 (23.2%) | 1,079 (27.1%) |
| 10 to 14 Minutes | 1,115 (26.9%) | 803 (20.2%) |
| 15 to 19 Minutes | 373 (9.0%) | 517 (13.0%) |
| 20 to 24 Minutes | 427 (10.3%) | 322 (8.1%) |
| 25 to 29 Minutes | 96 (2.3%) | 130 (3.3%) |
| 30 to 34 Minutes | 341 (8.2%) | 315 (7.9%) |
| 35 to 39 Minutes | 80 (1.9%) | 128 (3.2%) |
| 40 to 44 Minutes | 26 (0.6%) | 72 (1.8%) |
| 45 to 59 Minutes | 15 (0.4%) | 111 (2.8%) |
| 60 to 89 Minutes | 250 (6.0%) | 153 (3.8%) |
| 90 or more Minutes | 56 (1.3%) | 35 (0.9%) |
Time of Departure to Work by Sex in Port Angeles
The most frequent times of departure to work in Port Angeles are 6:30 AM to 6:59 AM (776, 18.7%) for males and 7:30 AM to 7:59 AM (990, 24.9%) for females.
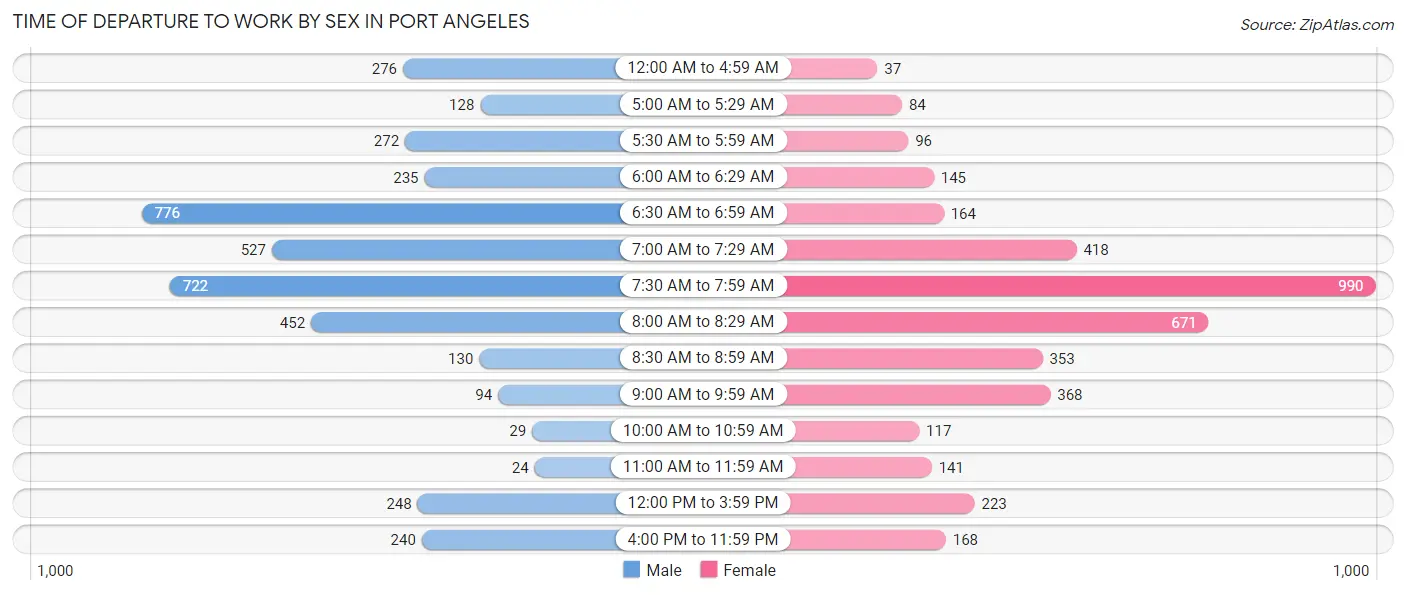
| Time of Departure | Male | Female |
| 12:00 AM to 4:59 AM | 276 (6.7%) | 37 (0.9%) |
| 5:00 AM to 5:29 AM | 128 (3.1%) | 84 (2.1%) |
| 5:30 AM to 5:59 AM | 272 (6.6%) | 96 (2.4%) |
| 6:00 AM to 6:29 AM | 235 (5.7%) | 145 (3.6%) |
| 6:30 AM to 6:59 AM | 776 (18.7%) | 164 (4.1%) |
| 7:00 AM to 7:29 AM | 527 (12.7%) | 418 (10.5%) |
| 7:30 AM to 7:59 AM | 722 (17.4%) | 990 (24.9%) |
| 8:00 AM to 8:29 AM | 452 (10.9%) | 671 (16.9%) |
| 8:30 AM to 8:59 AM | 130 (3.1%) | 353 (8.9%) |
| 9:00 AM to 9:59 AM | 94 (2.3%) | 368 (9.3%) |
| 10:00 AM to 10:59 AM | 29 (0.7%) | 117 (2.9%) |
| 11:00 AM to 11:59 AM | 24 (0.6%) | 141 (3.5%) |
| 12:00 PM to 3:59 PM | 248 (6.0%) | 223 (5.6%) |
| 4:00 PM to 11:59 PM | 240 (5.8%) | 168 (4.2%) |
| Total | 4,153 (100.0%) | 3,975 (100.0%) |
Housing Occupancy in Port Angeles
Occupancy by Ownership in Port Angeles
Of the total 9,087 dwellings in Port Angeles, owner-occupied units account for 5,056 (55.6%), while renter-occupied units make up 4,031 (44.4%).
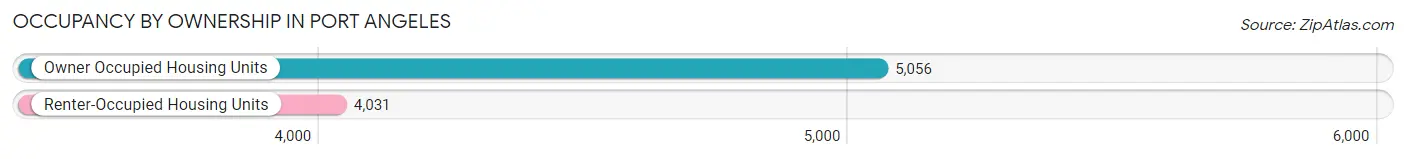
| Occupancy | # Housing Units | % Housing Units |
| Owner Occupied Housing Units | 5,056 | 55.6% |
| Renter-Occupied Housing Units | 4,031 | 44.4% |
| Total Occupied Housing Units | 9,087 | 100.0% |
Occupancy by Household Size in Port Angeles
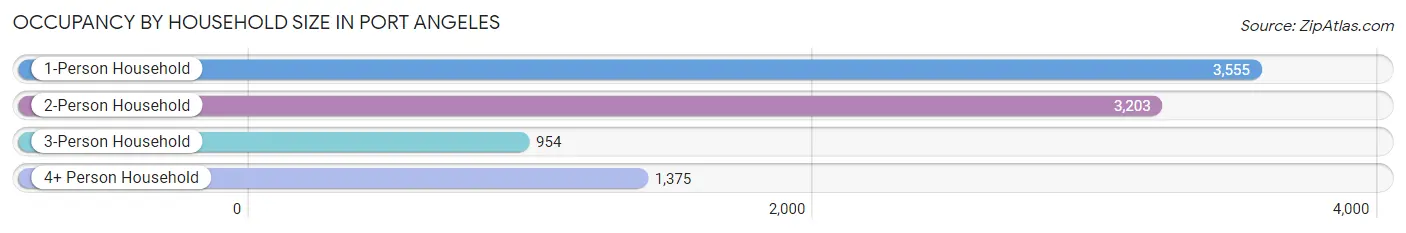
| Household Size | # Housing Units | % Housing Units |
| 1-Person Household | 3,555 | 39.1% |
| 2-Person Household | 3,203 | 35.2% |
| 3-Person Household | 954 | 10.5% |
| 4+ Person Household | 1,375 | 15.1% |
| Total Housing Units | 9,087 | 100.0% |
Occupancy by Ownership by Household Size in Port Angeles
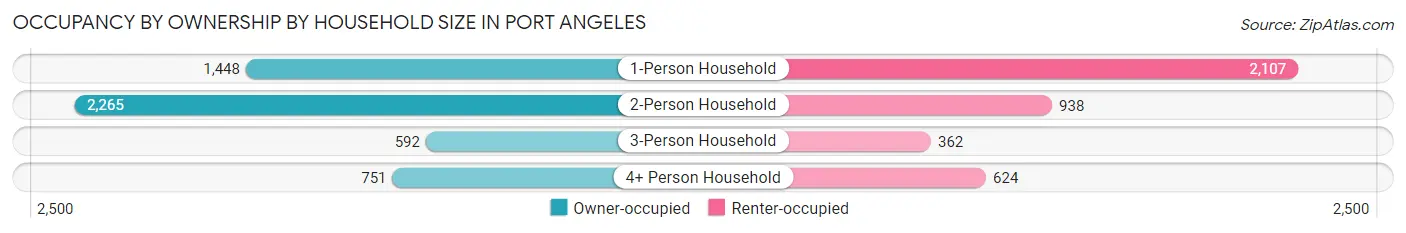
| Household Size | Owner-occupied | Renter-occupied |
| 1-Person Household | 1,448 (40.7%) | 2,107 (59.3%) |
| 2-Person Household | 2,265 (70.7%) | 938 (29.3%) |
| 3-Person Household | 592 (62.1%) | 362 (38.0%) |
| 4+ Person Household | 751 (54.6%) | 624 (45.4%) |
| Total Housing Units | 5,056 (55.6%) | 4,031 (44.4%) |
Occupancy by Educational Attainment in Port Angeles
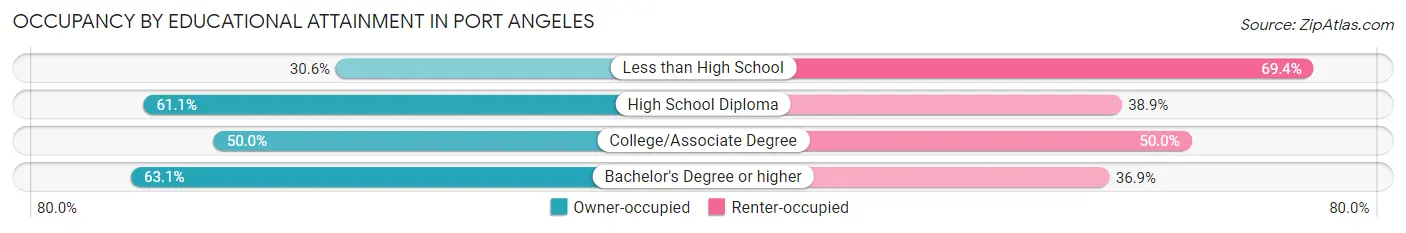
| Household Size | Owner-occupied | Renter-occupied |
| Less than High School | 128 (30.6%) | 290 (69.4%) |
| High School Diploma | 1,073 (61.1%) | 682 (38.9%) |
| College/Associate Degree | 1,934 (50.0%) | 1,935 (50.0%) |
| Bachelor's Degree or higher | 1,921 (63.1%) | 1,124 (36.9%) |
Occupancy by Age of Householder in Port Angeles
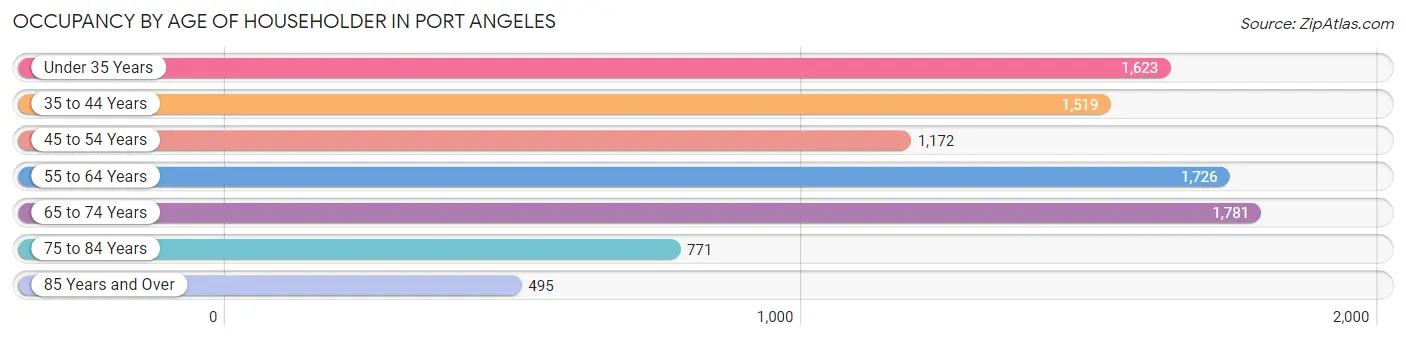
| Age Bracket | # Households | % Households |
| Under 35 Years | 1,623 | 17.9% |
| 35 to 44 Years | 1,519 | 16.7% |
| 45 to 54 Years | 1,172 | 12.9% |
| 55 to 64 Years | 1,726 | 19.0% |
| 65 to 74 Years | 1,781 | 19.6% |
| 75 to 84 Years | 771 | 8.5% |
| 85 Years and Over | 495 | 5.4% |
| Total | 9,087 | 100.0% |
Housing Finances in Port Angeles
Median Income by Occupancy in Port Angeles
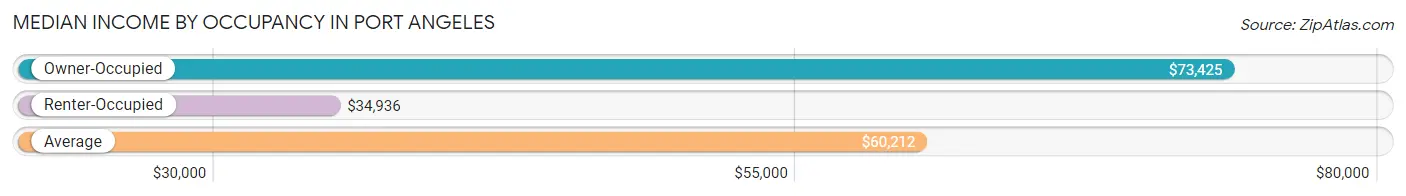
| Occupancy Type | # Households | Median Income |
| Owner-Occupied | 5,056 (55.6%) | $73,425 |
| Renter-Occupied | 4,031 (44.4%) | $34,936 |
| Average | 9,087 (100.0%) | $60,212 |
Occupancy by Householder Income Bracket in Port Angeles
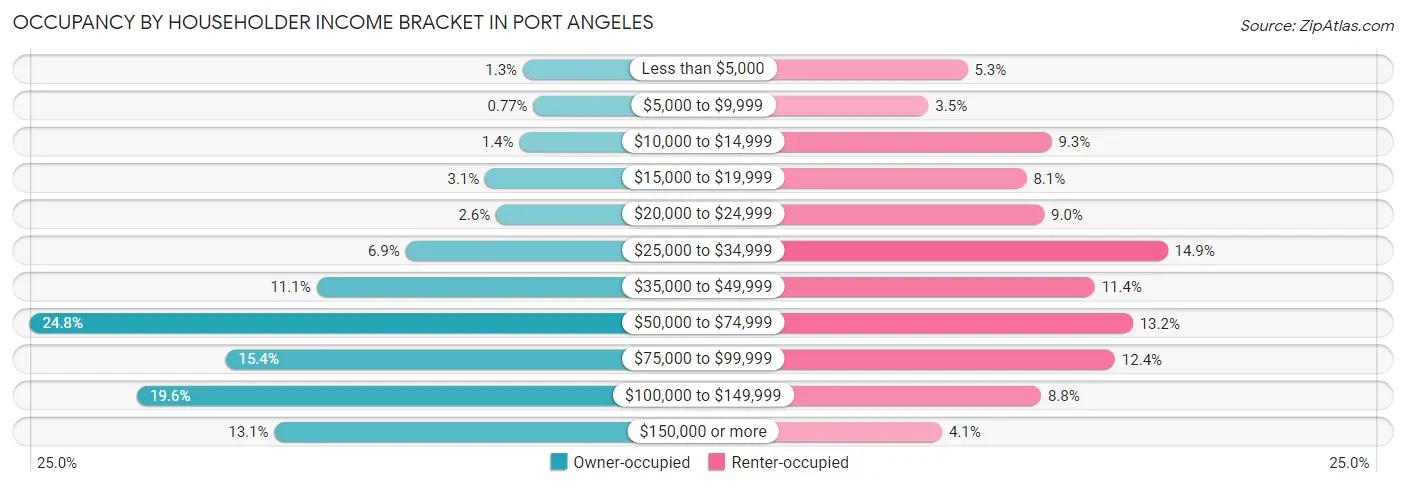
| Income Bracket | Owner-occupied | Renter-occupied |
| Less than $5,000 | 64 (1.3%) | 215 (5.3%) |
| $5,000 to $9,999 | 39 (0.8%) | 140 (3.5%) |
| $10,000 to $14,999 | 73 (1.4%) | 376 (9.3%) |
| $15,000 to $19,999 | 155 (3.1%) | 328 (8.1%) |
| $20,000 to $24,999 | 129 (2.5%) | 362 (9.0%) |
| $25,000 to $34,999 | 347 (6.9%) | 599 (14.9%) |
| $35,000 to $49,999 | 561 (11.1%) | 459 (11.4%) |
| $50,000 to $74,999 | 1,252 (24.8%) | 532 (13.2%) |
| $75,000 to $99,999 | 780 (15.4%) | 498 (12.3%) |
| $100,000 to $149,999 | 993 (19.6%) | 356 (8.8%) |
| $150,000 or more | 663 (13.1%) | 166 (4.1%) |
| Total | 5,056 (100.0%) | 4,031 (100.0%) |
Monthly Housing Cost Tiers in Port Angeles
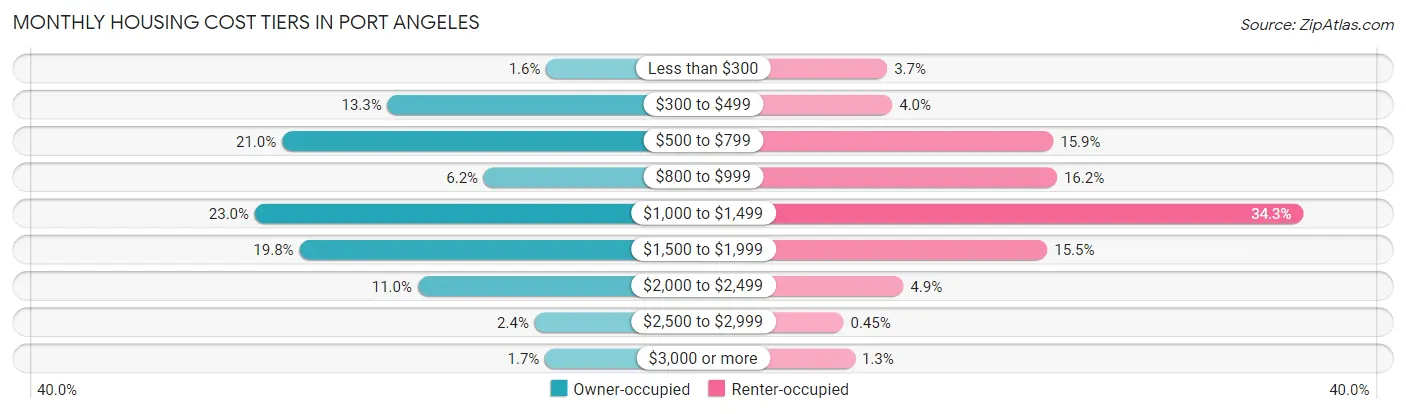
| Monthly Cost | Owner-occupied | Renter-occupied |
| Less than $300 | 80 (1.6%) | 148 (3.7%) |
| $300 to $499 | 671 (13.3%) | 163 (4.0%) |
| $500 to $799 | 1,064 (21.0%) | 641 (15.9%) |
| $800 to $999 | 312 (6.2%) | 652 (16.2%) |
| $1,000 to $1,499 | 1,165 (23.0%) | 1,383 (34.3%) |
| $1,500 to $1,999 | 999 (19.8%) | 623 (15.5%) |
| $2,000 to $2,499 | 558 (11.0%) | 196 (4.9%) |
| $2,500 to $2,999 | 123 (2.4%) | 18 (0.4%) |
| $3,000 or more | 84 (1.7%) | 52 (1.3%) |
| Total | 5,056 (100.0%) | 4,031 (100.0%) |
Physical Housing Characteristics in Port Angeles
Housing Structures in Port Angeles
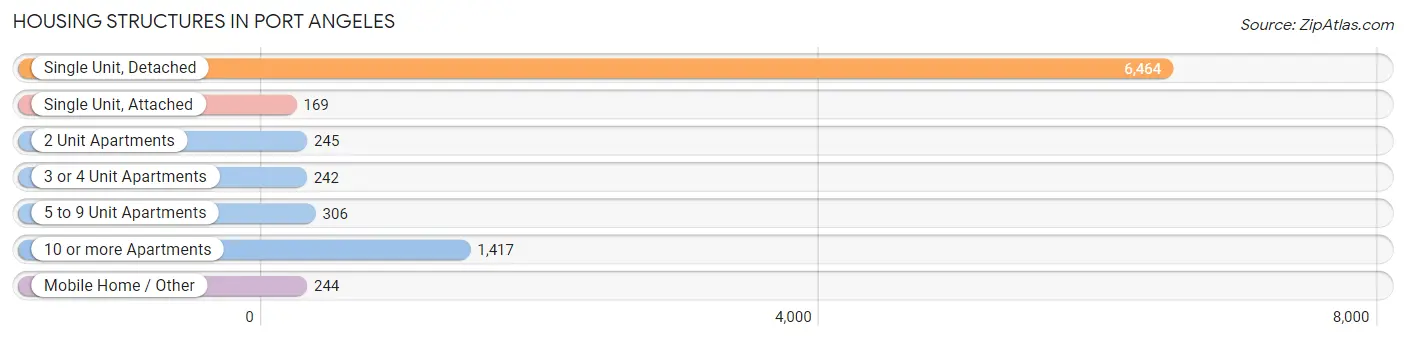
| Structure Type | # Housing Units | % Housing Units |
| Single Unit, Detached | 6,464 | 71.1% |
| Single Unit, Attached | 169 | 1.9% |
| 2 Unit Apartments | 245 | 2.7% |
| 3 or 4 Unit Apartments | 242 | 2.7% |
| 5 to 9 Unit Apartments | 306 | 3.4% |
| 10 or more Apartments | 1,417 | 15.6% |
| Mobile Home / Other | 244 | 2.7% |
| Total | 9,087 | 100.0% |
Housing Structures by Occupancy in Port Angeles
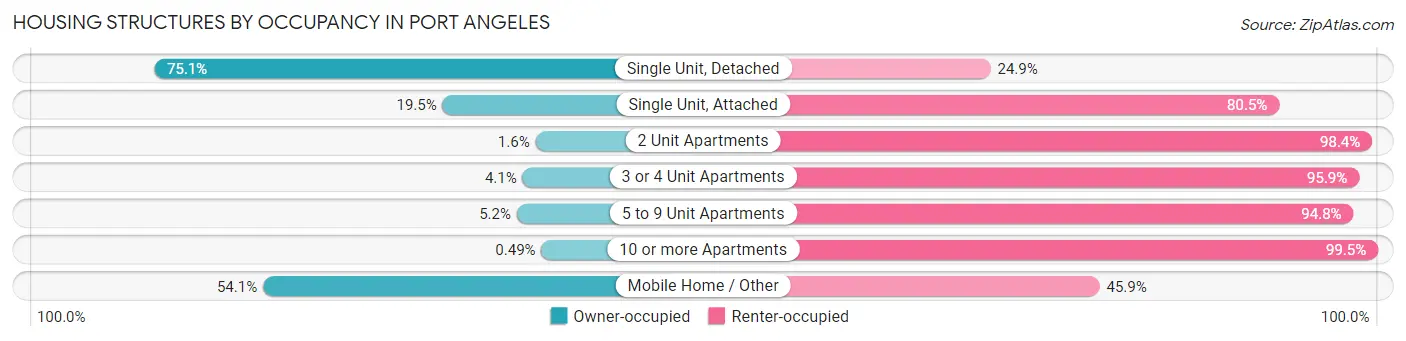
| Structure Type | Owner-occupied | Renter-occupied |
| Single Unit, Detached | 4,854 (75.1%) | 1,610 (24.9%) |
| Single Unit, Attached | 33 (19.5%) | 136 (80.5%) |
| 2 Unit Apartments | 4 (1.6%) | 241 (98.4%) |
| 3 or 4 Unit Apartments | 10 (4.1%) | 232 (95.9%) |
| 5 to 9 Unit Apartments | 16 (5.2%) | 290 (94.8%) |
| 10 or more Apartments | 7 (0.5%) | 1,410 (99.5%) |
| Mobile Home / Other | 132 (54.1%) | 112 (45.9%) |
| Total | 5,056 (55.6%) | 4,031 (44.4%) |
Housing Structures by Number of Rooms in Port Angeles
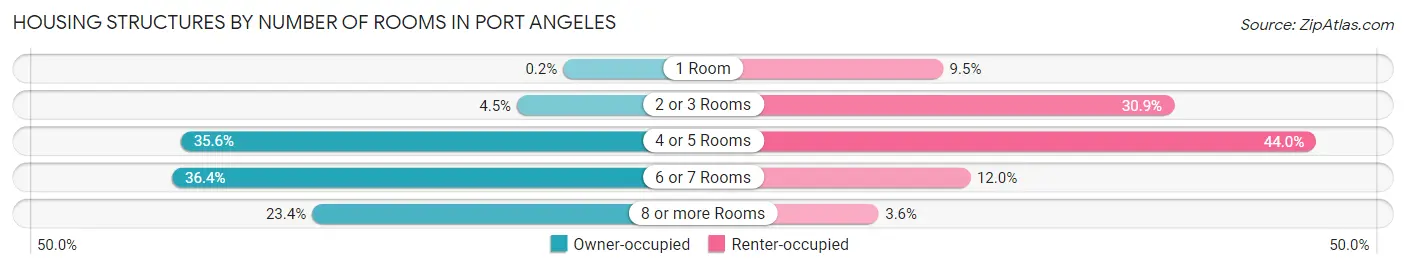
| Number of Rooms | Owner-occupied | Renter-occupied |
| 1 Room | 10 (0.2%) | 383 (9.5%) |
| 2 or 3 Rooms | 226 (4.5%) | 1,245 (30.9%) |
| 4 or 5 Rooms | 1,798 (35.6%) | 1,775 (44.0%) |
| 6 or 7 Rooms | 1,838 (36.3%) | 485 (12.0%) |
| 8 or more Rooms | 1,184 (23.4%) | 143 (3.5%) |
| Total | 5,056 (100.0%) | 4,031 (100.0%) |
Housing Structure by Heating Type in Port Angeles
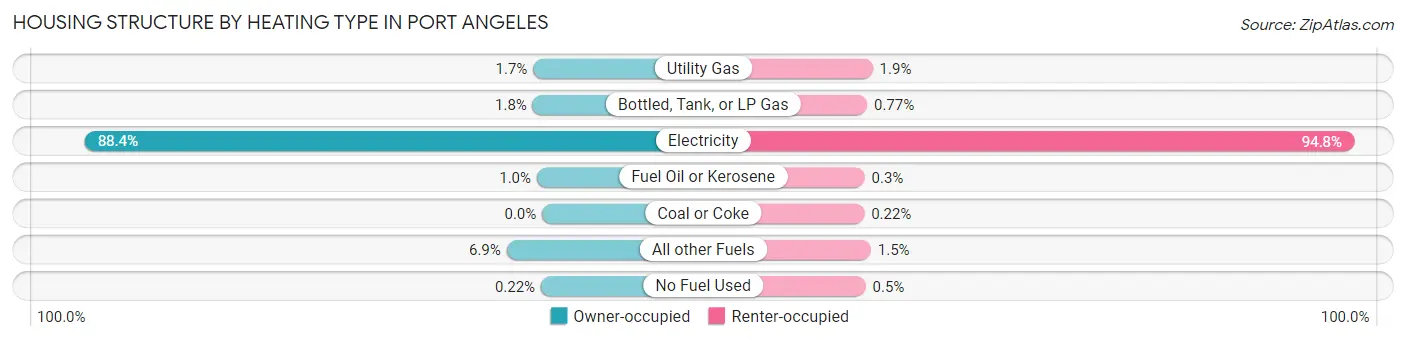
| Heating Type | Owner-occupied | Renter-occupied |
| Utility Gas | 87 (1.7%) | 75 (1.9%) |
| Bottled, Tank, or LP Gas | 92 (1.8%) | 31 (0.8%) |
| Electricity | 4,468 (88.4%) | 3,823 (94.8%) |
| Fuel Oil or Kerosene | 51 (1.0%) | 12 (0.3%) |
| Coal or Coke | 0 (0.0%) | 9 (0.2%) |
| All other Fuels | 347 (6.9%) | 61 (1.5%) |
| No Fuel Used | 11 (0.2%) | 20 (0.5%) |
| Total | 5,056 (100.0%) | 4,031 (100.0%) |
Household Vehicle Usage in Port Angeles
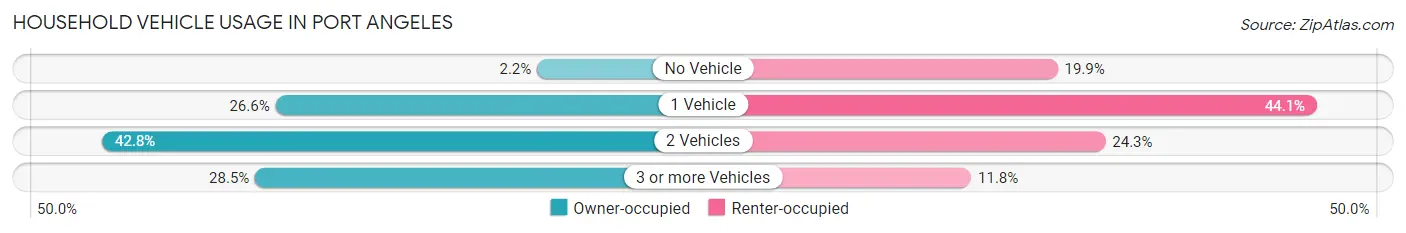
| Vehicles per Household | Owner-occupied | Renter-occupied |
| No Vehicle | 109 (2.2%) | 800 (19.9%) |
| 1 Vehicle | 1,344 (26.6%) | 1,776 (44.1%) |
| 2 Vehicles | 2,163 (42.8%) | 980 (24.3%) |
| 3 or more Vehicles | 1,440 (28.5%) | 475 (11.8%) |
| Total | 5,056 (100.0%) | 4,031 (100.0%) |
Real Estate & Mortgages in Port Angeles
Real Estate and Mortgage Overview in Port Angeles
| Characteristic | Without Mortgage | With Mortgage |
| Housing Units | 1,898 | 3,158 |
| Median Property Value | $293,900 | $293,700 |
| Median Household Income | $68,235 | $521 |
| Monthly Housing Costs | $591 | $84 |
| Real Estate Taxes | $2,471 | $117 |
Property Value by Mortgage Status in Port Angeles
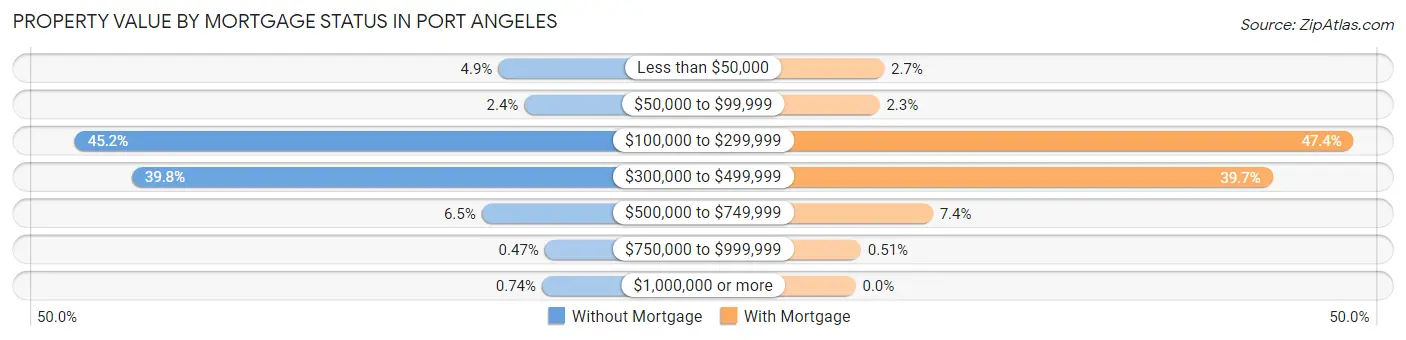
| Property Value | Without Mortgage | With Mortgage |
| Less than $50,000 | 93 (4.9%) | 86 (2.7%) |
| $50,000 to $99,999 | 46 (2.4%) | 72 (2.3%) |
| $100,000 to $299,999 | 858 (45.2%) | 1,498 (47.4%) |
| $300,000 to $499,999 | 755 (39.8%) | 1,254 (39.7%) |
| $500,000 to $749,999 | 123 (6.5%) | 232 (7.3%) |
| $750,000 to $999,999 | 9 (0.5%) | 16 (0.5%) |
| $1,000,000 or more | 14 (0.7%) | 0 (0.0%) |
| Total | 1,898 (100.0%) | 3,158 (100.0%) |
Household Income by Mortgage Status in Port Angeles
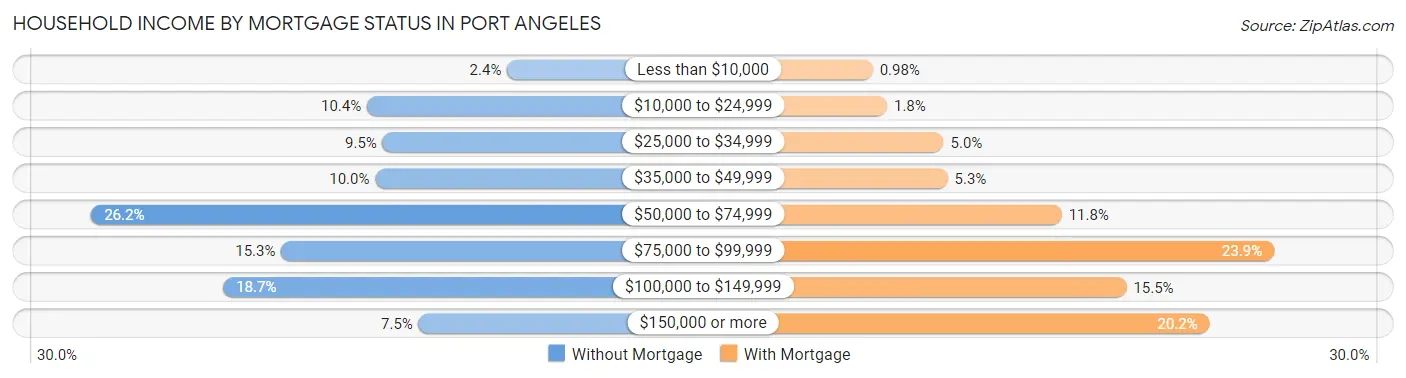
| Household Income | Without Mortgage | With Mortgage |
| Less than $10,000 | 46 (2.4%) | 31 (1.0%) |
| $10,000 to $24,999 | 198 (10.4%) | 57 (1.8%) |
| $25,000 to $34,999 | 181 (9.5%) | 159 (5.0%) |
| $35,000 to $49,999 | 189 (10.0%) | 166 (5.3%) |
| $50,000 to $74,999 | 497 (26.2%) | 372 (11.8%) |
| $75,000 to $99,999 | 291 (15.3%) | 755 (23.9%) |
| $100,000 to $149,999 | 354 (18.6%) | 489 (15.5%) |
| $150,000 or more | 142 (7.5%) | 639 (20.2%) |
| Total | 1,898 (100.0%) | 3,158 (100.0%) |
Property Value to Household Income Ratio in Port Angeles
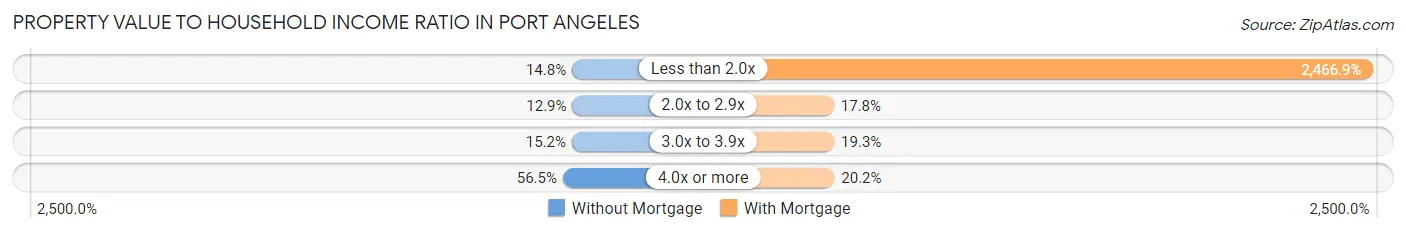
| Value-to-Income Ratio | Without Mortgage | With Mortgage |
| Less than 2.0x | 280 (14.7%) | 77,905 (2,466.9%) |
| 2.0x to 2.9x | 245 (12.9%) | 563 (17.8%) |
| 3.0x to 3.9x | 288 (15.2%) | 609 (19.3%) |
| 4.0x or more | 1,072 (56.5%) | 637 (20.2%) |
| Total | 1,898 (100.0%) | 3,158 (100.0%) |
Real Estate Taxes by Mortgage Status in Port Angeles
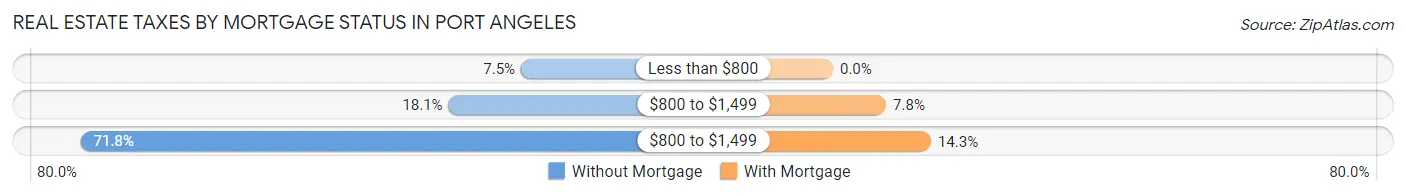
| Property Taxes | Without Mortgage | With Mortgage |
| Less than $800 | 142 (7.5%) | 0 (0.0%) |
| $800 to $1,499 | 343 (18.1%) | 245 (7.8%) |
| $800 to $1,499 | 1,363 (71.8%) | 452 (14.3%) |
| Total | 1,898 (100.0%) | 3,158 (100.0%) |
Health & Disability in Port Angeles
Health Insurance Coverage by Age in Port Angeles
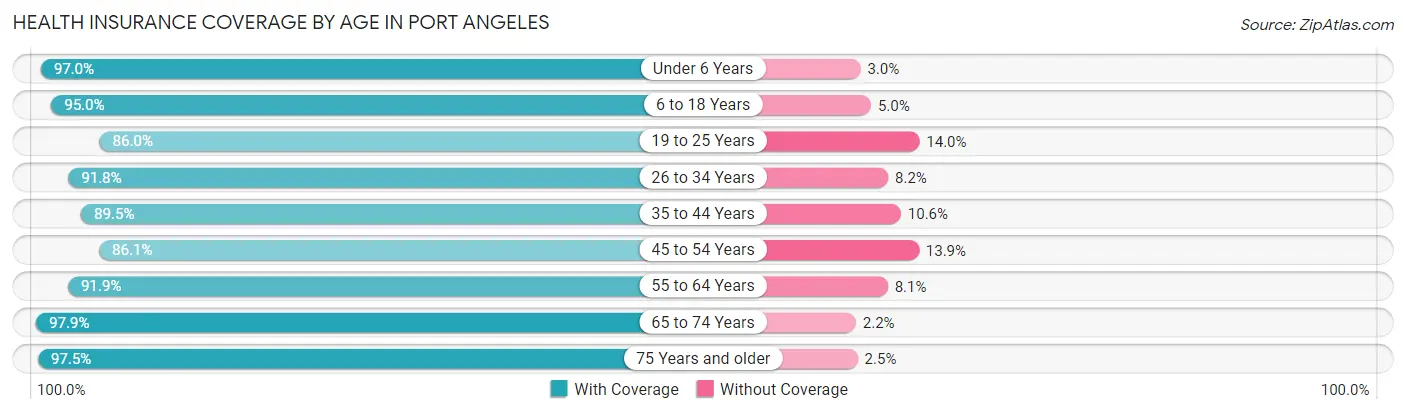
| Age Bracket | With Coverage | Without Coverage |
| Under 6 Years | 1,092 (97.0%) | 34 (3.0%) |
| 6 to 18 Years | 2,635 (95.0%) | 138 (5.0%) |
| 19 to 25 Years | 1,272 (86.0%) | 207 (14.0%) |
| 26 to 34 Years | 2,394 (91.8%) | 213 (8.2%) |
| 35 to 44 Years | 2,153 (89.4%) | 254 (10.5%) |
| 45 to 54 Years | 1,753 (86.1%) | 283 (13.9%) |
| 55 to 64 Years | 2,404 (91.9%) | 212 (8.1%) |
| 65 to 74 Years | 2,594 (97.9%) | 57 (2.1%) |
| 75 Years and older | 1,684 (97.5%) | 43 (2.5%) |
| Total | 17,981 (92.6%) | 1,441 (7.4%) |
Health Insurance Coverage by Citizenship Status in Port Angeles
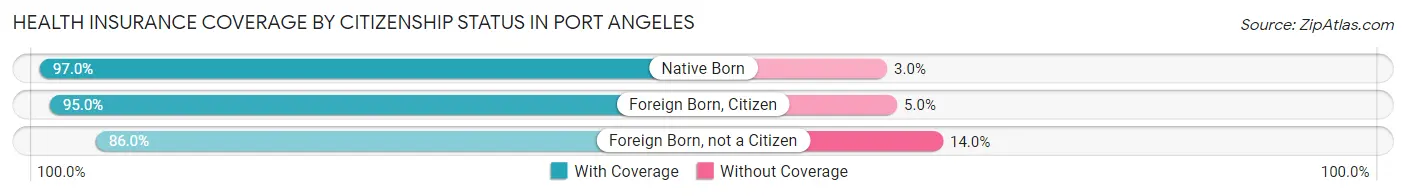
| Citizenship Status | With Coverage | Without Coverage |
| Native Born | 1,092 (97.0%) | 34 (3.0%) |
| Foreign Born, Citizen | 2,635 (95.0%) | 138 (5.0%) |
| Foreign Born, not a Citizen | 1,272 (86.0%) | 207 (14.0%) |
Health Insurance Coverage by Household Income in Port Angeles
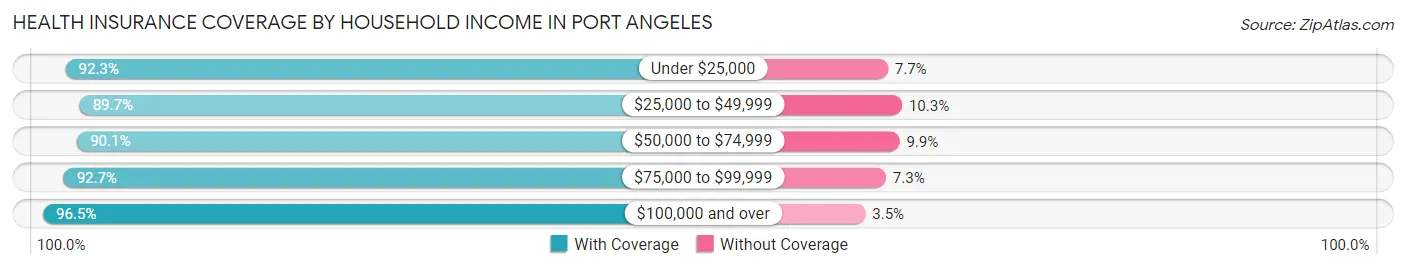
| Household Income | With Coverage | Without Coverage |
| Under $25,000 | 2,197 (92.3%) | 183 (7.7%) |
| $25,000 to $49,999 | 3,399 (89.7%) | 392 (10.3%) |
| $50,000 to $74,999 | 3,261 (90.1%) | 357 (9.9%) |
| $75,000 to $99,999 | 2,957 (92.7%) | 234 (7.3%) |
| $100,000 and over | 6,022 (96.5%) | 217 (3.5%) |
Public vs Private Health Insurance Coverage by Age in Port Angeles
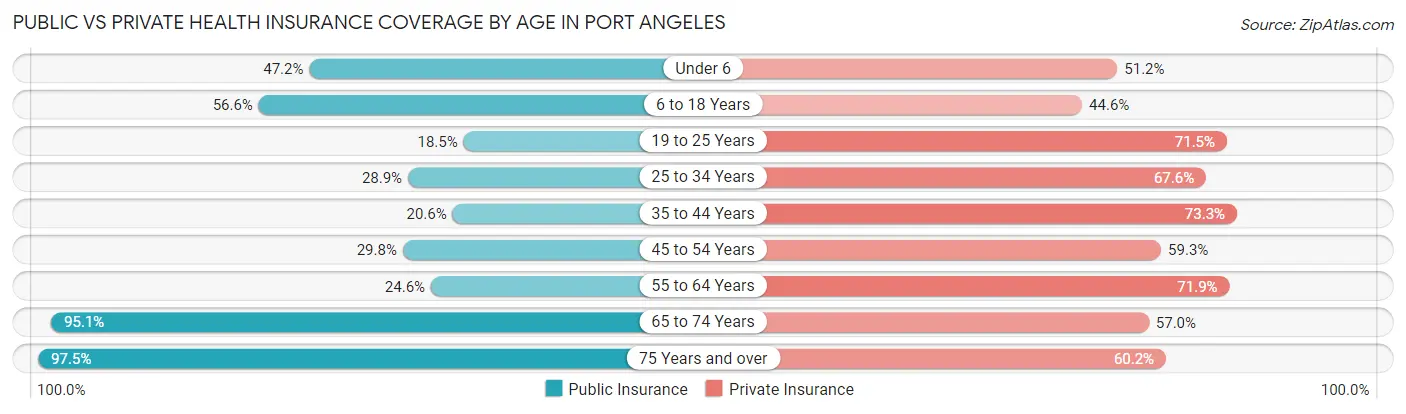
| Age Bracket | Public Insurance | Private Insurance |
| Under 6 | 531 (47.2%) | 576 (51.1%) |
| 6 to 18 Years | 1,568 (56.6%) | 1,237 (44.6%) |
| 19 to 25 Years | 274 (18.5%) | 1,057 (71.5%) |
| 25 to 34 Years | 752 (28.8%) | 1,762 (67.6%) |
| 35 to 44 Years | 495 (20.6%) | 1,765 (73.3%) |
| 45 to 54 Years | 607 (29.8%) | 1,207 (59.3%) |
| 55 to 64 Years | 643 (24.6%) | 1,882 (71.9%) |
| 65 to 74 Years | 2,521 (95.1%) | 1,511 (57.0%) |
| 75 Years and over | 1,684 (97.5%) | 1,039 (60.2%) |
| Total | 9,075 (46.7%) | 12,036 (62.0%) |
Disability Status by Sex by Age in Port Angeles
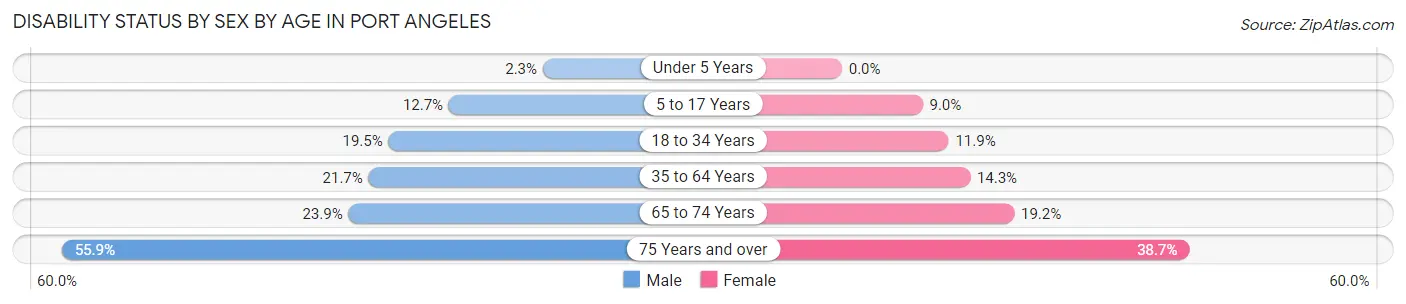
| Age Bracket | Male | Female |
| Under 5 Years | 11 (2.3%) | 0 (0.0%) |
| 5 to 17 Years | 175 (12.7%) | 126 (9.0%) |
| 18 to 34 Years | 440 (19.5%) | 239 (11.9%) |
| 35 to 64 Years | 744 (21.7%) | 518 (14.3%) |
| 65 to 74 Years | 320 (23.9%) | 252 (19.2%) |
| 75 Years and over | 367 (55.9%) | 414 (38.7%) |
Disability Class by Sex by Age in Port Angeles
Disability Class: Hearing Difficulty
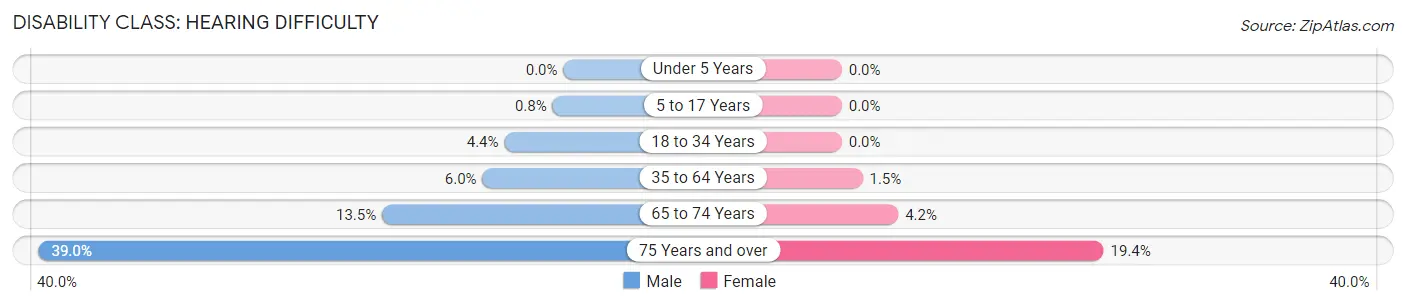
| Age Bracket | Male | Female |
| Under 5 Years | 0 (0.0%) | 0 (0.0%) |
| 5 to 17 Years | 11 (0.8%) | 0 (0.0%) |
| 18 to 34 Years | 99 (4.4%) | 0 (0.0%) |
| 35 to 64 Years | 206 (6.0%) | 56 (1.5%) |
| 65 to 74 Years | 180 (13.5%) | 55 (4.2%) |
| 75 Years and over | 256 (39.0%) | 208 (19.4%) |
Disability Class: Vision Difficulty
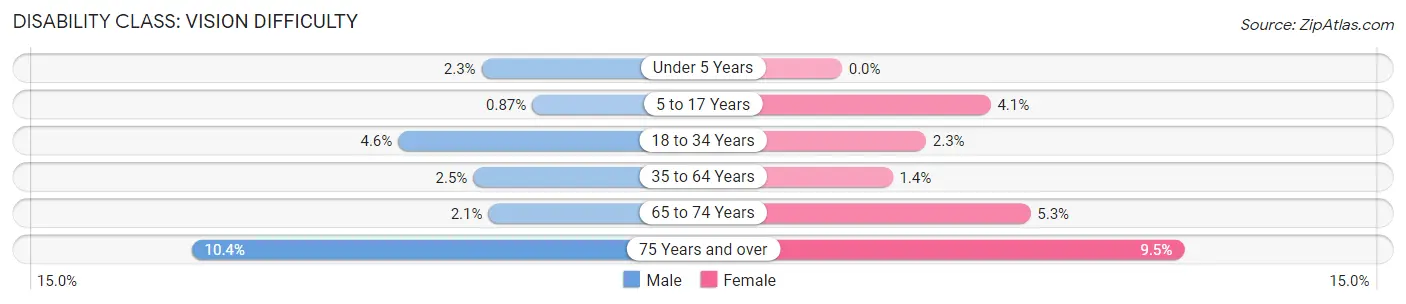
| Age Bracket | Male | Female |
| Under 5 Years | 11 (2.3%) | 0 (0.0%) |
| 5 to 17 Years | 12 (0.9%) | 58 (4.1%) |
| 18 to 34 Years | 104 (4.6%) | 47 (2.3%) |
| 35 to 64 Years | 86 (2.5%) | 51 (1.4%) |
| 65 to 74 Years | 28 (2.1%) | 69 (5.2%) |
| 75 Years and over | 68 (10.3%) | 102 (9.5%) |
Disability Class: Cognitive Difficulty
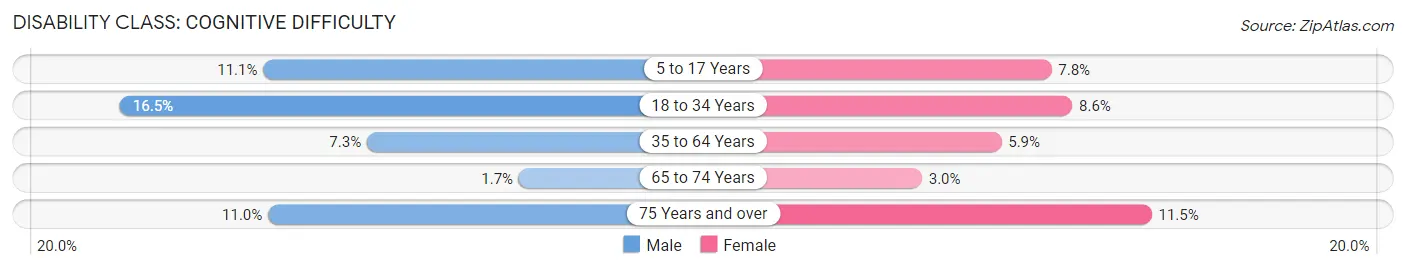
| Age Bracket | Male | Female |
| 5 to 17 Years | 153 (11.1%) | 109 (7.8%) |
| 18 to 34 Years | 372 (16.5%) | 172 (8.6%) |
| 35 to 64 Years | 250 (7.3%) | 215 (5.9%) |
| 65 to 74 Years | 22 (1.7%) | 39 (3.0%) |
| 75 Years and over | 72 (11.0%) | 123 (11.5%) |
Disability Class: Ambulatory Difficulty
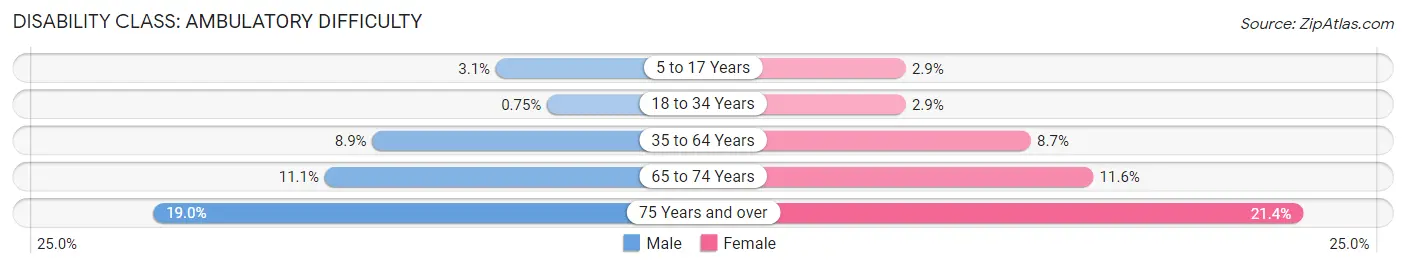
| Age Bracket | Male | Female |
| 5 to 17 Years | 43 (3.1%) | 41 (2.9%) |
| 18 to 34 Years | 17 (0.7%) | 59 (2.9%) |
| 35 to 64 Years | 304 (8.9%) | 317 (8.7%) |
| 65 to 74 Years | 148 (11.1%) | 153 (11.6%) |
| 75 Years and over | 125 (19.0%) | 229 (21.4%) |
Disability Class: Self-Care Difficulty
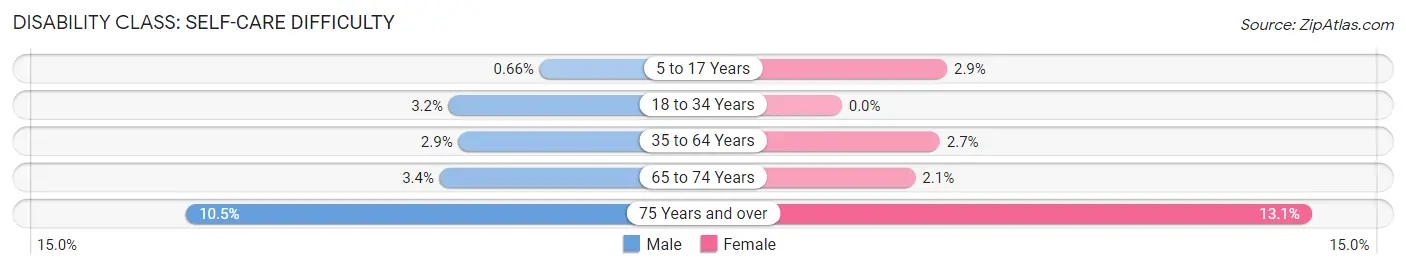
| Age Bracket | Male | Female |
| 5 to 17 Years | 9 (0.7%) | 41 (2.9%) |
| 18 to 34 Years | 72 (3.2%) | 0 (0.0%) |
| 35 to 64 Years | 100 (2.9%) | 99 (2.7%) |
| 65 to 74 Years | 46 (3.4%) | 27 (2.1%) |
| 75 Years and over | 69 (10.5%) | 140 (13.1%) |
Technology Access in Port Angeles
Computing Device Access in Port Angeles
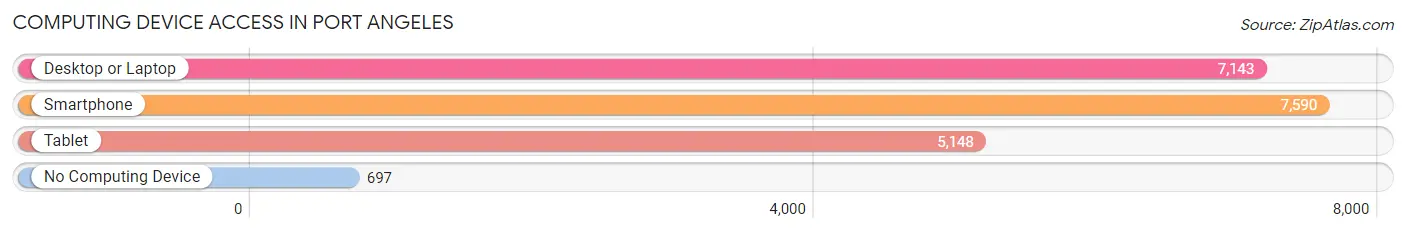
| Device Type | # Households | % Households |
| Desktop or Laptop | 7,143 | 78.6% |
| Smartphone | 7,590 | 83.5% |
| Tablet | 5,148 | 56.7% |
| No Computing Device | 697 | 7.7% |
| Total | 9,087 | 100.0% |
Internet Access in Port Angeles
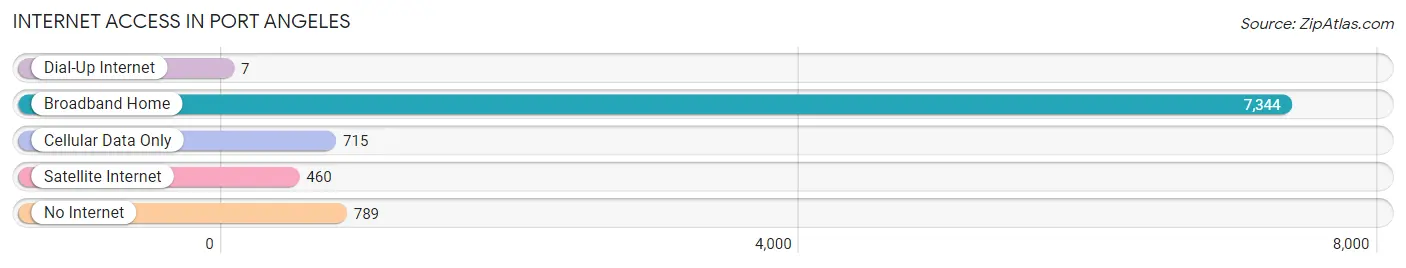
| Internet Type | # Households | % Households |
| Dial-Up Internet | 7 | 0.1% |
| Broadband Home | 7,344 | 80.8% |
| Cellular Data Only | 715 | 7.9% |
| Satellite Internet | 460 | 5.1% |
| No Internet | 789 | 8.7% |
| Total | 9,087 | 100.0% |
Port Angeles Summary
Port Angeles is a city located in Clallam County, Washington, United States. It is the county seat of Clallam County and the largest city in the Olympic Peninsula region. The population was 19,038 at the 2010 census. The city is situated on the northern shore of the Olympic Peninsula, along the Strait of Juan de Fuca, and is the gateway to Olympic National Park.
History
The area around Port Angeles was first inhabited by the Klallam people, who lived in the area for thousands of years. The first European to explore the area was Spanish explorer Juan de Fuca, who sailed through the Strait of Juan de Fuca in 1592. The first permanent European settlement in the area was established in 1791 by the Spanish, who built a fort at the mouth of the Elwha River.
The area was later explored by the British, who established a trading post in 1841. In 1853, the U.S. government established a military post at the site of the present-day city. The city was officially incorporated in 1890.
Geography
Port Angeles is located at the northern end of the Olympic Peninsula, on the Strait of Juan de Fuca. It is bordered to the north by the Strait of Juan de Fuca, to the east by the Olympic Mountains, to the south by the Dungeness River, and to the west by the Strait of Juan de Fuca. The city covers an area of 16.3 square miles, with a population density of 1,170 people per square mile.
The city is situated on a flat plain, with an elevation of approximately 30 feet above sea level. The climate is mild, with an average annual temperature of 50.4°F. The average annual precipitation is 37.2 inches.
Economy
The economy of Port Angeles is largely based on tourism, fishing, and timber. The city is home to several major employers, including the Port of Port Angeles, Olympic Medical Center, and the Clallam County government.
The Port of Port Angeles is the largest port in the Olympic Peninsula region, and is a major hub for shipping and fishing. The port is also home to several marinas, boatyards, and other marine-related businesses.
The Olympic Medical Center is the largest employer in the city, with over 1,000 employees. The hospital provides a wide range of medical services, including emergency care, primary care, and specialty care.
The Clallam County government is the second-largest employer in the city, with over 500 employees. The county government provides a wide range of services, including law enforcement, public works, and social services.
Demographics
As of the 2010 census, the population of Port Angeles was 19,038. The racial makeup of the city was 87.3% White, 0.7% African American, 1.2% Native American, 2.2% Asian, 0.2% Pacific Islander, 5.2% from other races, and 3.2% from two or more races. Hispanic or Latino of any race were 11.2% of the population.
The median income for a household in the city was $41,945, and the median income for a family was $50,945. The per capita income for the city was $21,945. About 13.2% of families and 17.2% of the population were below the poverty line, including 25.2% of those under age 18 and 8.2% of those age 65 or over.
Common Questions
What is Per Capita Income in Port Angeles?
Per Capita income in Port Angeles is $33,807.
What is the Median Family Income in Port Angeles?
Median Family Income in Port Angeles is $74,946.
What is the Median Household income in Port Angeles?
Median Household Income in Port Angeles is $60,212.
What is Income or Wage Gap in Port Angeles?
Income or Wage Gap in Port Angeles is 22.2%.
Women in Port Angeles earn 77.8 cents for every dollar earned by a man.
What is Family Income Deficit in Port Angeles?
Family Income Deficit in Port Angeles is $13,225.
Families that are below poverty line in Port Angeles earn $13,225 less on average than the poverty threshold level.
What is Inequality or Gini Index in Port Angeles?
Inequality or Gini Index in Port Angeles is 0.43.
What is the Total Population of Port Angeles?
Total Population of Port Angeles is 20,007.
What is the Total Male Population of Port Angeles?
Total Male Population of Port Angeles is 10,035.
What is the Total Female Population of Port Angeles?
Total Female Population of Port Angeles is 9,972.
What is the Ratio of Males per 100 Females in Port Angeles?
There are 100.63 Males per 100 Females in Port Angeles.
What is the Ratio of Females per 100 Males in Port Angeles?
There are 99.37 Females per 100 Males in Port Angeles.
What is the Median Population Age in Port Angeles?
Median Population Age in Port Angeles is 41.3 Years.
What is the Average Family Size in Port Angeles
Average Family Size in Port Angeles is 2.8 People.
What is the Average Household Size in Port Angeles
Average Household Size in Port Angeles is 2.1 People.
How Large is the Labor Force in Port Angeles?
There are 9,568 People in the Labor Forcein in Port Angeles.
What is the Percentage of People in the Labor Force in Port Angeles?
57.2% of People are in the Labor Force in Port Angeles.
What is the Unemployment Rate in Port Angeles?
Unemployment Rate in Port Angeles is 5.7%.