Cities with the Lowest Poverty Level Among Children Under the Age of 5 in Nebraska
RELATED REPORTS & OPTIONS
Lowest Poverty | Child 0-5
Nebraska
Compare Cities
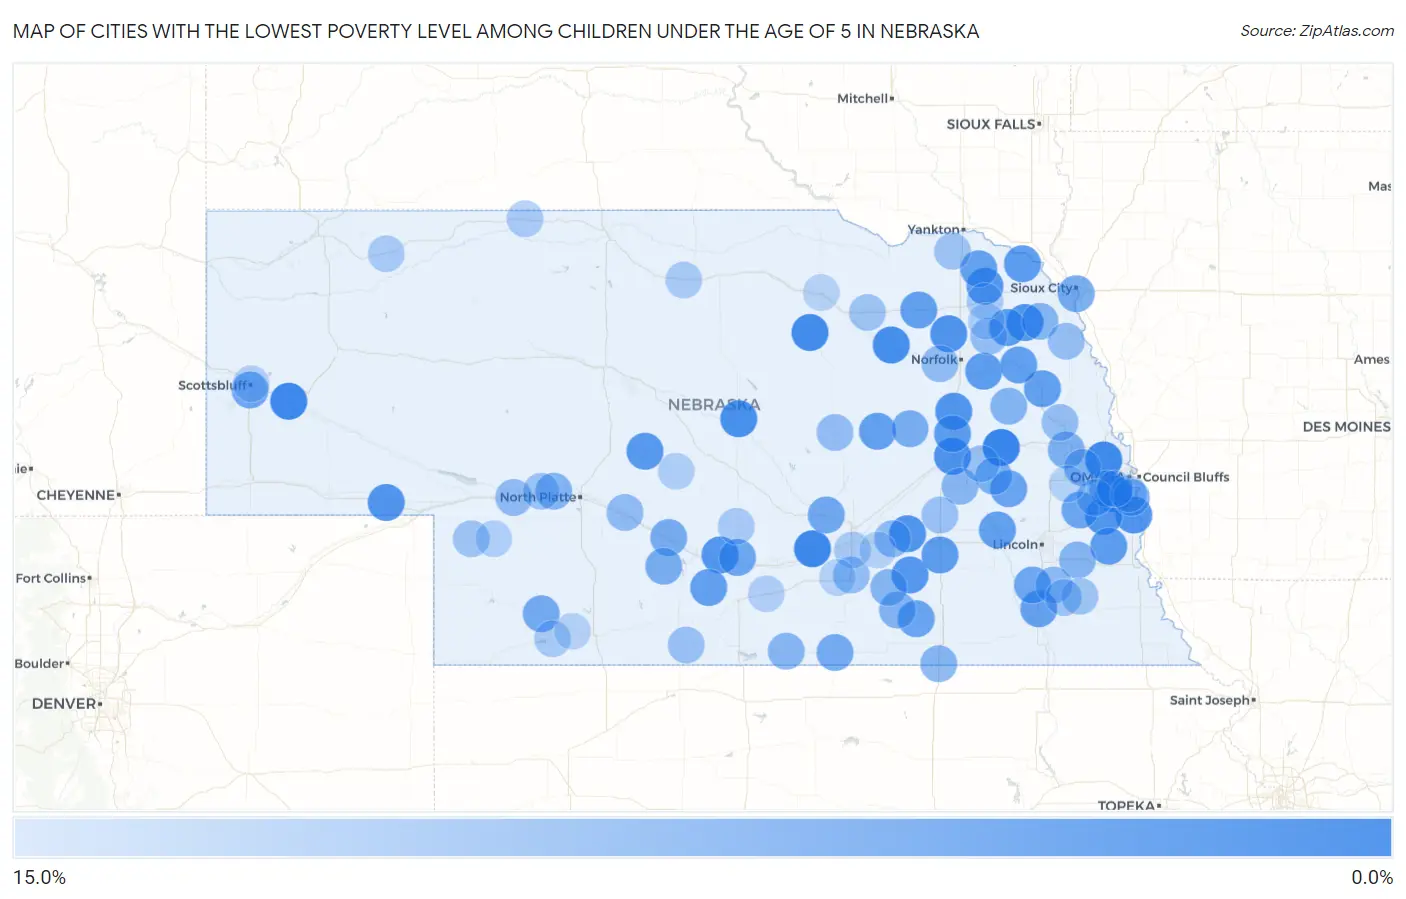
Map of Cities with the Lowest Poverty Level Among Children Under the Age of 5 in Nebraska
15.0%
0.0%
Cities with the Lowest Poverty Level Among Children Under the Age of 5 in Nebraska
| City | Child Poverty | vs State | vs National | |
| 1. | Schuyler | 0.37% | 13.8%(-13.4)#1 | 18.1%(-17.7)#9 |
| 2. | Bayard | 0.93% | 13.8%(-12.8)#2 | 18.1%(-17.1)#85 |
| 3. | Shelton | 1.1% | 13.8%(-12.6)#3 | 18.1%(-16.9)#122 |
| 4. | Bennington | 1.3% | 13.8%(-12.4)#4 | 18.1%(-16.7)#163 |
| 5. | Papillion | 1.6% | 13.8%(-12.2)#5 | 18.1%(-16.5)#218 |
| 6. | Chambers | 1.6% | 13.8%(-12.2)#6 | 18.1%(-16.4)#230 |
| 7. | Neligh | 1.7% | 13.8%(-12.1)#7 | 18.1%(-16.4)#239 |
| 8. | Sargent | 2.3% | 13.8%(-11.5)#8 | 18.1%(-15.8)#438 |
| 9. | Duncan | 2.6% | 13.8%(-11.2)#9 | 18.1%(-15.5)#533 |
| 10. | Wakefield | 2.8% | 13.8%(-11.0)#10 | 18.1%(-15.3)#611 |
| 11. | Pierce | 2.8% | 13.8%(-10.9)#11 | 18.1%(-15.2)#642 |
| 12. | Plattsmouth | 2.9% | 13.8%(-10.8)#12 | 18.1%(-15.1)#679 |
| 13. | Chappell | 3.0% | 13.8%(-10.8)#13 | 18.1%(-15.1)#705 |
| 14. | Humphrey | 3.1% | 13.8%(-10.7)#14 | 18.1%(-15.0)#736 |
| 15. | Hampton | 3.1% | 13.8%(-10.6)#15 | 18.1%(-14.9)#760 |
| 16. | Louisville | 3.2% | 13.8%(-10.6)#16 | 18.1%(-14.9)#777 |
| 17. | Overton | 3.3% | 13.8%(-10.4)#17 | 18.1%(-14.7)#844 |
| 18. | Coleridge | 3.4% | 13.8%(-10.3)#18 | 18.1%(-14.6)#893 |
| 19. | Sutton | 3.6% | 13.8%(-10.2)#19 | 18.1%(-14.4)#959 |
| 20. | Arnold | 3.7% | 13.8%(-10.1)#20 | 18.1%(-14.4)#987 |
| 21. | Newcastle | 4.2% | 13.8%(-9.61)#21 | 18.1%(-13.9)#1,210 |
| 22. | Wayne | 4.5% | 13.8%(-9.26)#22 | 18.1%(-13.6)#1,334 |
| 23. | Stanton | 4.5% | 13.8%(-9.23)#23 | 18.1%(-13.5)#1,351 |
| 24. | Mccool Junction | 4.5% | 13.8%(-9.23)#24 | 18.1%(-13.5)#1,356 |
| 25. | Platte Center | 4.5% | 13.8%(-9.23)#25 | 18.1%(-13.5)#1,360 |
| 26. | Avoca | 4.5% | 13.8%(-9.23)#26 | 18.1%(-13.5)#1,363 |
| 27. | Plainview | 4.8% | 13.8%(-8.97)#27 | 18.1%(-13.3)#1,488 |
| 28. | West Point | 4.8% | 13.8%(-8.95)#28 | 18.1%(-13.2)#1,499 |
| 29. | Bertrand | 4.9% | 13.8%(-8.89)#29 | 18.1%(-13.2)#1,518 |
| 30. | Cedar Rapids | 4.9% | 13.8%(-8.89)#30 | 18.1%(-13.2)#1,520 |
| 31. | Seward | 4.9% | 13.8%(-8.89)#31 | 18.1%(-13.2)#1,523 |
| 32. | Wisner | 5.0% | 13.8%(-8.82)#32 | 18.1%(-13.1)#1,548 |
| 33. | Hartington | 5.3% | 13.8%(-8.51)#33 | 18.1%(-12.8)#1,679 |
| 34. | Pickrell | 5.3% | 13.8%(-8.51)#34 | 18.1%(-12.8)#1,700 |
| 35. | Brainard | 5.9% | 13.8%(-7.89)#35 | 18.1%(-12.2)#1,943 |
| 36. | Davenport | 5.9% | 13.8%(-7.89)#36 | 18.1%(-12.2)#1,945 |
| 37. | Elm Creek | 6.0% | 13.8%(-7.76)#37 | 18.1%(-12.0)#1,992 |
| 38. | Hallam | 6.1% | 13.8%(-7.71)#38 | 18.1%(-12.0)#2,010 |
| 39. | Ashland | 6.1% | 13.8%(-7.63)#39 | 18.1%(-11.9)#2,039 |
| 40. | Gering | 6.6% | 13.8%(-7.19)#40 | 18.1%(-11.5)#2,221 |
| 41. | Cairo | 6.6% | 13.8%(-7.17)#41 | 18.1%(-11.5)#2,236 |
| 42. | Palisade | 6.7% | 13.8%(-7.11)#42 | 18.1%(-11.4)#2,270 |
| 43. | South Sioux City | 6.8% | 13.8%(-7.01)#43 | 18.1%(-11.3)#2,312 |
| 44. | Red Cloud | 7.0% | 13.8%(-6.80)#44 | 18.1%(-11.1)#2,414 |
| 45. | Chalco | 7.0% | 13.8%(-6.77)#45 | 18.1%(-11.1)#2,426 |
| 46. | Cozad | 7.1% | 13.8%(-6.69)#46 | 18.1%(-11.0)#2,457 |
| 47. | St Edward | 7.3% | 13.8%(-6.45)#47 | 18.1%(-10.7)#2,558 |
| 48. | Offutt Afb | 7.4% | 13.8%(-6.39)#48 | 18.1%(-10.7)#2,588 |
| 49. | Eustis | 7.4% | 13.8%(-6.36)#49 | 18.1%(-10.7)#2,603 |
| 50. | David City | 7.7% | 13.8%(-6.04)#50 | 18.1%(-10.3)#2,734 |
| 51. | Fremont | 8.0% | 13.8%(-5.74)#51 | 18.1%(-10.0)#2,847 |
| 52. | Valley | 8.3% | 13.8%(-5.48)#52 | 18.1%(-9.77)#2,938 |
| 53. | Edgar | 8.3% | 13.8%(-5.44)#53 | 18.1%(-9.73)#2,970 |
| 54. | Hershey | 8.5% | 13.8%(-5.26)#54 | 18.1%(-9.55)#3,046 |
| 55. | Emerson | 8.7% | 13.8%(-5.08)#55 | 18.1%(-9.37)#3,127 |
| 56. | Palmyra | 8.7% | 13.8%(-5.08)#56 | 18.1%(-9.37)#3,130 |
| 57. | Howells | 8.7% | 13.8%(-5.08)#57 | 18.1%(-9.37)#3,131 |
| 58. | Chester | 8.7% | 13.8%(-5.08)#58 | 18.1%(-9.37)#3,139 |
| 59. | Shelby | 9.0% | 13.8%(-4.82)#59 | 18.1%(-9.11)#3,230 |
| 60. | Franklin | 9.1% | 13.8%(-4.68)#60 | 18.1%(-8.97)#3,284 |
| 61. | Clay Center | 9.1% | 13.8%(-4.68)#61 | 18.1%(-8.97)#3,286 |
| 62. | Gretna | 9.5% | 13.8%(-4.29)#62 | 18.1%(-8.58)#3,451 |
| 63. | Firth | 9.7% | 13.8%(-4.09)#63 | 18.1%(-8.39)#3,538 |
| 64. | Aurora | 9.9% | 13.8%(-3.88)#64 | 18.1%(-8.17)#3,600 |
| 65. | Paxton | 10.0% | 13.8%(-3.77)#65 | 18.1%(-8.06)#3,648 |
| 66. | Brady | 10.0% | 13.8%(-3.77)#66 | 18.1%(-8.06)#3,657 |
| 67. | Battle Creek | 10.1% | 13.8%(-3.67)#67 | 18.1%(-7.96)#3,702 |
| 68. | Greeley Center | 10.3% | 13.8%(-3.52)#68 | 18.1%(-7.81)#3,762 |
| 69. | Winside | 10.3% | 13.8%(-3.46)#69 | 18.1%(-7.75)#3,779 |
| 70. | Hastings | 10.4% | 13.8%(-3.36)#70 | 18.1%(-7.65)#3,811 |
| 71. | Walthill | 10.6% | 13.8%(-3.20)#71 | 18.1%(-7.49)#3,893 |
| 72. | Hooper | 10.6% | 13.8%(-3.15)#72 | 18.1%(-7.44)#3,914 |
| 73. | Beaver City | 10.7% | 13.8%(-3.06)#73 | 18.1%(-7.35)#3,945 |
| 74. | Benedict | 10.9% | 13.8%(-2.83)#74 | 18.1%(-7.13)#4,022 |
| 75. | Bellwood | 11.1% | 13.8%(-2.66)#75 | 18.1%(-6.95)#4,108 |
| 76. | Sutherland | 11.3% | 13.8%(-2.45)#76 | 18.1%(-6.74)#4,199 |
| 77. | Grant | 11.4% | 13.8%(-2.34)#77 | 18.1%(-6.63)#4,240 |
| 78. | Orchard | 11.4% | 13.8%(-2.34)#78 | 18.1%(-6.63)#4,243 |
| 79. | Sterling | 11.5% | 13.8%(-2.30)#79 | 18.1%(-6.59)#4,257 |
| 80. | Crofton | 11.5% | 13.8%(-2.28)#80 | 18.1%(-6.57)#4,264 |
| 81. | Adams | 11.5% | 13.8%(-2.23)#81 | 18.1%(-6.52)#4,280 |
| 82. | Ainsworth | 12.5% | 13.8%(-1.27)#82 | 18.1%(-5.56)#4,604 |
| 83. | Doniphan | 12.5% | 13.8%(-1.27)#83 | 18.1%(-5.56)#4,613 |
| 84. | Trenton | 12.5% | 13.8%(-1.27)#84 | 18.1%(-5.56)#4,636 |
| 85. | Cody | 12.5% | 13.8%(-1.27)#85 | 18.1%(-5.56)#4,660 |
| 86. | Miller | 12.5% | 13.8%(-1.27)#86 | 18.1%(-5.56)#4,668 |
| 87. | Belden | 12.5% | 13.8%(-1.27)#87 | 18.1%(-5.56)#4,669 |
| 88. | Bellevue | 12.5% | 13.8%(-1.25)#88 | 18.1%(-5.54)#4,673 |
| 89. | Rushville | 12.7% | 13.8%(-1.07)#89 | 18.1%(-5.36)#4,715 |
| 90. | La Vista | 13.1% | 13.8%(-0.670)#90 | 18.1%(-4.96)#4,871 |
| 91. | Callaway | 13.3% | 13.8%(-0.438)#91 | 18.1%(-4.73)#4,966 |
| 92. | Carroll | 13.3% | 13.8%(-0.438)#92 | 18.1%(-4.73)#4,973 |
| 93. | Madrid | 13.3% | 13.8%(-0.438)#93 | 18.1%(-4.73)#4,977 |
| 94. | Axtell | 13.4% | 13.8%(-0.339)#94 | 18.1%(-4.63)#4,992 |
| 95. | Scottsbluff | 13.6% | 13.8%(-0.152)#95 | 18.1%(-4.44)#5,052 |
| 96. | Juniata | 13.6% | 13.8%(-0.135)#96 | 18.1%(-4.43)#5,068 |
| 97. | Mead | 13.6% | 13.8%(-0.135)#97 | 18.1%(-4.43)#5,070 |
| 98. | Giltner | 13.6% | 13.8%(-0.135)#98 | 18.1%(-4.43)#5,073 |
| 99. | Culbertson | 13.9% | 13.8%(+0.152)#99 | 18.1%(-4.14)#5,185 |
| 100. | O Neill | 14.0% | 13.8%(+0.202)#100 | 18.1%(-4.09)#5,207 |
Common Questions
What are the Top 10 Cities with the Lowest Poverty Level Among Children Under the Age of 5 in Nebraska?
Top 10 Cities with the Lowest Poverty Level Among Children Under the Age of 5 in Nebraska are:
What city has the Lowest Poverty Level Among Children Under the Age of 5 in Nebraska?
Schuyler has the Lowest Poverty Level Among Children Under the Age of 5 in Nebraska with 0.37%.
What is the Poverty Level Among Children Under the Age of 5 in the State of Nebraska?
Poverty Level Among Children Under the Age of 5 in Nebraska is 13.8%.
What is the Poverty Level Among Children Under the Age of 5 in the United States?
Poverty Level Among Children Under the Age of 5 in the United States is 18.1%.