Cities with the Lowest Poverty Level Among Children Under the Age of 5 in Connecticut
RELATED REPORTS & OPTIONS
Lowest Poverty | Child 0-5
Connecticut
Compare Cities
Map of Cities with the Lowest Poverty Level Among Children Under the Age of 5 in Connecticut
100.0%
0.0%
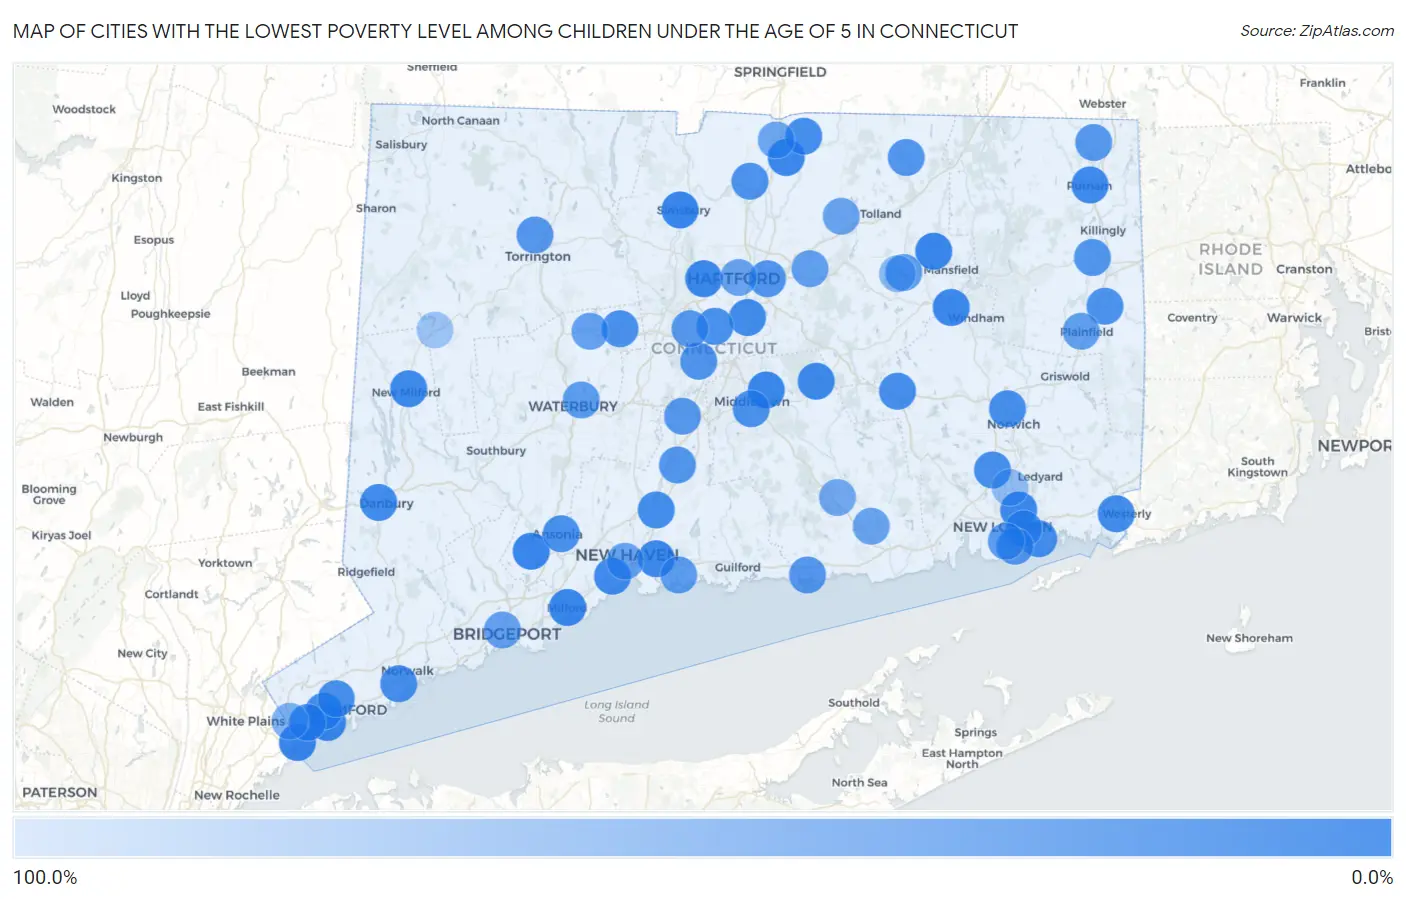
Cities with the Lowest Poverty Level Among Children Under the Age of 5 in Connecticut
| City | Child Poverty | vs State | vs National | |
| 1. | Shelton | 1.8% | 14.1%(-12.3)#1 | 18.1%(-16.3)#290 |
| 2. | Storrs | 2.0% | 14.1%(-12.1)#2 | 18.1%(-16.1)#339 |
| 3. | Simsbury Center | 2.4% | 14.1%(-11.7)#3 | 18.1%(-15.6)#481 |
| 4. | Byram | 2.4% | 14.1%(-11.6)#4 | 18.1%(-15.6)#489 |
| 5. | Riverside | 2.5% | 14.1%(-11.6)#5 | 18.1%(-15.5)#510 |
| 6. | West Hartford | 2.7% | 14.1%(-11.4)#6 | 18.1%(-15.4)#570 |
| 7. | Portland | 3.0% | 14.1%(-11.0)#7 | 18.1%(-15.0)#726 |
| 8. | Milford City Balance | 3.2% | 14.1%(-10.9)#8 | 18.1%(-14.9)#773 |
| 9. | Naugatuck Borough | 4.6% | 14.1%(-9.47)#9 | 18.1%(-13.5)#1,385 |
| 10. | Willimantic | 4.7% | 14.1%(-9.40)#10 | 18.1%(-13.4)#1,414 |
| 11. | Conning Towers Nautilus Park | 4.8% | 14.1%(-9.32)#11 | 18.1%(-13.3)#1,438 |
| 12. | Southwood Acres | 5.0% | 14.1%(-9.12)#12 | 18.1%(-13.1)#1,551 |
| 13. | East Haven | 6.7% | 14.1%(-7.39)#13 | 18.1%(-11.4)#2,281 |
| 14. | Lake Pocotopaug | 7.0% | 14.1%(-7.13)#14 | 18.1%(-11.1)#2,401 |
| 15. | New Milford | 7.2% | 14.1%(-6.92)#15 | 18.1%(-10.9)#2,501 |
| 16. | Noroton | 7.2% | 14.1%(-6.90)#16 | 18.1%(-10.9)#2,505 |
| 17. | Ball Pond | 7.9% | 14.1%(-6.22)#17 | 18.1%(-10.2)#2,783 |
| 18. | Putnam | 8.1% | 14.1%(-5.96)#18 | 18.1%(-9.94)#2,878 |
| 19. | Noroton Heights | 8.4% | 14.1%(-5.69)#19 | 18.1%(-9.68)#3,000 |
| 20. | West Haven | 8.9% | 14.1%(-5.21)#20 | 18.1%(-9.19)#3,194 |
| 21. | Pawcatuck | 9.4% | 14.1%(-4.69)#21 | 18.1%(-8.68)#3,422 |
| 22. | Compo | 10.2% | 14.1%(-3.92)#22 | 18.1%(-7.90)#3,722 |
| 23. | Danbury | 10.3% | 14.1%(-3.76)#23 | 18.1%(-7.74)#3,782 |
| 24. | Wethersfield | 10.5% | 14.1%(-3.55)#24 | 18.1%(-7.53)#3,887 |
| 25. | Cos Cob | 10.6% | 14.1%(-3.47)#25 | 18.1%(-7.45)#3,913 |
| 26. | Greenwich | 11.0% | 14.1%(-3.04)#26 | 18.1%(-7.02)#4,051 |
| 27. | Poquonock Bridge | 11.7% | 14.1%(-2.39)#27 | 18.1%(-6.37)#4,332 |
| 28. | North Haven | 12.0% | 14.1%(-2.11)#28 | 18.1%(-6.09)#4,438 |
| 29. | Hazardville | 12.1% | 14.1%(-2.01)#29 | 18.1%(-6.00)#4,481 |
| 30. | Colchester | 12.6% | 14.1%(-1.51)#30 | 18.1%(-5.49)#4,684 |
| 31. | Norwich | 12.9% | 14.1%(-1.21)#31 | 18.1%(-5.19)#4,784 |
| 32. | Norwalk | 13.1% | 14.1%(-1.00)#32 | 18.1%(-4.99)#4,863 |
| 33. | Oxoboxo River | 13.5% | 14.1%(-0.564)#33 | 18.1%(-4.55)#5,023 |
| 34. | Litchfield Borough | 13.6% | 14.1%(-0.441)#34 | 18.1%(-4.43)#5,064 |
| 35. | Stamford | 13.7% | 14.1%(-0.417)#35 | 18.1%(-4.40)#5,088 |
| 36. | Danielson Borough | 14.8% | 14.1%(+0.705)#36 | 18.1%(-3.28)#5,505 |
| 37. | Sandy Hook | 14.8% | 14.1%(+0.748)#37 | 18.1%(-3.24)#5,528 |
| 38. | Ansonia | 16.2% | 14.1%(+2.10)#38 | 18.1%(-1.89)#5,989 |
| 39. | Middletown | 16.2% | 14.1%(+2.10)#39 | 18.1%(-1.88)#5,993 |
| 40. | Bristol | 16.5% | 14.1%(+2.42)#40 | 18.1%(-1.56)#6,093 |
| 41. | Newington | 16.6% | 14.1%(+2.50)#41 | 18.1%(-1.49)#6,111 |
| 42. | Tashua | 16.8% | 14.1%(+2.69)#42 | 18.1%(-1.30)#6,221 |
| 43. | Moosup | 17.9% | 14.1%(+3.78)#43 | 18.1%(-0.206)#6,562 |
| 44. | Windsor Locks | 18.0% | 14.1%(+3.95)#44 | 18.1%(-0.039)#6,623 |
| 45. | Kensington | 20.4% | 14.1%(+6.27)#45 | 18.1%(+2.29)#7,372 |
| 46. | East Hartford | 21.1% | 14.1%(+7.06)#46 | 18.1%(+3.07)#7,605 |
| 47. | Wallingford Center | 22.4% | 14.1%(+8.28)#47 | 18.1%(+4.30)#8,010 |
| 48. | Stafford Springs | 22.4% | 14.1%(+8.34)#48 | 18.1%(+4.35)#8,028 |
| 49. | Long Hill | 23.1% | 14.1%(+9.00)#49 | 18.1%(+5.01)#8,199 |
| 50. | East Brooklyn | 23.2% | 14.1%(+9.10)#50 | 18.1%(+5.12)#8,258 |
| 51. | Groton | 24.3% | 14.1%(+10.2)#51 | 18.1%(+6.24)#8,564 |
| 52. | Clinton | 25.0% | 14.1%(+10.9)#52 | 18.1%(+6.94)#8,713 |
| 53. | Torrington | 25.4% | 14.1%(+11.3)#53 | 18.1%(+7.30)#8,876 |
| 54. | Meriden | 25.6% | 14.1%(+11.6)#54 | 18.1%(+7.58)#8,950 |
| 55. | North Grosvenor Dale | 25.9% | 14.1%(+11.8)#55 | 18.1%(+7.81)#8,997 |
| 56. | New Britain | 27.1% | 14.1%(+13.0)#56 | 18.1%(+9.04)#9,286 |
| 57. | Branford Center | 29.8% | 14.1%(+15.7)#57 | 18.1%(+11.7)#9,957 |
| 58. | New London | 29.8% | 14.1%(+15.7)#58 | 18.1%(+11.7)#9,961 |
| 59. | Waterbury | 30.1% | 14.1%(+16.1)#59 | 18.1%(+12.1)#10,057 |
| 60. | South Coventry | 31.0% | 14.1%(+17.0)#60 | 18.1%(+13.0)#10,249 |
| 61. | Plainfield Village | 34.3% | 14.1%(+20.3)#61 | 18.1%(+16.3)#10,936 |
| 62. | Manchester | 34.4% | 14.1%(+20.4)#62 | 18.1%(+16.4)#10,953 |
| 63. | Terryville | 35.4% | 14.1%(+21.3)#63 | 18.1%(+17.3)#11,123 |
| 64. | Bridgeport | 36.3% | 14.1%(+22.2)#64 | 18.1%(+18.2)#11,301 |
| 65. | Hartford | 38.7% | 14.1%(+24.6)#65 | 18.1%(+20.6)#11,711 |
| 66. | Rockville | 39.6% | 14.1%(+25.5)#66 | 18.1%(+21.5)#11,862 |
| 67. | Essex Village | 39.9% | 14.1%(+25.8)#67 | 18.1%(+21.8)#11,898 |
| 68. | New Haven | 40.1% | 14.1%(+26.0)#68 | 18.1%(+22.0)#11,988 |
| 69. | Thompsonville | 43.5% | 14.1%(+29.4)#69 | 18.1%(+25.4)#12,463 |
| 70. | Chester Center | 46.3% | 14.1%(+32.2)#70 | 18.1%(+28.2)#12,854 |
| 71. | Glenville | 54.8% | 14.1%(+40.7)#71 | 18.1%(+36.7)#13,845 |
| 72. | Stepney | 58.3% | 14.1%(+44.3)#72 | 18.1%(+40.3)#14,156 |
| 73. | Coventry Lake | 66.0% | 14.1%(+51.9)#73 | 18.1%(+47.9)#14,777 |
| 74. | Gales Ferry | 72.9% | 14.1%(+58.8)#74 | 18.1%(+54.9)#15,191 |
| 75. | New Preston | 79.8% | 14.1%(+65.7)#75 | 18.1%(+61.8)#15,470 |
| 76. | Pleasant Valley | 100.0% | 14.1%(+85.9)#76 | 18.1%(+81.9)#16,362 |
1
2Common Questions
What are the Top 10 Cities with the Lowest Poverty Level Among Children Under the Age of 5 in Connecticut?
Top 10 Cities with the Lowest Poverty Level Among Children Under the Age of 5 in Connecticut are:
#1
0.0%
#2
0.0%
#3
0.0%
#4
0.0%
#5
0.0%
#6
0.0%
#7
0.0%
#8
0.0%
#9
0.0%
#10
0.0%
What city has the Lowest Poverty Level Among Children Under the Age of 5 in Connecticut?
Shelton has the Lowest Poverty Level Among Children Under the Age of 5 in Connecticut with 1.8%.
What is the Poverty Level Among Children Under the Age of 5 in the State of Connecticut?
Poverty Level Among Children Under the Age of 5 in Connecticut is 14.1%.
What is the Poverty Level Among Children Under the Age of 5 in the United States?
Poverty Level Among Children Under the Age of 5 in the United States is 18.1%.