Wauna, WA Map & Demographics
Wauna Map
Wauna Overview
$46,127
PER CAPITA INCOME
$121,881
AVG FAMILY INCOME
$100,329
AVG HOUSEHOLD INCOME
37.5%
WAGE / INCOME GAP [ % ]
62.5¢/ $1
WAGE / INCOME GAP [ $ ]
0.41
INEQUALITY / GINI INDEX
4,689
TOTAL POPULATION
2,447
MALE POPULATION
2,242
FEMALE POPULATION
109.14
MALES / 100 FEMALES
91.62
FEMALES / 100 MALES
45.4
MEDIAN AGE
2.9
AVG FAMILY SIZE
2.5
AVG HOUSEHOLD SIZE
2,398
LABOR FORCE [ PEOPLE ]
63.1%
PERCENT IN LABOR FORCE
4.7%
UNEMPLOYMENT RATE
Wauna Area Codes
Income in Wauna
Income Overview in Wauna
Per Capita Income in Wauna is $46,127, while median incomes of families and households are $121,881 and $100,329 respectively.
| Characteristic | Number | Measure |
| Per Capita Income | 4,689 | $46,127 |
| Median Family Income | 1,396 | $121,881 |
| Mean Family Income | 1,396 | $131,550 |
| Median Household Income | 1,837 | $100,329 |
| Mean Household Income | 1,837 | $115,359 |
| Income Deficit | 1,396 | $0 |
| Wage / Income Gap (%) | 4,689 | 37.45% |
| Wage / Income Gap ($) | 4,689 | 62.55¢ per $1 |
| Gini / Inequality Index | 4,689 | 0.41 |
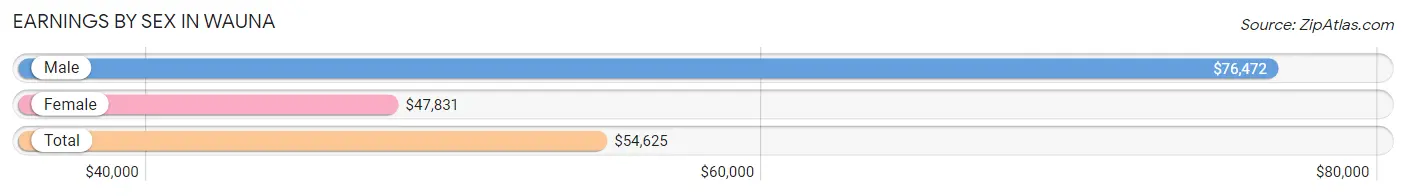
Earnings by Sex in Wauna
Average Earnings in Wauna are $54,625, $76,472 for men and $47,831 for women, a difference of 37.4%.
| Sex | Number | Average Earnings |
| Male | 1,229 (50.1%) | $76,472 |
| Female | 1,224 (49.9%) | $47,831 |
| Total | 2,453 (100.0%) | $54,625 |
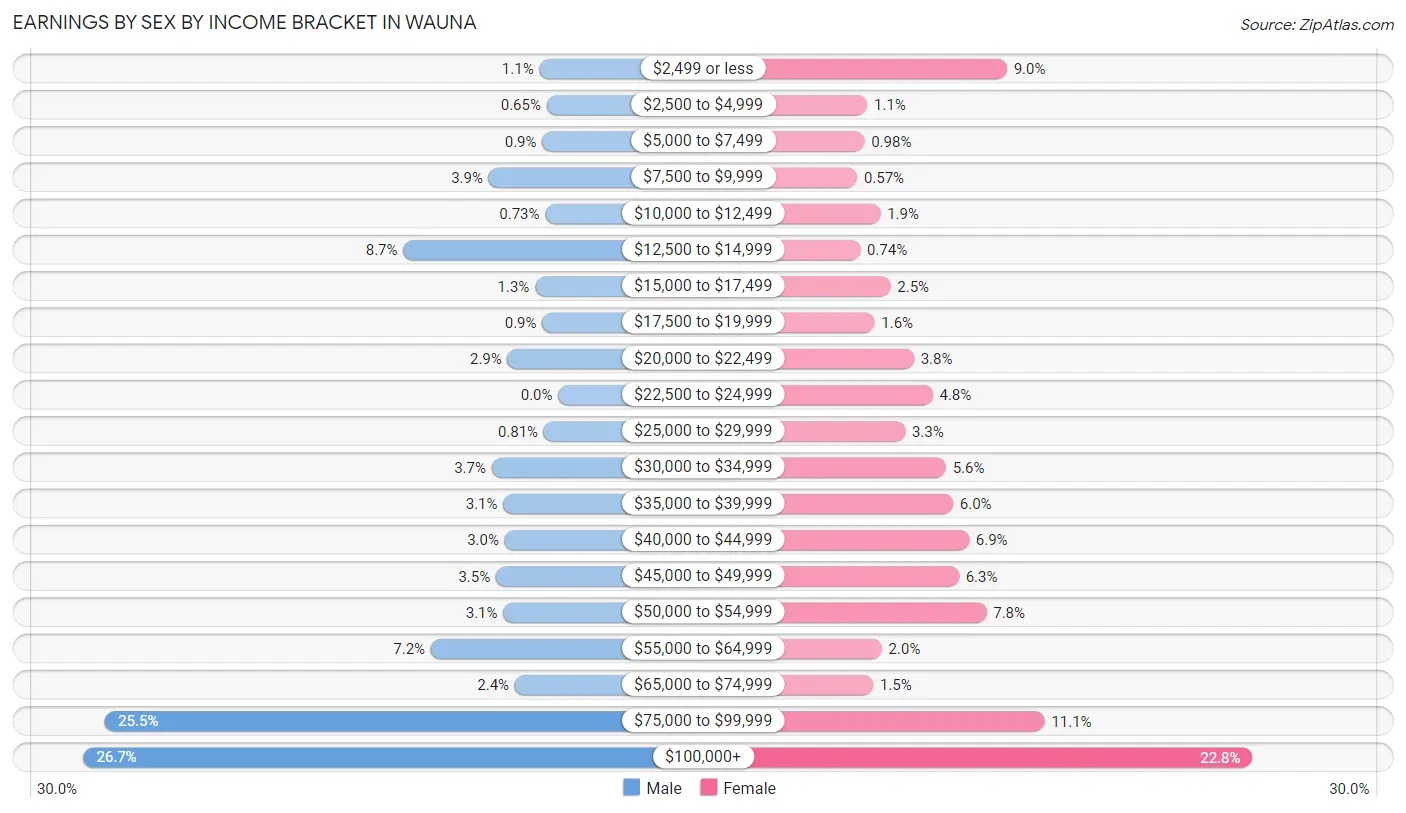
Earnings by Sex by Income Bracket in Wauna
The most common earnings brackets in Wauna are $100,000+ for men (328 | 26.7%) and $100,000+ for women (279 | 22.8%).
| Income | Male | Female |
| $2,499 or less | 13 (1.1%) | 110 (9.0%) |
| $2,500 to $4,999 | 8 (0.6%) | 14 (1.1%) |
| $5,000 to $7,499 | 11 (0.9%) | 12 (1.0%) |
| $7,500 to $9,999 | 48 (3.9%) | 7 (0.6%) |
| $10,000 to $12,499 | 9 (0.7%) | 23 (1.9%) |
| $12,500 to $14,999 | 107 (8.7%) | 9 (0.7%) |
| $15,000 to $17,499 | 16 (1.3%) | 30 (2.5%) |
| $17,500 to $19,999 | 11 (0.9%) | 19 (1.5%) |
| $20,000 to $22,499 | 35 (2.9%) | 46 (3.8%) |
| $22,500 to $24,999 | 0 (0.0%) | 59 (4.8%) |
| $25,000 to $29,999 | 10 (0.8%) | 40 (3.3%) |
| $30,000 to $34,999 | 46 (3.7%) | 68 (5.6%) |
| $35,000 to $39,999 | 38 (3.1%) | 73 (6.0%) |
| $40,000 to $44,999 | 37 (3.0%) | 84 (6.9%) |
| $45,000 to $49,999 | 43 (3.5%) | 77 (6.3%) |
| $50,000 to $54,999 | 38 (3.1%) | 96 (7.8%) |
| $55,000 to $64,999 | 88 (7.2%) | 24 (2.0%) |
| $65,000 to $74,999 | 30 (2.4%) | 18 (1.5%) |
| $75,000 to $99,999 | 313 (25.5%) | 136 (11.1%) |
| $100,000+ | 328 (26.7%) | 279 (22.8%) |
| Total | 1,229 (100.0%) | 1,224 (100.0%) |
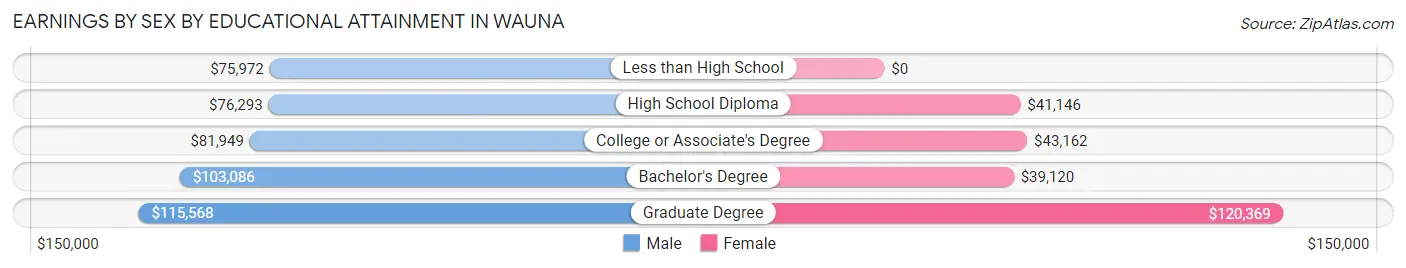
Earnings by Sex by Educational Attainment in Wauna
Average earnings in Wauna are $80,840 for men and $48,254 for women, a difference of 40.3%. Men with an educational attainment of graduate degree enjoy the highest average annual earnings of $115,568, while those with less than high school education earn the least with $75,972. Women with an educational attainment of graduate degree earn the most with the average annual earnings of $120,369, while those with bachelor's degree education have the smallest earnings of $39,120.
| Educational Attainment | Male Income | Female Income |
| Less than High School | $75,972 | $0 |
| High School Diploma | $76,293 | $41,146 |
| College or Associate's Degree | $81,949 | $43,162 |
| Bachelor's Degree | $103,086 | $39,120 |
| Graduate Degree | $115,568 | $120,369 |
| Total | $80,840 | $48,254 |
Family Income in Wauna
Family Income Brackets in Wauna
According to the Wauna family income data, there are 445 families falling into the $100,000 to $149,999 income range, which is the most common income bracket and makes up 31.9% of all families.
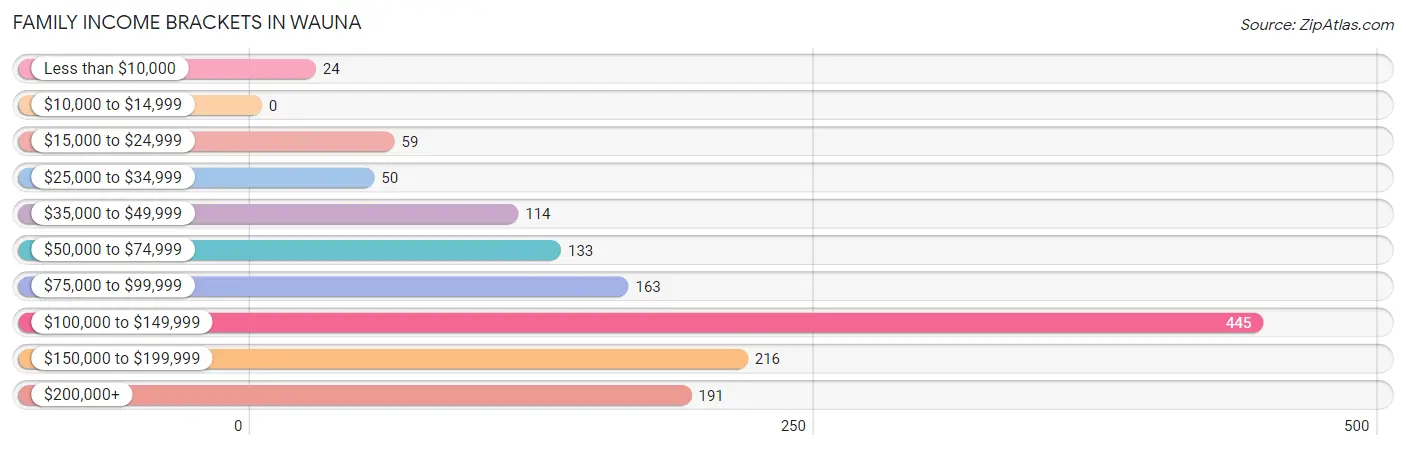
| Income Bracket | # Families | % Families |
| Less than $10,000 | 24 | 1.7% |
| $10,000 to $14,999 | 0 | 0.0% |
| $15,000 to $24,999 | 59 | 4.2% |
| $25,000 to $34,999 | 50 | 3.6% |
| $35,000 to $49,999 | 114 | 8.2% |
| $50,000 to $74,999 | 133 | 9.5% |
| $75,000 to $99,999 | 163 | 11.7% |
| $100,000 to $149,999 | 445 | 31.9% |
| $150,000 to $199,999 | 216 | 15.5% |
| $200,000+ | 191 | 13.7% |
Family Income by Famaliy Size in Wauna
5-person families (54 | 3.9%) account for the highest median family income in Wauna with $161,333 per family, while 2-person families (712 | 51.0%) have the highest median income of $49,076 per family member.
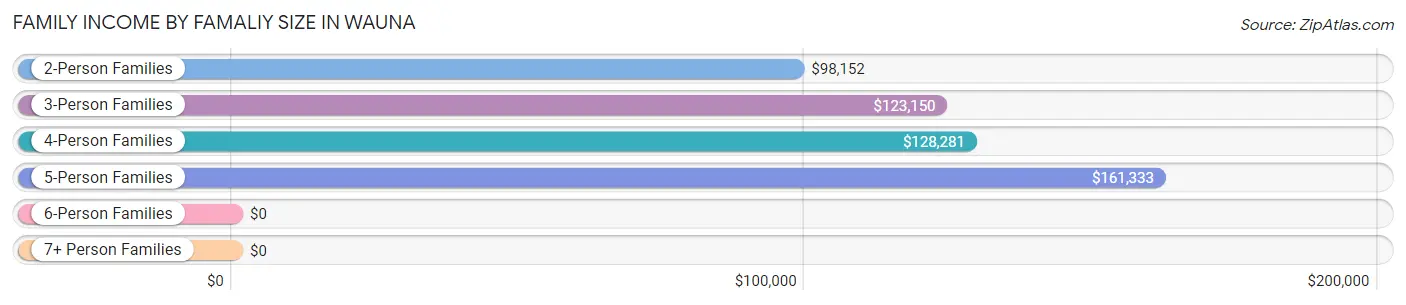
| Income Bracket | # Families | Median Income |
| 2-Person Families | 712 (51.0%) | $98,152 |
| 3-Person Families | 371 (26.6%) | $123,150 |
| 4-Person Families | 249 (17.8%) | $128,281 |
| 5-Person Families | 54 (3.9%) | $161,333 |
| 6-Person Families | 0 (0.0%) | $0 |
| 7+ Person Families | 10 (0.7%) | $0 |
| Total | 1,396 (100.0%) | $121,881 |
Family Income by Number of Earners in Wauna
The median family income in Wauna is $121,881, with families comprising 2 earners (570) having the highest median family income of $152,436, while families with no earners (270) have the lowest median family income of $69,412, accounting for 40.8% and 19.3% of families, respectively.
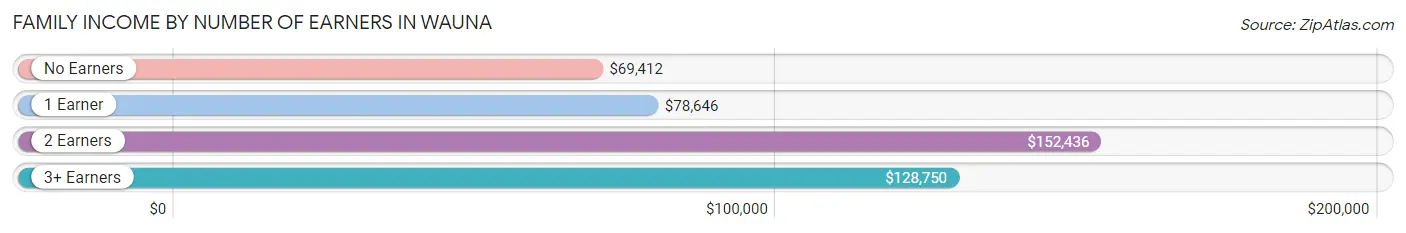
| Number of Earners | # Families | Median Income |
| No Earners | 270 (19.3%) | $69,412 |
| 1 Earner | 404 (28.9%) | $78,646 |
| 2 Earners | 570 (40.8%) | $152,436 |
| 3+ Earners | 152 (10.9%) | $128,750 |
| Total | 1,396 (100.0%) | $121,881 |
Household Income in Wauna
Household Income Brackets in Wauna
With 450 households falling in the category, the $100,000 to $149,999 income range is the most frequent in Wauna, accounting for 24.5% of all households. In contrast, only 31 households (1.7%) fall into the $10,000 to $14,999 income bracket, making it the least populous group.
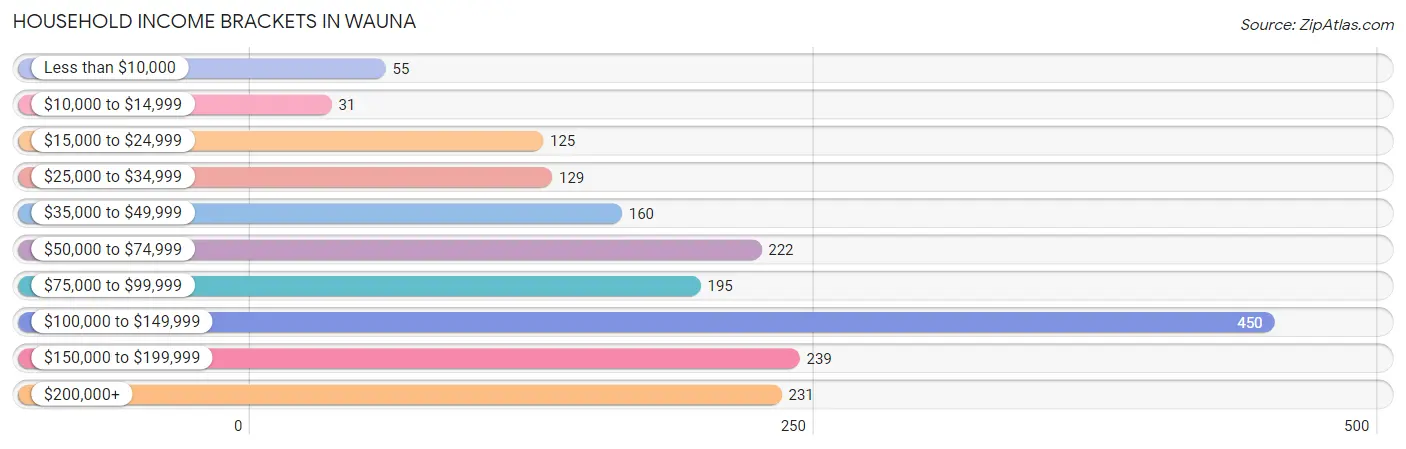
| Income Bracket | # Households | % Households |
| Less than $10,000 | 55 | 3.0% |
| $10,000 to $14,999 | 31 | 1.7% |
| $15,000 to $24,999 | 125 | 6.8% |
| $25,000 to $34,999 | 129 | 7.0% |
| $35,000 to $49,999 | 160 | 8.7% |
| $50,000 to $74,999 | 222 | 12.1% |
| $75,000 to $99,999 | 195 | 10.6% |
| $100,000 to $149,999 | 450 | 24.5% |
| $150,000 to $199,999 | 239 | 13.0% |
| $200,000+ | 231 | 12.6% |
Household Income by Householder Age in Wauna
The median household income in Wauna is $100,329, with the highest median household income of $133,472 found in the 25 to 44 years age bracket for the primary householder. A total of 490 households (26.7%) fall into this category.
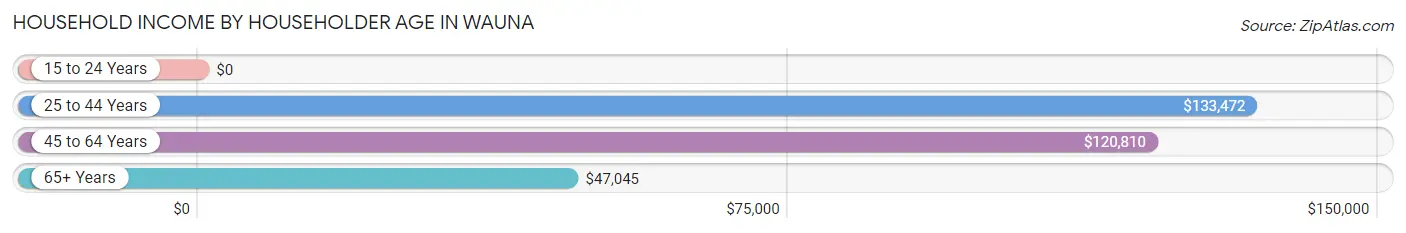
| Income Bracket | # Households | Median Income |
| 15 to 24 Years | 0 (0.0%) | $0 |
| 25 to 44 Years | 490 (26.7%) | $133,472 |
| 45 to 64 Years | 763 (41.5%) | $120,810 |
| 65+ Years | 584 (31.8%) | $47,045 |
| Total | 1,837 (100.0%) | $100,329 |
Poverty in Wauna
Income Below Poverty by Sex and Age in Wauna
With 4.5% poverty level for males and 7.8% for females among the residents of Wauna, 16 and 17 year old males and 16 and 17 year old females are the most vulnerable to poverty, with 15 males (57.7%) and 8 females (38.1%) in their respective age groups living below the poverty level.
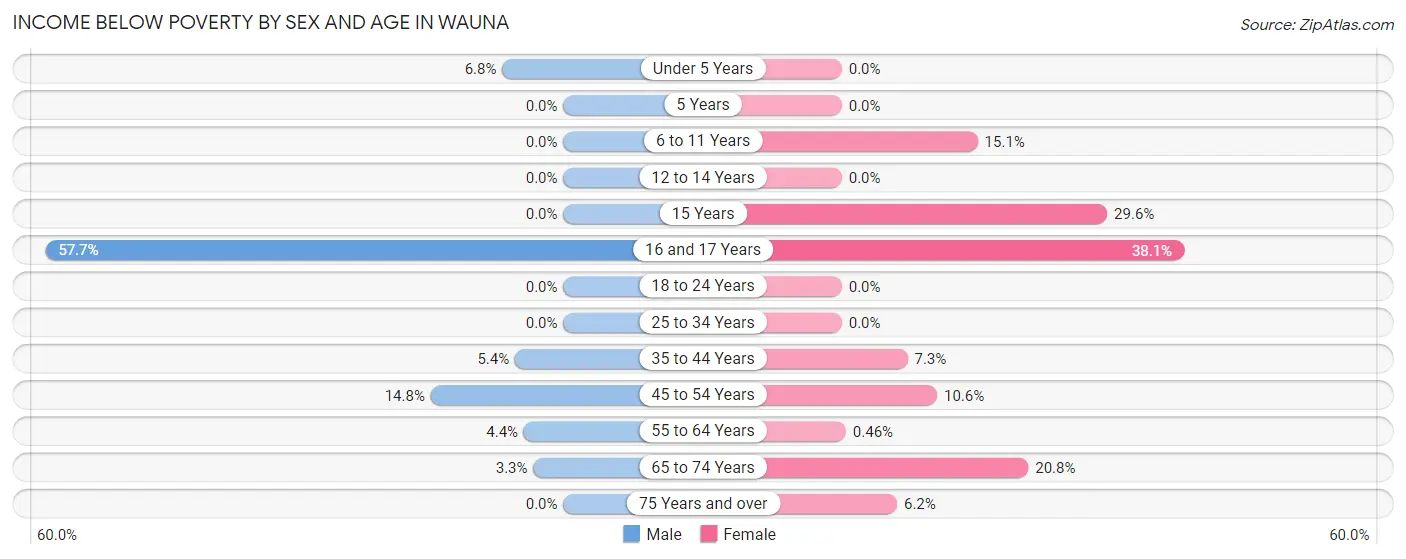
| Age Bracket | Male | Female |
| Under 5 Years | 10 (6.8%) | 0 (0.0%) |
| 5 Years | 0 (0.0%) | 0 (0.0%) |
| 6 to 11 Years | 0 (0.0%) | 23 (15.1%) |
| 12 to 14 Years | 0 (0.0%) | 0 (0.0%) |
| 15 Years | 0 (0.0%) | 13 (29.5%) |
| 16 and 17 Years | 15 (57.7%) | 8 (38.1%) |
| 18 to 24 Years | 0 (0.0%) | 0 (0.0%) |
| 25 to 34 Years | 0 (0.0%) | 0 (0.0%) |
| 35 to 44 Years | 14 (5.4%) | 21 (7.3%) |
| 45 to 54 Years | 44 (14.8%) | 26 (10.6%) |
| 55 to 64 Years | 13 (4.4%) | 2 (0.5%) |
| 65 to 74 Years | 15 (3.3%) | 70 (20.8%) |
| 75 Years and over | 0 (0.0%) | 11 (6.1%) |
| Total | 111 (4.5%) | 174 (7.8%) |
Income Above Poverty by Sex and Age in Wauna
According to the poverty statistics in Wauna, males aged 5 years and females aged under 5 years are the age groups that are most secure financially, with 100.0% of males and 100.0% of females in these age groups living above the poverty line.
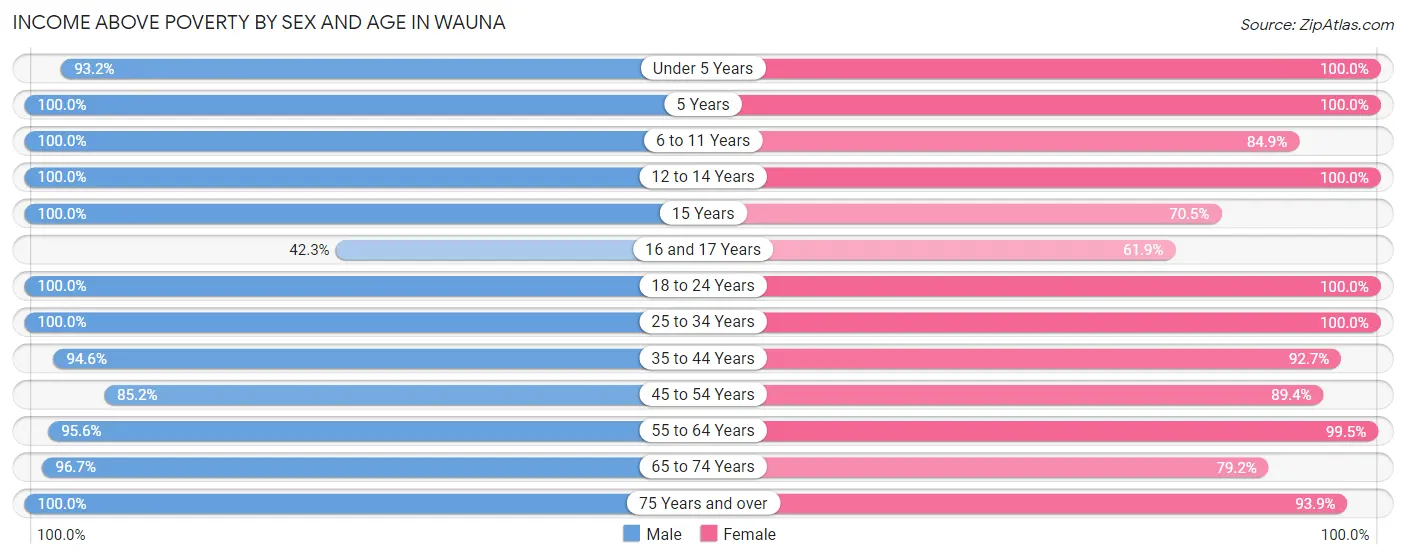
| Age Bracket | Male | Female |
| Under 5 Years | 137 (93.2%) | 133 (100.0%) |
| 5 Years | 36 (100.0%) | 9 (100.0%) |
| 6 to 11 Years | 83 (100.0%) | 129 (84.9%) |
| 12 to 14 Years | 72 (100.0%) | 80 (100.0%) |
| 15 Years | 122 (100.0%) | 31 (70.5%) |
| 16 and 17 Years | 11 (42.3%) | 13 (61.9%) |
| 18 to 24 Years | 251 (100.0%) | 23 (100.0%) |
| 25 to 34 Years | 268 (100.0%) | 298 (100.0%) |
| 35 to 44 Years | 246 (94.6%) | 266 (92.7%) |
| 45 to 54 Years | 254 (85.2%) | 219 (89.4%) |
| 55 to 64 Years | 283 (95.6%) | 432 (99.5%) |
| 65 to 74 Years | 434 (96.7%) | 267 (79.2%) |
| 75 Years and over | 129 (100.0%) | 168 (93.9%) |
| Total | 2,326 (95.5%) | 2,068 (92.2%) |
Income Below Poverty Among Married-Couple Families in Wauna
The poverty statistics for married-couple families in Wauna show that 3.6% or 42 of the total 1,172 families live below the poverty line. Families with 1 or 2 children have the highest poverty rate of 7.0%, comprising of 27 families. On the other hand, families with 3 or 4 children have the lowest poverty rate of 0.0%, which includes 0 families.
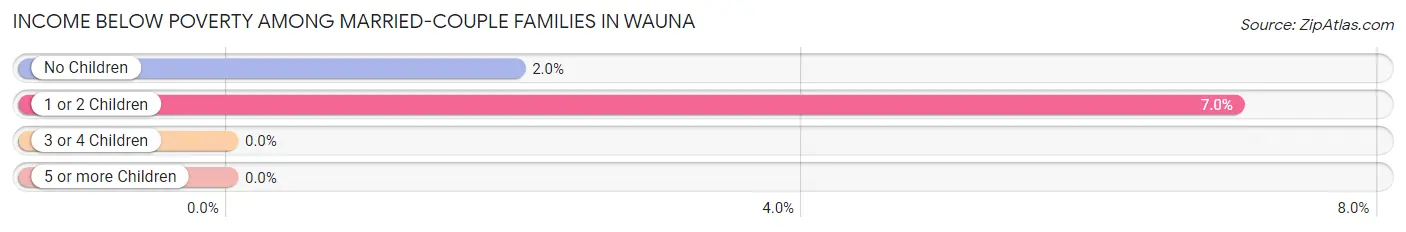
| Children | Above Poverty | Below Poverty |
| No Children | 736 (98.0%) | 15 (2.0%) |
| 1 or 2 Children | 358 (93.0%) | 27 (7.0%) |
| 3 or 4 Children | 36 (100.0%) | 0 (0.0%) |
| 5 or more Children | 0 (0.0%) | 0 (0.0%) |
| Total | 1,130 (96.4%) | 42 (3.6%) |
Income Below Poverty Among Single-Parent Households in Wauna
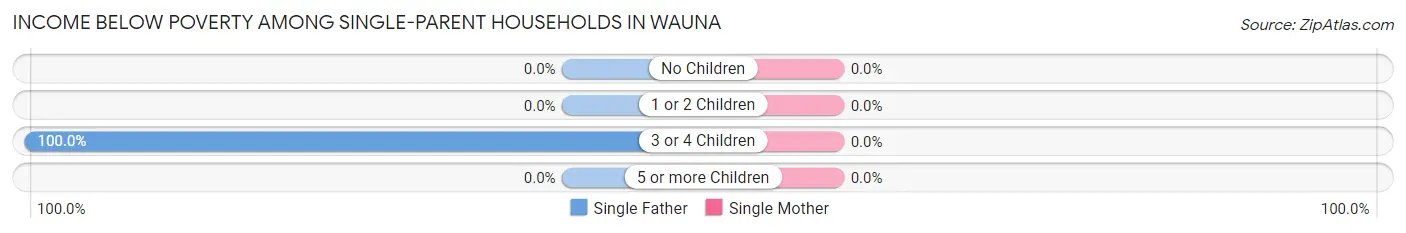
| Children | Single Father | Single Mother |
| No Children | 0 (0.0%) | 0 (0.0%) |
| 1 or 2 Children | 0 (0.0%) | 0 (0.0%) |
| 3 or 4 Children | 10 (100.0%) | 0 (0.0%) |
| 5 or more Children | 0 (0.0%) | 0 (0.0%) |
| Total | 10 (11.2%) | 0 (0.0%) |
Income Below Poverty Among Married-Couple vs Single-Parent Households in Wauna
The poverty data for Wauna shows that 42 of the married-couple family households (3.6%) and 10 of the single-parent households (4.5%) are living below the poverty level. Within the married-couple family households, those with 1 or 2 children have the highest poverty rate, with 27 households (7.0%) falling below the poverty line. Among the single-parent households, those with 3 or 4 children have the highest poverty rate, with 10 household (37.0%) living below poverty.
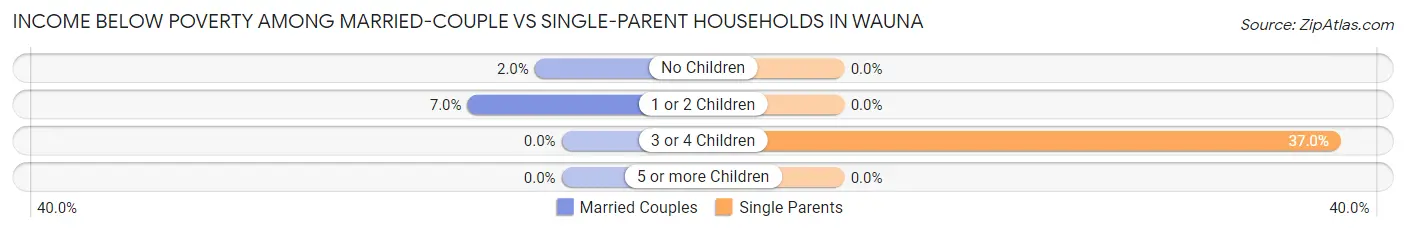
| Children | Married-Couple Families | Single-Parent Households |
| No Children | 15 (2.0%) | 0 (0.0%) |
| 1 or 2 Children | 27 (7.0%) | 0 (0.0%) |
| 3 or 4 Children | 0 (0.0%) | 10 (37.0%) |
| 5 or more Children | 0 (0.0%) | 0 (0.0%) |
| Total | 42 (3.6%) | 10 (4.5%) |
Race in Wauna
The most populous races in Wauna are White / Caucasian (4,216 | 89.9%), Two or more Races (305 | 6.5%), and Hispanic or Latino (296 | 6.3%).
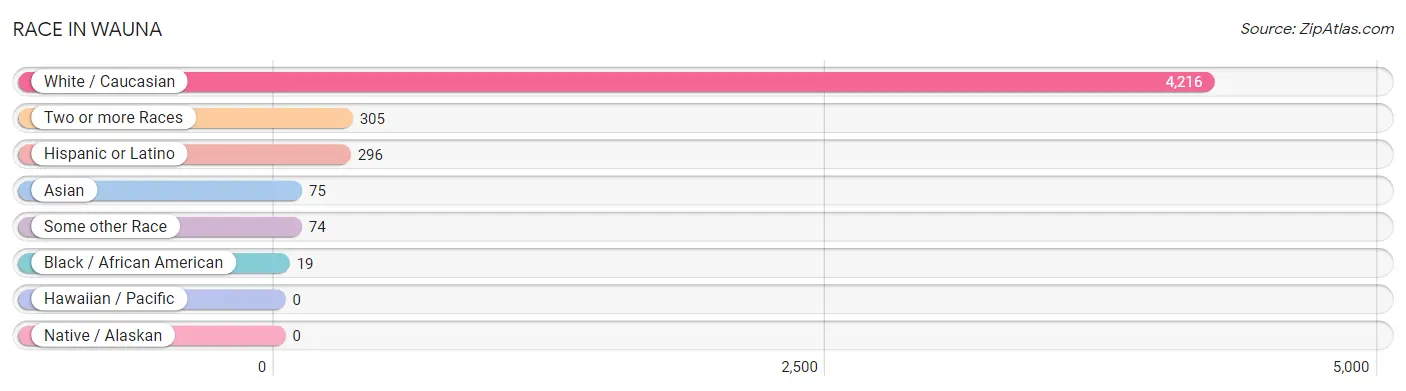
| Race | # Population | % Population |
| Asian | 75 | 1.6% |
| Black / African American | 19 | 0.4% |
| Hawaiian / Pacific | 0 | 0.0% |
| Hispanic or Latino | 296 | 6.3% |
| Native / Alaskan | 0 | 0.0% |
| White / Caucasian | 4,216 | 89.9% |
| Two or more Races | 305 | 6.5% |
| Some other Race | 74 | 1.6% |
| Total | 4,689 | 100.0% |
Ancestry in Wauna
The most populous ancestries reported in Wauna are German (801 | 17.1%), Irish (795 | 17.0%), English (638 | 13.6%), American (346 | 7.4%), and Norwegian (324 | 6.9%), together accounting for 61.9% of all Wauna residents.
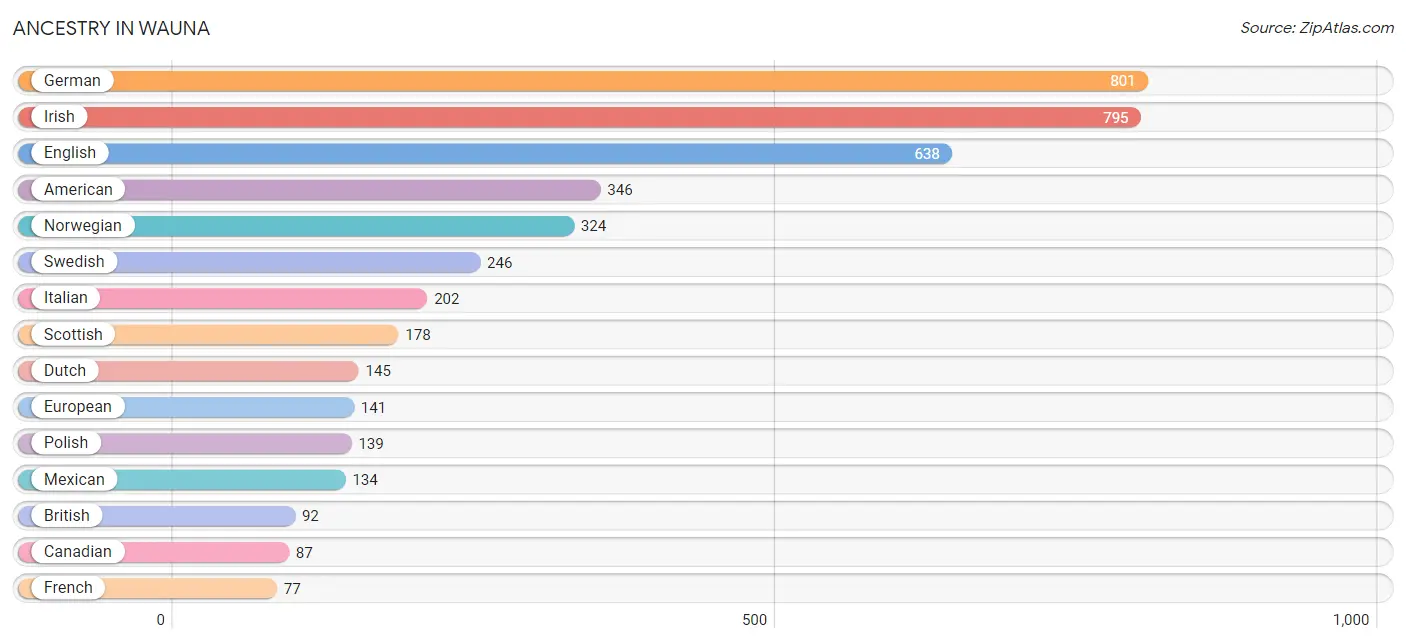
| Ancestry | # Population | % Population |
| American | 346 | 7.4% |
| Bhutanese | 36 | 0.8% |
| British | 92 | 2.0% |
| Canadian | 87 | 1.9% |
| Cherokee | 9 | 0.2% |
| Colombian | 14 | 0.3% |
| Danish | 29 | 0.6% |
| Dutch | 145 | 3.1% |
| Eastern European | 43 | 0.9% |
| English | 638 | 13.6% |
| European | 141 | 3.0% |
| Finnish | 24 | 0.5% |
| French | 77 | 1.6% |
| French Canadian | 49 | 1.0% |
| German | 801 | 17.1% |
| Indian (Asian) | 31 | 0.7% |
| Irish | 795 | 17.0% |
| Italian | 202 | 4.3% |
| Korean | 57 | 1.2% |
| Liberian | 11 | 0.2% |
| Lithuanian | 10 | 0.2% |
| Luxembourger | 30 | 0.6% |
| Macedonian | 41 | 0.9% |
| Maltese | 9 | 0.2% |
| Mexican | 134 | 2.9% |
| Native Hawaiian | 16 | 0.3% |
| Northern European | 11 | 0.2% |
| Norwegian | 324 | 6.9% |
| Polish | 139 | 3.0% |
| Portuguese | 8 | 0.2% |
| Puerto Rican | 10 | 0.2% |
| Puget Sound Salish | 11 | 0.2% |
| Romanian | 32 | 0.7% |
| Russian | 27 | 0.6% |
| Scandinavian | 19 | 0.4% |
| Scotch-Irish | 64 | 1.4% |
| Scottish | 178 | 3.8% |
| Serbian | 23 | 0.5% |
| South American | 14 | 0.3% |
| Spanish | 56 | 1.2% |
| Sri Lankan | 62 | 1.3% |
| Subsaharan African | 11 | 0.2% |
| Swedish | 246 | 5.2% |
| Swiss | 10 | 0.2% |
| Ukrainian | 14 | 0.3% |
| Welsh | 8 | 0.2% | View All 46 Rows |
Immigrants in Wauna
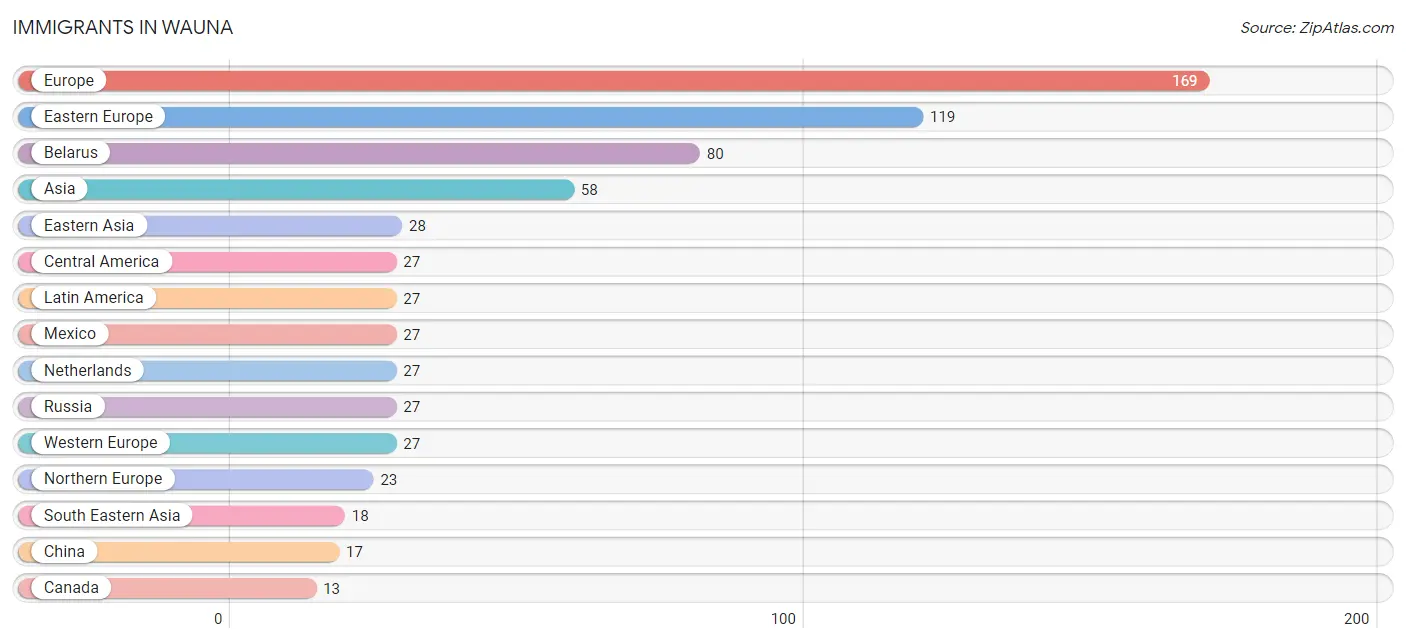
The most numerous immigrant groups reported in Wauna came from Europe (169 | 3.6%), Eastern Europe (119 | 2.5%), Belarus (80 | 1.7%), Asia (58 | 1.2%), and Eastern Asia (28 | 0.6%), together accounting for 9.7% of all Wauna residents.
| Immigration Origin | # Population | % Population |
| Asia | 58 | 1.2% |
| Australia | 12 | 0.3% |
| Belarus | 80 | 1.7% |
| Canada | 13 | 0.3% |
| Central America | 27 | 0.6% |
| China | 17 | 0.4% |
| Eastern Asia | 28 | 0.6% |
| Eastern Europe | 119 | 2.5% |
| England | 11 | 0.2% |
| Europe | 169 | 3.6% |
| Israel | 12 | 0.3% |
| Japan | 11 | 0.2% |
| Latin America | 27 | 0.6% |
| Mexico | 27 | 0.6% |
| Netherlands | 27 | 0.6% |
| Northern Europe | 23 | 0.5% |
| Oceania | 12 | 0.3% |
| Philippines | 11 | 0.2% |
| Russia | 27 | 0.6% |
| Scotland | 12 | 0.3% |
| Serbia | 12 | 0.3% |
| South Eastern Asia | 18 | 0.4% |
| Vietnam | 7 | 0.2% |
| Western Asia | 12 | 0.3% |
| Western Europe | 27 | 0.6% | View All 25 Rows |
Sex and Age in Wauna
Sex and Age in Wauna
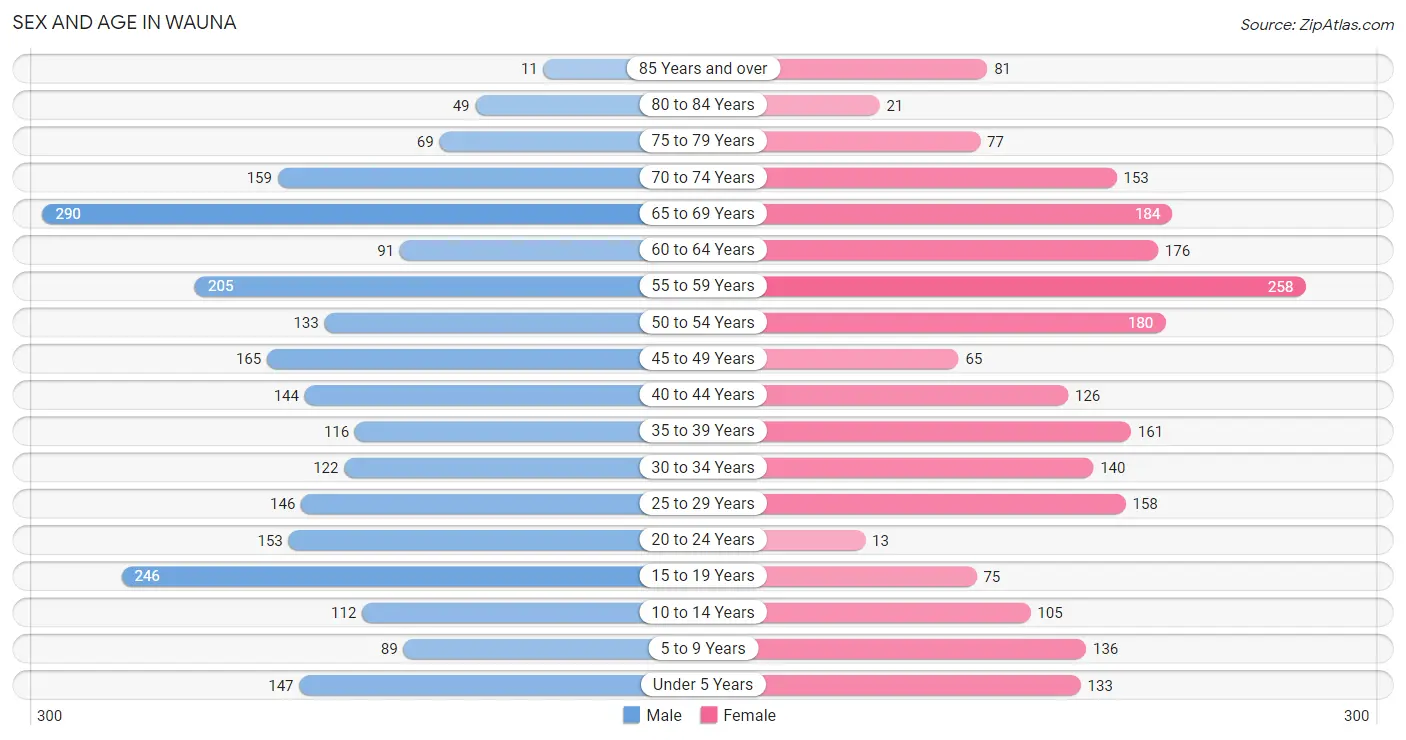
The most populous age groups in Wauna are 65 to 69 Years (290 | 11.8%) for men and 55 to 59 Years (258 | 11.5%) for women.
| Age Bracket | Male | Female |
| Under 5 Years | 147 (6.0%) | 133 (5.9%) |
| 5 to 9 Years | 89 (3.6%) | 136 (6.1%) |
| 10 to 14 Years | 112 (4.6%) | 105 (4.7%) |
| 15 to 19 Years | 246 (10.1%) | 75 (3.4%) |
| 20 to 24 Years | 153 (6.2%) | 13 (0.6%) |
| 25 to 29 Years | 146 (6.0%) | 158 (7.0%) |
| 30 to 34 Years | 122 (5.0%) | 140 (6.2%) |
| 35 to 39 Years | 116 (4.7%) | 161 (7.2%) |
| 40 to 44 Years | 144 (5.9%) | 126 (5.6%) |
| 45 to 49 Years | 165 (6.7%) | 65 (2.9%) |
| 50 to 54 Years | 133 (5.4%) | 180 (8.0%) |
| 55 to 59 Years | 205 (8.4%) | 258 (11.5%) |
| 60 to 64 Years | 91 (3.7%) | 176 (7.9%) |
| 65 to 69 Years | 290 (11.8%) | 184 (8.2%) |
| 70 to 74 Years | 159 (6.5%) | 153 (6.8%) |
| 75 to 79 Years | 69 (2.8%) | 77 (3.4%) |
| 80 to 84 Years | 49 (2.0%) | 21 (0.9%) |
| 85 Years and over | 11 (0.4%) | 81 (3.6%) |
| Total | 2,447 (100.0%) | 2,242 (100.0%) |
Families and Households in Wauna
Median Family Size in Wauna
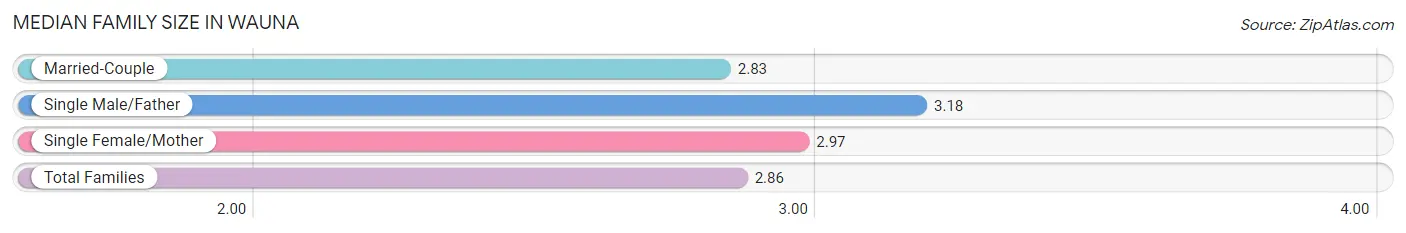
The median family size in Wauna is 2.86 persons per family, with single male/father families (89 | 6.4%) accounting for the largest median family size of 3.18 persons per family. On the other hand, married-couple families (1,172 | 84.0%) represent the smallest median family size with 2.83 persons per family.
| Family Type | # Families | Family Size |
| Married-Couple | 1,172 (84.0%) | 2.83 |
| Single Male/Father | 89 (6.4%) | 3.18 |
| Single Female/Mother | 135 (9.7%) | 2.97 |
| Total Families | 1,396 (100.0%) | 2.86 |
Median Household Size in Wauna
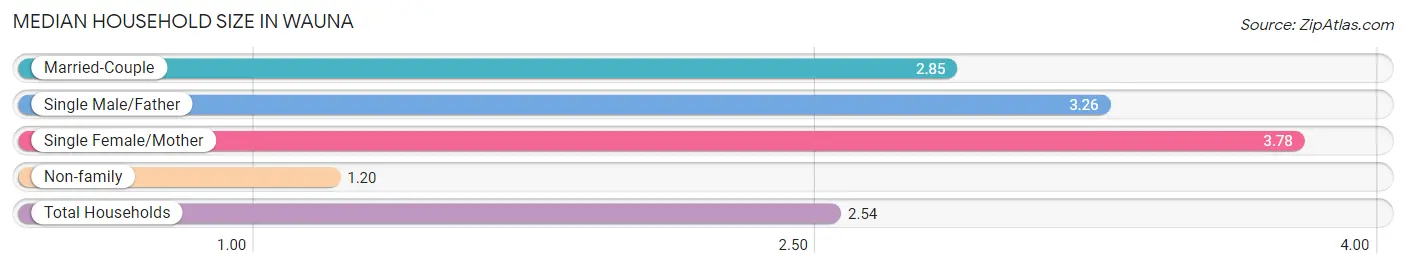
The median household size in Wauna is 2.54 persons per household, with single female/mother households (135 | 7.3%) accounting for the largest median household size of 3.78 persons per household. non-family households (441 | 24.0%) represent the smallest median household size with 1.20 persons per household.
| Household Type | # Households | Household Size |
| Married-Couple | 1,172 (63.8%) | 2.85 |
| Single Male/Father | 89 (4.8%) | 3.26 |
| Single Female/Mother | 135 (7.3%) | 3.78 |
| Non-family | 441 (24.0%) | 1.20 |
| Total Households | 1,837 (100.0%) | 2.54 |
Household Size by Marriage Status in Wauna
Out of a total of 1,837 households in Wauna, 1,396 (76.0%) are family households, while 441 (24.0%) are nonfamily households. The most numerous type of family households are 2-person households, comprising 694, and the most common type of nonfamily households are 1-person households, comprising 367.
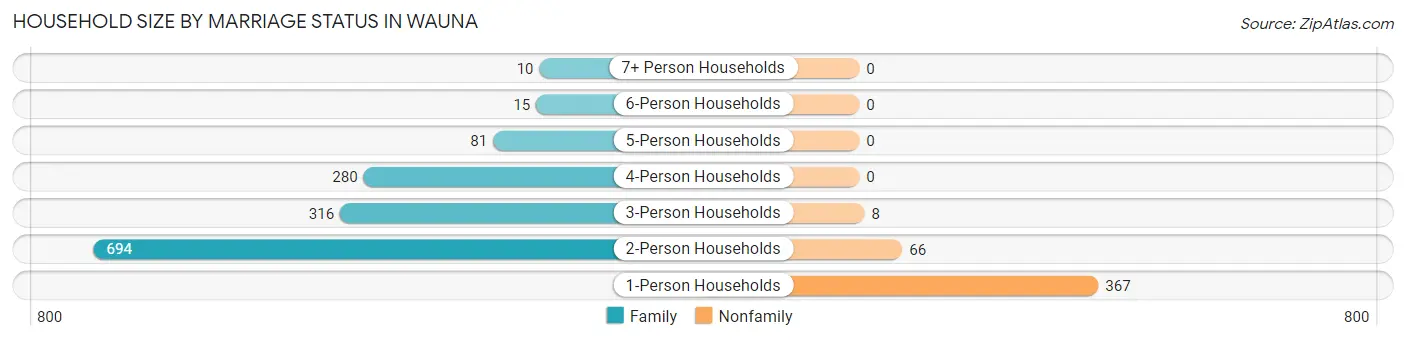
| Household Size | Family Households | Nonfamily Households |
| 1-Person Households | - | 367 (20.0%) |
| 2-Person Households | 694 (37.8%) | 66 (3.6%) |
| 3-Person Households | 316 (17.2%) | 8 (0.4%) |
| 4-Person Households | 280 (15.2%) | 0 (0.0%) |
| 5-Person Households | 81 (4.4%) | 0 (0.0%) |
| 6-Person Households | 15 (0.8%) | 0 (0.0%) |
| 7+ Person Households | 10 (0.5%) | 0 (0.0%) |
| Total | 1,396 (76.0%) | 441 (24.0%) |
Female Fertility in Wauna
Fertility by Age in Wauna
Average fertility rate in Wauna is 39.0 births per 1,000 women. Women in the age bracket of 20 to 34 years have the highest fertility rate with 96.0 births per 1,000 women. Women in the age bracket of 20 to 34 years acount for 100.0% of all women with births.
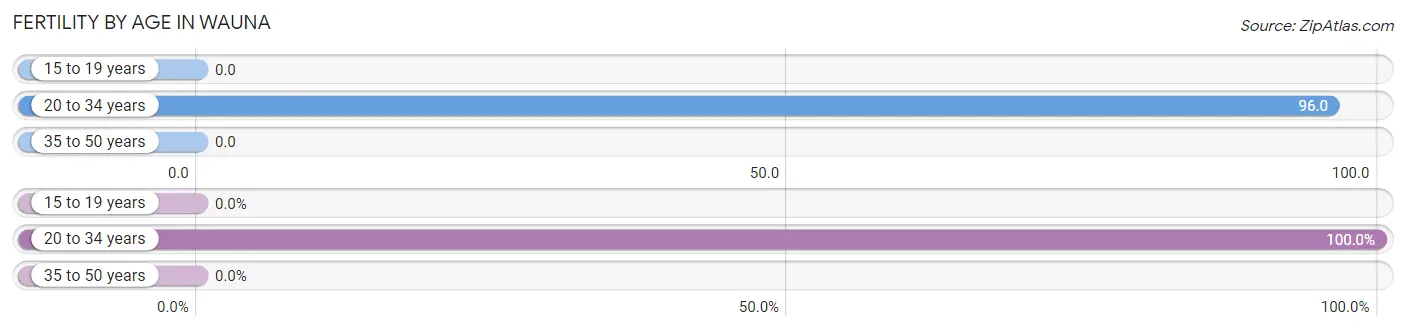
| Age Bracket | Women with Births | Births / 1,000 Women |
| 15 to 19 years | 0 (0.0%) | 0.0 |
| 20 to 34 years | 30 (100.0%) | 96.0 |
| 35 to 50 years | 0 (0.0%) | 0.0 |
| Total | 30 (100.0%) | 39.0 |
Fertility by Age by Marriage Status in Wauna
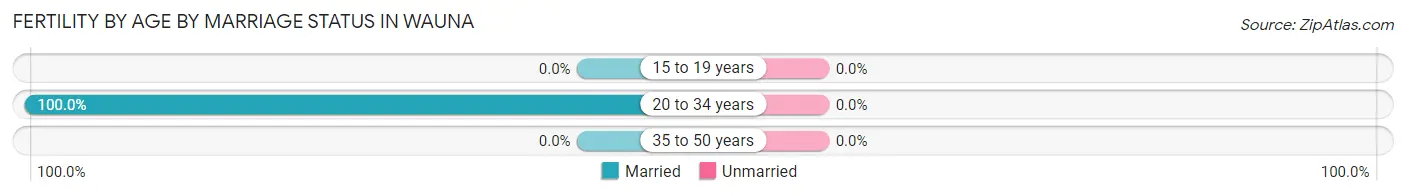
| Age Bracket | Married | Unmarried |
| 15 to 19 years | 0 (0.0%) | 0 (0.0%) |
| 20 to 34 years | 30 (100.0%) | 0 (0.0%) |
| 35 to 50 years | 0 (0.0%) | 0 (0.0%) |
| Total | 30 (100.0%) | 0 (0.0%) |
Fertility by Education in Wauna
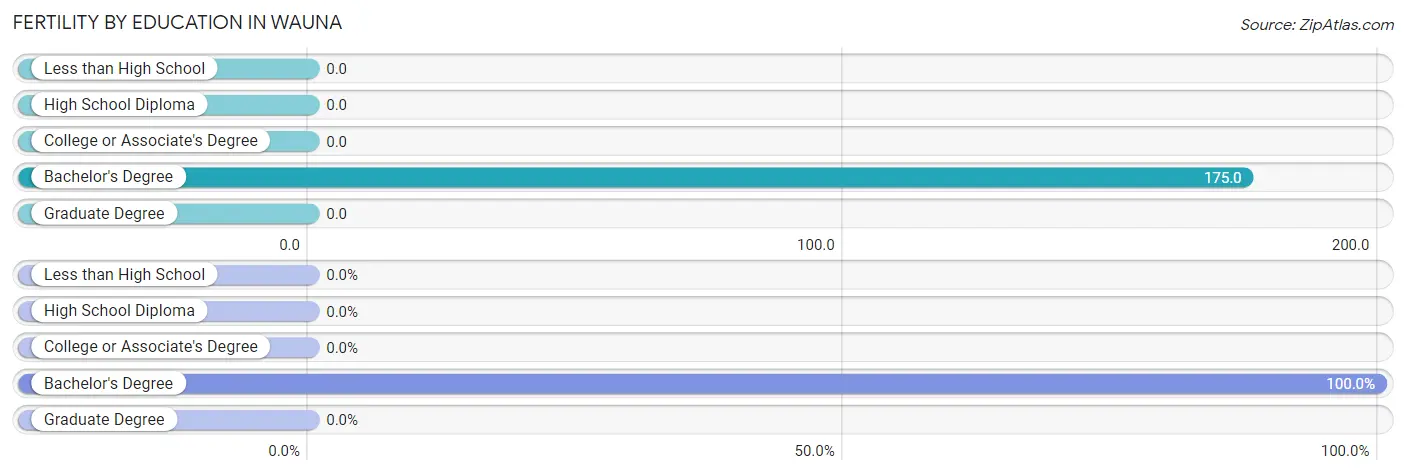
| Educational Attainment | Women with Births | Births / 1,000 Women |
| Less than High School | 0 (0.0%) | 0.0 |
| High School Diploma | 0 (0.0%) | 0.0 |
| College or Associate's Degree | 0 (0.0%) | 0.0 |
| Bachelor's Degree | 30 (100.0%) | 175.0 |
| Graduate Degree | 0 (0.0%) | 0.0 |
| Total | 30 (100.0%) | 39.0 |
Fertility by Education by Marriage Status in Wauna
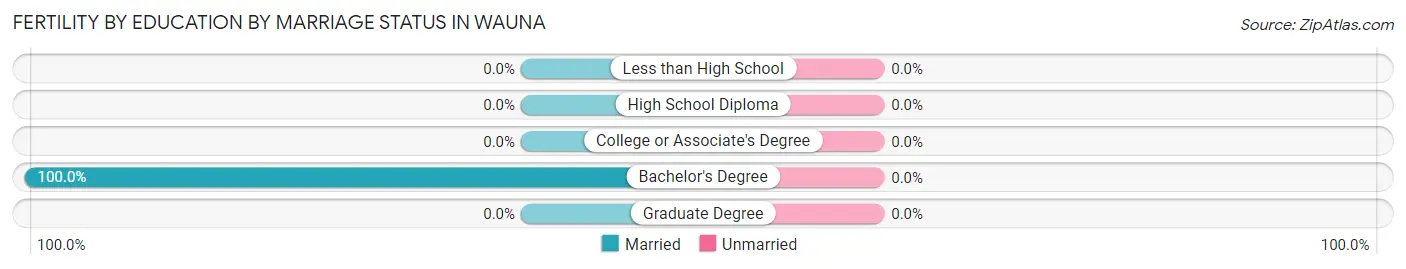
| Educational Attainment | Married | Unmarried |
| Less than High School | 0 (0.0%) | 0 (0.0%) |
| High School Diploma | 0 (0.0%) | 0 (0.0%) |
| College or Associate's Degree | 0 (0.0%) | 0 (0.0%) |
| Bachelor's Degree | 30 (100.0%) | 0 (0.0%) |
| Graduate Degree | 0 (0.0%) | 0 (0.0%) |
| Total | 30 (100.0%) | 0 (0.0%) |
Employment Characteristics in Wauna
Employment by Class of Employer in Wauna
Among the 2,235 employed individuals in Wauna, private company employees (1,286 | 57.5%), not-for-profit organizations (229 | 10.2%), and self-employed (not incorporated) (226 | 10.1%) make up the most common classes of employment.
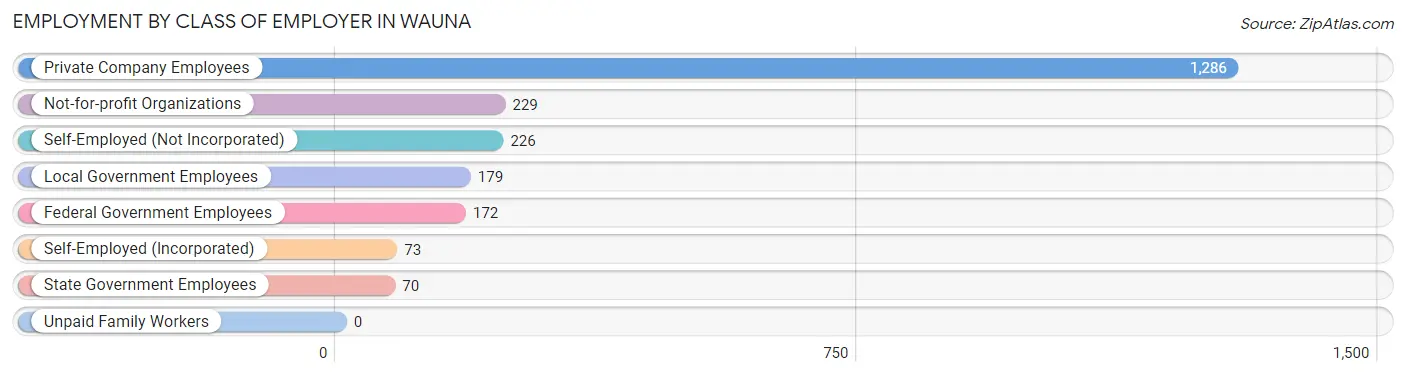
| Employer Class | # Employees | % Employees |
| Private Company Employees | 1,286 | 57.5% |
| Self-Employed (Incorporated) | 73 | 3.3% |
| Self-Employed (Not Incorporated) | 226 | 10.1% |
| Not-for-profit Organizations | 229 | 10.2% |
| Local Government Employees | 179 | 8.0% |
| State Government Employees | 70 | 3.1% |
| Federal Government Employees | 172 | 7.7% |
| Unpaid Family Workers | 0 | 0.0% |
| Total | 2,235 | 100.0% |
Employment Status by Age in Wauna
According to the labor force statistics for Wauna, out of the total population over 16 years of age (3,801), 63.1% or 2,398 individuals are in the labor force, with 4.7% or 113 of them unemployed. The age group with the highest labor force participation rate is 25 to 29 years, with 96.4% or 293 individuals in the labor force. Within the labor force, the 20 to 24 years age range has the highest percentage of unemployed individuals, with 25.8% or 25 of them being unemployed.
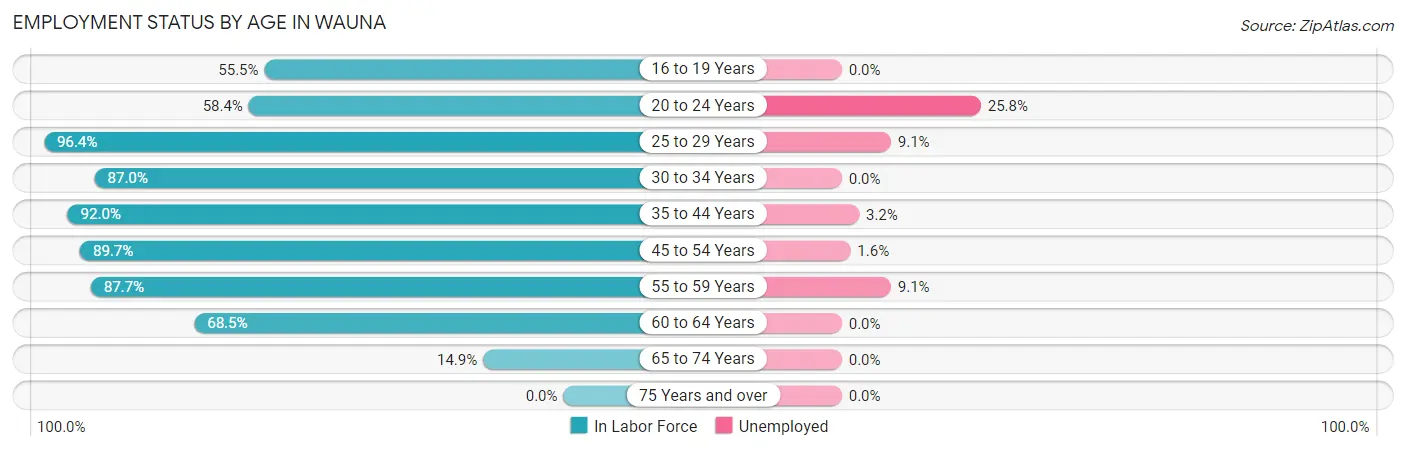
| Age Bracket | In Labor Force | Unemployed |
| 16 to 19 Years | 86 (55.5%) | 0 (0.0%) |
| 20 to 24 Years | 97 (58.4%) | 25 (25.8%) |
| 25 to 29 Years | 293 (96.4%) | 27 (9.1%) |
| 30 to 34 Years | 228 (87.0%) | 0 (0.0%) |
| 35 to 44 Years | 503 (92.0%) | 16 (3.2%) |
| 45 to 54 Years | 487 (89.7%) | 8 (1.6%) |
| 55 to 59 Years | 406 (87.7%) | 37 (9.1%) |
| 60 to 64 Years | 183 (68.5%) | 0 (0.0%) |
| 65 to 74 Years | 117 (14.9%) | 0 (0.0%) |
| 75 Years and over | 0 (0.0%) | 0 (0.0%) |
| Total | 2,398 (63.1%) | 113 (4.7%) |
Employment Status by Educational Attainment in Wauna
According to labor force statistics for Wauna, 88.0% of individuals (2,100) out of the total population between 25 and 64 years of age (2,386) are in the labor force, with 4.2% or 88 of them being unemployed. The group with the highest labor force participation rate are those with the educational attainment of bachelor's degree or higher, with 94.7% or 720 individuals in the labor force. Within the labor force, individuals with high school diploma education have the highest percentage of unemployment, with 6.1% or 26 of them being unemployed.
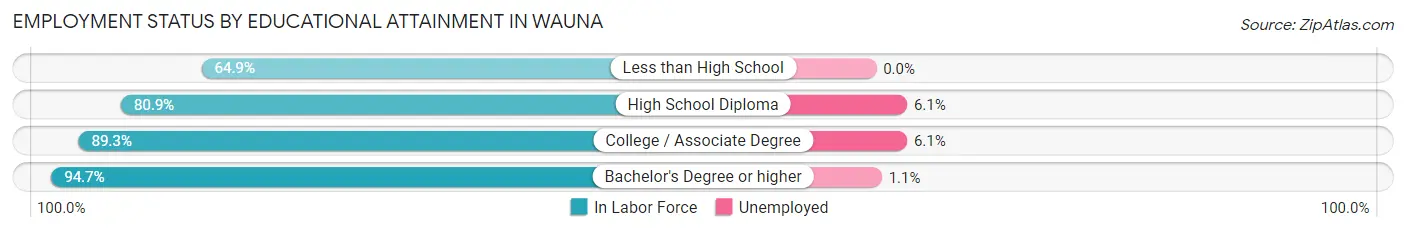
| Educational Attainment | In Labor Force | Unemployed |
| Less than High School | 72 (64.9%) | 0 (0.0%) |
| High School Diploma | 427 (80.9%) | 32 (6.1%) |
| College / Associate Degree | 881 (89.3%) | 60 (6.1%) |
| Bachelor's Degree or higher | 720 (94.7%) | 8 (1.1%) |
| Total | 2,100 (88.0%) | 100 (4.2%) |
Employment Occupations by Sex in Wauna
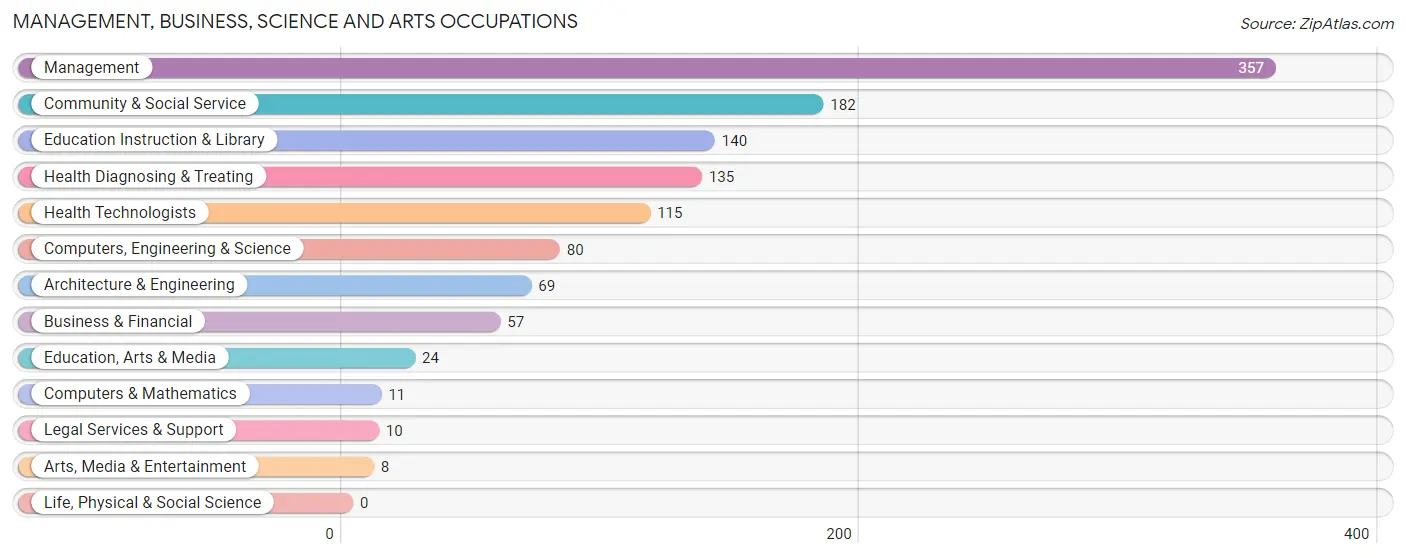
Management, Business, Science and Arts Occupations
The most common Management, Business, Science and Arts occupations in Wauna are Management (357 | 15.7%), Community & Social Service (182 | 8.0%), Education Instruction & Library (140 | 6.1%), Health Diagnosing & Treating (135 | 5.9%), and Health Technologists (115 | 5.0%).
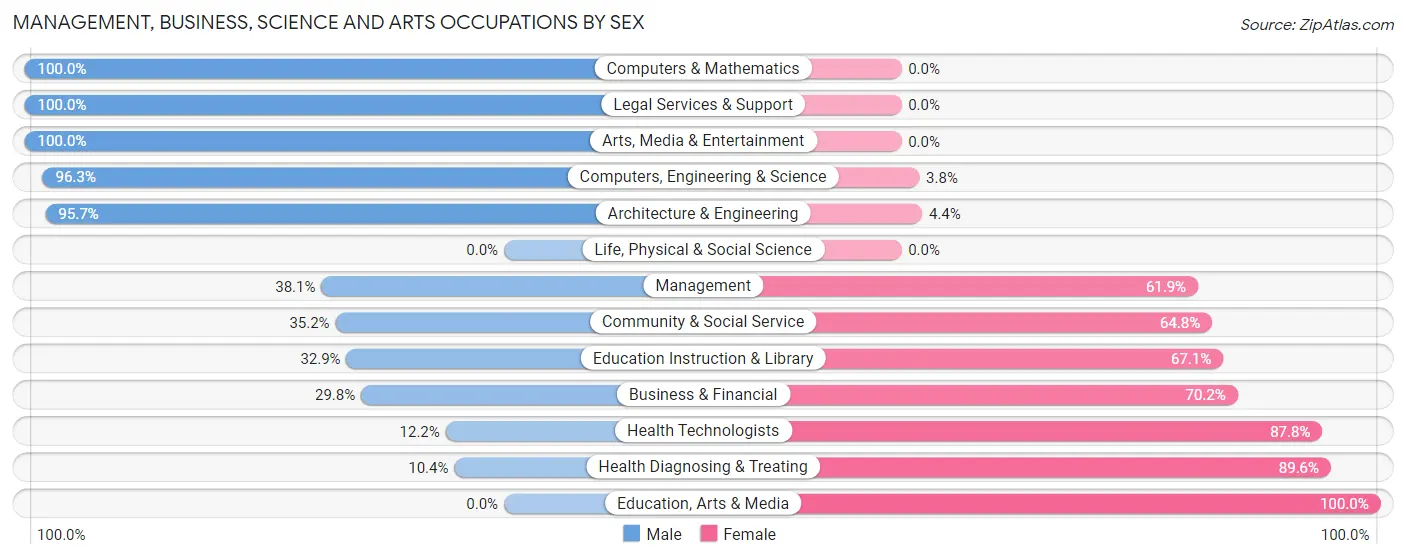
Management, Business, Science and Arts Occupations by Sex
Within the Management, Business, Science and Arts occupations in Wauna, the most male-oriented occupations are Computers & Mathematics (100.0%), Legal Services & Support (100.0%), and Arts, Media & Entertainment (100.0%), while the most female-oriented occupations are Education, Arts & Media (100.0%), Health Diagnosing & Treating (89.6%), and Health Technologists (87.8%).
| Occupation | Male | Female |
| Management | 136 (38.1%) | 221 (61.9%) |
| Business & Financial | 17 (29.8%) | 40 (70.2%) |
| Computers, Engineering & Science | 77 (96.3%) | 3 (3.7%) |
| Computers & Mathematics | 11 (100.0%) | 0 (0.0%) |
| Architecture & Engineering | 66 (95.7%) | 3 (4.3%) |
| Life, Physical & Social Science | 0 (0.0%) | 0 (0.0%) |
| Community & Social Service | 64 (35.2%) | 118 (64.8%) |
| Education, Arts & Media | 0 (0.0%) | 24 (100.0%) |
| Legal Services & Support | 10 (100.0%) | 0 (0.0%) |
| Education Instruction & Library | 46 (32.9%) | 94 (67.1%) |
| Arts, Media & Entertainment | 8 (100.0%) | 0 (0.0%) |
| Health Diagnosing & Treating | 14 (10.4%) | 121 (89.6%) |
| Health Technologists | 14 (12.2%) | 101 (87.8%) |
| Total (Category) | 308 (38.0%) | 503 (62.0%) |
| Total (Overall) | 1,152 (50.5%) | 1,128 (49.5%) |
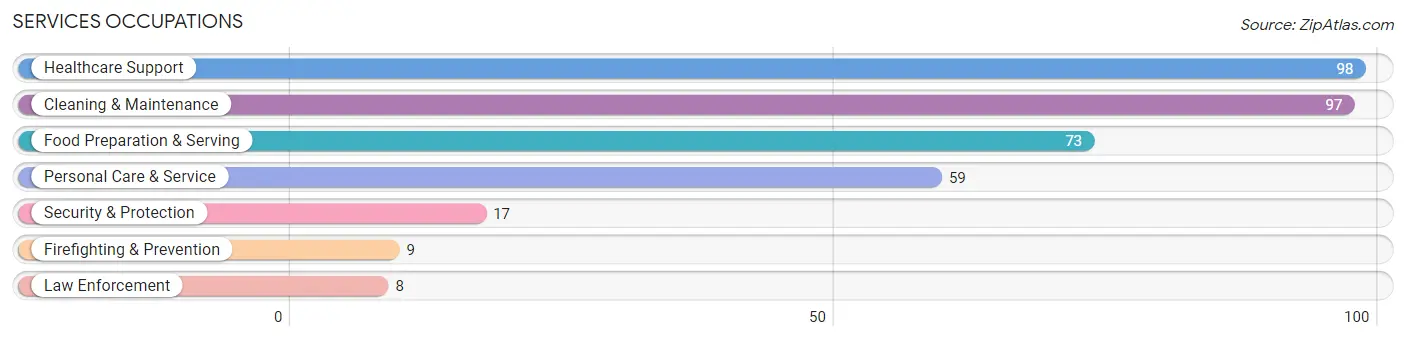
Services Occupations
The most common Services occupations in Wauna are Healthcare Support (98 | 4.3%), Cleaning & Maintenance (97 | 4.3%), Food Preparation & Serving (73 | 3.2%), Personal Care & Service (59 | 2.6%), and Security & Protection (17 | 0.7%).
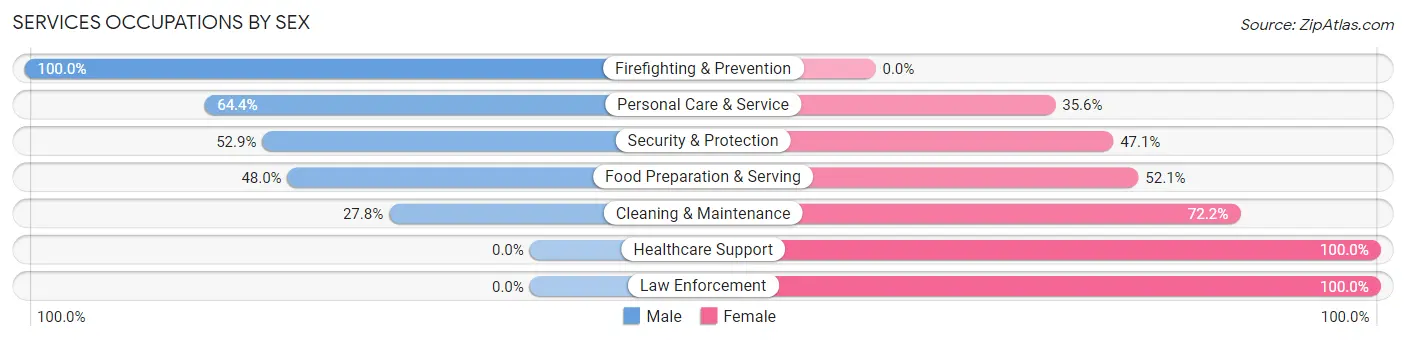
Services Occupations by Sex
Within the Services occupations in Wauna, the most male-oriented occupations are Firefighting & Prevention (100.0%), Personal Care & Service (64.4%), and Security & Protection (52.9%), while the most female-oriented occupations are Healthcare Support (100.0%), Law Enforcement (100.0%), and Cleaning & Maintenance (72.2%).
| Occupation | Male | Female |
| Healthcare Support | 0 (0.0%) | 98 (100.0%) |
| Security & Protection | 9 (52.9%) | 8 (47.1%) |
| Firefighting & Prevention | 9 (100.0%) | 0 (0.0%) |
| Law Enforcement | 0 (0.0%) | 8 (100.0%) |
| Food Preparation & Serving | 35 (47.9%) | 38 (52.0%) |
| Cleaning & Maintenance | 27 (27.8%) | 70 (72.2%) |
| Personal Care & Service | 38 (64.4%) | 21 (35.6%) |
| Total (Category) | 109 (31.7%) | 235 (68.3%) |
| Total (Overall) | 1,152 (50.5%) | 1,128 (49.5%) |
Sales and Office Occupations
The most common Sales and Office occupations in Wauna are Office & Administration (257 | 11.3%), and Sales & Related (210 | 9.2%).
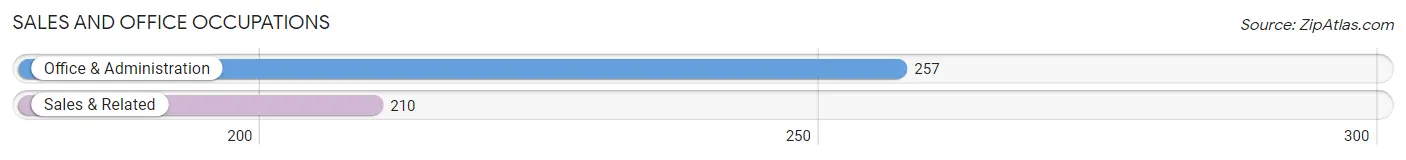
Sales and Office Occupations by Sex
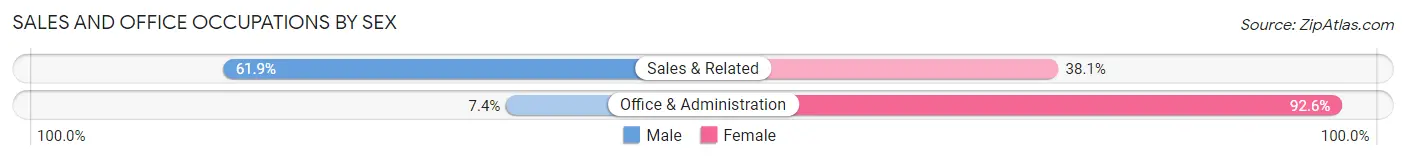
| Occupation | Male | Female |
| Sales & Related | 130 (61.9%) | 80 (38.1%) |
| Office & Administration | 19 (7.4%) | 238 (92.6%) |
| Total (Category) | 149 (31.9%) | 318 (68.1%) |
| Total (Overall) | 1,152 (50.5%) | 1,128 (49.5%) |
Natural Resources, Construction and Maintenance Occupations
The most common Natural Resources, Construction and Maintenance occupations in Wauna are Construction & Extraction (276 | 12.1%), and Installation, Maintenance & Repair (104 | 4.6%).
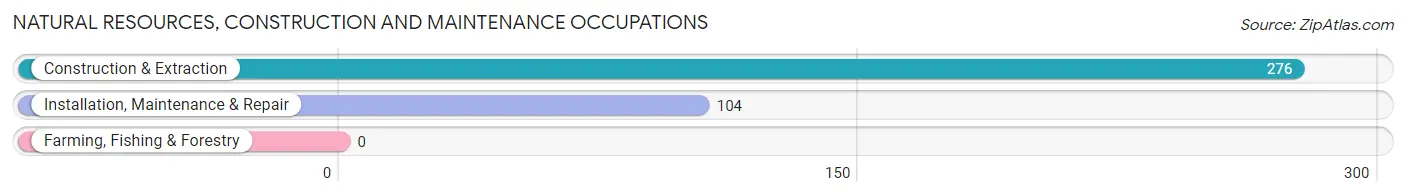
Natural Resources, Construction and Maintenance Occupations by Sex
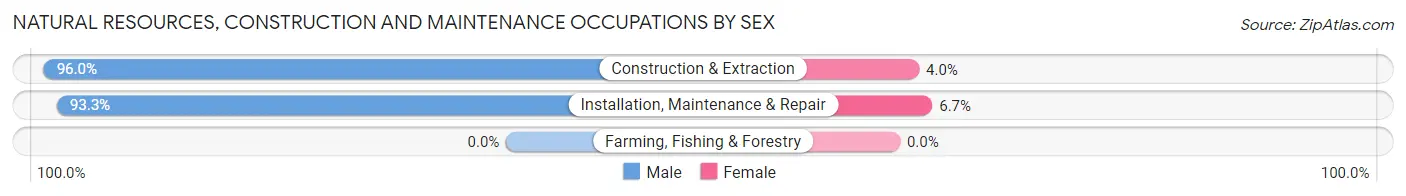
| Occupation | Male | Female |
| Farming, Fishing & Forestry | 0 (0.0%) | 0 (0.0%) |
| Construction & Extraction | 265 (96.0%) | 11 (4.0%) |
| Installation, Maintenance & Repair | 97 (93.3%) | 7 (6.7%) |
| Total (Category) | 362 (95.3%) | 18 (4.7%) |
| Total (Overall) | 1,152 (50.5%) | 1,128 (49.5%) |
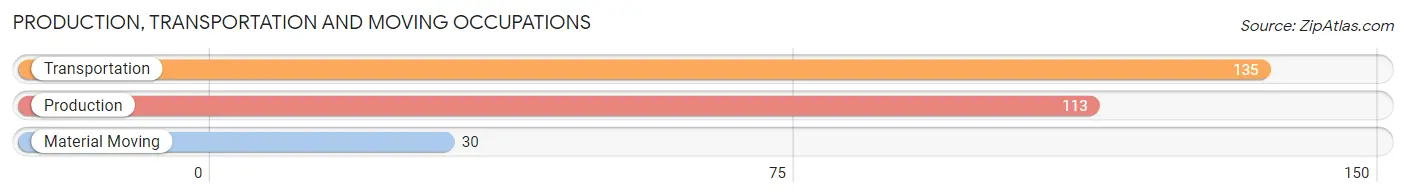
Production, Transportation and Moving Occupations
The most common Production, Transportation and Moving occupations in Wauna are Transportation (135 | 5.9%), Production (113 | 5.0%), and Material Moving (30 | 1.3%).
Production, Transportation and Moving Occupations by Sex
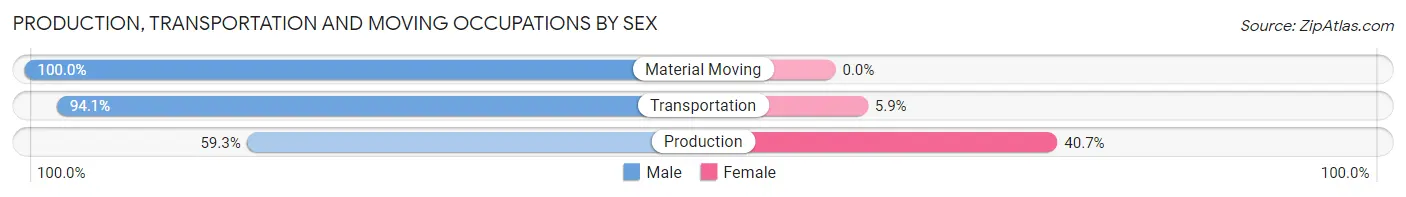
| Occupation | Male | Female |
| Production | 67 (59.3%) | 46 (40.7%) |
| Transportation | 127 (94.1%) | 8 (5.9%) |
| Material Moving | 30 (100.0%) | 0 (0.0%) |
| Total (Category) | 224 (80.6%) | 54 (19.4%) |
| Total (Overall) | 1,152 (50.5%) | 1,128 (49.5%) |
Employment Industries by Sex in Wauna
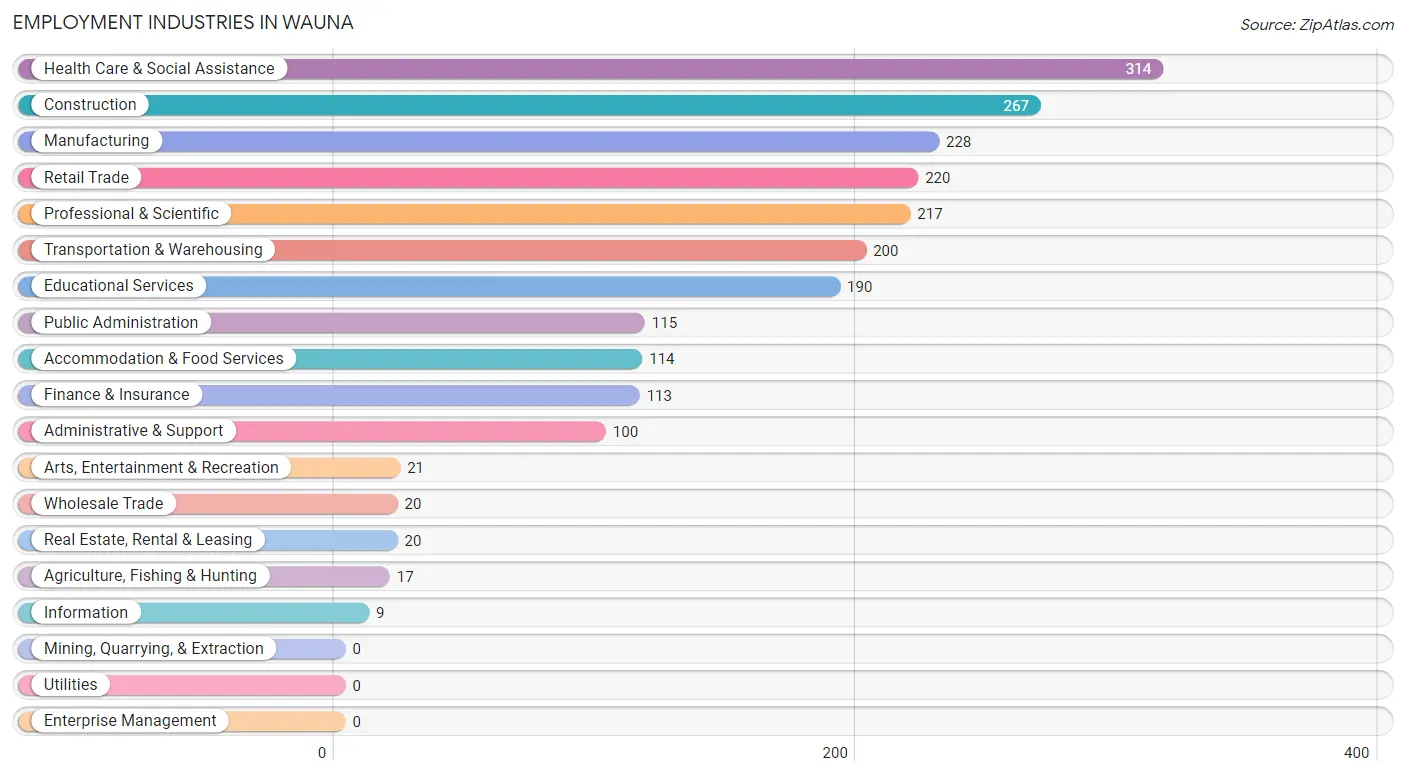
Employment Industries in Wauna
The major employment industries in Wauna include Health Care & Social Assistance (314 | 13.8%), Construction (267 | 11.7%), Manufacturing (228 | 10.0%), Retail Trade (220 | 9.7%), and Professional & Scientific (217 | 9.5%).
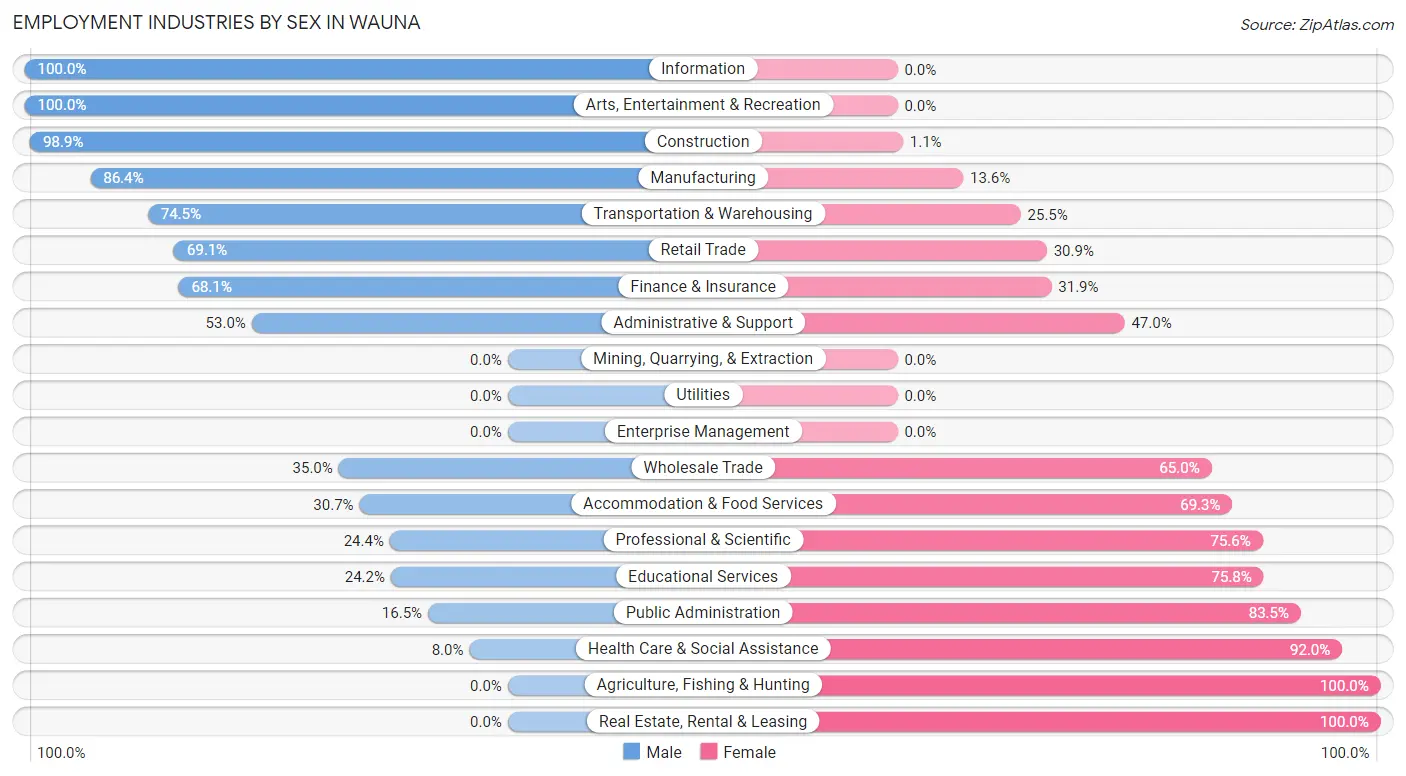
Employment Industries by Sex in Wauna
The Wauna industries that see more men than women are Information (100.0%), Arts, Entertainment & Recreation (100.0%), and Construction (98.9%), whereas the industries that tend to have a higher number of women are Agriculture, Fishing & Hunting (100.0%), Real Estate, Rental & Leasing (100.0%), and Health Care & Social Assistance (92.0%).
| Industry | Male | Female |
| Agriculture, Fishing & Hunting | 0 (0.0%) | 17 (100.0%) |
| Mining, Quarrying, & Extraction | 0 (0.0%) | 0 (0.0%) |
| Construction | 264 (98.9%) | 3 (1.1%) |
| Manufacturing | 197 (86.4%) | 31 (13.6%) |
| Wholesale Trade | 7 (35.0%) | 13 (65.0%) |
| Retail Trade | 152 (69.1%) | 68 (30.9%) |
| Transportation & Warehousing | 149 (74.5%) | 51 (25.5%) |
| Utilities | 0 (0.0%) | 0 (0.0%) |
| Information | 9 (100.0%) | 0 (0.0%) |
| Finance & Insurance | 77 (68.1%) | 36 (31.9%) |
| Real Estate, Rental & Leasing | 0 (0.0%) | 20 (100.0%) |
| Professional & Scientific | 53 (24.4%) | 164 (75.6%) |
| Enterprise Management | 0 (0.0%) | 0 (0.0%) |
| Administrative & Support | 53 (53.0%) | 47 (47.0%) |
| Educational Services | 46 (24.2%) | 144 (75.8%) |
| Health Care & Social Assistance | 25 (8.0%) | 289 (92.0%) |
| Arts, Entertainment & Recreation | 21 (100.0%) | 0 (0.0%) |
| Accommodation & Food Services | 35 (30.7%) | 79 (69.3%) |
| Public Administration | 19 (16.5%) | 96 (83.5%) |
| Total | 1,152 (50.5%) | 1,128 (49.5%) |
Education in Wauna
School Enrollment in Wauna
The most common levels of schooling among the 978 students in Wauna are high school (282 | 28.8%), college / undergraduate (258 | 26.4%), and middle school (174 | 17.8%).
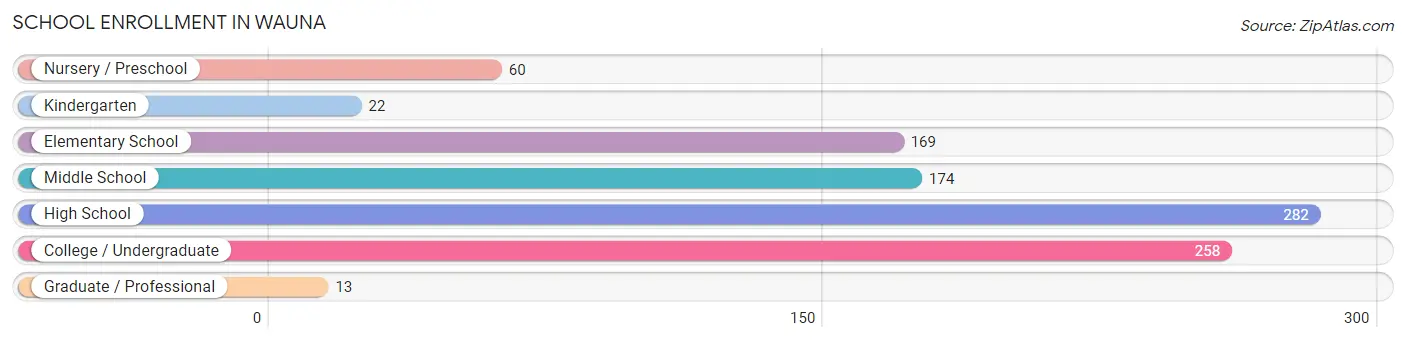
| School Level | # Students | % Students |
| Nursery / Preschool | 60 | 6.1% |
| Kindergarten | 22 | 2.2% |
| Elementary School | 169 | 17.3% |
| Middle School | 174 | 17.8% |
| High School | 282 | 28.8% |
| College / Undergraduate | 258 | 26.4% |
| Graduate / Professional | 13 | 1.3% |
| Total | 978 | 100.0% |
School Enrollment by Age by Funding Source in Wauna
Out of a total of 978 students who are enrolled in schools in Wauna, 337 (34.5%) attend a private institution, while the remaining 641 (65.5%) are enrolled in public schools. The age group of 35 years and over has the highest likelihood of being enrolled in private schools, with 113 (89.0% in the age bracket) enrolled. Conversely, the age group of 25 to 34 year olds has the lowest likelihood of being enrolled in a private school, with 61 (88.4% in the age bracket) attending a public institution.
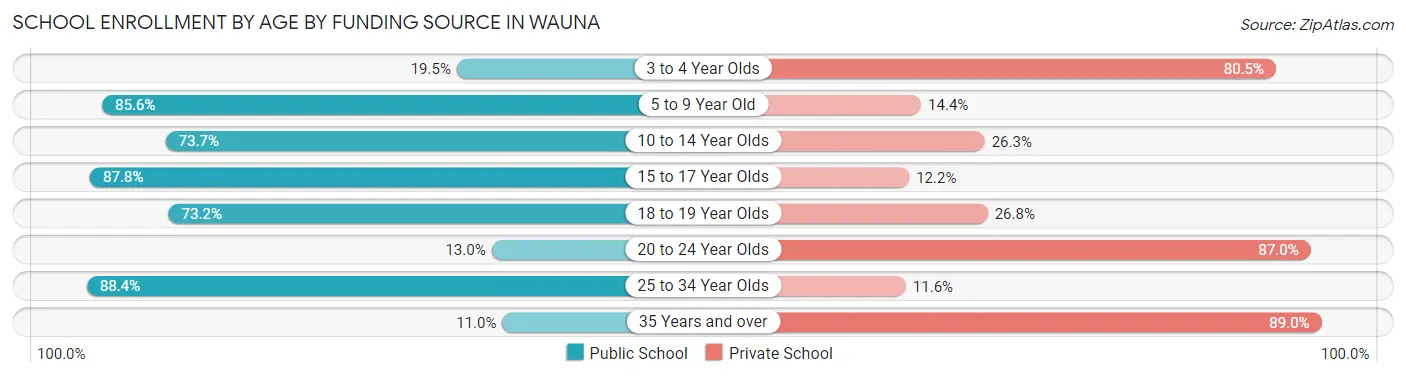
| Age Bracket | Public School | Private School |
| 3 to 4 Year Olds | 8 (19.5%) | 33 (80.5%) |
| 5 to 9 Year Old | 172 (85.6%) | 29 (14.4%) |
| 10 to 14 Year Olds | 160 (73.7%) | 57 (26.3%) |
| 15 to 17 Year Olds | 187 (87.8%) | 26 (12.2%) |
| 18 to 19 Year Olds | 30 (73.2%) | 11 (26.8%) |
| 20 to 24 Year Olds | 9 (13.0%) | 60 (87.0%) |
| 25 to 34 Year Olds | 61 (88.4%) | 8 (11.6%) |
| 35 Years and over | 14 (11.0%) | 113 (89.0%) |
| Total | 641 (65.5%) | 337 (34.5%) |
Educational Attainment by Field of Study in Wauna
Science & technology (244 | 20.4%), education (172 | 14.4%), business (137 | 11.5%), social sciences (129 | 10.8%), and liberal arts & history (110 | 9.2%) are the most common fields of study among 1,193 individuals in Wauna who have obtained a bachelor's degree or higher.
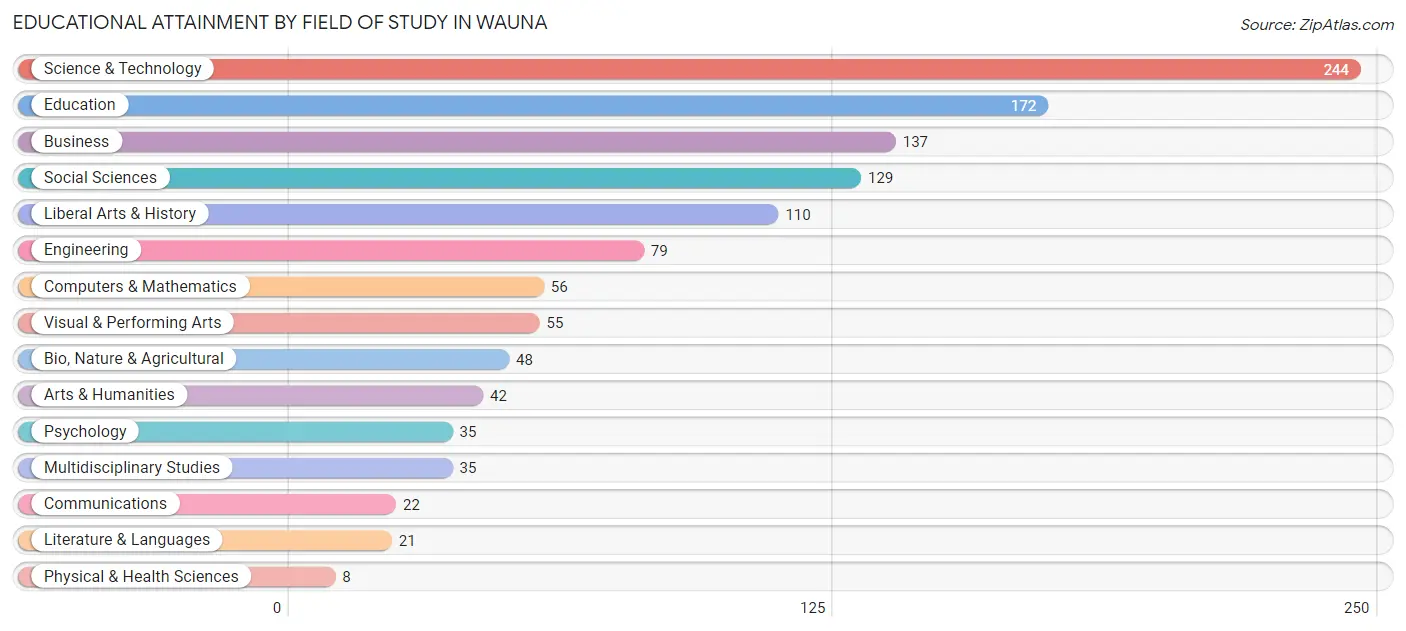
| Field of Study | # Graduates | % Graduates |
| Computers & Mathematics | 56 | 4.7% |
| Bio, Nature & Agricultural | 48 | 4.0% |
| Physical & Health Sciences | 8 | 0.7% |
| Psychology | 35 | 2.9% |
| Social Sciences | 129 | 10.8% |
| Engineering | 79 | 6.6% |
| Multidisciplinary Studies | 35 | 2.9% |
| Science & Technology | 244 | 20.4% |
| Business | 137 | 11.5% |
| Education | 172 | 14.4% |
| Literature & Languages | 21 | 1.8% |
| Liberal Arts & History | 110 | 9.2% |
| Visual & Performing Arts | 55 | 4.6% |
| Communications | 22 | 1.8% |
| Arts & Humanities | 42 | 3.5% |
| Total | 1,193 | 100.0% |
Transportation & Commute in Wauna
Vehicle Availability by Sex in Wauna
The most prevalent vehicle ownership categories in Wauna are males with 2 vehicles (387, accounting for 34.6%) and females with 2 vehicles (424, making up 34.7%).
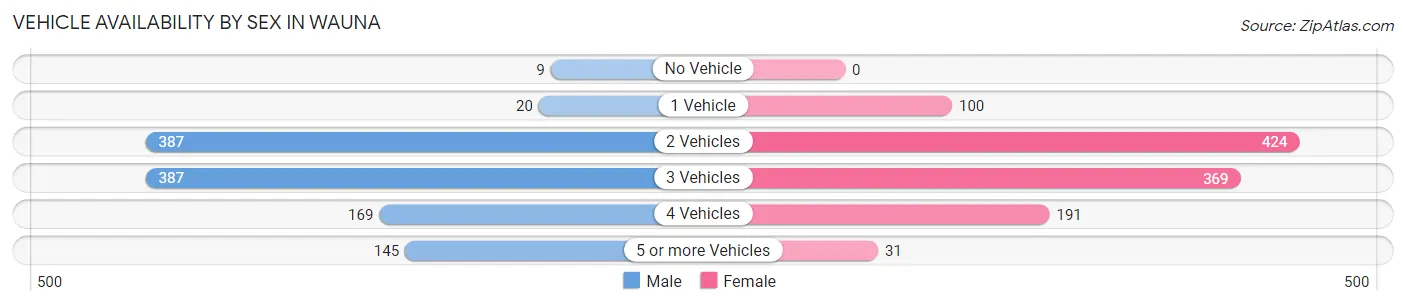
| Vehicles Available | Male | Female |
| No Vehicle | 9 (0.8%) | 0 (0.0%) |
| 1 Vehicle | 20 (1.8%) | 100 (9.0%) |
| 2 Vehicles | 387 (34.6%) | 424 (38.0%) |
| 3 Vehicles | 387 (34.6%) | 369 (33.1%) |
| 4 Vehicles | 169 (15.1%) | 191 (17.1%) |
| 5 or more Vehicles | 145 (13.0%) | 31 (2.8%) |
| Total | 1,117 (100.0%) | 1,115 (100.0%) |
Commute Time in Wauna
The most frequently occuring commute durations in Wauna are 30 to 34 minutes (379 commuters, 19.5%), 60 to 89 minutes (322 commuters, 16.6%), and 20 to 24 minutes (232 commuters, 11.9%).
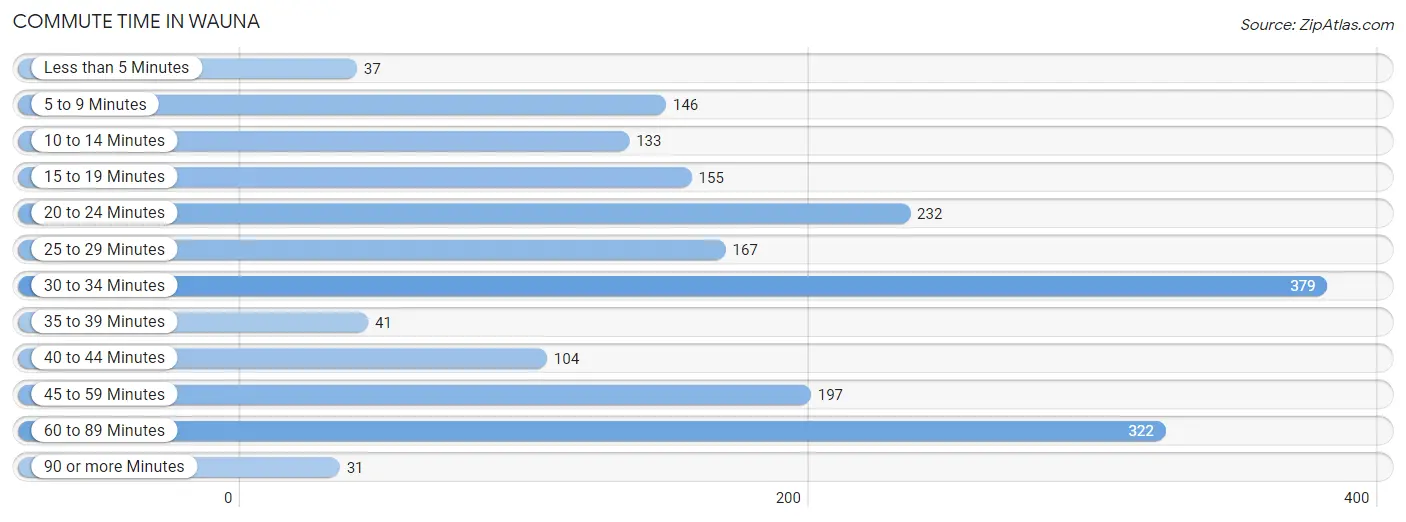
| Commute Time | # Commuters | % Commuters |
| Less than 5 Minutes | 37 | 1.9% |
| 5 to 9 Minutes | 146 | 7.5% |
| 10 to 14 Minutes | 133 | 6.8% |
| 15 to 19 Minutes | 155 | 8.0% |
| 20 to 24 Minutes | 232 | 11.9% |
| 25 to 29 Minutes | 167 | 8.6% |
| 30 to 34 Minutes | 379 | 19.5% |
| 35 to 39 Minutes | 41 | 2.1% |
| 40 to 44 Minutes | 104 | 5.3% |
| 45 to 59 Minutes | 197 | 10.1% |
| 60 to 89 Minutes | 322 | 16.6% |
| 90 or more Minutes | 31 | 1.6% |
Commute Time by Sex in Wauna
The most common commute times in Wauna are 60 to 89 minutes (278 commuters, 26.9%) for males and 30 to 34 minutes (192 commuters, 21.1%) for females.
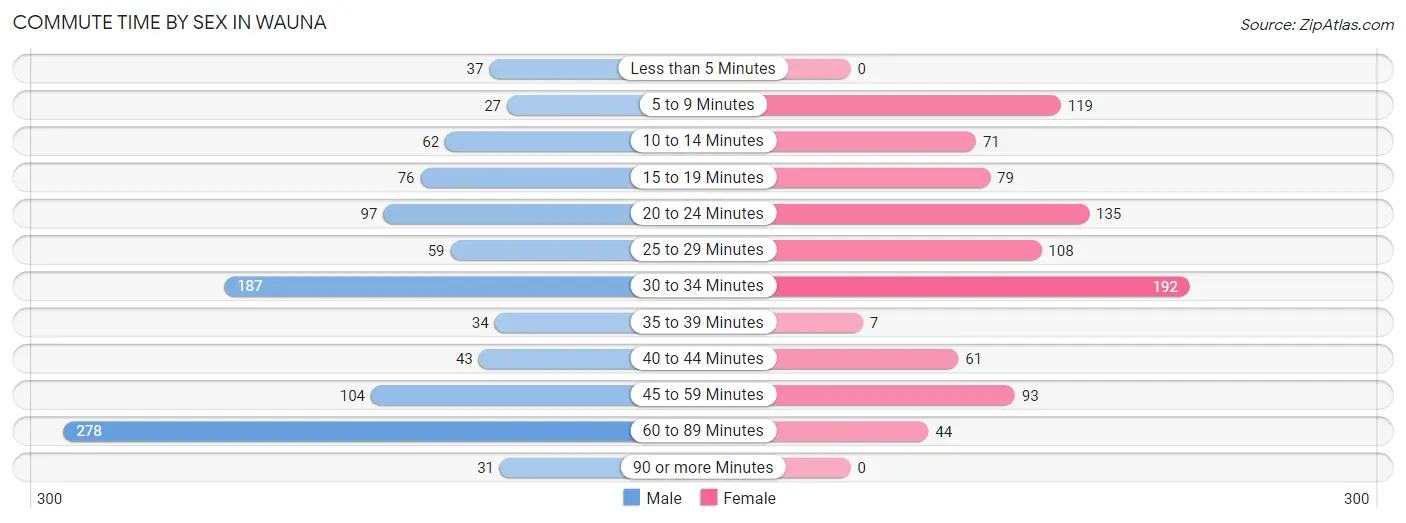
| Commute Time | Male | Female |
| Less than 5 Minutes | 37 (3.6%) | 0 (0.0%) |
| 5 to 9 Minutes | 27 (2.6%) | 119 (13.1%) |
| 10 to 14 Minutes | 62 (6.0%) | 71 (7.8%) |
| 15 to 19 Minutes | 76 (7.3%) | 79 (8.7%) |
| 20 to 24 Minutes | 97 (9.4%) | 135 (14.8%) |
| 25 to 29 Minutes | 59 (5.7%) | 108 (11.9%) |
| 30 to 34 Minutes | 187 (18.1%) | 192 (21.1%) |
| 35 to 39 Minutes | 34 (3.3%) | 7 (0.8%) |
| 40 to 44 Minutes | 43 (4.2%) | 61 (6.7%) |
| 45 to 59 Minutes | 104 (10.1%) | 93 (10.2%) |
| 60 to 89 Minutes | 278 (26.9%) | 44 (4.8%) |
| 90 or more Minutes | 31 (3.0%) | 0 (0.0%) |
Time of Departure to Work by Sex in Wauna
The most frequent times of departure to work in Wauna are 12:00 AM to 4:59 AM (221, 21.3%) for males and 7:00 AM to 7:29 AM (151, 16.6%) for females.
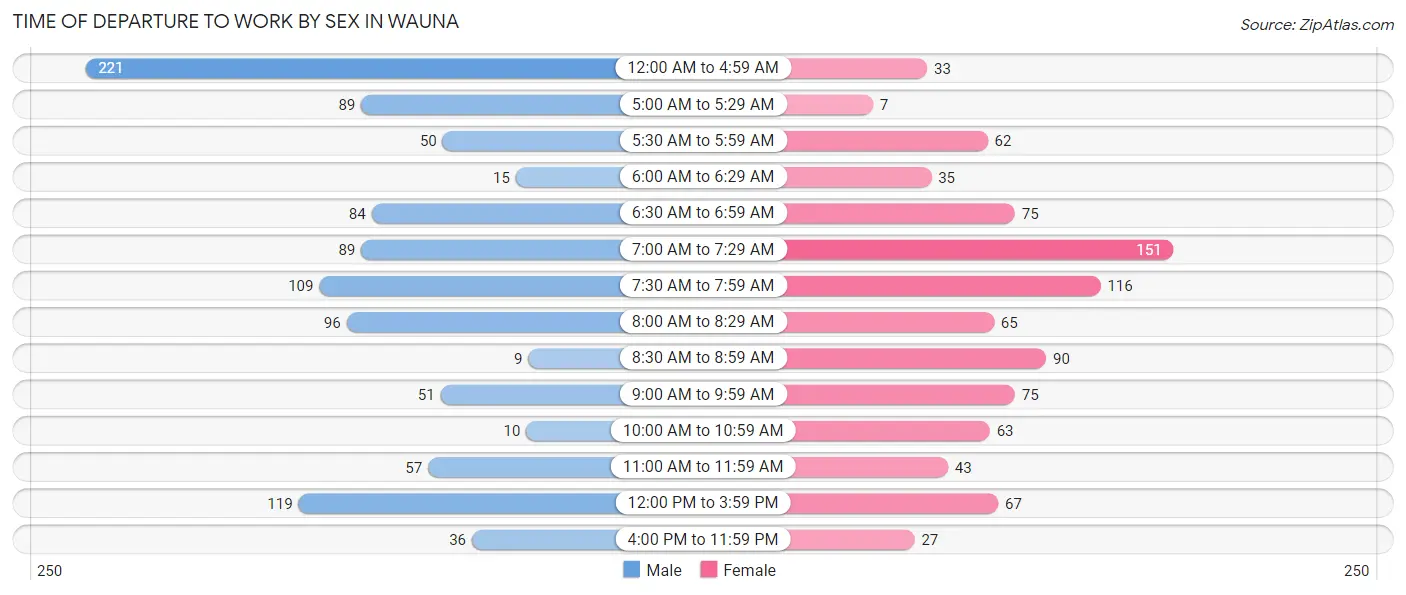
| Time of Departure | Male | Female |
| 12:00 AM to 4:59 AM | 221 (21.3%) | 33 (3.6%) |
| 5:00 AM to 5:29 AM | 89 (8.6%) | 7 (0.8%) |
| 5:30 AM to 5:59 AM | 50 (4.8%) | 62 (6.8%) |
| 6:00 AM to 6:29 AM | 15 (1.5%) | 35 (3.8%) |
| 6:30 AM to 6:59 AM | 84 (8.1%) | 75 (8.3%) |
| 7:00 AM to 7:29 AM | 89 (8.6%) | 151 (16.6%) |
| 7:30 AM to 7:59 AM | 109 (10.5%) | 116 (12.8%) |
| 8:00 AM to 8:29 AM | 96 (9.3%) | 65 (7.1%) |
| 8:30 AM to 8:59 AM | 9 (0.9%) | 90 (9.9%) |
| 9:00 AM to 9:59 AM | 51 (4.9%) | 75 (8.3%) |
| 10:00 AM to 10:59 AM | 10 (1.0%) | 63 (6.9%) |
| 11:00 AM to 11:59 AM | 57 (5.5%) | 43 (4.7%) |
| 12:00 PM to 3:59 PM | 119 (11.5%) | 67 (7.4%) |
| 4:00 PM to 11:59 PM | 36 (3.5%) | 27 (3.0%) |
| Total | 1,035 (100.0%) | 909 (100.0%) |
Housing Occupancy in Wauna
Occupancy by Ownership in Wauna
Of the total 1,837 dwellings in Wauna, owner-occupied units account for 1,657 (90.2%), while renter-occupied units make up 180 (9.8%).
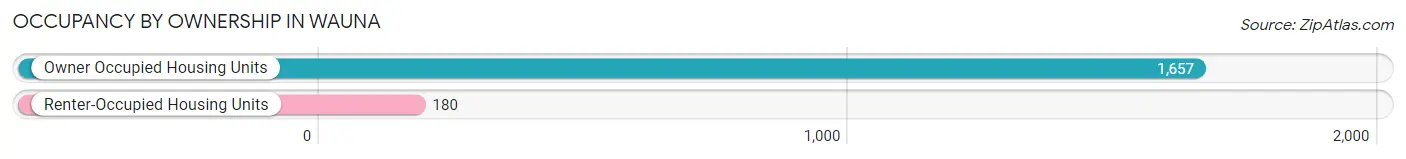
| Occupancy | # Housing Units | % Housing Units |
| Owner Occupied Housing Units | 1,657 | 90.2% |
| Renter-Occupied Housing Units | 180 | 9.8% |
| Total Occupied Housing Units | 1,837 | 100.0% |
Occupancy by Household Size in Wauna
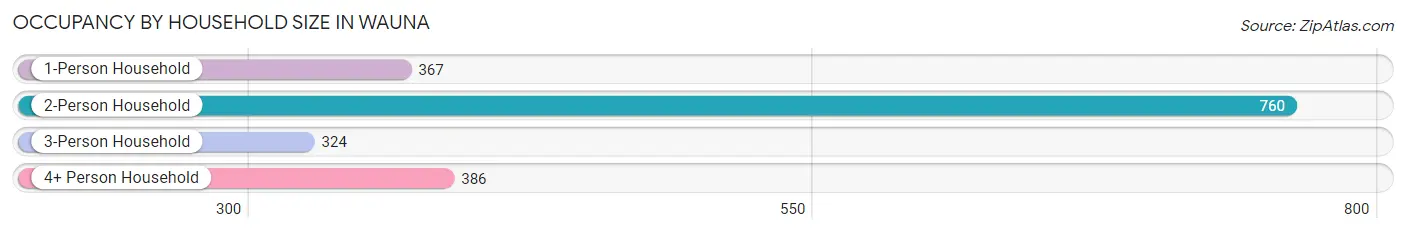
| Household Size | # Housing Units | % Housing Units |
| 1-Person Household | 367 | 20.0% |
| 2-Person Household | 760 | 41.4% |
| 3-Person Household | 324 | 17.6% |
| 4+ Person Household | 386 | 21.0% |
| Total Housing Units | 1,837 | 100.0% |
Occupancy by Ownership by Household Size in Wauna
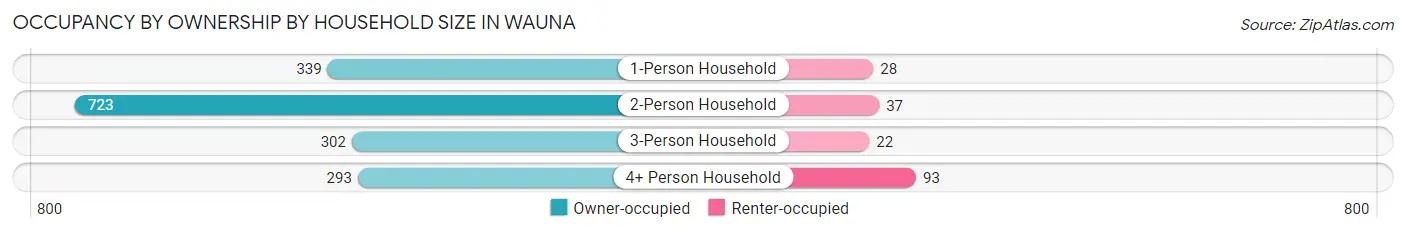
| Household Size | Owner-occupied | Renter-occupied |
| 1-Person Household | 339 (92.4%) | 28 (7.6%) |
| 2-Person Household | 723 (95.1%) | 37 (4.9%) |
| 3-Person Household | 302 (93.2%) | 22 (6.8%) |
| 4+ Person Household | 293 (75.9%) | 93 (24.1%) |
| Total Housing Units | 1,657 (90.2%) | 180 (9.8%) |
Occupancy by Educational Attainment in Wauna
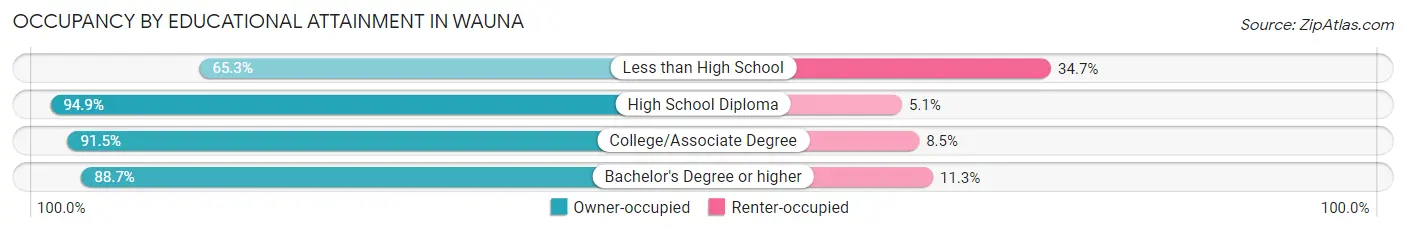
| Household Size | Owner-occupied | Renter-occupied |
| Less than High School | 32 (65.3%) | 17 (34.7%) |
| High School Diploma | 240 (94.9%) | 13 (5.1%) |
| College/Associate Degree | 771 (91.5%) | 72 (8.5%) |
| Bachelor's Degree or higher | 614 (88.7%) | 78 (11.3%) |
Occupancy by Age of Householder in Wauna
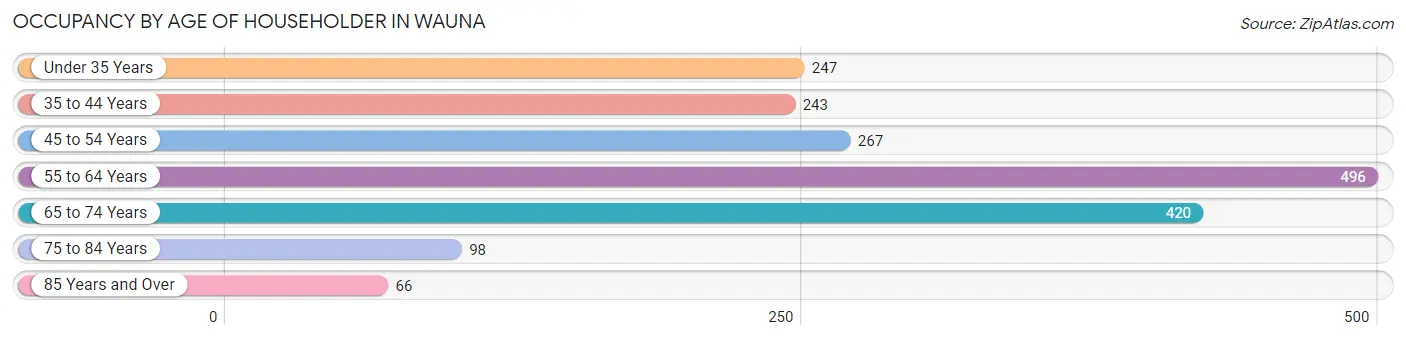
| Age Bracket | # Households | % Households |
| Under 35 Years | 247 | 13.5% |
| 35 to 44 Years | 243 | 13.2% |
| 45 to 54 Years | 267 | 14.5% |
| 55 to 64 Years | 496 | 27.0% |
| 65 to 74 Years | 420 | 22.9% |
| 75 to 84 Years | 98 | 5.3% |
| 85 Years and Over | 66 | 3.6% |
| Total | 1,837 | 100.0% |
Housing Finances in Wauna
Median Income by Occupancy in Wauna
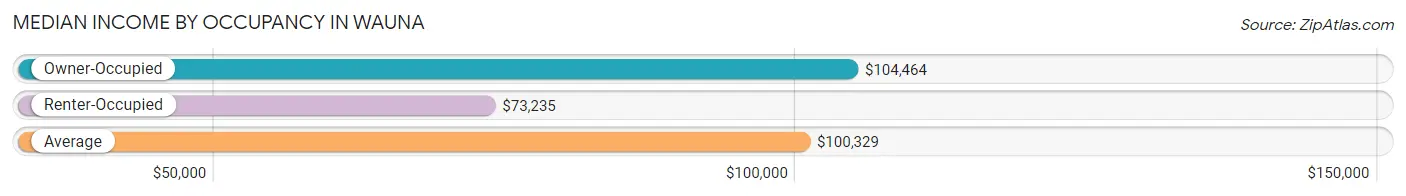
| Occupancy Type | # Households | Median Income |
| Owner-Occupied | 1,657 (90.2%) | $104,464 |
| Renter-Occupied | 180 (9.8%) | $73,235 |
| Average | 1,837 (100.0%) | $100,329 |
Occupancy by Householder Income Bracket in Wauna
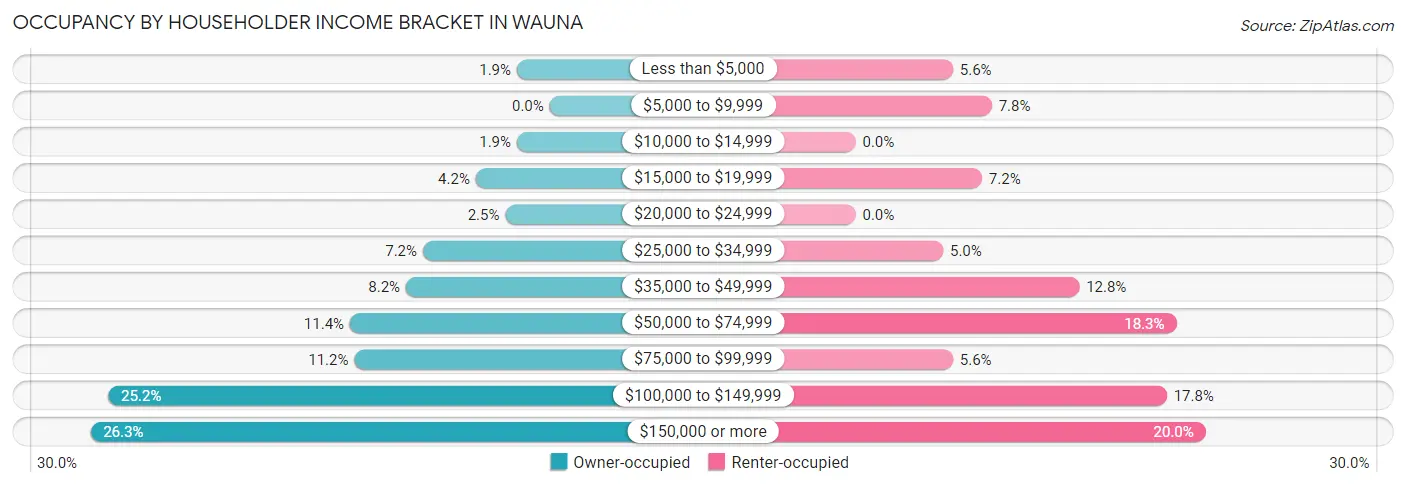
| Income Bracket | Owner-occupied | Renter-occupied |
| Less than $5,000 | 31 (1.9%) | 10 (5.6%) |
| $5,000 to $9,999 | 0 (0.0%) | 14 (7.8%) |
| $10,000 to $14,999 | 31 (1.9%) | 0 (0.0%) |
| $15,000 to $19,999 | 70 (4.2%) | 13 (7.2%) |
| $20,000 to $24,999 | 42 (2.5%) | 0 (0.0%) |
| $25,000 to $34,999 | 120 (7.2%) | 9 (5.0%) |
| $35,000 to $49,999 | 136 (8.2%) | 23 (12.8%) |
| $50,000 to $74,999 | 189 (11.4%) | 33 (18.3%) |
| $75,000 to $99,999 | 185 (11.2%) | 10 (5.6%) |
| $100,000 to $149,999 | 418 (25.2%) | 32 (17.8%) |
| $150,000 or more | 435 (26.3%) | 36 (20.0%) |
| Total | 1,657 (100.0%) | 180 (100.0%) |
Monthly Housing Cost Tiers in Wauna
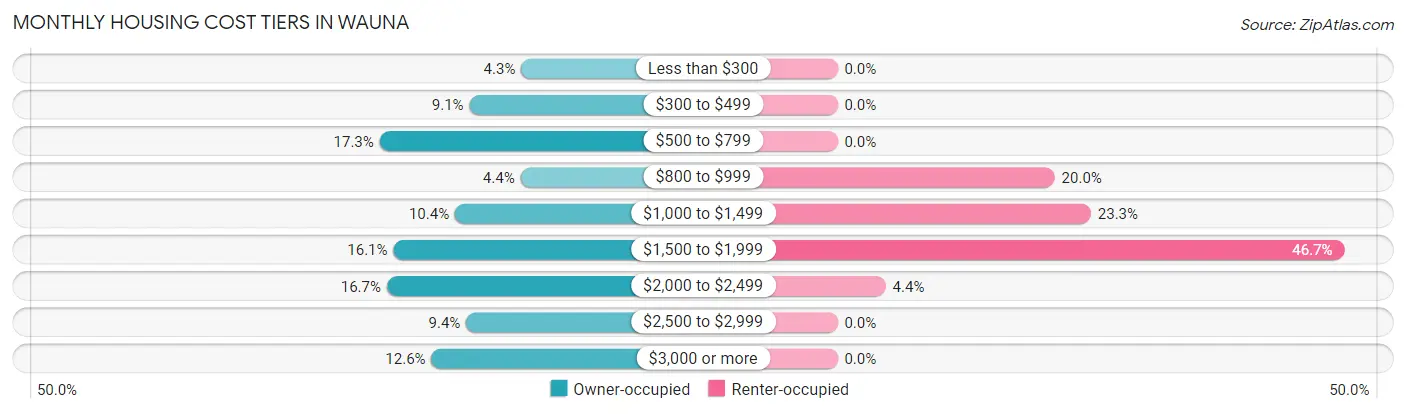
| Monthly Cost | Owner-occupied | Renter-occupied |
| Less than $300 | 71 (4.3%) | 0 (0.0%) |
| $300 to $499 | 150 (9.0%) | 0 (0.0%) |
| $500 to $799 | 287 (17.3%) | 0 (0.0%) |
| $800 to $999 | 72 (4.3%) | 36 (20.0%) |
| $1,000 to $1,499 | 172 (10.4%) | 42 (23.3%) |
| $1,500 to $1,999 | 266 (16.1%) | 84 (46.7%) |
| $2,000 to $2,499 | 276 (16.7%) | 8 (4.4%) |
| $2,500 to $2,999 | 155 (9.3%) | 0 (0.0%) |
| $3,000 or more | 208 (12.6%) | 0 (0.0%) |
| Total | 1,657 (100.0%) | 180 (100.0%) |
Physical Housing Characteristics in Wauna
Housing Structures in Wauna
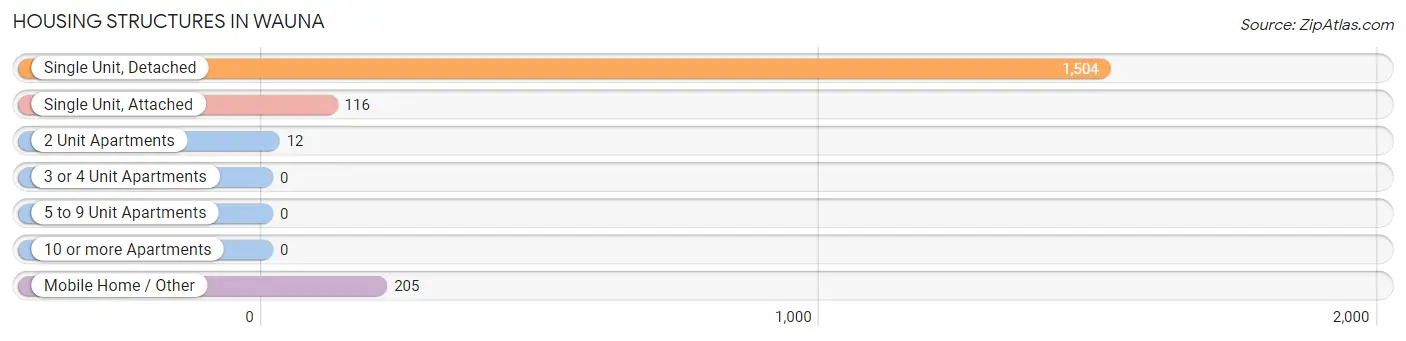
| Structure Type | # Housing Units | % Housing Units |
| Single Unit, Detached | 1,504 | 81.9% |
| Single Unit, Attached | 116 | 6.3% |
| 2 Unit Apartments | 12 | 0.6% |
| 3 or 4 Unit Apartments | 0 | 0.0% |
| 5 to 9 Unit Apartments | 0 | 0.0% |
| 10 or more Apartments | 0 | 0.0% |
| Mobile Home / Other | 205 | 11.2% |
| Total | 1,837 | 100.0% |
Housing Structures by Occupancy in Wauna
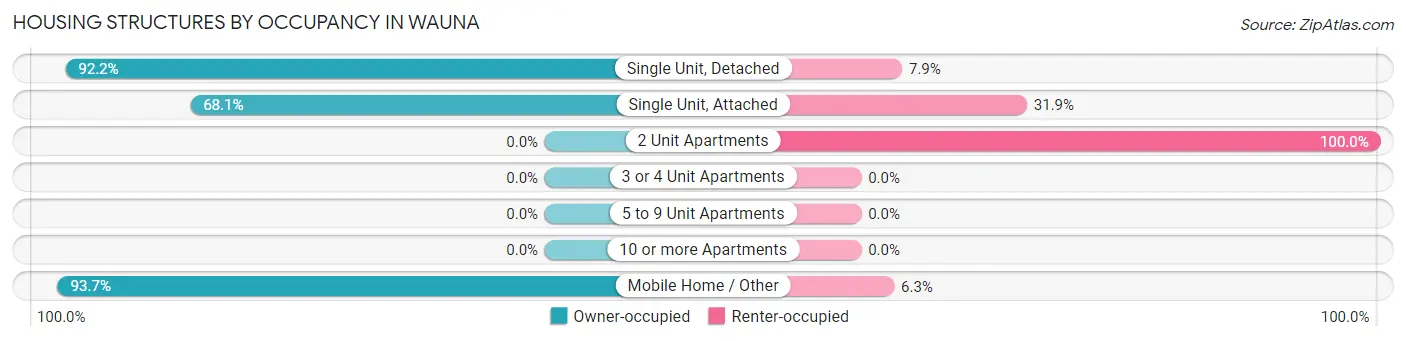
| Structure Type | Owner-occupied | Renter-occupied |
| Single Unit, Detached | 1,386 (92.1%) | 118 (7.9%) |
| Single Unit, Attached | 79 (68.1%) | 37 (31.9%) |
| 2 Unit Apartments | 0 (0.0%) | 12 (100.0%) |
| 3 or 4 Unit Apartments | 0 (0.0%) | 0 (0.0%) |
| 5 to 9 Unit Apartments | 0 (0.0%) | 0 (0.0%) |
| 10 or more Apartments | 0 (0.0%) | 0 (0.0%) |
| Mobile Home / Other | 192 (93.7%) | 13 (6.3%) |
| Total | 1,657 (90.2%) | 180 (9.8%) |
Housing Structures by Number of Rooms in Wauna
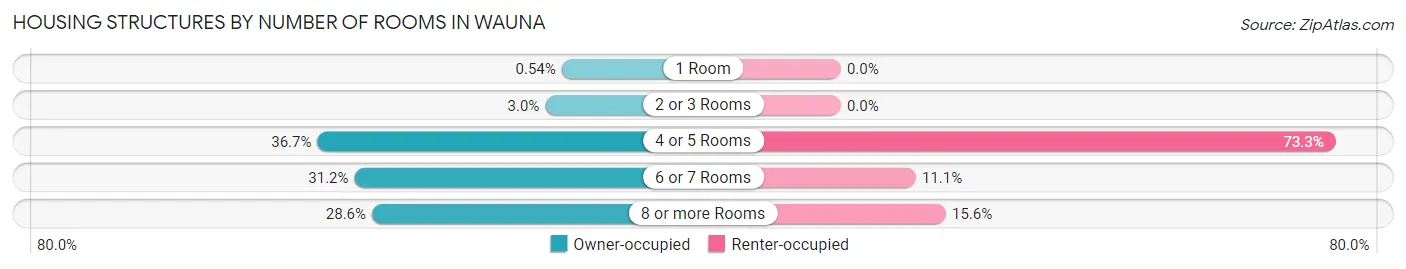
| Number of Rooms | Owner-occupied | Renter-occupied |
| 1 Room | 9 (0.5%) | 0 (0.0%) |
| 2 or 3 Rooms | 49 (3.0%) | 0 (0.0%) |
| 4 or 5 Rooms | 608 (36.7%) | 132 (73.3%) |
| 6 or 7 Rooms | 517 (31.2%) | 20 (11.1%) |
| 8 or more Rooms | 474 (28.6%) | 28 (15.6%) |
| Total | 1,657 (100.0%) | 180 (100.0%) |
Housing Structure by Heating Type in Wauna
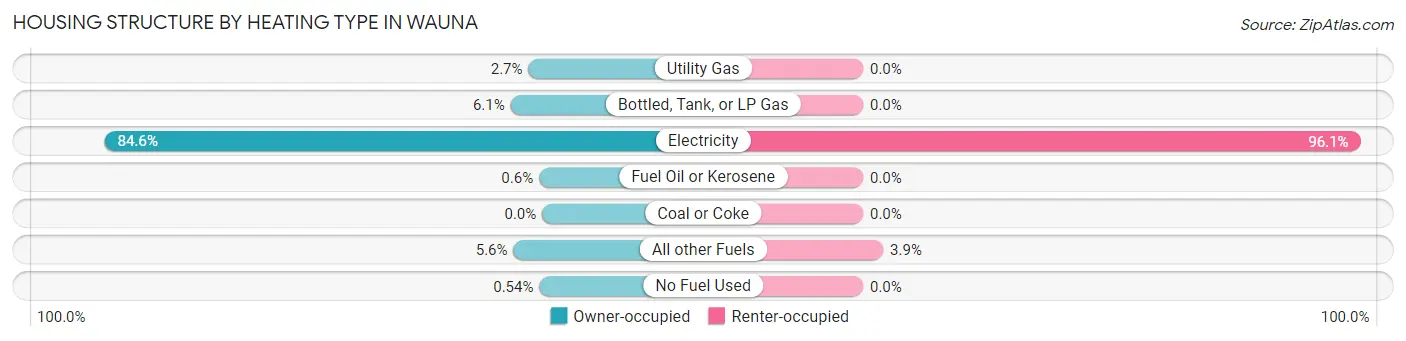
| Heating Type | Owner-occupied | Renter-occupied |
| Utility Gas | 44 (2.7%) | 0 (0.0%) |
| Bottled, Tank, or LP Gas | 101 (6.1%) | 0 (0.0%) |
| Electricity | 1,401 (84.6%) | 173 (96.1%) |
| Fuel Oil or Kerosene | 10 (0.6%) | 0 (0.0%) |
| Coal or Coke | 0 (0.0%) | 0 (0.0%) |
| All other Fuels | 92 (5.6%) | 7 (3.9%) |
| No Fuel Used | 9 (0.5%) | 0 (0.0%) |
| Total | 1,657 (100.0%) | 180 (100.0%) |
Household Vehicle Usage in Wauna
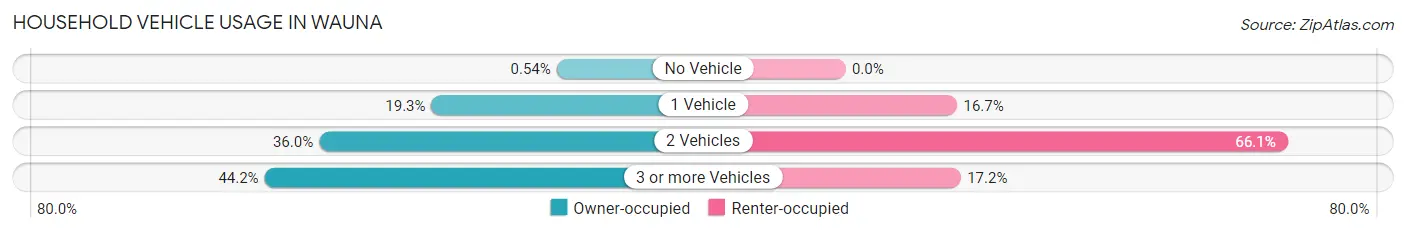
| Vehicles per Household | Owner-occupied | Renter-occupied |
| No Vehicle | 9 (0.5%) | 0 (0.0%) |
| 1 Vehicle | 319 (19.3%) | 30 (16.7%) |
| 2 Vehicles | 597 (36.0%) | 119 (66.1%) |
| 3 or more Vehicles | 732 (44.2%) | 31 (17.2%) |
| Total | 1,657 (100.0%) | 180 (100.0%) |
Real Estate & Mortgages in Wauna
Real Estate and Mortgage Overview in Wauna
| Characteristic | Without Mortgage | With Mortgage |
| Housing Units | 568 | 1,089 |
| Median Property Value | $313,700 | $431,400 |
| Median Household Income | $69,250 | $391 |
| Monthly Housing Costs | $580 | $208 |
| Real Estate Taxes | $3,371 | $5 |
Property Value by Mortgage Status in Wauna
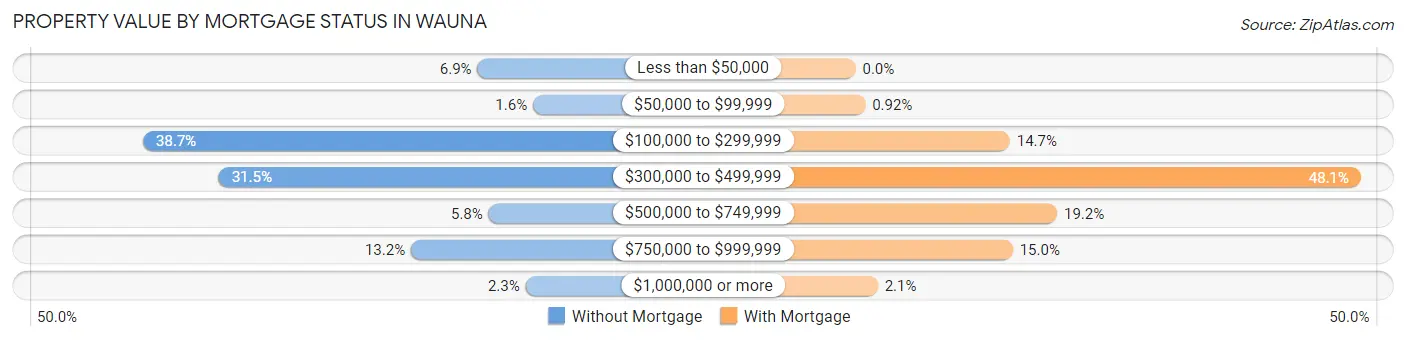
| Property Value | Without Mortgage | With Mortgage |
| Less than $50,000 | 39 (6.9%) | 0 (0.0%) |
| $50,000 to $99,999 | 9 (1.6%) | 10 (0.9%) |
| $100,000 to $299,999 | 220 (38.7%) | 160 (14.7%) |
| $300,000 to $499,999 | 179 (31.5%) | 524 (48.1%) |
| $500,000 to $749,999 | 33 (5.8%) | 209 (19.2%) |
| $750,000 to $999,999 | 75 (13.2%) | 163 (15.0%) |
| $1,000,000 or more | 13 (2.3%) | 23 (2.1%) |
| Total | 568 (100.0%) | 1,089 (100.0%) |
Household Income by Mortgage Status in Wauna
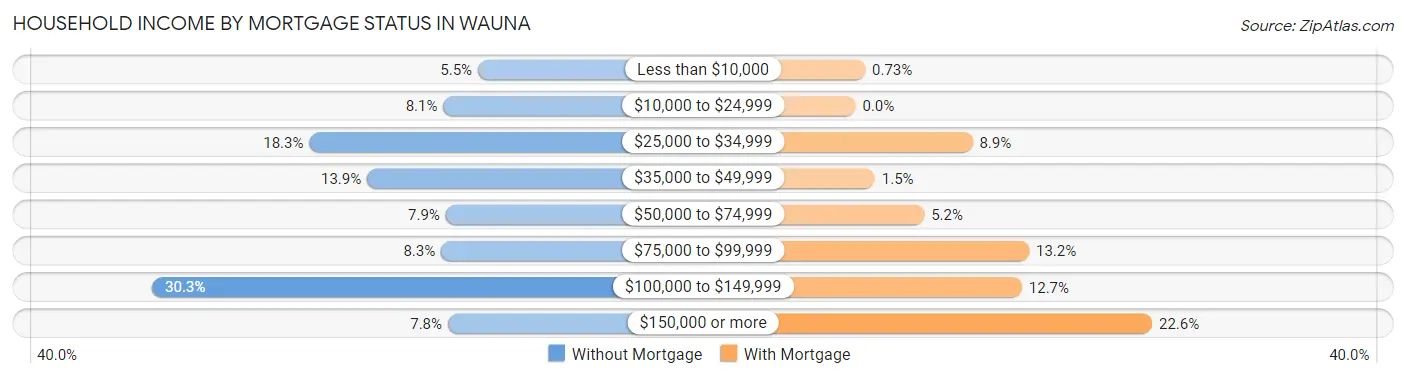
| Household Income | Without Mortgage | With Mortgage |
| Less than $10,000 | 31 (5.5%) | 8 (0.7%) |
| $10,000 to $24,999 | 46 (8.1%) | 0 (0.0%) |
| $25,000 to $34,999 | 104 (18.3%) | 97 (8.9%) |
| $35,000 to $49,999 | 79 (13.9%) | 16 (1.5%) |
| $50,000 to $74,999 | 45 (7.9%) | 57 (5.2%) |
| $75,000 to $99,999 | 47 (8.3%) | 144 (13.2%) |
| $100,000 to $149,999 | 172 (30.3%) | 138 (12.7%) |
| $150,000 or more | 44 (7.7%) | 246 (22.6%) |
| Total | 568 (100.0%) | 1,089 (100.0%) |
Property Value to Household Income Ratio in Wauna
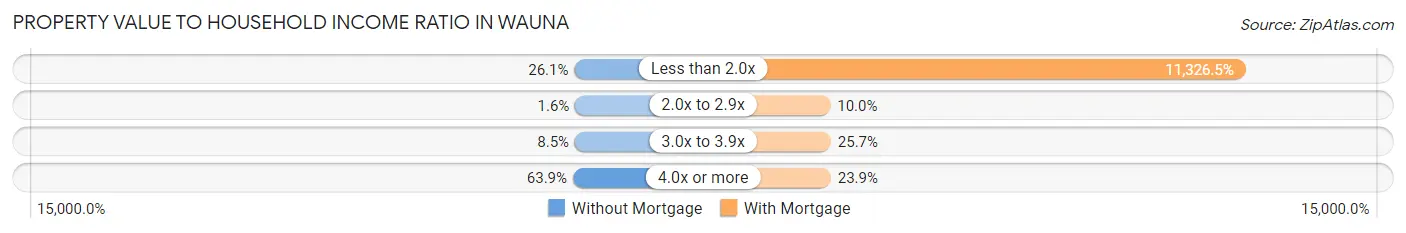
| Value-to-Income Ratio | Without Mortgage | With Mortgage |
| Less than 2.0x | 148 (26.1%) | 123,345 (11,326.4%) |
| 2.0x to 2.9x | 9 (1.6%) | 109 (10.0%) |
| 3.0x to 3.9x | 48 (8.5%) | 280 (25.7%) |
| 4.0x or more | 363 (63.9%) | 260 (23.9%) |
| Total | 568 (100.0%) | 1,089 (100.0%) |
Real Estate Taxes by Mortgage Status in Wauna
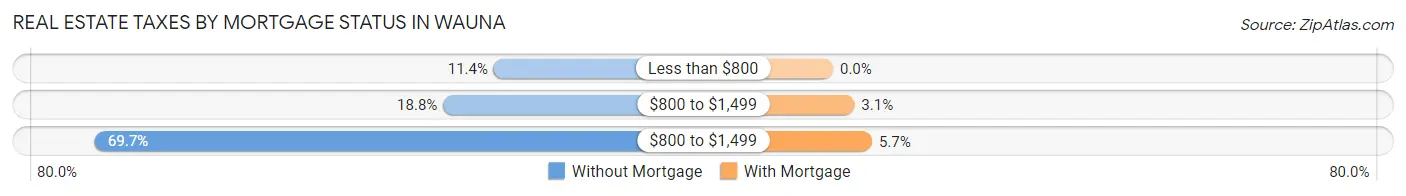
| Property Taxes | Without Mortgage | With Mortgage |
| Less than $800 | 65 (11.4%) | 0 (0.0%) |
| $800 to $1,499 | 107 (18.8%) | 34 (3.1%) |
| $800 to $1,499 | 396 (69.7%) | 62 (5.7%) |
| Total | 568 (100.0%) | 1,089 (100.0%) |
Health & Disability in Wauna
Health Insurance Coverage by Age in Wauna
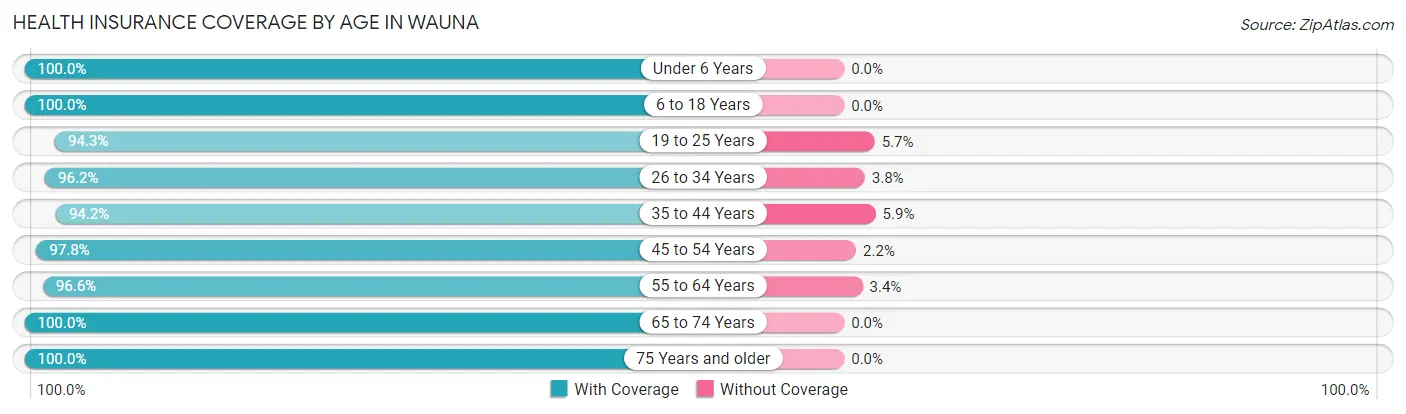
| Age Bracket | With Coverage | Without Coverage |
| Under 6 Years | 325 (100.0%) | 0 (0.0%) |
| 6 to 18 Years | 718 (100.0%) | 0 (0.0%) |
| 19 to 25 Years | 166 (94.3%) | 10 (5.7%) |
| 26 to 34 Years | 527 (96.2%) | 21 (3.8%) |
| 35 to 44 Years | 515 (94.2%) | 32 (5.9%) |
| 45 to 54 Years | 531 (97.8%) | 12 (2.2%) |
| 55 to 64 Years | 705 (96.6%) | 25 (3.4%) |
| 65 to 74 Years | 786 (100.0%) | 0 (0.0%) |
| 75 Years and older | 308 (100.0%) | 0 (0.0%) |
| Total | 4,581 (97.9%) | 100 (2.1%) |
Health Insurance Coverage by Citizenship Status in Wauna
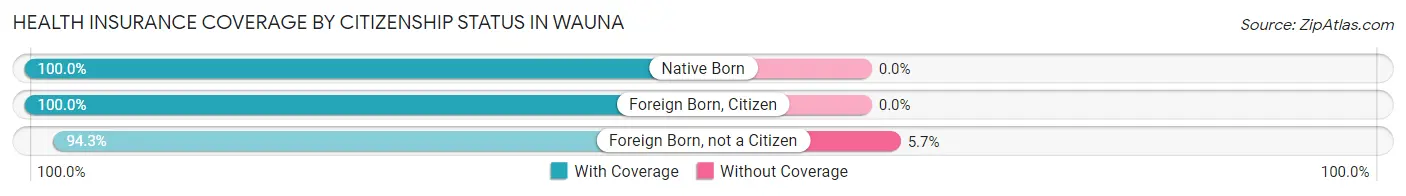
| Citizenship Status | With Coverage | Without Coverage |
| Native Born | 325 (100.0%) | 0 (0.0%) |
| Foreign Born, Citizen | 718 (100.0%) | 0 (0.0%) |
| Foreign Born, not a Citizen | 166 (94.3%) | 10 (5.7%) |
Health Insurance Coverage by Household Income in Wauna
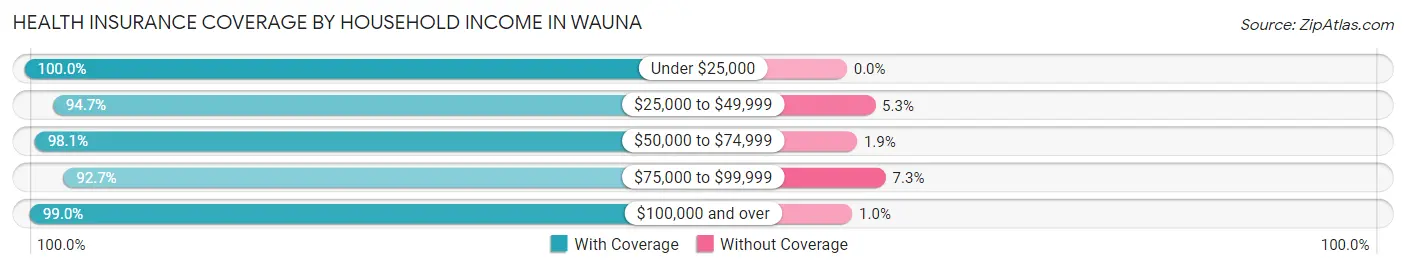
| Household Income | With Coverage | Without Coverage |
| Under $25,000 | 371 (100.0%) | 0 (0.0%) |
| $25,000 to $49,999 | 446 (94.7%) | 25 (5.3%) |
| $50,000 to $74,999 | 514 (98.1%) | 10 (1.9%) |
| $75,000 to $99,999 | 471 (92.7%) | 37 (7.3%) |
| $100,000 and over | 2,765 (99.0%) | 28 (1.0%) |
Public vs Private Health Insurance Coverage by Age in Wauna
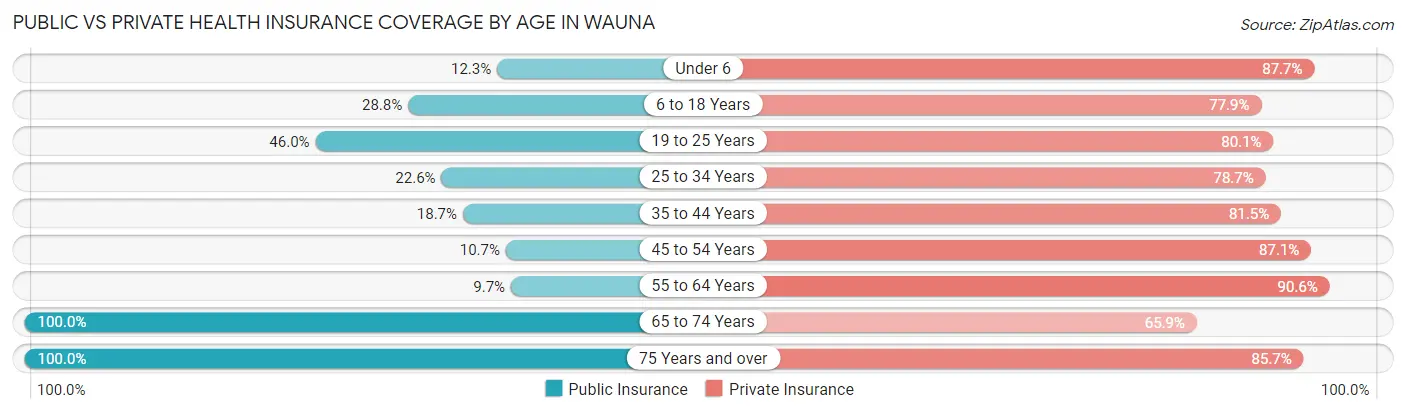
| Age Bracket | Public Insurance | Private Insurance |
| Under 6 | 40 (12.3%) | 285 (87.7%) |
| 6 to 18 Years | 207 (28.8%) | 559 (77.9%) |
| 19 to 25 Years | 81 (46.0%) | 141 (80.1%) |
| 25 to 34 Years | 124 (22.6%) | 431 (78.6%) |
| 35 to 44 Years | 102 (18.6%) | 446 (81.5%) |
| 45 to 54 Years | 58 (10.7%) | 473 (87.1%) |
| 55 to 64 Years | 71 (9.7%) | 661 (90.5%) |
| 65 to 74 Years | 786 (100.0%) | 518 (65.9%) |
| 75 Years and over | 308 (100.0%) | 264 (85.7%) |
| Total | 1,777 (38.0%) | 3,778 (80.7%) |
Disability Status by Sex by Age in Wauna
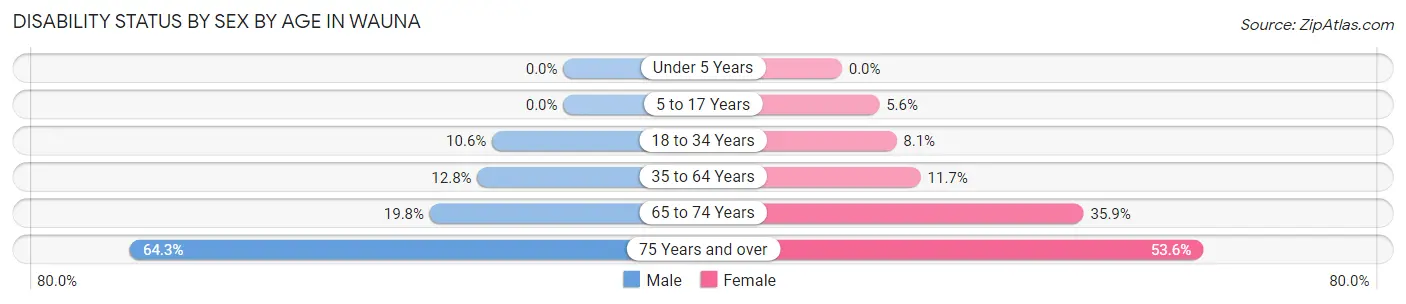
| Age Bracket | Male | Female |
| Under 5 Years | 0 (0.0%) | 0 (0.0%) |
| 5 to 17 Years | 0 (0.0%) | 17 (5.6%) |
| 18 to 34 Years | 54 (10.6%) | 26 (8.1%) |
| 35 to 64 Years | 109 (12.8%) | 113 (11.7%) |
| 65 to 74 Years | 89 (19.8%) | 121 (35.9%) |
| 75 Years and over | 83 (64.3%) | 96 (53.6%) |
Disability Class by Sex by Age in Wauna
Disability Class: Hearing Difficulty
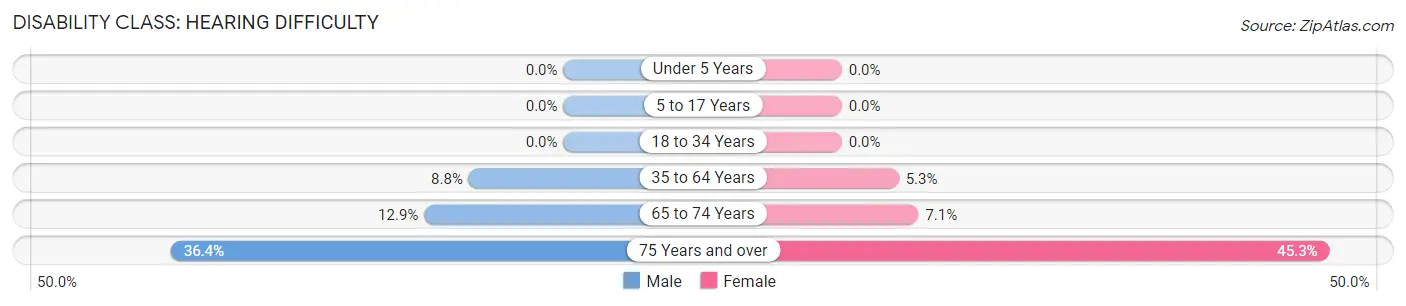
| Age Bracket | Male | Female |
| Under 5 Years | 0 (0.0%) | 0 (0.0%) |
| 5 to 17 Years | 0 (0.0%) | 0 (0.0%) |
| 18 to 34 Years | 0 (0.0%) | 0 (0.0%) |
| 35 to 64 Years | 75 (8.8%) | 51 (5.3%) |
| 65 to 74 Years | 58 (12.9%) | 24 (7.1%) |
| 75 Years and over | 47 (36.4%) | 81 (45.3%) |
Disability Class: Vision Difficulty
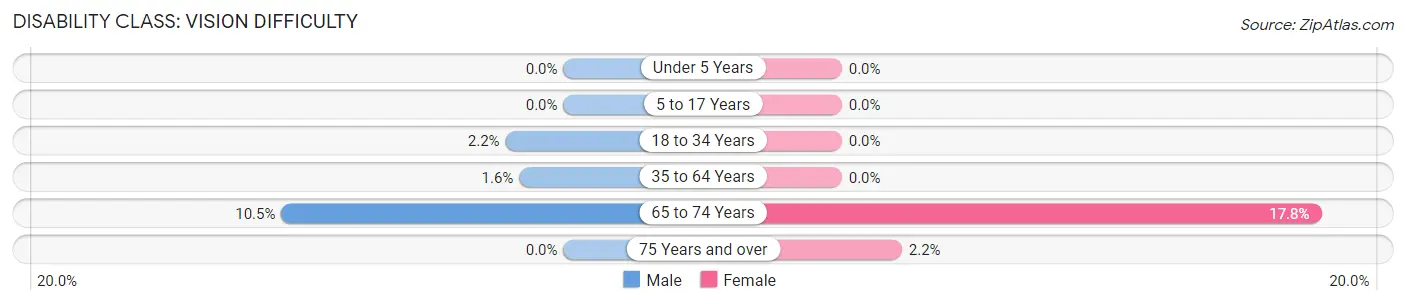
| Age Bracket | Male | Female |
| Under 5 Years | 0 (0.0%) | 0 (0.0%) |
| 5 to 17 Years | 0 (0.0%) | 0 (0.0%) |
| 18 to 34 Years | 11 (2.1%) | 0 (0.0%) |
| 35 to 64 Years | 14 (1.6%) | 0 (0.0%) |
| 65 to 74 Years | 47 (10.5%) | 60 (17.8%) |
| 75 Years and over | 0 (0.0%) | 4 (2.2%) |
Disability Class: Cognitive Difficulty
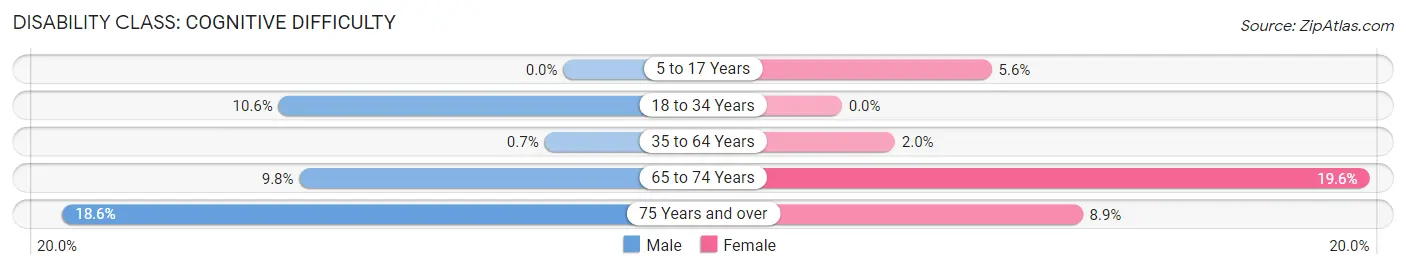
| Age Bracket | Male | Female |
| 5 to 17 Years | 0 (0.0%) | 17 (5.6%) |
| 18 to 34 Years | 54 (10.6%) | 0 (0.0%) |
| 35 to 64 Years | 6 (0.7%) | 19 (2.0%) |
| 65 to 74 Years | 44 (9.8%) | 66 (19.6%) |
| 75 Years and over | 24 (18.6%) | 16 (8.9%) |
Disability Class: Ambulatory Difficulty
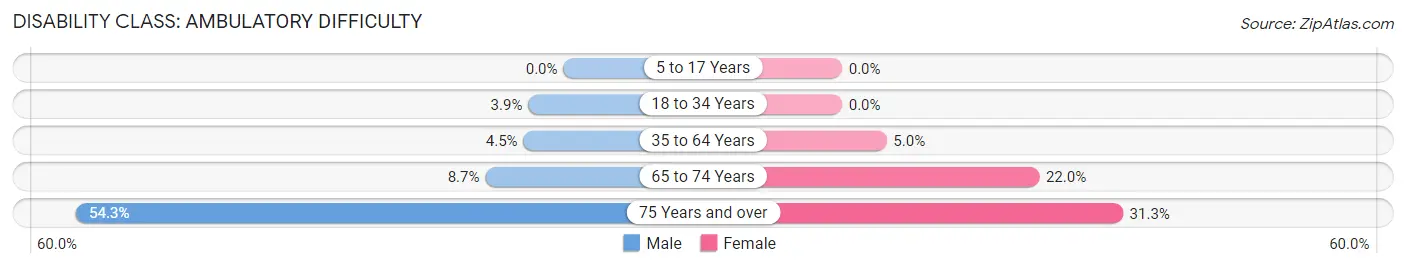
| Age Bracket | Male | Female |
| 5 to 17 Years | 0 (0.0%) | 0 (0.0%) |
| 18 to 34 Years | 20 (3.9%) | 0 (0.0%) |
| 35 to 64 Years | 38 (4.4%) | 48 (5.0%) |
| 65 to 74 Years | 39 (8.7%) | 74 (22.0%) |
| 75 Years and over | 70 (54.3%) | 56 (31.3%) |
Disability Class: Self-Care Difficulty
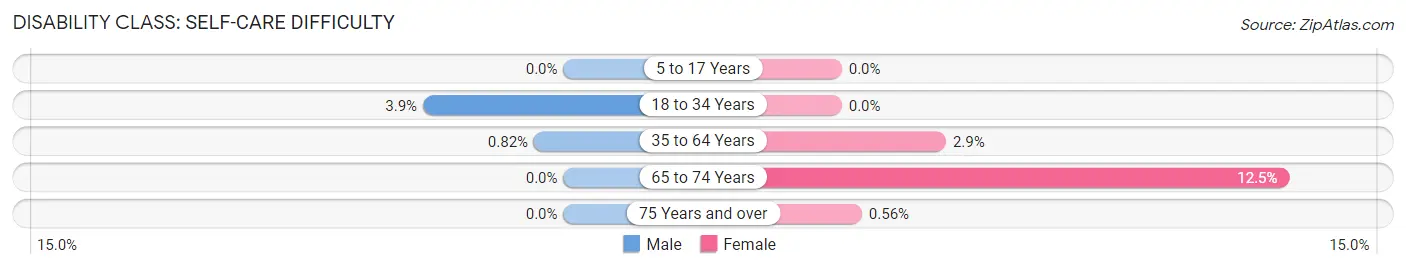
| Age Bracket | Male | Female |
| 5 to 17 Years | 0 (0.0%) | 0 (0.0%) |
| 18 to 34 Years | 20 (3.9%) | 0 (0.0%) |
| 35 to 64 Years | 7 (0.8%) | 28 (2.9%) |
| 65 to 74 Years | 0 (0.0%) | 42 (12.5%) |
| 75 Years and over | 0 (0.0%) | 1 (0.6%) |
Technology Access in Wauna
Computing Device Access in Wauna
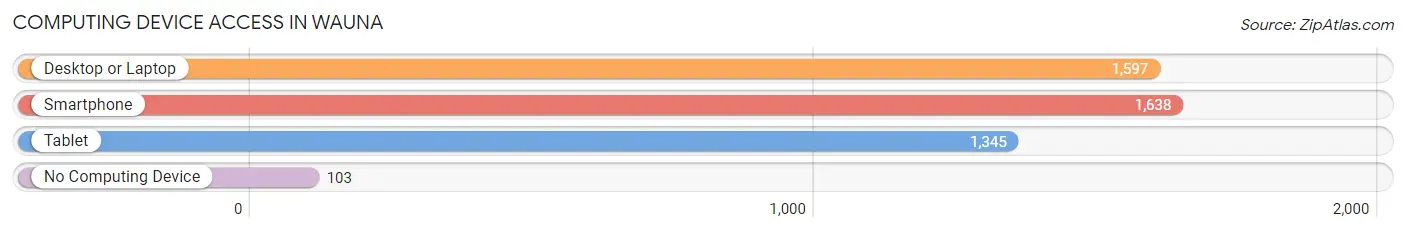
| Device Type | # Households | % Households |
| Desktop or Laptop | 1,597 | 86.9% |
| Smartphone | 1,638 | 89.2% |
| Tablet | 1,345 | 73.2% |
| No Computing Device | 103 | 5.6% |
| Total | 1,837 | 100.0% |
Internet Access in Wauna
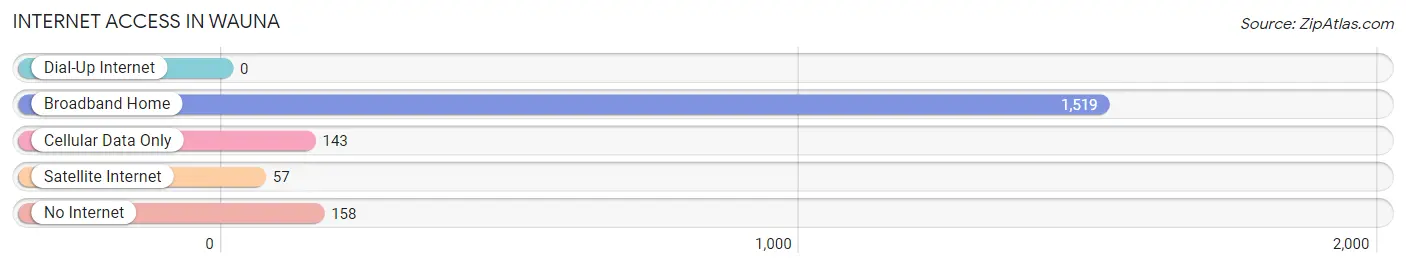
| Internet Type | # Households | % Households |
| Dial-Up Internet | 0 | 0.0% |
| Broadband Home | 1,519 | 82.7% |
| Cellular Data Only | 143 | 7.8% |
| Satellite Internet | 57 | 3.1% |
| No Internet | 158 | 8.6% |
| Total | 1,837 | 100.0% |
Wauna Summary
Wauna is a small unincorporated community located in Pierce County, Washington, United States. It is situated on the shores of Puget Sound, approximately 25 miles south of Tacoma and 30 miles north of Olympia. The population of Wauna was estimated to be 1,845 in 2019.
History
The area now known as Wauna was first inhabited by the Nisqually people, who lived in the area for thousands of years before the arrival of European settlers. The first recorded European settler in the area was William W. Miller, who arrived in 1854 and established a homestead. The area was originally known as Miller’s Landing, but was later renamed Wauna in 1891. The name is derived from the Nisqually word for “good” or “pleasant.”
In the late 19th century, Wauna was a popular destination for tourists and vacationers. The area was known for its beautiful scenery and abundant wildlife. In the early 20th century, Wauna became a popular spot for fishing and crabbing. The area was also home to several resorts, including the Wauna Hotel, which was built in 1910 and operated until the 1950s.
Geography
Wauna is located on the western shore of Puget Sound, approximately 25 miles south of Tacoma and 30 miles north of Olympia. The area is characterized by rolling hills, forests, and wetlands. The nearby Nisqually River is a popular destination for fishing and boating.
The climate in Wauna is mild and temperate, with warm summers and cool winters. The average annual temperature is around 50°F (10°C). The average annual precipitation is around 40 inches (101 cm).
Economy
The economy of Wauna is largely based on tourism and recreation. The area is home to several resorts and recreational facilities, including the Wauna Hotel, which was built in 1910 and operated until the 1950s. The area is also popular for fishing, crabbing, and boating.
The area is also home to several small businesses, including restaurants, retail stores, and service providers. The nearby Nisqually River is a popular destination for fishing and boating.
Demographics
As of 2019, the population of Wauna was estimated to be 1,845. The racial makeup of the town was 94.3% White, 1.2% African American, 0.7% Native American, 0.7% Asian, 0.2% Pacific Islander, and 2.1% from other races. The median household income was $50,000, and the median age was 44.
Conclusion
Wauna is a small unincorporated community located in Pierce County, Washington, United States. It is situated on the shores of Puget Sound, approximately 25 miles south of Tacoma and 30 miles north of Olympia. The area was first inhabited by the Nisqually people, and was later settled by European settlers in the 19th century. The economy of Wauna is largely based on tourism and recreation, and the area is home to several small businesses. The population of Wauna was estimated to be 1,845 in 2019.
Common Questions
What is Per Capita Income in Wauna?
Per Capita income in Wauna is $46,127.
What is the Median Family Income in Wauna?
Median Family Income in Wauna is $121,881.
What is the Median Household income in Wauna?
Median Household Income in Wauna is $100,329.
What is Income or Wage Gap in Wauna?
Income or Wage Gap in Wauna is 37.5%.
Women in Wauna earn 62.5 cents for every dollar earned by a man.
What is Inequality or Gini Index in Wauna?
Inequality or Gini Index in Wauna is 0.41.
What is the Total Population of Wauna?
Total Population of Wauna is 4,689.
What is the Total Male Population of Wauna?
Total Male Population of Wauna is 2,447.
What is the Total Female Population of Wauna?
Total Female Population of Wauna is 2,242.
What is the Ratio of Males per 100 Females in Wauna?
There are 109.14 Males per 100 Females in Wauna.
What is the Ratio of Females per 100 Males in Wauna?
There are 91.62 Females per 100 Males in Wauna.
What is the Median Population Age in Wauna?
Median Population Age in Wauna is 45.4 Years.
What is the Average Family Size in Wauna
Average Family Size in Wauna is 2.9 People.
What is the Average Household Size in Wauna
Average Household Size in Wauna is 2.5 People.
How Large is the Labor Force in Wauna?
There are 2,398 People in the Labor Forcein in Wauna.
What is the Percentage of People in the Labor Force in Wauna?
63.1% of People are in the Labor Force in Wauna.
What is the Unemployment Rate in Wauna?
Unemployment Rate in Wauna is 4.7%.