Marysville, WA Map & Demographics
Marysville Map
Marysville Overview
$40,238
PER CAPITA INCOME
$110,041
AVG FAMILY INCOME
$98,288
AVG HOUSEHOLD INCOME
32.1%
WAGE / INCOME GAP [ % ]
67.9¢/ $1
WAGE / INCOME GAP [ $ ]
$11,469
FAMILY INCOME DEFICIT
0.36
INEQUALITY / GINI INDEX
70,847
TOTAL POPULATION
35,729
MALE POPULATION
35,118
FEMALE POPULATION
101.74
MALES / 100 FEMALES
98.29
FEMALES / 100 MALES
37.1
MEDIAN AGE
3.2
AVG FAMILY SIZE
2.8
AVG HOUSEHOLD SIZE
38,575
LABOR FORCE [ PEOPLE ]
67.7%
PERCENT IN LABOR FORCE
4.2%
UNEMPLOYMENT RATE
Marysville Area Codes
Income in Marysville
Income Overview in Marysville
Per Capita Income in Marysville is $40,238, while median incomes of families and households are $110,041 and $98,288 respectively.
| Characteristic | Number | Measure |
| Per Capita Income | 70,847 | $40,238 |
| Median Family Income | 18,071 | $110,041 |
| Mean Family Income | 18,071 | $120,252 |
| Median Household Income | 25,423 | $98,288 |
| Mean Household Income | 25,423 | $109,788 |
| Income Deficit | 18,071 | $11,469 |
| Wage / Income Gap (%) | 70,847 | 32.09% |
| Wage / Income Gap ($) | 70,847 | 67.91¢ per $1 |
| Gini / Inequality Index | 70,847 | 0.36 |
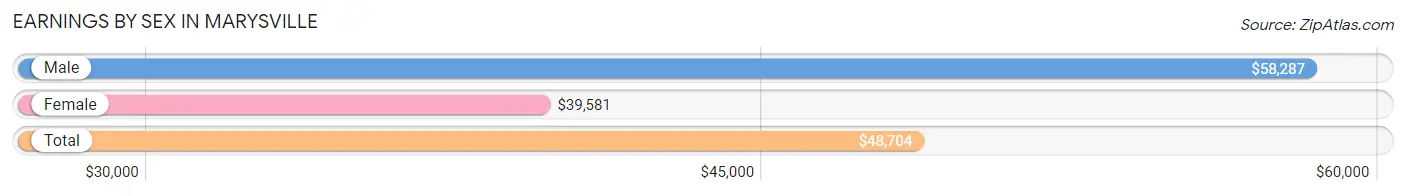
Earnings by Sex in Marysville
Average Earnings in Marysville are $48,704, $58,287 for men and $39,581 for women, a difference of 32.1%.
| Sex | Number | Average Earnings |
| Male | 22,024 (55.1%) | $58,287 |
| Female | 17,939 (44.9%) | $39,581 |
| Total | 39,963 (100.0%) | $48,704 |
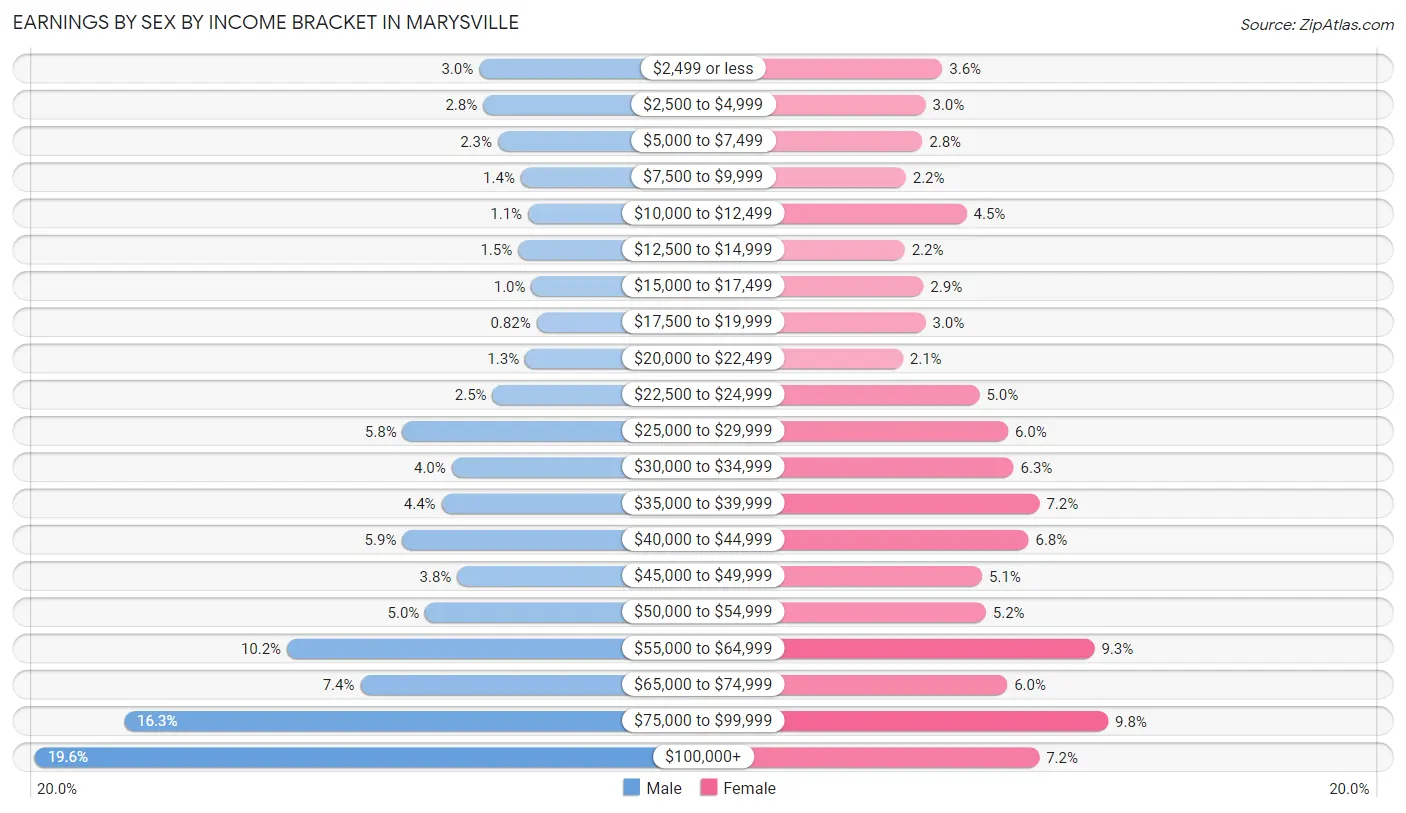
Earnings by Sex by Income Bracket in Marysville
The most common earnings brackets in Marysville are $100,000+ for men (4,322 | 19.6%) and $75,000 to $99,999 for women (1,757 | 9.8%).
| Income | Male | Female |
| $2,499 or less | 654 (3.0%) | 643 (3.6%) |
| $2,500 to $4,999 | 621 (2.8%) | 529 (2.9%) |
| $5,000 to $7,499 | 500 (2.3%) | 508 (2.8%) |
| $7,500 to $9,999 | 310 (1.4%) | 397 (2.2%) |
| $10,000 to $12,499 | 250 (1.1%) | 805 (4.5%) |
| $12,500 to $14,999 | 333 (1.5%) | 389 (2.2%) |
| $15,000 to $17,499 | 222 (1.0%) | 514 (2.9%) |
| $17,500 to $19,999 | 181 (0.8%) | 530 (2.9%) |
| $20,000 to $22,499 | 276 (1.3%) | 376 (2.1%) |
| $22,500 to $24,999 | 543 (2.5%) | 891 (5.0%) |
| $25,000 to $29,999 | 1,287 (5.8%) | 1,083 (6.0%) |
| $30,000 to $34,999 | 881 (4.0%) | 1,122 (6.2%) |
| $35,000 to $39,999 | 965 (4.4%) | 1,295 (7.2%) |
| $40,000 to $44,999 | 1,288 (5.9%) | 1,221 (6.8%) |
| $45,000 to $49,999 | 835 (3.8%) | 909 (5.1%) |
| $50,000 to $54,999 | 1,099 (5.0%) | 934 (5.2%) |
| $55,000 to $64,999 | 2,239 (10.2%) | 1,664 (9.3%) |
| $65,000 to $74,999 | 1,635 (7.4%) | 1,078 (6.0%) |
| $75,000 to $99,999 | 3,583 (16.3%) | 1,757 (9.8%) |
| $100,000+ | 4,322 (19.6%) | 1,294 (7.2%) |
| Total | 22,024 (100.0%) | 17,939 (100.0%) |
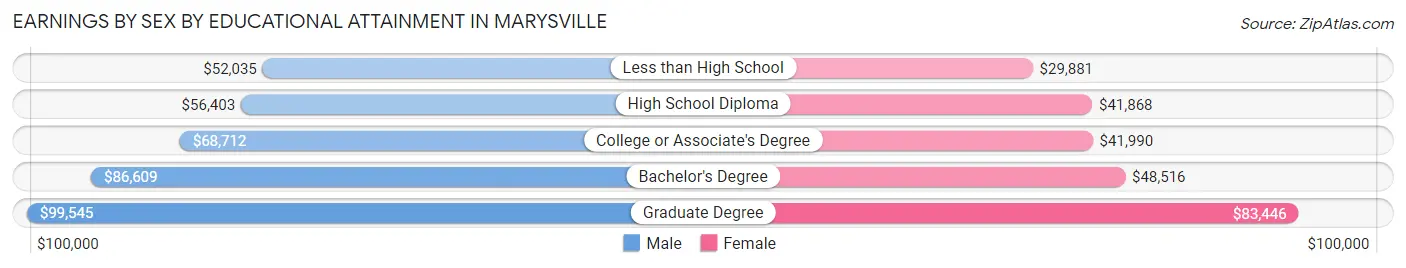
Earnings by Sex by Educational Attainment in Marysville
Average earnings in Marysville are $65,454 for men and $43,936 for women, a difference of 32.9%. Men with an educational attainment of graduate degree enjoy the highest average annual earnings of $99,545, while those with less than high school education earn the least with $52,035. Women with an educational attainment of graduate degree earn the most with the average annual earnings of $83,446, while those with less than high school education have the smallest earnings of $29,881.
| Educational Attainment | Male Income | Female Income |
| Less than High School | $52,035 | $29,881 |
| High School Diploma | $56,403 | $41,868 |
| College or Associate's Degree | $68,712 | $41,990 |
| Bachelor's Degree | $86,609 | $48,516 |
| Graduate Degree | $99,545 | $83,446 |
| Total | $65,454 | $43,936 |
Family Income in Marysville
Family Income Brackets in Marysville
According to the Marysville family income data, there are 5,295 families falling into the $100,000 to $149,999 income range, which is the most common income bracket and makes up 29.3% of all families. Conversely, the $10,000 to $14,999 income bracket is the least frequent group with only 217 families (1.2%) belonging to this category.
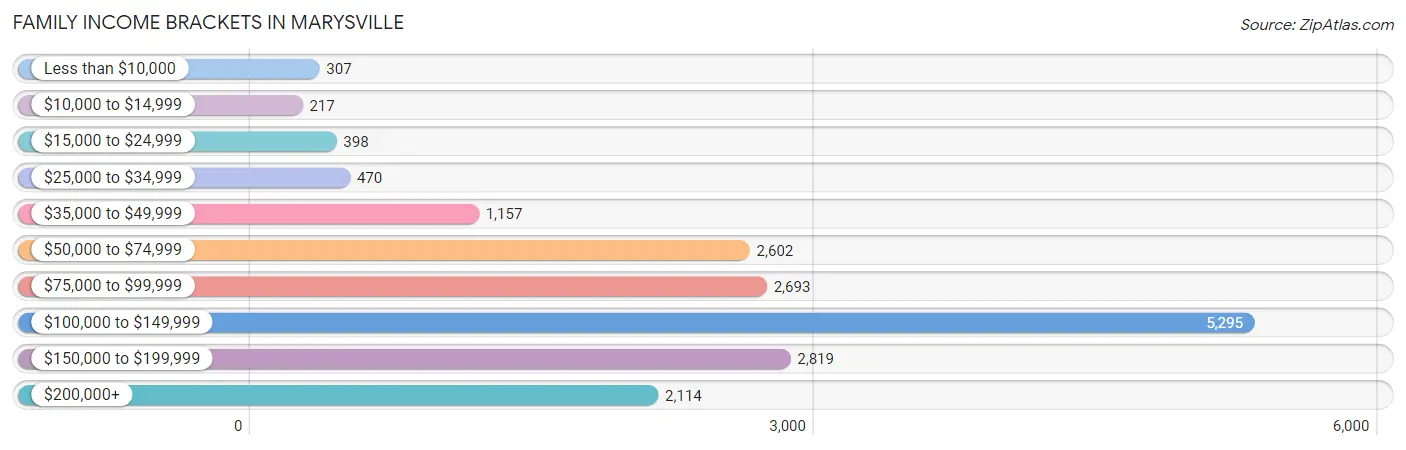
| Income Bracket | # Families | % Families |
| Less than $10,000 | 307 | 1.7% |
| $10,000 to $14,999 | 217 | 1.2% |
| $15,000 to $24,999 | 398 | 2.2% |
| $25,000 to $34,999 | 470 | 2.6% |
| $35,000 to $49,999 | 1,157 | 6.4% |
| $50,000 to $74,999 | 2,602 | 14.4% |
| $75,000 to $99,999 | 2,693 | 14.9% |
| $100,000 to $149,999 | 5,295 | 29.3% |
| $150,000 to $199,999 | 2,819 | 15.6% |
| $200,000+ | 2,114 | 11.7% |
Family Income by Famaliy Size in Marysville
7+ person families (350 | 1.9%) account for the highest median family income in Marysville with $149,886 per family, while 2-person families (8,076 | 44.7%) have the highest median income of $48,800 per family member.
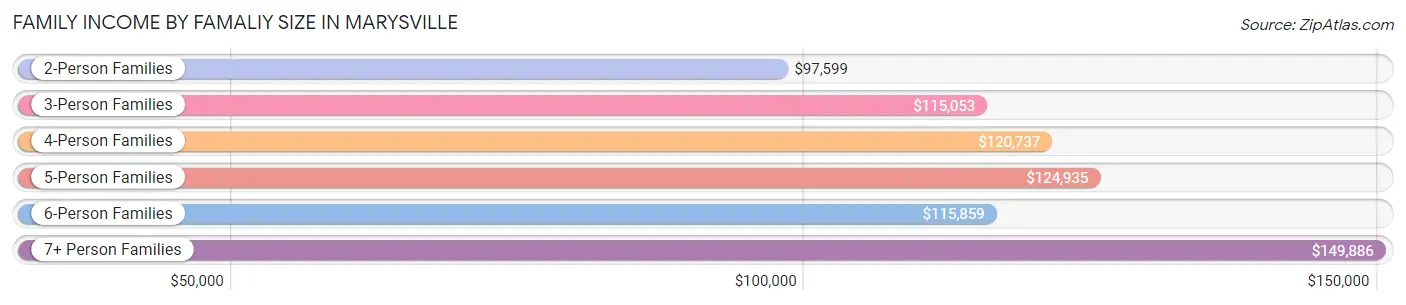
| Income Bracket | # Families | Median Income |
| 2-Person Families | 8,076 (44.7%) | $97,599 |
| 3-Person Families | 4,172 (23.1%) | $115,053 |
| 4-Person Families | 2,855 (15.8%) | $120,737 |
| 5-Person Families | 1,633 (9.0%) | $124,935 |
| 6-Person Families | 985 (5.4%) | $115,859 |
| 7+ Person Families | 350 (1.9%) | $149,886 |
| Total | 18,071 (100.0%) | $110,041 |
Family Income by Number of Earners in Marysville
The median family income in Marysville is $110,041, with families comprising 3+ earners (2,931) having the highest median family income of $169,306, while families with no earners (2,052) have the lowest median family income of $55,227, accounting for 16.2% and 11.4% of families, respectively.
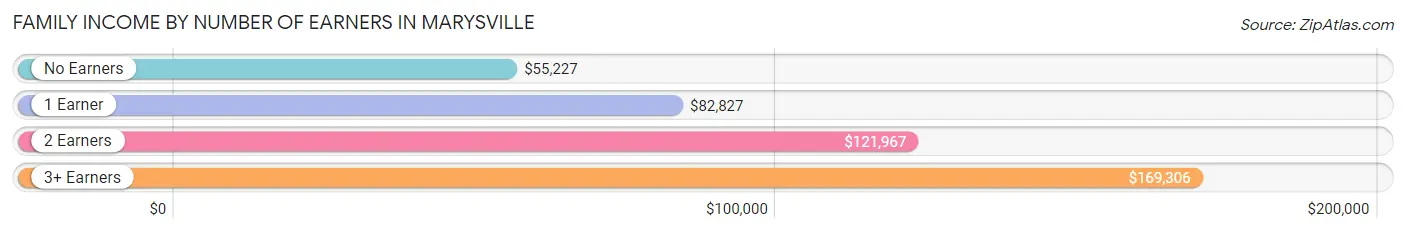
| Number of Earners | # Families | Median Income |
| No Earners | 2,052 (11.4%) | $55,227 |
| 1 Earner | 5,420 (30.0%) | $82,827 |
| 2 Earners | 7,668 (42.4%) | $121,967 |
| 3+ Earners | 2,931 (16.2%) | $169,306 |
| Total | 18,071 (100.0%) | $110,041 |
Household Income in Marysville
Household Income Brackets in Marysville
With 6,508 households falling in the category, the $100,000 to $149,999 income range is the most frequent in Marysville, accounting for 25.6% of all households. In contrast, only 508 households (2.0%) fall into the $10,000 to $14,999 income bracket, making it the least populous group.
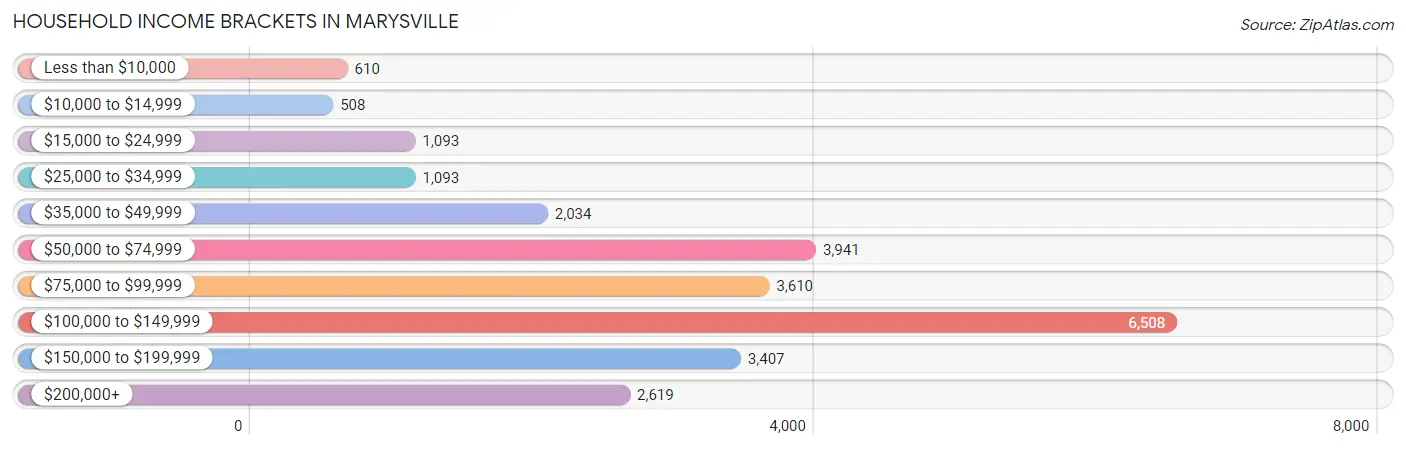
| Income Bracket | # Households | % Households |
| Less than $10,000 | 610 | 2.4% |
| $10,000 to $14,999 | 508 | 2.0% |
| $15,000 to $24,999 | 1,093 | 4.3% |
| $25,000 to $34,999 | 1,093 | 4.3% |
| $35,000 to $49,999 | 2,034 | 8.0% |
| $50,000 to $74,999 | 3,941 | 15.5% |
| $75,000 to $99,999 | 3,610 | 14.2% |
| $100,000 to $149,999 | 6,508 | 25.6% |
| $150,000 to $199,999 | 3,407 | 13.4% |
| $200,000+ | 2,619 | 10.3% |
Household Income by Householder Age in Marysville
The median household income in Marysville is $98,288, with the highest median household income of $117,506 found in the 45 to 64 years age bracket for the primary householder. A total of 9,503 households (37.4%) fall into this category. Meanwhile, the 65+ years age bracket for the primary householder has the lowest median household income of $58,389, with 5,807 households (22.8%) in this group.
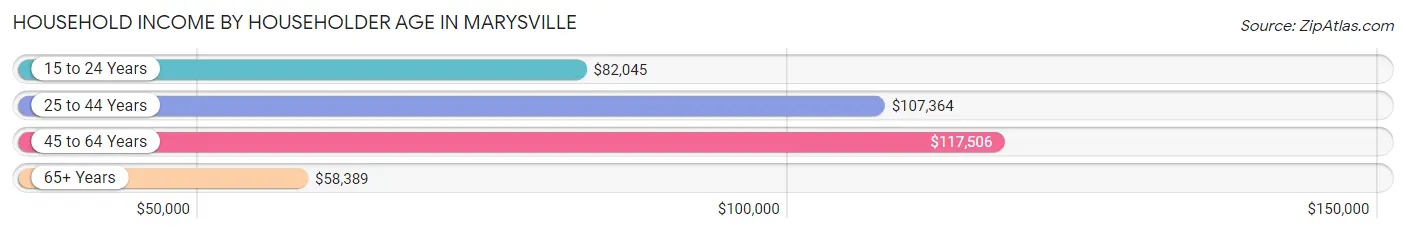
| Income Bracket | # Households | Median Income |
| 15 to 24 Years | 644 (2.5%) | $82,045 |
| 25 to 44 Years | 9,469 (37.2%) | $107,364 |
| 45 to 64 Years | 9,503 (37.4%) | $117,506 |
| 65+ Years | 5,807 (22.8%) | $58,389 |
| Total | 25,423 (100.0%) | $98,288 |
Poverty in Marysville
Income Below Poverty by Sex and Age in Marysville
With 5.6% poverty level for males and 7.4% for females among the residents of Marysville, 6 to 11 year old males and 75 year old and over females are the most vulnerable to poverty, with 300 males (11.3%) and 403 females (19.3%) in their respective age groups living below the poverty level.
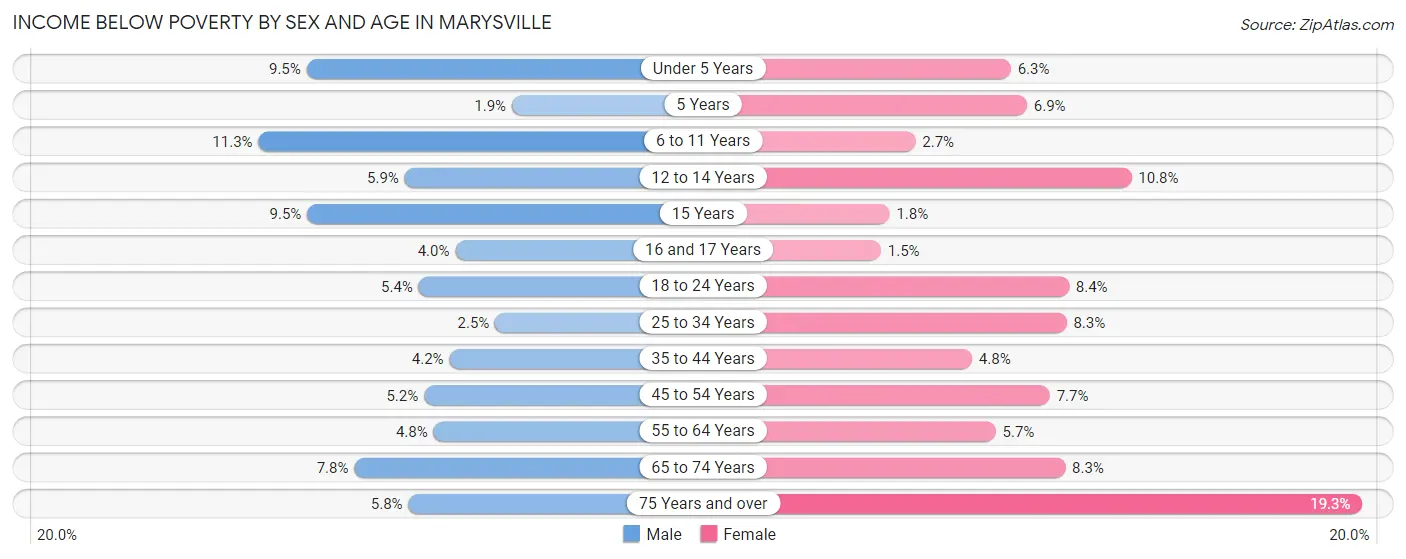
| Age Bracket | Male | Female |
| Under 5 Years | 235 (9.5%) | 146 (6.3%) |
| 5 Years | 7 (1.9%) | 23 (6.9%) |
| 6 to 11 Years | 300 (11.3%) | 65 (2.7%) |
| 12 to 14 Years | 87 (5.9%) | 107 (10.7%) |
| 15 Years | 27 (9.5%) | 6 (1.8%) |
| 16 and 17 Years | 37 (4.0%) | 11 (1.5%) |
| 18 to 24 Years | 187 (5.4%) | 272 (8.4%) |
| 25 to 34 Years | 140 (2.5%) | 438 (8.3%) |
| 35 to 44 Years | 232 (4.2%) | 243 (4.8%) |
| 45 to 54 Years | 228 (5.2%) | 315 (7.7%) |
| 55 to 64 Years | 224 (4.8%) | 252 (5.7%) |
| 65 to 74 Years | 197 (7.8%) | 294 (8.3%) |
| 75 Years and over | 75 (5.8%) | 403 (19.3%) |
| Total | 1,976 (5.6%) | 2,575 (7.4%) |
Income Above Poverty by Sex and Age in Marysville
According to the poverty statistics in Marysville, males aged 5 years and females aged 16 and 17 years are the age groups that are most secure financially, with 98.1% of males and 98.6% of females in these age groups living above the poverty line.
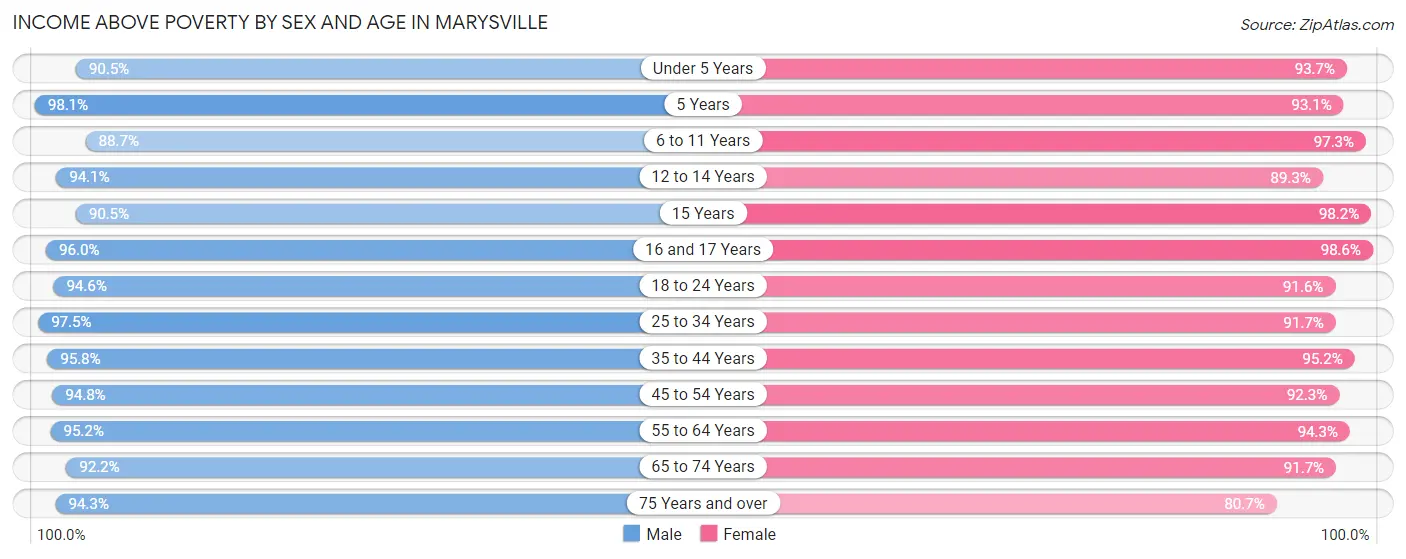
| Age Bracket | Male | Female |
| Under 5 Years | 2,231 (90.5%) | 2,182 (93.7%) |
| 5 Years | 360 (98.1%) | 312 (93.1%) |
| 6 to 11 Years | 2,351 (88.7%) | 2,319 (97.3%) |
| 12 to 14 Years | 1,389 (94.1%) | 888 (89.2%) |
| 15 Years | 257 (90.5%) | 333 (98.2%) |
| 16 and 17 Years | 885 (96.0%) | 747 (98.6%) |
| 18 to 24 Years | 3,297 (94.6%) | 2,955 (91.6%) |
| 25 to 34 Years | 5,384 (97.5%) | 4,814 (91.7%) |
| 35 to 44 Years | 5,256 (95.8%) | 4,787 (95.2%) |
| 45 to 54 Years | 4,181 (94.8%) | 3,766 (92.3%) |
| 55 to 64 Years | 4,420 (95.2%) | 4,162 (94.3%) |
| 65 to 74 Years | 2,342 (92.2%) | 3,251 (91.7%) |
| 75 Years and over | 1,230 (94.3%) | 1,683 (80.7%) |
| Total | 33,583 (94.4%) | 32,199 (92.6%) |
Income Below Poverty Among Married-Couple Families in Marysville
The poverty statistics for married-couple families in Marysville show that 1.7% or 235 of the total 13,927 families live below the poverty line. Families with 5 or more children have the highest poverty rate of 11.9%, comprising of 12 families. On the other hand, families with 1 or 2 children have the lowest poverty rate of 0.6%, which includes 23 families.
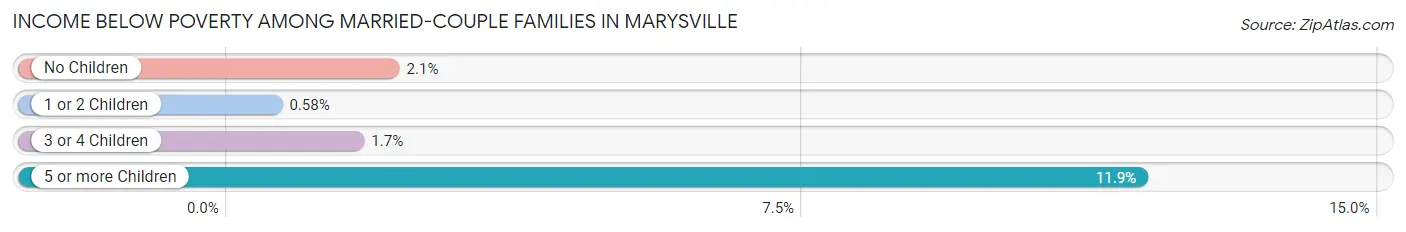
| Children | Above Poverty | Below Poverty |
| No Children | 7,989 (97.9%) | 172 (2.1%) |
| 1 or 2 Children | 3,944 (99.4%) | 23 (0.6%) |
| 3 or 4 Children | 1,670 (98.4%) | 28 (1.7%) |
| 5 or more Children | 89 (88.1%) | 12 (11.9%) |
| Total | 13,692 (98.3%) | 235 (1.7%) |
Income Below Poverty Among Single-Parent Households in Marysville
According to the poverty data in Marysville, 1.8% or 23 single-father households and 17.7% or 512 single-mother households are living below the poverty line. Among single-father households, those with 5 or more children have the highest poverty rate, with 11 households (100.0%) experiencing poverty. Likewise, among single-mother households, those with 3 or 4 children have the highest poverty rate, with 91 households (35.8%) falling below the poverty line.
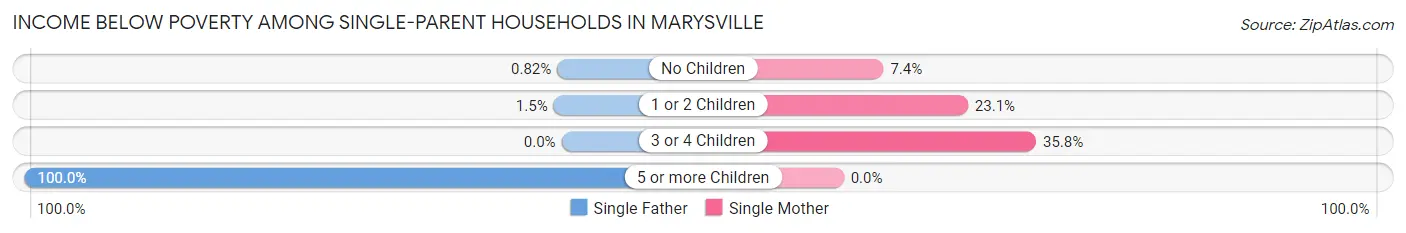
| Children | Single Father | Single Mother |
| No Children | 6 (0.8%) | 88 (7.4%) |
| 1 or 2 Children | 6 (1.5%) | 333 (23.1%) |
| 3 or 4 Children | 0 (0.0%) | 91 (35.8%) |
| 5 or more Children | 11 (100.0%) | 0 (0.0%) |
| Total | 23 (1.8%) | 512 (17.7%) |
Income Below Poverty Among Married-Couple vs Single-Parent Households in Marysville
The poverty data for Marysville shows that 235 of the married-couple family households (1.7%) and 535 of the single-parent households (12.9%) are living below the poverty level. Within the married-couple family households, those with 5 or more children have the highest poverty rate, with 12 households (11.9%) falling below the poverty line. Among the single-parent households, those with 5 or more children have the highest poverty rate, with 11 household (39.3%) living below poverty.
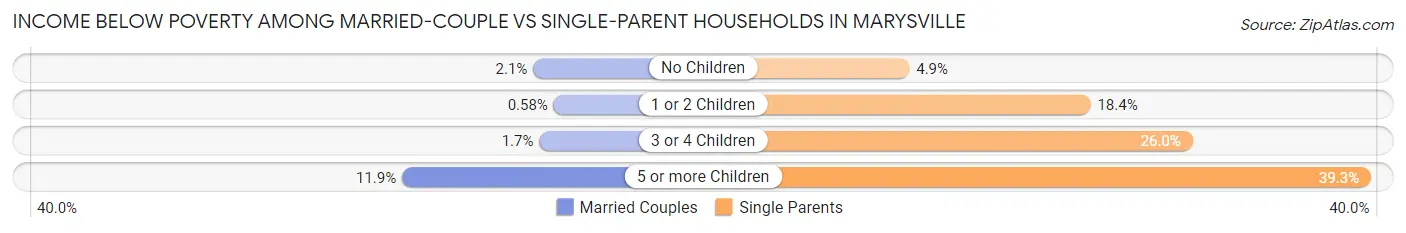
| Children | Married-Couple Families | Single-Parent Households |
| No Children | 172 (2.1%) | 94 (4.9%) |
| 1 or 2 Children | 23 (0.6%) | 339 (18.4%) |
| 3 or 4 Children | 28 (1.7%) | 91 (26.0%) |
| 5 or more Children | 12 (11.9%) | 11 (39.3%) |
| Total | 235 (1.7%) | 535 (12.9%) |
Race in Marysville
The most populous races in Marysville are White / Caucasian (51,458 | 72.6%), Hispanic or Latino (10,510 | 14.8%), and Two or more Races (8,316 | 11.7%).
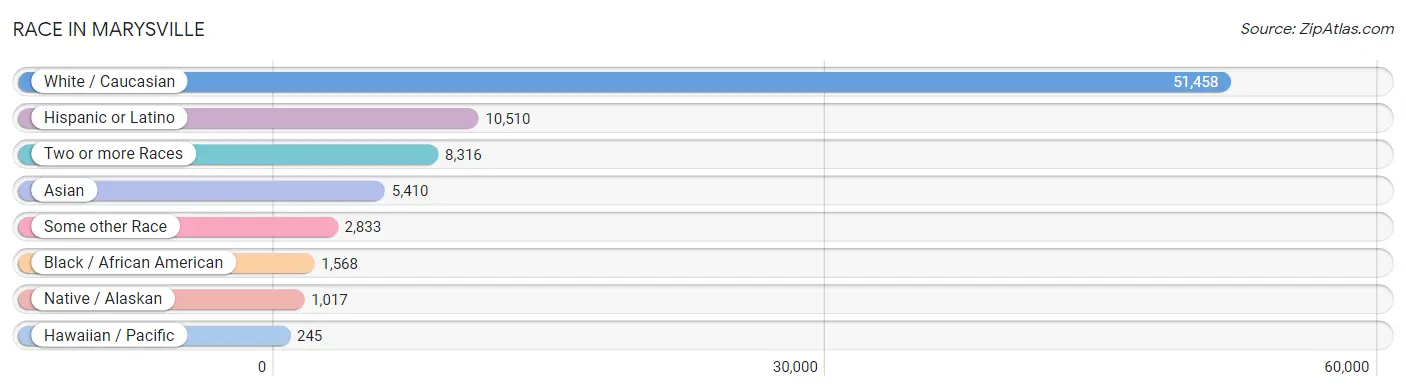
| Race | # Population | % Population |
| Asian | 5,410 | 7.6% |
| Black / African American | 1,568 | 2.2% |
| Hawaiian / Pacific | 245 | 0.4% |
| Hispanic or Latino | 10,510 | 14.8% |
| Native / Alaskan | 1,017 | 1.4% |
| White / Caucasian | 51,458 | 72.6% |
| Two or more Races | 8,316 | 11.7% |
| Some other Race | 2,833 | 4.0% |
| Total | 70,847 | 100.0% |
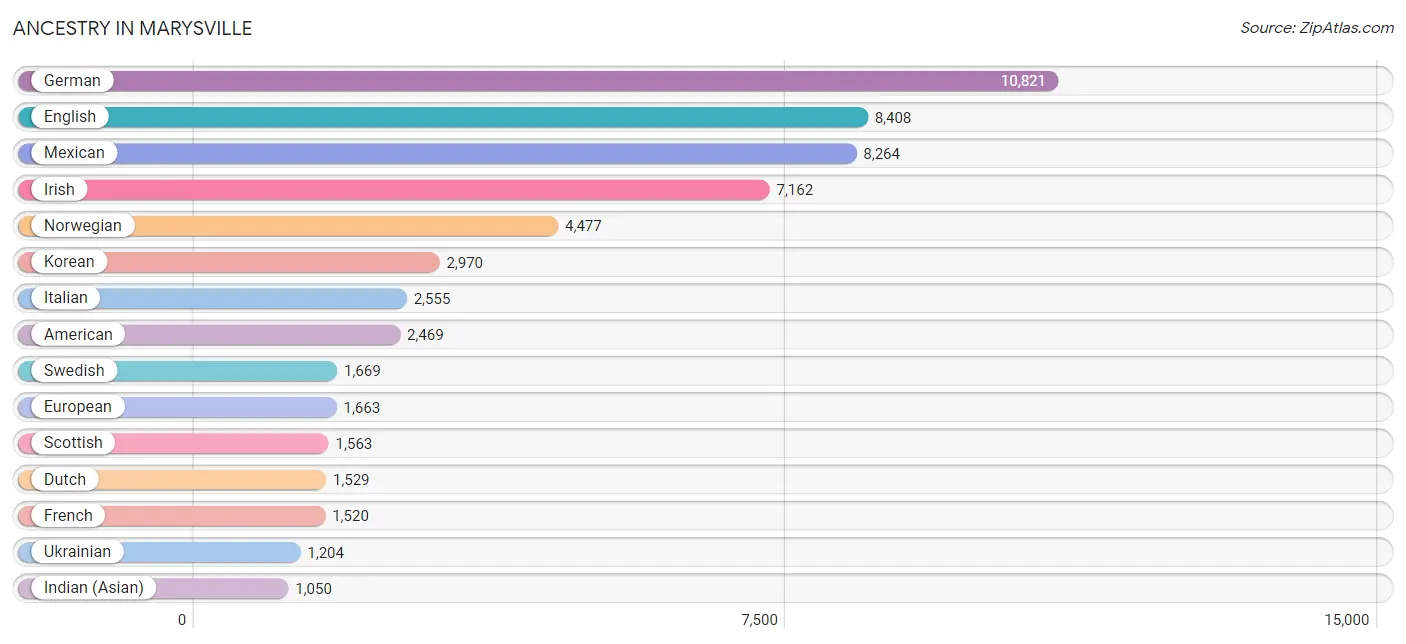
Ancestry in Marysville
The most populous ancestries reported in Marysville are German (10,821 | 15.3%), English (8,408 | 11.9%), Mexican (8,264 | 11.7%), Irish (7,162 | 10.1%), and Norwegian (4,477 | 6.3%), together accounting for 55.2% of all Marysville residents.
| Ancestry | # Population | % Population |
| African | 104 | 0.2% |
| Alaska Native | 91 | 0.1% |
| Alaskan Athabascan | 11 | 0.0% |
| Aleut | 117 | 0.2% |
| American | 2,469 | 3.5% |
| Apache | 34 | 0.1% |
| Arab | 173 | 0.2% |
| Armenian | 260 | 0.4% |
| Australian | 8 | 0.0% |
| Austrian | 289 | 0.4% |
| Bangladeshi | 159 | 0.2% |
| Belgian | 36 | 0.1% |
| Bhutanese | 353 | 0.5% |
| Blackfeet | 60 | 0.1% |
| Brazilian | 4 | 0.0% |
| British | 481 | 0.7% |
| Burmese | 299 | 0.4% |
| Cajun | 9 | 0.0% |
| Cambodian | 32 | 0.1% |
| Canadian | 121 | 0.2% |
| Celtic | 53 | 0.1% |
| Central American | 624 | 0.9% |
| Cherokee | 115 | 0.2% |
| Chilean | 37 | 0.1% |
| Chippewa | 20 | 0.0% |
| Choctaw | 194 | 0.3% |
| Colombian | 162 | 0.2% |
| Colville | 21 | 0.0% |
| Croatian | 23 | 0.0% |
| Crow | 6 | 0.0% |
| Cuban | 134 | 0.2% |
| Czech | 180 | 0.3% |
| Czechoslovakian | 59 | 0.1% |
| Danish | 881 | 1.2% |
| Dutch | 1,529 | 2.2% |
| Dutch West Indian | 8 | 0.0% |
| Eastern European | 79 | 0.1% |
| Egyptian | 6 | 0.0% |
| English | 8,408 | 11.9% |
| Estonian | 29 | 0.0% |
| Ethiopian | 8 | 0.0% |
| European | 1,663 | 2.4% |
| Fijian | 5 | 0.0% |
| Filipino | 41 | 0.1% |
| Finnish | 346 | 0.5% |
| French | 1,520 | 2.1% |
| French American Indian | 100 | 0.1% |
| French Canadian | 250 | 0.4% |
| German | 10,821 | 15.3% |
| Greek | 149 | 0.2% |
| Guamanian / Chamorro | 80 | 0.1% |
| Guatemalan | 169 | 0.2% |
| Honduran | 49 | 0.1% |
| Hungarian | 167 | 0.2% |
| Icelander | 34 | 0.1% |
| Indian (Asian) | 1,050 | 1.5% |
| Inupiat | 18 | 0.0% |
| Iranian | 21 | 0.0% |
| Iraqi | 85 | 0.1% |
| Irish | 7,162 | 10.1% |
| Iroquois | 29 | 0.0% |
| Italian | 2,555 | 3.6% |
| Jamaican | 166 | 0.2% |
| Japanese | 186 | 0.3% |
| Kenyan | 172 | 0.2% |
| Korean | 2,970 | 4.2% |
| Laotian | 145 | 0.2% |
| Latvian | 19 | 0.0% |
| Lebanese | 37 | 0.1% |
| Lithuanian | 37 | 0.1% |
| Malaysian | 24 | 0.0% |
| Maltese | 64 | 0.1% |
| Mexican | 8,264 | 11.7% |
| Mexican American Indian | 221 | 0.3% |
| Native Hawaiian | 464 | 0.6% |
| Navajo | 21 | 0.0% |
| Nicaraguan | 23 | 0.0% |
| Nigerian | 72 | 0.1% |
| Northern European | 47 | 0.1% |
| Norwegian | 4,477 | 6.3% |
| Pakistani | 270 | 0.4% |
| Panamanian | 141 | 0.2% |
| Pennsylvania German | 6 | 0.0% |
| Peruvian | 92 | 0.1% |
| Polish | 967 | 1.4% |
| Portuguese | 153 | 0.2% |
| Puerto Rican | 146 | 0.2% |
| Puget Sound Salish | 550 | 0.8% |
| Romanian | 114 | 0.2% |
| Russian | 943 | 1.3% |
| Salvadoran | 242 | 0.3% |
| Samoan | 85 | 0.1% |
| Scandinavian | 604 | 0.9% |
| Scotch-Irish | 840 | 1.2% |
| Scottish | 1,563 | 2.2% |
| Serbian | 15 | 0.0% |
| Slavic | 11 | 0.0% |
| Slovak | 116 | 0.2% |
| South American | 291 | 0.4% |
| South American Indian | 130 | 0.2% |
| Spaniard | 438 | 0.6% |
| Spanish | 242 | 0.3% |
| Sri Lankan | 477 | 0.7% |
| Subsaharan African | 349 | 0.5% |
| Swedish | 1,669 | 2.4% |
| Swiss | 78 | 0.1% |
| Syrian | 44 | 0.1% |
| Thai | 891 | 1.3% |
| Tlingit-Haida | 29 | 0.0% |
| Tongan | 10 | 0.0% |
| Tsimshian | 9 | 0.0% |
| Ugandan | 4 | 0.0% |
| Ukrainian | 1,204 | 1.7% |
| Welsh | 545 | 0.8% |
| Yakama | 2 | 0.0% |
| Yaqui | 195 | 0.3% |
| Yugoslavian | 34 | 0.1% | View All 117 Rows |
Immigrants in Marysville
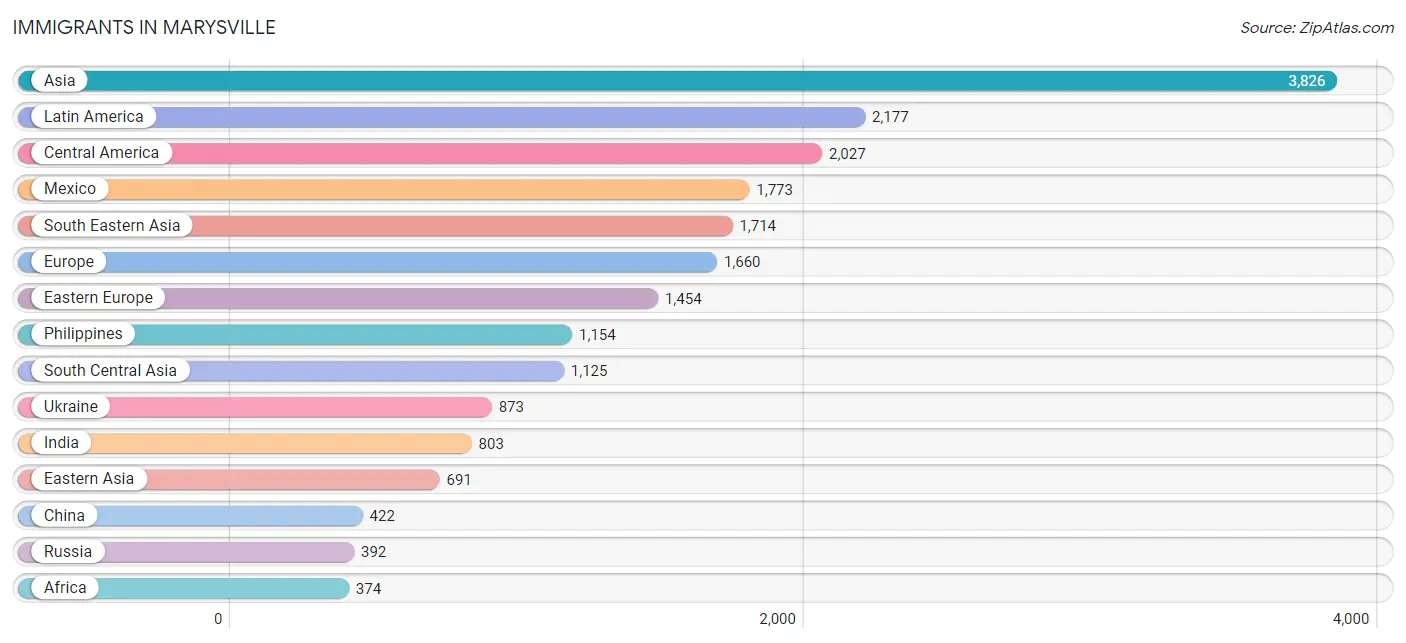
The most numerous immigrant groups reported in Marysville came from Asia (3,826 | 5.4%), Latin America (2,177 | 3.1%), Central America (2,027 | 2.9%), Mexico (1,773 | 2.5%), and South Eastern Asia (1,714 | 2.4%), together accounting for 16.3% of all Marysville residents.
| Immigration Origin | # Population | % Population |
| Africa | 374 | 0.5% |
| Armenia | 129 | 0.2% |
| Asia | 3,826 | 5.4% |
| Belarus | 30 | 0.0% |
| Brazil | 17 | 0.0% |
| Cambodia | 63 | 0.1% |
| Canada | 247 | 0.4% |
| Caribbean | 63 | 0.1% |
| Central America | 2,027 | 2.9% |
| Chile | 26 | 0.0% |
| China | 422 | 0.6% |
| Colombia | 24 | 0.0% |
| Cuba | 6 | 0.0% |
| Denmark | 32 | 0.1% |
| Eastern Africa | 262 | 0.4% |
| Eastern Asia | 691 | 1.0% |
| Eastern Europe | 1,454 | 2.1% |
| Egypt | 6 | 0.0% |
| El Salvador | 53 | 0.1% |
| England | 50 | 0.1% |
| Ethiopia | 105 | 0.2% |
| Europe | 1,660 | 2.3% |
| Fiji | 21 | 0.0% |
| France | 5 | 0.0% |
| Germany | 45 | 0.1% |
| Guatemala | 144 | 0.2% |
| Honduras | 38 | 0.1% |
| Hong Kong | 8 | 0.0% |
| India | 803 | 1.1% |
| Indonesia | 40 | 0.1% |
| Iraq | 142 | 0.2% |
| Israel | 7 | 0.0% |
| Jamaica | 57 | 0.1% |
| Japan | 101 | 0.1% |
| Kazakhstan | 83 | 0.1% |
| Kenya | 112 | 0.2% |
| Korea | 136 | 0.2% |
| Latin America | 2,177 | 3.1% |
| Mexico | 1,773 | 2.5% |
| Middle Africa | 26 | 0.0% |
| Moldova | 24 | 0.0% |
| Netherlands | 20 | 0.0% |
| Nicaragua | 9 | 0.0% |
| Nigeria | 60 | 0.1% |
| Northern Africa | 6 | 0.0% |
| Northern Europe | 125 | 0.2% |
| Oceania | 46 | 0.1% |
| Pakistan | 222 | 0.3% |
| Panama | 10 | 0.0% |
| Peru | 20 | 0.0% |
| Philippines | 1,154 | 1.6% |
| Poland | 29 | 0.0% |
| Romania | 56 | 0.1% |
| Russia | 392 | 0.5% |
| South Africa | 5 | 0.0% |
| South America | 87 | 0.1% |
| South Central Asia | 1,125 | 1.6% |
| South Eastern Asia | 1,714 | 2.4% |
| Southern Europe | 11 | 0.0% |
| Syria | 18 | 0.0% |
| Taiwan | 45 | 0.1% |
| Thailand | 195 | 0.3% |
| Uganda | 4 | 0.0% |
| Ukraine | 873 | 1.2% |
| Vietnam | 262 | 0.4% |
| Western Africa | 75 | 0.1% |
| Western Asia | 296 | 0.4% |
| Western Europe | 70 | 0.1% |
| Zaire | 26 | 0.0% |
| Zimbabwe | 23 | 0.0% | View All 70 Rows |
Sex and Age in Marysville
Sex and Age in Marysville
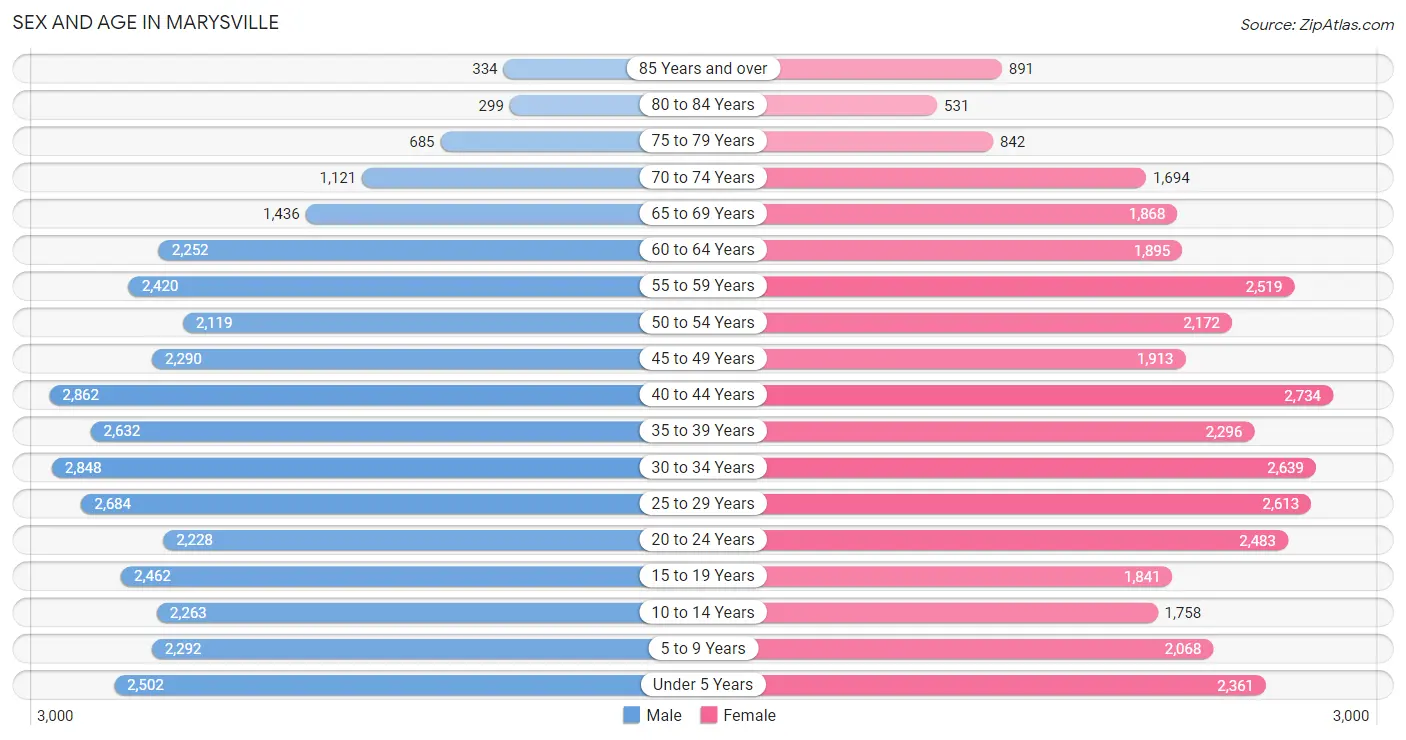
The most populous age groups in Marysville are 40 to 44 Years (2,862 | 8.0%) for men and 40 to 44 Years (2,734 | 7.8%) for women.
| Age Bracket | Male | Female |
| Under 5 Years | 2,502 (7.0%) | 2,361 (6.7%) |
| 5 to 9 Years | 2,292 (6.4%) | 2,068 (5.9%) |
| 10 to 14 Years | 2,263 (6.3%) | 1,758 (5.0%) |
| 15 to 19 Years | 2,462 (6.9%) | 1,841 (5.2%) |
| 20 to 24 Years | 2,228 (6.2%) | 2,483 (7.1%) |
| 25 to 29 Years | 2,684 (7.5%) | 2,613 (7.4%) |
| 30 to 34 Years | 2,848 (8.0%) | 2,639 (7.5%) |
| 35 to 39 Years | 2,632 (7.4%) | 2,296 (6.5%) |
| 40 to 44 Years | 2,862 (8.0%) | 2,734 (7.8%) |
| 45 to 49 Years | 2,290 (6.4%) | 1,913 (5.4%) |
| 50 to 54 Years | 2,119 (5.9%) | 2,172 (6.2%) |
| 55 to 59 Years | 2,420 (6.8%) | 2,519 (7.2%) |
| 60 to 64 Years | 2,252 (6.3%) | 1,895 (5.4%) |
| 65 to 69 Years | 1,436 (4.0%) | 1,868 (5.3%) |
| 70 to 74 Years | 1,121 (3.1%) | 1,694 (4.8%) |
| 75 to 79 Years | 685 (1.9%) | 842 (2.4%) |
| 80 to 84 Years | 299 (0.8%) | 531 (1.5%) |
| 85 Years and over | 334 (0.9%) | 891 (2.5%) |
| Total | 35,729 (100.0%) | 35,118 (100.0%) |
Families and Households in Marysville
Median Family Size in Marysville
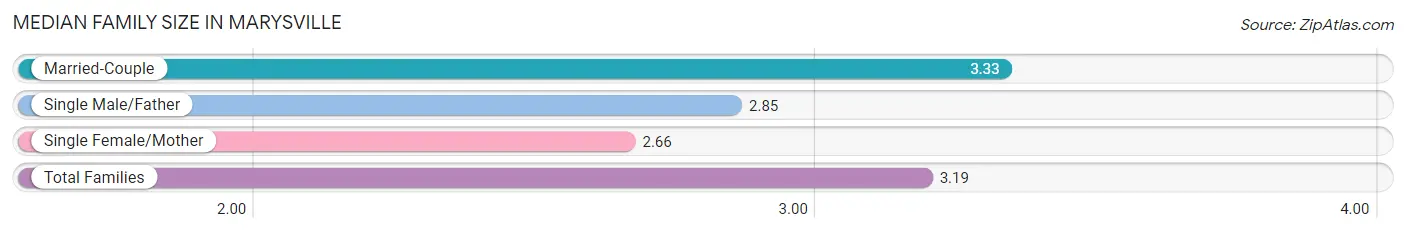
The median family size in Marysville is 3.19 persons per family, with married-couple families (13,927 | 77.1%) accounting for the largest median family size of 3.33 persons per family. On the other hand, single female/mother families (2,897 | 16.0%) represent the smallest median family size with 2.66 persons per family.
| Family Type | # Families | Family Size |
| Married-Couple | 13,927 (77.1%) | 3.33 |
| Single Male/Father | 1,247 (6.9%) | 2.85 |
| Single Female/Mother | 2,897 (16.0%) | 2.66 |
| Total Families | 18,071 (100.0%) | 3.19 |
Median Household Size in Marysville
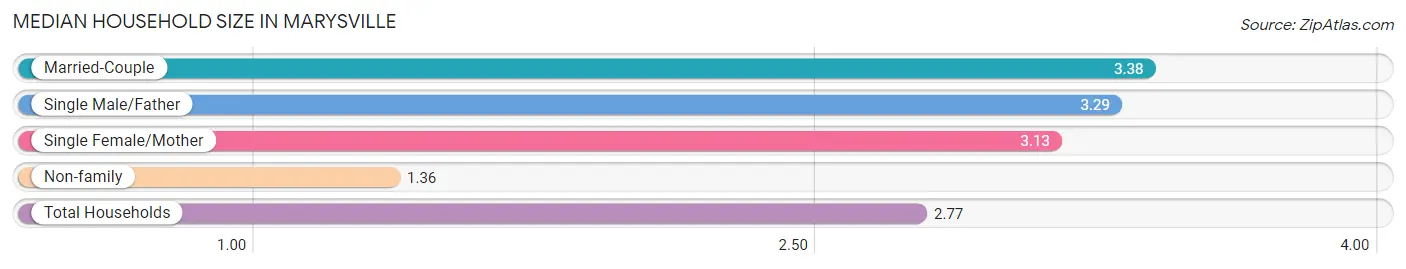
The median household size in Marysville is 2.77 persons per household, with married-couple households (13,927 | 54.8%) accounting for the largest median household size of 3.38 persons per household. non-family households (7,352 | 28.9%) represent the smallest median household size with 1.36 persons per household.
| Household Type | # Households | Household Size |
| Married-Couple | 13,927 (54.8%) | 3.38 |
| Single Male/Father | 1,247 (4.9%) | 3.29 |
| Single Female/Mother | 2,897 (11.4%) | 3.13 |
| Non-family | 7,352 (28.9%) | 1.36 |
| Total Households | 25,423 (100.0%) | 2.77 |
Household Size by Marriage Status in Marysville
Out of a total of 25,423 households in Marysville, 18,071 (71.1%) are family households, while 7,352 (28.9%) are nonfamily households. The most numerous type of family households are 2-person households, comprising 7,147, and the most common type of nonfamily households are 1-person households, comprising 5,132.
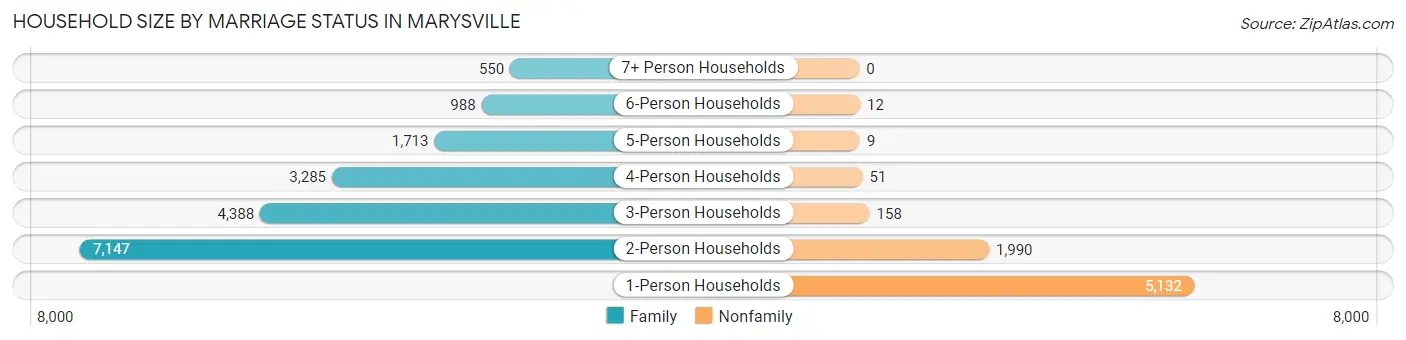
| Household Size | Family Households | Nonfamily Households |
| 1-Person Households | - | 5,132 (20.2%) |
| 2-Person Households | 7,147 (28.1%) | 1,990 (7.8%) |
| 3-Person Households | 4,388 (17.3%) | 158 (0.6%) |
| 4-Person Households | 3,285 (12.9%) | 51 (0.2%) |
| 5-Person Households | 1,713 (6.7%) | 9 (0.0%) |
| 6-Person Households | 988 (3.9%) | 12 (0.1%) |
| 7+ Person Households | 550 (2.2%) | 0 (0.0%) |
| Total | 18,071 (71.1%) | 7,352 (28.9%) |
Female Fertility in Marysville
Fertility by Age in Marysville
Average fertility rate in Marysville is 61.0 births per 1,000 women. Women in the age bracket of 20 to 34 years have the highest fertility rate with 82.0 births per 1,000 women. Women in the age bracket of 20 to 34 years acount for 61.1% of all women with births.
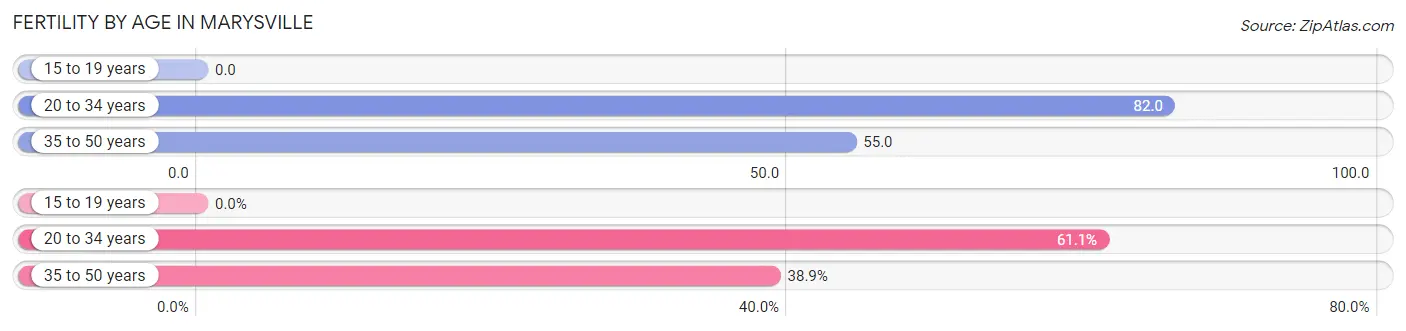
| Age Bracket | Women with Births | Births / 1,000 Women |
| 15 to 19 years | 0 (0.0%) | 0.0 |
| 20 to 34 years | 634 (61.1%) | 82.0 |
| 35 to 50 years | 403 (38.9%) | 55.0 |
| Total | 1,037 (100.0%) | 61.0 |
Fertility by Age by Marriage Status in Marysville
64.9% of women with births (1,037) in Marysville are married. The highest percentage of unmarried women with births falls into 20 to 34 years age bracket with 44.6% of them unmarried at the time of birth, while the lowest percentage of unmarried women with births belong to 35 to 50 years age bracket with 20.1% of them unmarried.
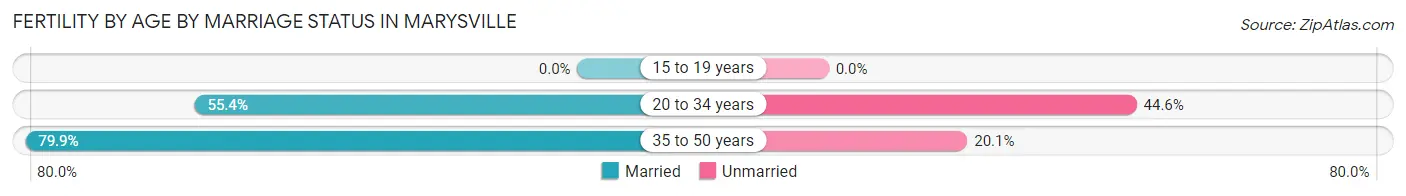
| Age Bracket | Married | Unmarried |
| 15 to 19 years | 0 (0.0%) | 0 (0.0%) |
| 20 to 34 years | 351 (55.4%) | 283 (44.6%) |
| 35 to 50 years | 322 (79.9%) | 81 (20.1%) |
| Total | 673 (64.9%) | 364 (35.1%) |
Fertility by Education in Marysville
Average fertility rate in Marysville is 61.0 births per 1,000 women. Women with the education attainment of less than high school have the highest fertility rate of 76.0 births per 1,000 women, while women with the education attainment of graduate degree have the lowest fertility at 17.0 births per 1,000 women. Women with the education attainment of college or associate's degree represent 37.8% of all women with births.
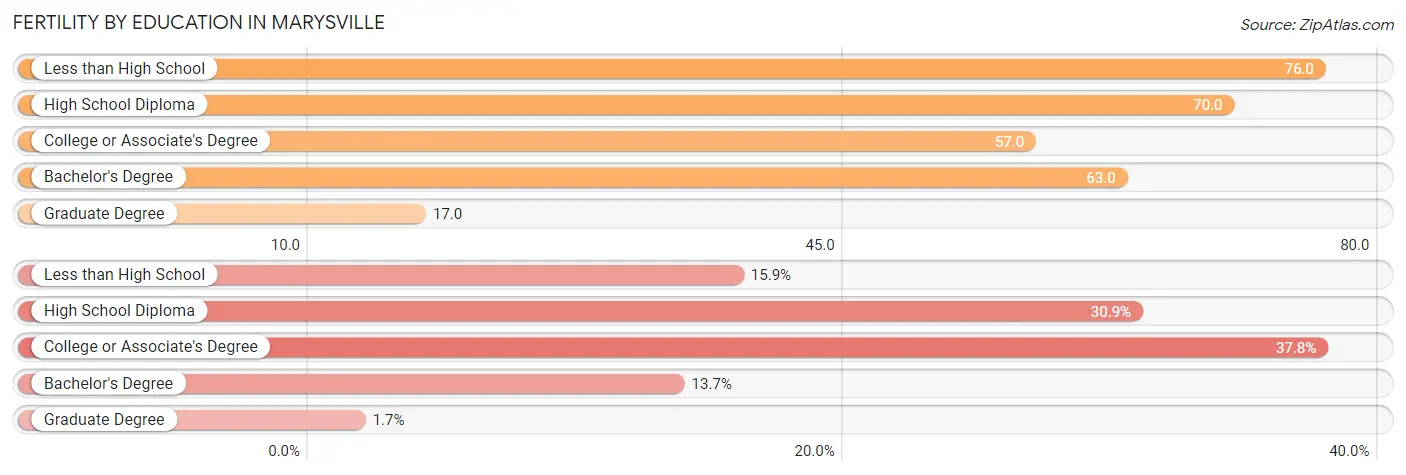
| Educational Attainment | Women with Births | Births / 1,000 Women |
| Less than High School | 165 (15.9%) | 76.0 |
| High School Diploma | 320 (30.9%) | 70.0 |
| College or Associate's Degree | 392 (37.8%) | 57.0 |
| Bachelor's Degree | 142 (13.7%) | 63.0 |
| Graduate Degree | 18 (1.7%) | 17.0 |
| Total | 1,037 (100.0%) | 61.0 |
Fertility by Education by Marriage Status in Marysville
35.1% of women with births in Marysville are unmarried. Women with the educational attainment of graduate degree are most likely to be married with 100.0% of them married at childbirth, while women with the educational attainment of less than high school are least likely to be married with 64.8% of them unmarried at childbirth.
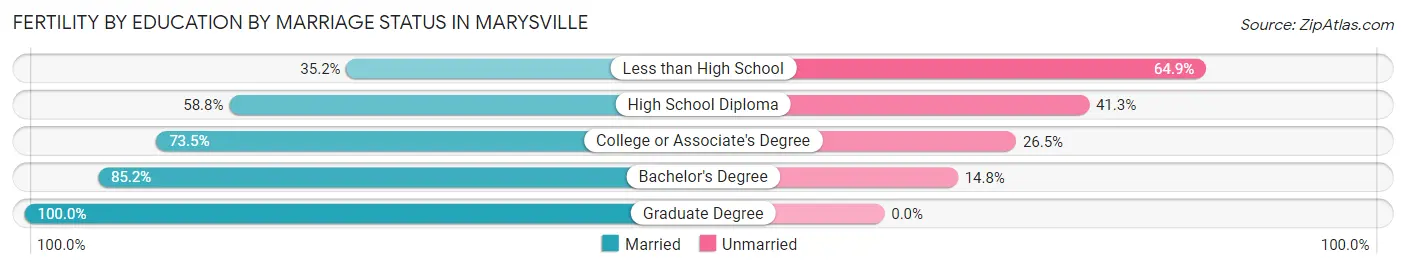
| Educational Attainment | Married | Unmarried |
| Less than High School | 58 (35.1%) | 107 (64.8%) |
| High School Diploma | 188 (58.8%) | 132 (41.2%) |
| College or Associate's Degree | 288 (73.5%) | 104 (26.5%) |
| Bachelor's Degree | 121 (85.2%) | 21 (14.8%) |
| Graduate Degree | 18 (100.0%) | 0 (0.0%) |
| Total | 673 (64.9%) | 364 (35.1%) |
Employment Characteristics in Marysville
Employment by Class of Employer in Marysville
Among the 36,181 employed individuals in Marysville, private company employees (26,520 | 73.3%), not-for-profit organizations (2,658 | 7.3%), and local government employees (2,392 | 6.6%) make up the most common classes of employment.
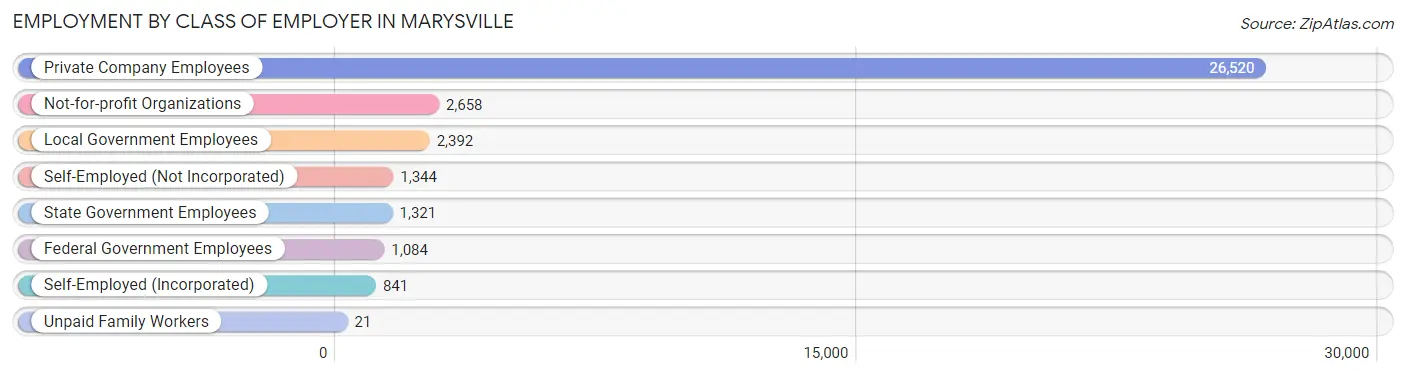
| Employer Class | # Employees | % Employees |
| Private Company Employees | 26,520 | 73.3% |
| Self-Employed (Incorporated) | 841 | 2.3% |
| Self-Employed (Not Incorporated) | 1,344 | 3.7% |
| Not-for-profit Organizations | 2,658 | 7.3% |
| Local Government Employees | 2,392 | 6.6% |
| State Government Employees | 1,321 | 3.6% |
| Federal Government Employees | 1,084 | 3.0% |
| Unpaid Family Workers | 21 | 0.1% |
| Total | 36,181 | 100.0% |
Employment Status by Age in Marysville
According to the labor force statistics for Marysville, out of the total population over 16 years of age (56,980), 67.7% or 38,575 individuals are in the labor force, with 4.2% or 1,620 of them unemployed. The age group with the highest labor force participation rate is 25 to 29 years, with 86.4% or 4,577 individuals in the labor force. Within the labor force, the 16 to 19 years age range has the highest percentage of unemployed individuals, with 13.1% or 258 of them being unemployed.
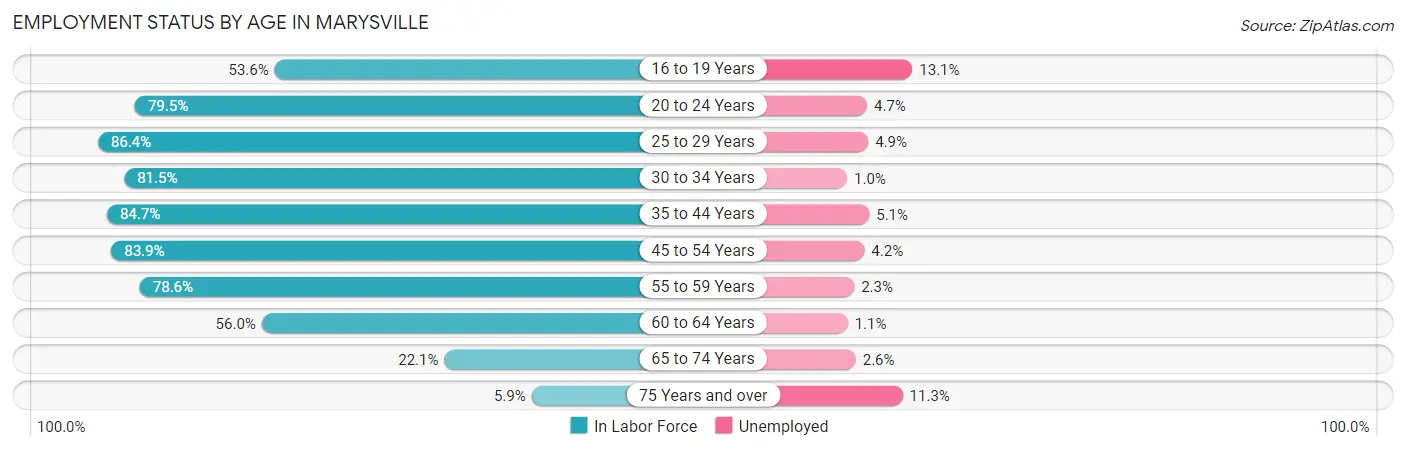
| Age Bracket | In Labor Force | Unemployed |
| 16 to 19 Years | 1,972 (53.6%) | 258 (13.1%) |
| 20 to 24 Years | 3,745 (79.5%) | 176 (4.7%) |
| 25 to 29 Years | 4,577 (86.4%) | 224 (4.9%) |
| 30 to 34 Years | 4,472 (81.5%) | 45 (1.0%) |
| 35 to 44 Years | 8,914 (84.7%) | 455 (5.1%) |
| 45 to 54 Years | 7,126 (83.9%) | 299 (4.2%) |
| 55 to 59 Years | 3,882 (78.6%) | 89 (2.3%) |
| 60 to 64 Years | 2,322 (56.0%) | 26 (1.1%) |
| 65 to 74 Years | 1,352 (22.1%) | 35 (2.6%) |
| 75 Years and over | 211 (5.9%) | 24 (11.3%) |
| Total | 38,575 (67.7%) | 1,620 (4.2%) |
Employment Status by Educational Attainment in Marysville
According to labor force statistics for Marysville, 80.5% of individuals (31,305) out of the total population between 25 and 64 years of age (38,888) are in the labor force, with 3.6% or 1,127 of them being unemployed. The group with the highest labor force participation rate are those with the educational attainment of bachelor's degree or higher, with 86.1% or 7,105 individuals in the labor force. Within the labor force, individuals with high school diploma education have the highest percentage of unemployment, with 4.2% or 407 of them being unemployed.
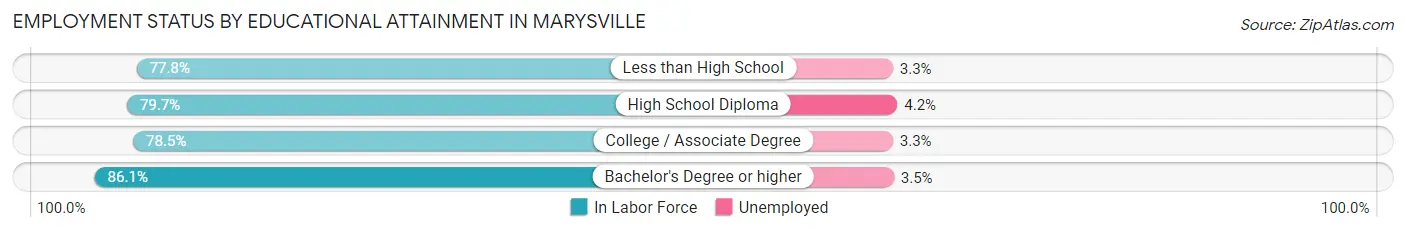
| Educational Attainment | In Labor Force | Unemployed |
| Less than High School | 2,058 (77.8%) | 87 (3.3%) |
| High School Diploma | 9,683 (79.7%) | 510 (4.2%) |
| College / Associate Degree | 12,436 (78.5%) | 523 (3.3%) |
| Bachelor's Degree or higher | 7,105 (86.1%) | 289 (3.5%) |
| Total | 31,305 (80.5%) | 1,400 (3.6%) |
Employment Occupations by Sex in Marysville
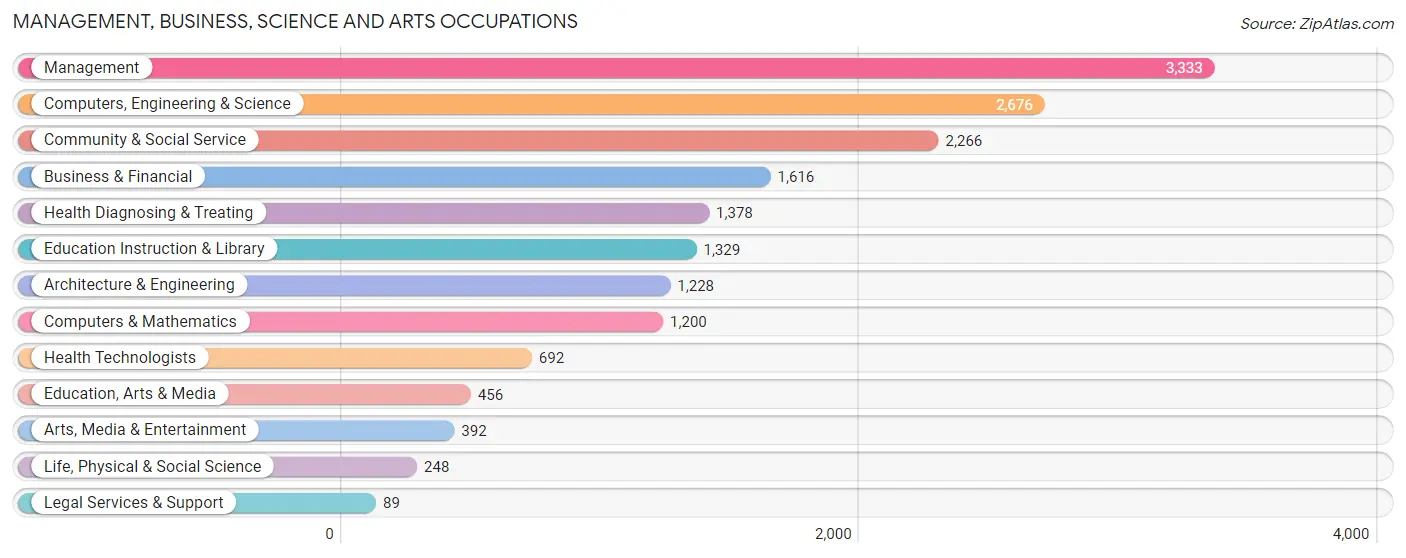
Management, Business, Science and Arts Occupations
The most common Management, Business, Science and Arts occupations in Marysville are Management (3,333 | 9.1%), Computers, Engineering & Science (2,676 | 7.3%), Community & Social Service (2,266 | 6.2%), Business & Financial (1,616 | 4.4%), and Health Diagnosing & Treating (1,378 | 3.8%).
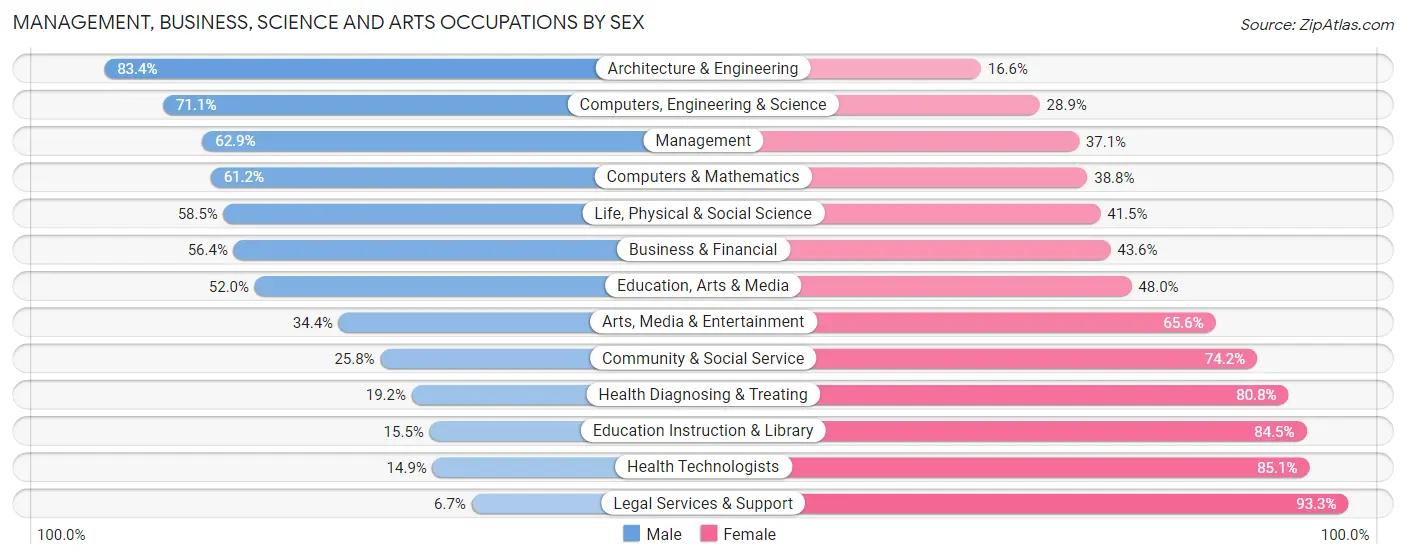
Management, Business, Science and Arts Occupations by Sex
Within the Management, Business, Science and Arts occupations in Marysville, the most male-oriented occupations are Architecture & Engineering (83.4%), Computers, Engineering & Science (71.1%), and Management (62.9%), while the most female-oriented occupations are Legal Services & Support (93.3%), Health Technologists (85.1%), and Education Instruction & Library (84.5%).
| Occupation | Male | Female |
| Management | 2,097 (62.9%) | 1,236 (37.1%) |
| Business & Financial | 911 (56.4%) | 705 (43.6%) |
| Computers, Engineering & Science | 1,903 (71.1%) | 773 (28.9%) |
| Computers & Mathematics | 734 (61.2%) | 466 (38.8%) |
| Architecture & Engineering | 1,024 (83.4%) | 204 (16.6%) |
| Life, Physical & Social Science | 145 (58.5%) | 103 (41.5%) |
| Community & Social Service | 584 (25.8%) | 1,682 (74.2%) |
| Education, Arts & Media | 237 (52.0%) | 219 (48.0%) |
| Legal Services & Support | 6 (6.7%) | 83 (93.3%) |
| Education Instruction & Library | 206 (15.5%) | 1,123 (84.5%) |
| Arts, Media & Entertainment | 135 (34.4%) | 257 (65.6%) |
| Health Diagnosing & Treating | 265 (19.2%) | 1,113 (80.8%) |
| Health Technologists | 103 (14.9%) | 589 (85.1%) |
| Total (Category) | 5,760 (51.1%) | 5,509 (48.9%) |
| Total (Overall) | 19,931 (54.5%) | 16,635 (45.5%) |
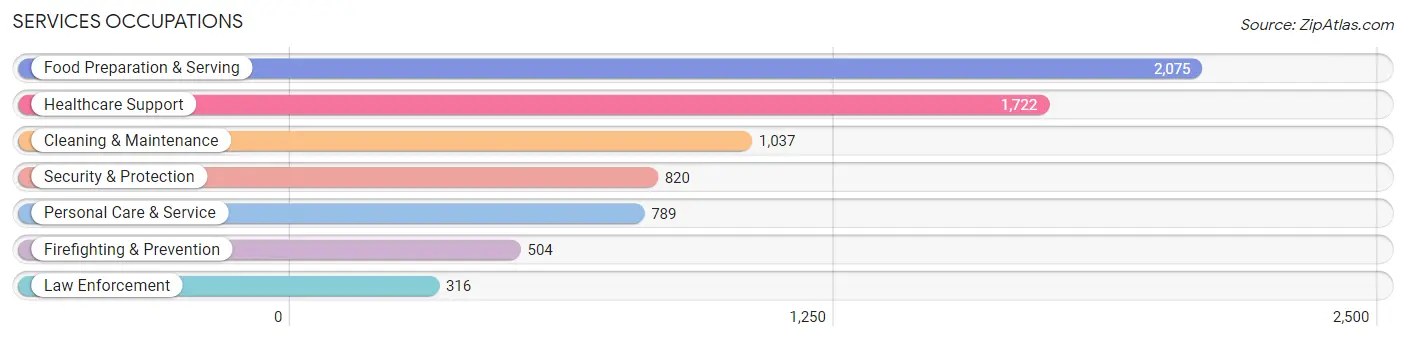
Services Occupations
The most common Services occupations in Marysville are Food Preparation & Serving (2,075 | 5.7%), Healthcare Support (1,722 | 4.7%), Cleaning & Maintenance (1,037 | 2.8%), Security & Protection (820 | 2.2%), and Personal Care & Service (789 | 2.2%).
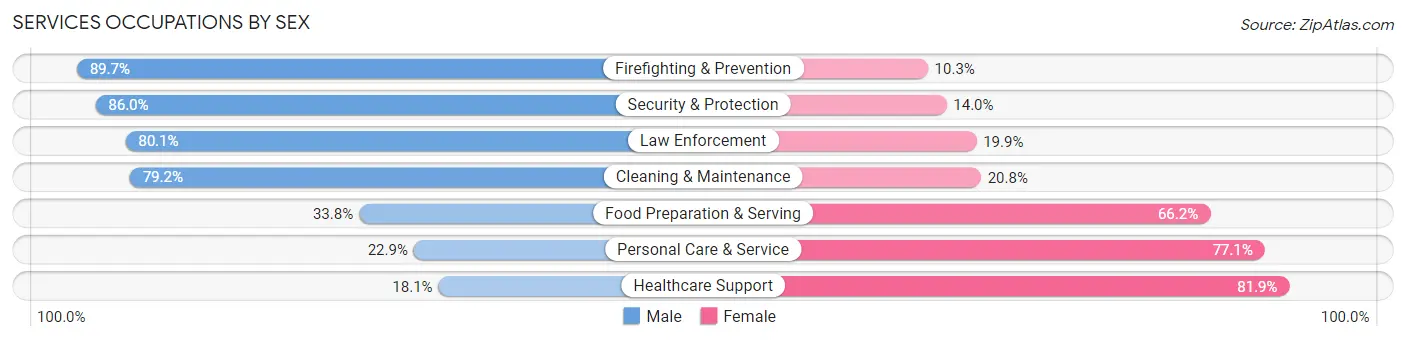
Services Occupations by Sex
Within the Services occupations in Marysville, the most male-oriented occupations are Firefighting & Prevention (89.7%), Security & Protection (86.0%), and Law Enforcement (80.1%), while the most female-oriented occupations are Healthcare Support (81.9%), Personal Care & Service (77.1%), and Food Preparation & Serving (66.2%).
| Occupation | Male | Female |
| Healthcare Support | 311 (18.1%) | 1,411 (81.9%) |
| Security & Protection | 705 (86.0%) | 115 (14.0%) |
| Firefighting & Prevention | 452 (89.7%) | 52 (10.3%) |
| Law Enforcement | 253 (80.1%) | 63 (19.9%) |
| Food Preparation & Serving | 701 (33.8%) | 1,374 (66.2%) |
| Cleaning & Maintenance | 821 (79.2%) | 216 (20.8%) |
| Personal Care & Service | 181 (22.9%) | 608 (77.1%) |
| Total (Category) | 2,719 (42.2%) | 3,724 (57.8%) |
| Total (Overall) | 19,931 (54.5%) | 16,635 (45.5%) |
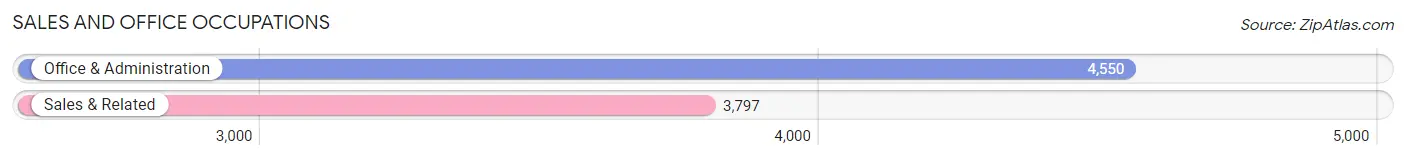
Sales and Office Occupations
The most common Sales and Office occupations in Marysville are Office & Administration (4,550 | 12.4%), and Sales & Related (3,797 | 10.4%).
Sales and Office Occupations by Sex
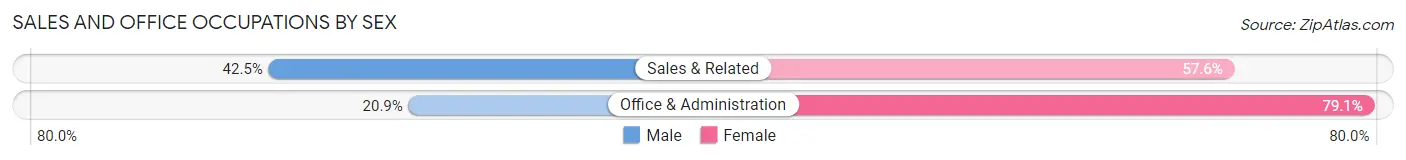
| Occupation | Male | Female |
| Sales & Related | 1,612 (42.4%) | 2,185 (57.6%) |
| Office & Administration | 952 (20.9%) | 3,598 (79.1%) |
| Total (Category) | 2,564 (30.7%) | 5,783 (69.3%) |
| Total (Overall) | 19,931 (54.5%) | 16,635 (45.5%) |
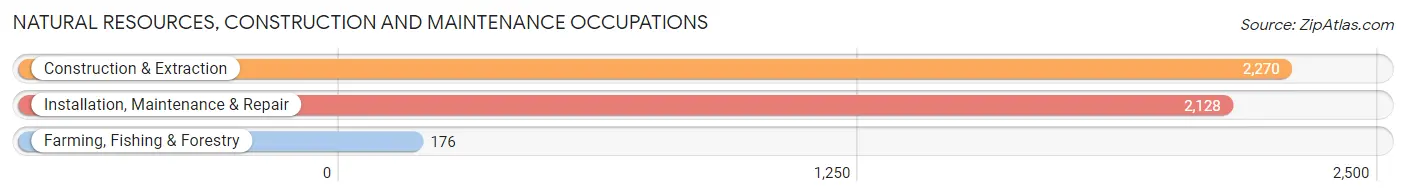
Natural Resources, Construction and Maintenance Occupations
The most common Natural Resources, Construction and Maintenance occupations in Marysville are Construction & Extraction (2,270 | 6.2%), Installation, Maintenance & Repair (2,128 | 5.8%), and Farming, Fishing & Forestry (176 | 0.5%).
Natural Resources, Construction and Maintenance Occupations by Sex
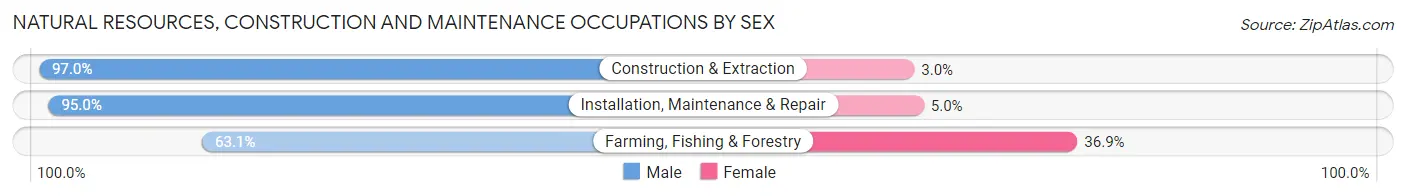
| Occupation | Male | Female |
| Farming, Fishing & Forestry | 111 (63.1%) | 65 (36.9%) |
| Construction & Extraction | 2,202 (97.0%) | 68 (3.0%) |
| Installation, Maintenance & Repair | 2,022 (95.0%) | 106 (5.0%) |
| Total (Category) | 4,335 (94.8%) | 239 (5.2%) |
| Total (Overall) | 19,931 (54.5%) | 16,635 (45.5%) |
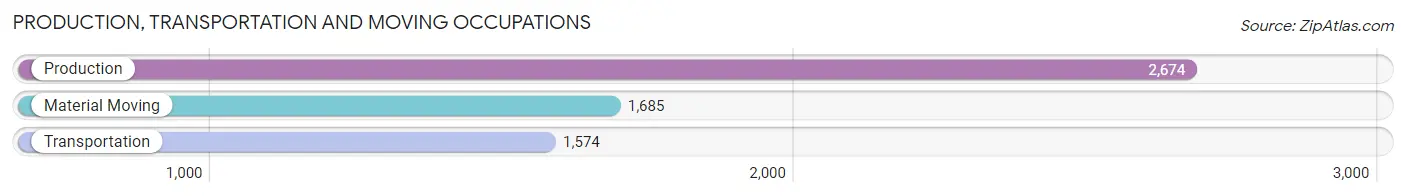
Production, Transportation and Moving Occupations
The most common Production, Transportation and Moving occupations in Marysville are Production (2,674 | 7.3%), Material Moving (1,685 | 4.6%), and Transportation (1,574 | 4.3%).
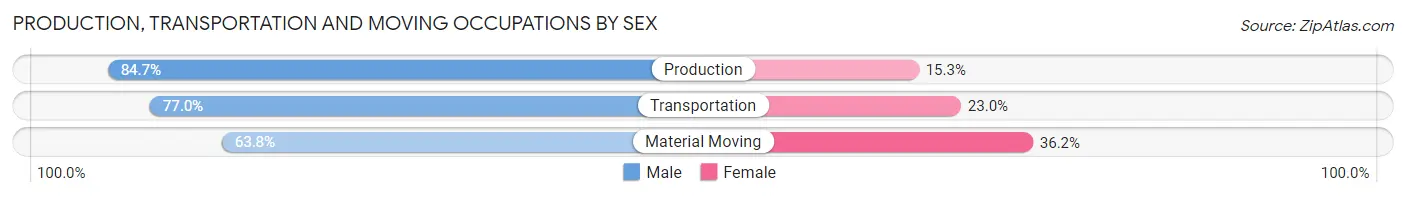
Production, Transportation and Moving Occupations by Sex
| Occupation | Male | Female |
| Production | 2,266 (84.7%) | 408 (15.3%) |
| Transportation | 1,212 (77.0%) | 362 (23.0%) |
| Material Moving | 1,075 (63.8%) | 610 (36.2%) |
| Total (Category) | 4,553 (76.7%) | 1,380 (23.3%) |
| Total (Overall) | 19,931 (54.5%) | 16,635 (45.5%) |
Employment Industries by Sex in Marysville
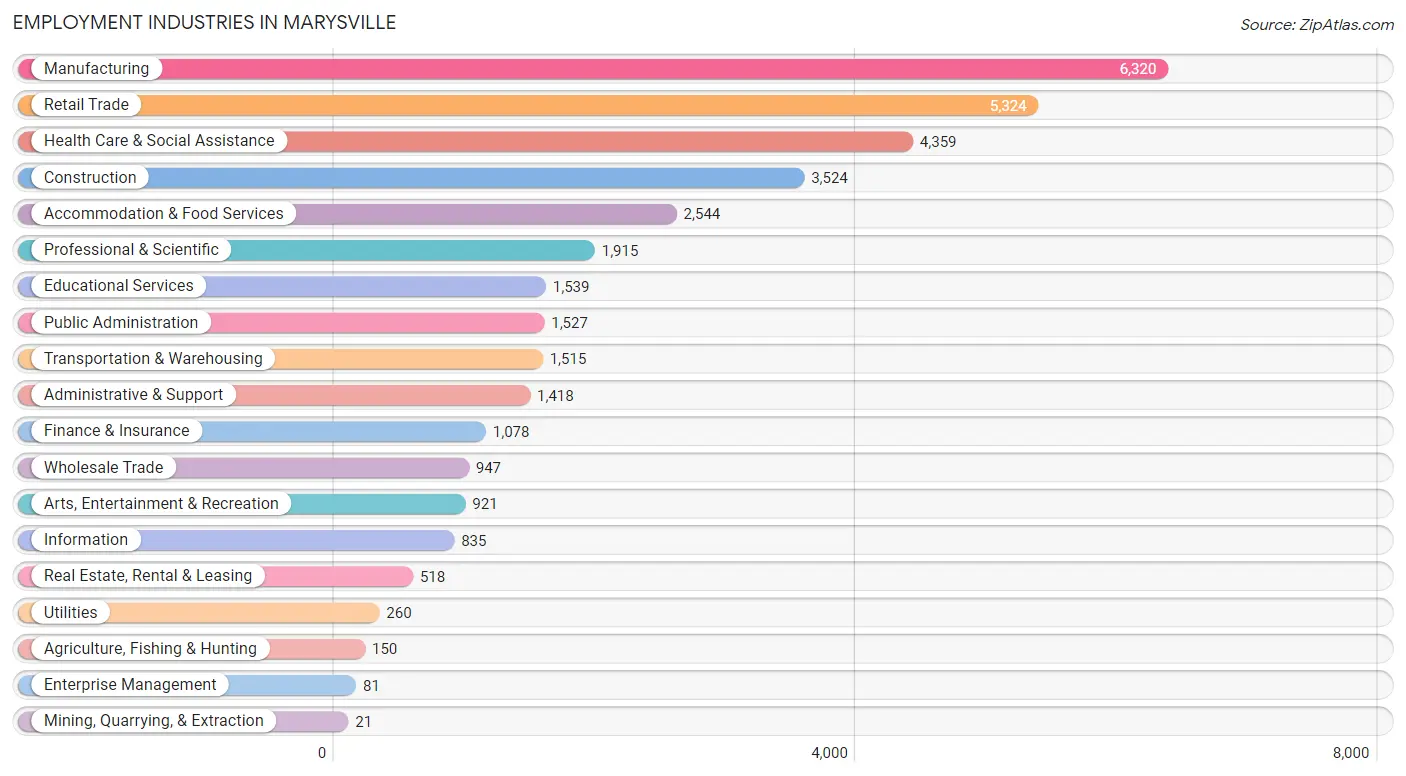
Employment Industries in Marysville
The major employment industries in Marysville include Manufacturing (6,320 | 17.3%), Retail Trade (5,324 | 14.6%), Health Care & Social Assistance (4,359 | 11.9%), Construction (3,524 | 9.6%), and Accommodation & Food Services (2,544 | 7.0%).
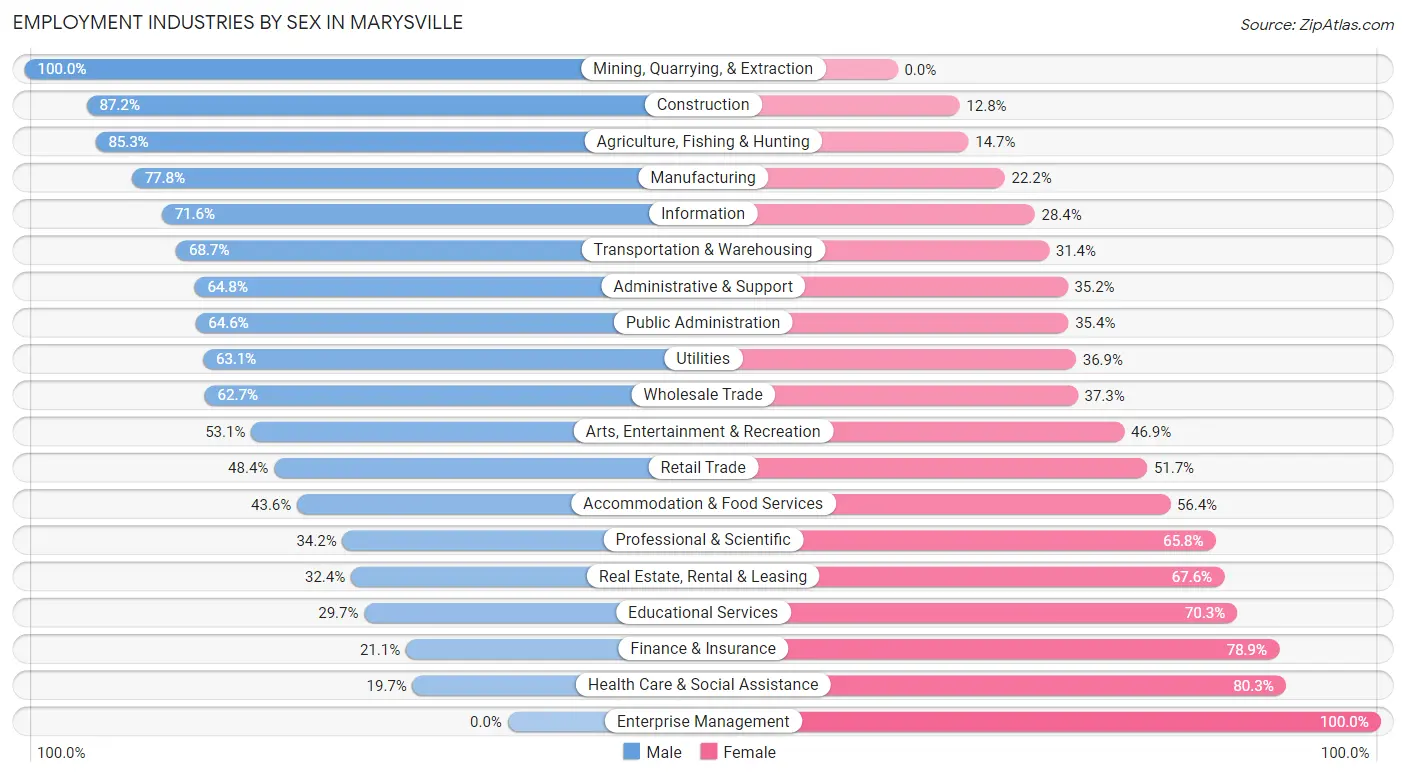
Employment Industries by Sex in Marysville
The Marysville industries that see more men than women are Mining, Quarrying, & Extraction (100.0%), Construction (87.2%), and Agriculture, Fishing & Hunting (85.3%), whereas the industries that tend to have a higher number of women are Enterprise Management (100.0%), Health Care & Social Assistance (80.3%), and Finance & Insurance (78.9%).
| Industry | Male | Female |
| Agriculture, Fishing & Hunting | 128 (85.3%) | 22 (14.7%) |
| Mining, Quarrying, & Extraction | 21 (100.0%) | 0 (0.0%) |
| Construction | 3,072 (87.2%) | 452 (12.8%) |
| Manufacturing | 4,918 (77.8%) | 1,402 (22.2%) |
| Wholesale Trade | 594 (62.7%) | 353 (37.3%) |
| Retail Trade | 2,574 (48.3%) | 2,750 (51.6%) |
| Transportation & Warehousing | 1,040 (68.6%) | 475 (31.4%) |
| Utilities | 164 (63.1%) | 96 (36.9%) |
| Information | 598 (71.6%) | 237 (28.4%) |
| Finance & Insurance | 227 (21.1%) | 851 (78.9%) |
| Real Estate, Rental & Leasing | 168 (32.4%) | 350 (67.6%) |
| Professional & Scientific | 655 (34.2%) | 1,260 (65.8%) |
| Enterprise Management | 0 (0.0%) | 81 (100.0%) |
| Administrative & Support | 919 (64.8%) | 499 (35.2%) |
| Educational Services | 457 (29.7%) | 1,082 (70.3%) |
| Health Care & Social Assistance | 858 (19.7%) | 3,501 (80.3%) |
| Arts, Entertainment & Recreation | 489 (53.1%) | 432 (46.9%) |
| Accommodation & Food Services | 1,109 (43.6%) | 1,435 (56.4%) |
| Public Administration | 987 (64.6%) | 540 (35.4%) |
| Total | 19,931 (54.5%) | 16,635 (45.5%) |
Education in Marysville
School Enrollment in Marysville
The most common levels of schooling among the 14,859 students in Marysville are elementary school (3,513 | 23.6%), high school (3,269 | 22.0%), and middle school (3,122 | 21.0%).
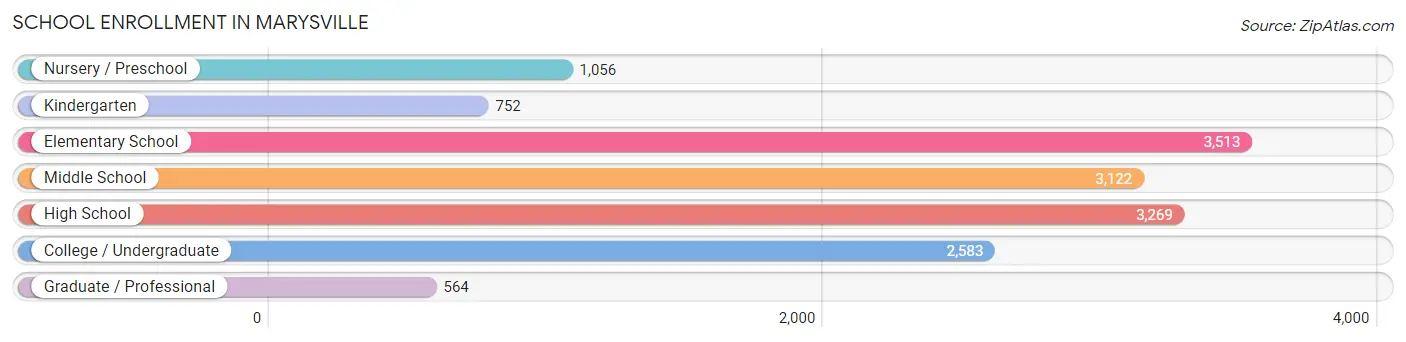
| School Level | # Students | % Students |
| Nursery / Preschool | 1,056 | 7.1% |
| Kindergarten | 752 | 5.1% |
| Elementary School | 3,513 | 23.6% |
| Middle School | 3,122 | 21.0% |
| High School | 3,269 | 22.0% |
| College / Undergraduate | 2,583 | 17.4% |
| Graduate / Professional | 564 | 3.8% |
| Total | 14,859 | 100.0% |
School Enrollment by Age by Funding Source in Marysville
Out of a total of 14,859 students who are enrolled in schools in Marysville, 2,288 (15.4%) attend a private institution, while the remaining 12,571 (84.6%) are enrolled in public schools. The age group of 3 to 4 year olds has the highest likelihood of being enrolled in private schools, with 402 (44.4% in the age bracket) enrolled. Conversely, the age group of 15 to 17 year olds has the lowest likelihood of being enrolled in a private school, with 2,145 (95.9% in the age bracket) attending a public institution.
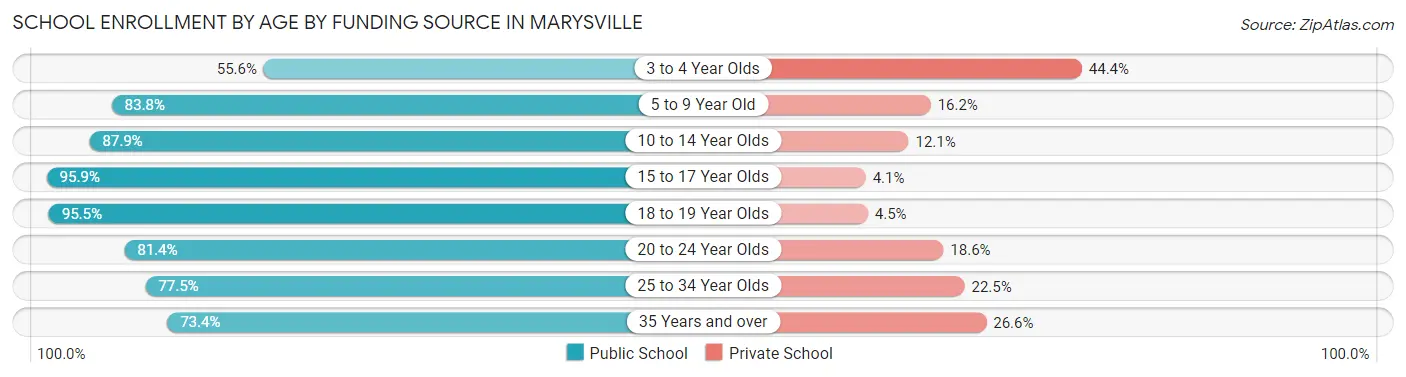
| Age Bracket | Public School | Private School |
| 3 to 4 Year Olds | 504 (55.6%) | 402 (44.4%) |
| 5 to 9 Year Old | 3,396 (83.8%) | 657 (16.2%) |
| 10 to 14 Year Olds | 3,413 (87.9%) | 469 (12.1%) |
| 15 to 17 Year Olds | 2,145 (95.9%) | 92 (4.1%) |
| 18 to 19 Year Olds | 996 (95.5%) | 47 (4.5%) |
| 20 to 24 Year Olds | 745 (81.4%) | 170 (18.6%) |
| 25 to 34 Year Olds | 637 (77.5%) | 185 (22.5%) |
| 35 Years and over | 735 (73.4%) | 266 (26.6%) |
| Total | 12,571 (84.6%) | 2,288 (15.4%) |
Educational Attainment by Field of Study in Marysville
Business (2,560 | 22.6%), engineering (1,144 | 10.1%), education (1,020 | 9.0%), social sciences (962 | 8.5%), and science & technology (870 | 7.7%) are the most common fields of study among 11,312 individuals in Marysville who have obtained a bachelor's degree or higher.
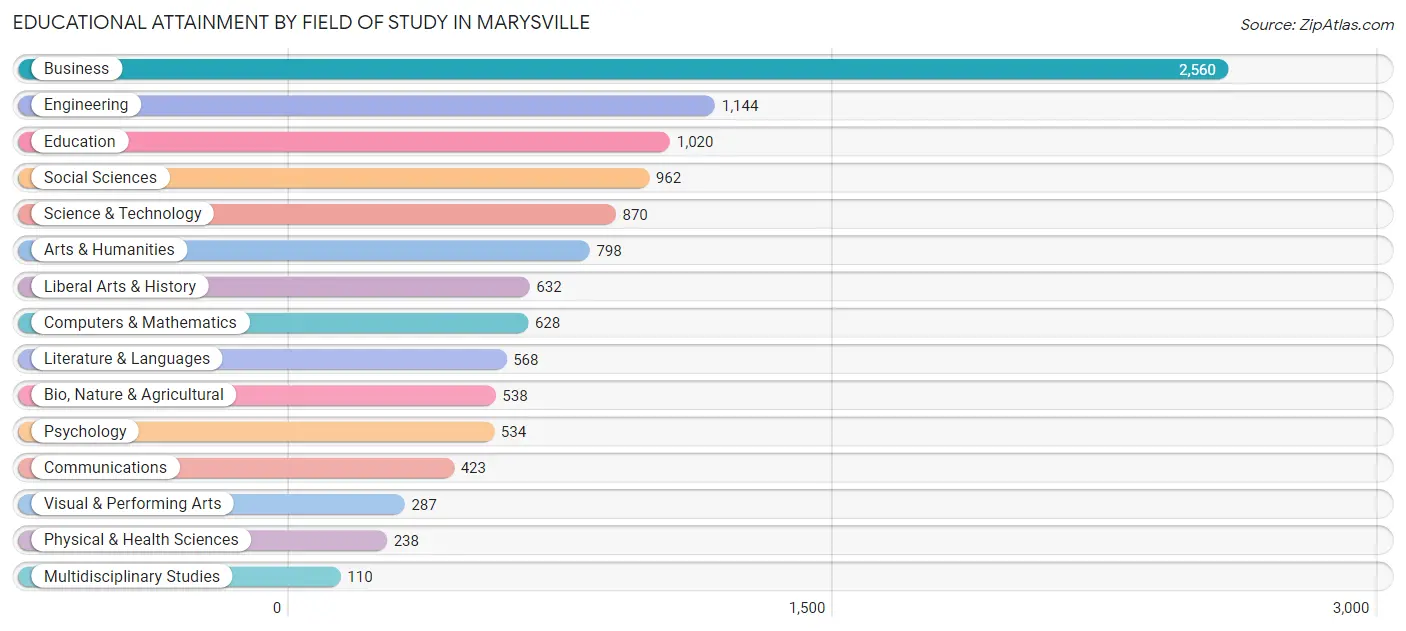
| Field of Study | # Graduates | % Graduates |
| Computers & Mathematics | 628 | 5.6% |
| Bio, Nature & Agricultural | 538 | 4.8% |
| Physical & Health Sciences | 238 | 2.1% |
| Psychology | 534 | 4.7% |
| Social Sciences | 962 | 8.5% |
| Engineering | 1,144 | 10.1% |
| Multidisciplinary Studies | 110 | 1.0% |
| Science & Technology | 870 | 7.7% |
| Business | 2,560 | 22.6% |
| Education | 1,020 | 9.0% |
| Literature & Languages | 568 | 5.0% |
| Liberal Arts & History | 632 | 5.6% |
| Visual & Performing Arts | 287 | 2.5% |
| Communications | 423 | 3.7% |
| Arts & Humanities | 798 | 7.0% |
| Total | 11,312 | 100.0% |
Transportation & Commute in Marysville
Vehicle Availability by Sex in Marysville
The most prevalent vehicle ownership categories in Marysville are males with 2 vehicles (7,632, accounting for 38.2%) and females with 2 vehicles (6,345, making up 47.1%).
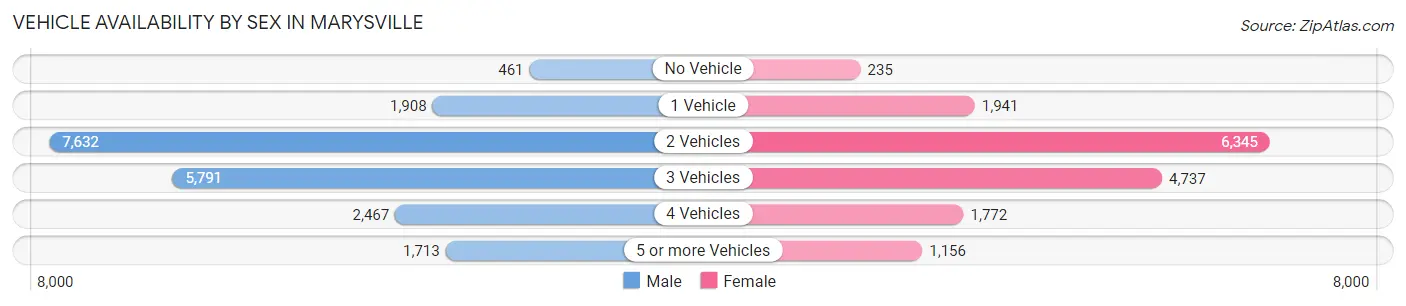
| Vehicles Available | Male | Female |
| No Vehicle | 461 (2.3%) | 235 (1.5%) |
| 1 Vehicle | 1,908 (9.6%) | 1,941 (12.0%) |
| 2 Vehicles | 7,632 (38.2%) | 6,345 (39.2%) |
| 3 Vehicles | 5,791 (29.0%) | 4,737 (29.3%) |
| 4 Vehicles | 2,467 (12.3%) | 1,772 (11.0%) |
| 5 or more Vehicles | 1,713 (8.6%) | 1,156 (7.1%) |
| Total | 19,972 (100.0%) | 16,186 (100.0%) |
Commute Time in Marysville
The most frequently occuring commute durations in Marysville are 30 to 34 minutes (5,499 commuters, 16.7%), 15 to 19 minutes (4,748 commuters, 14.4%), and 20 to 24 minutes (3,786 commuters, 11.5%).
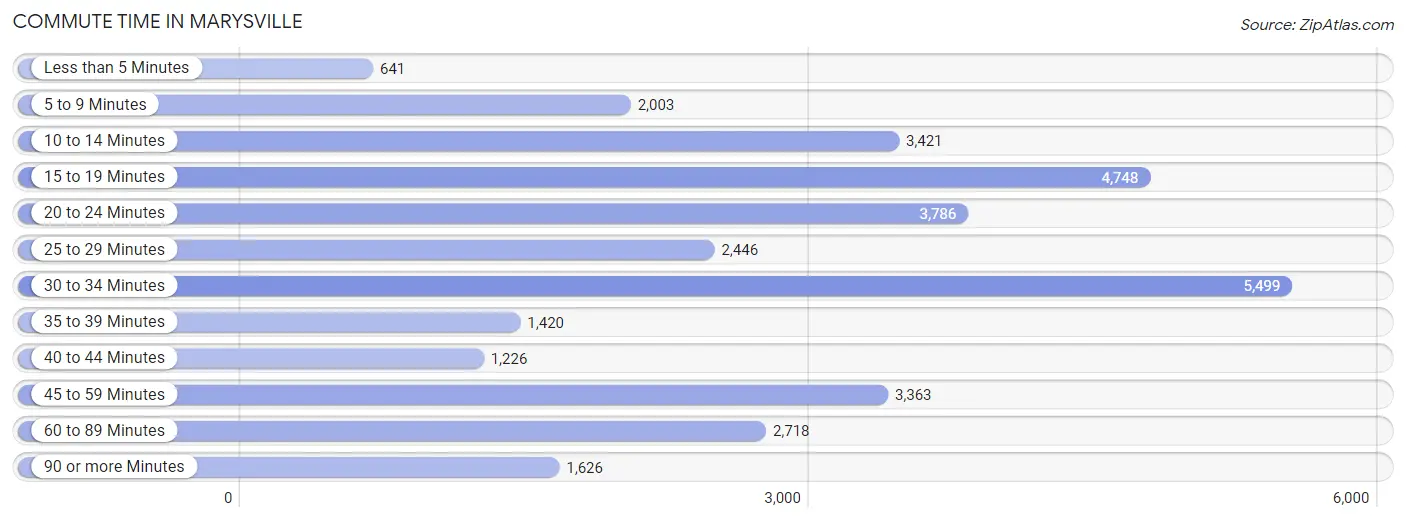
| Commute Time | # Commuters | % Commuters |
| Less than 5 Minutes | 641 | 1.9% |
| 5 to 9 Minutes | 2,003 | 6.1% |
| 10 to 14 Minutes | 3,421 | 10.4% |
| 15 to 19 Minutes | 4,748 | 14.4% |
| 20 to 24 Minutes | 3,786 | 11.5% |
| 25 to 29 Minutes | 2,446 | 7.4% |
| 30 to 34 Minutes | 5,499 | 16.7% |
| 35 to 39 Minutes | 1,420 | 4.3% |
| 40 to 44 Minutes | 1,226 | 3.7% |
| 45 to 59 Minutes | 3,363 | 10.2% |
| 60 to 89 Minutes | 2,718 | 8.3% |
| 90 or more Minutes | 1,626 | 4.9% |
Commute Time by Sex in Marysville
The most common commute times in Marysville are 30 to 34 minutes (3,536 commuters, 18.9%) for males and 15 to 19 minutes (2,700 commuters, 19.0%) for females.
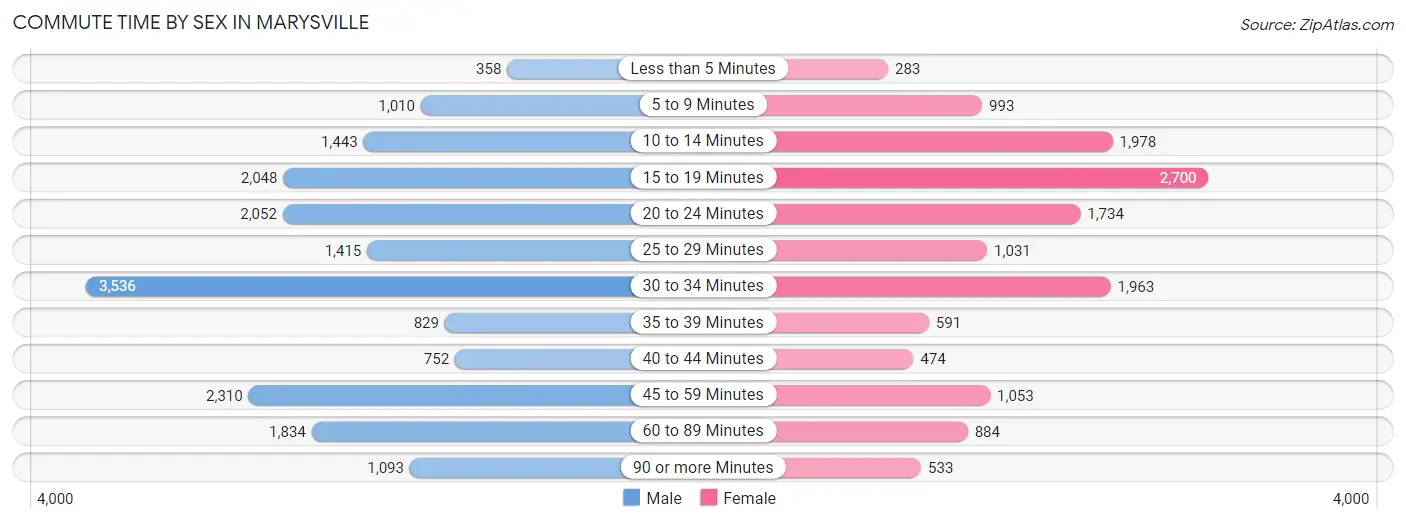
| Commute Time | Male | Female |
| Less than 5 Minutes | 358 (1.9%) | 283 (2.0%) |
| 5 to 9 Minutes | 1,010 (5.4%) | 993 (7.0%) |
| 10 to 14 Minutes | 1,443 (7.7%) | 1,978 (13.9%) |
| 15 to 19 Minutes | 2,048 (11.0%) | 2,700 (19.0%) |
| 20 to 24 Minutes | 2,052 (11.0%) | 1,734 (12.2%) |
| 25 to 29 Minutes | 1,415 (7.6%) | 1,031 (7.2%) |
| 30 to 34 Minutes | 3,536 (18.9%) | 1,963 (13.8%) |
| 35 to 39 Minutes | 829 (4.4%) | 591 (4.2%) |
| 40 to 44 Minutes | 752 (4.0%) | 474 (3.3%) |
| 45 to 59 Minutes | 2,310 (12.4%) | 1,053 (7.4%) |
| 60 to 89 Minutes | 1,834 (9.8%) | 884 (6.2%) |
| 90 or more Minutes | 1,093 (5.9%) | 533 (3.7%) |
Time of Departure to Work by Sex in Marysville
The most frequent times of departure to work in Marysville are 12:00 AM to 4:59 AM (3,108, 16.6%) for males and 12:00 PM to 3:59 PM (1,814, 12.8%) for females.
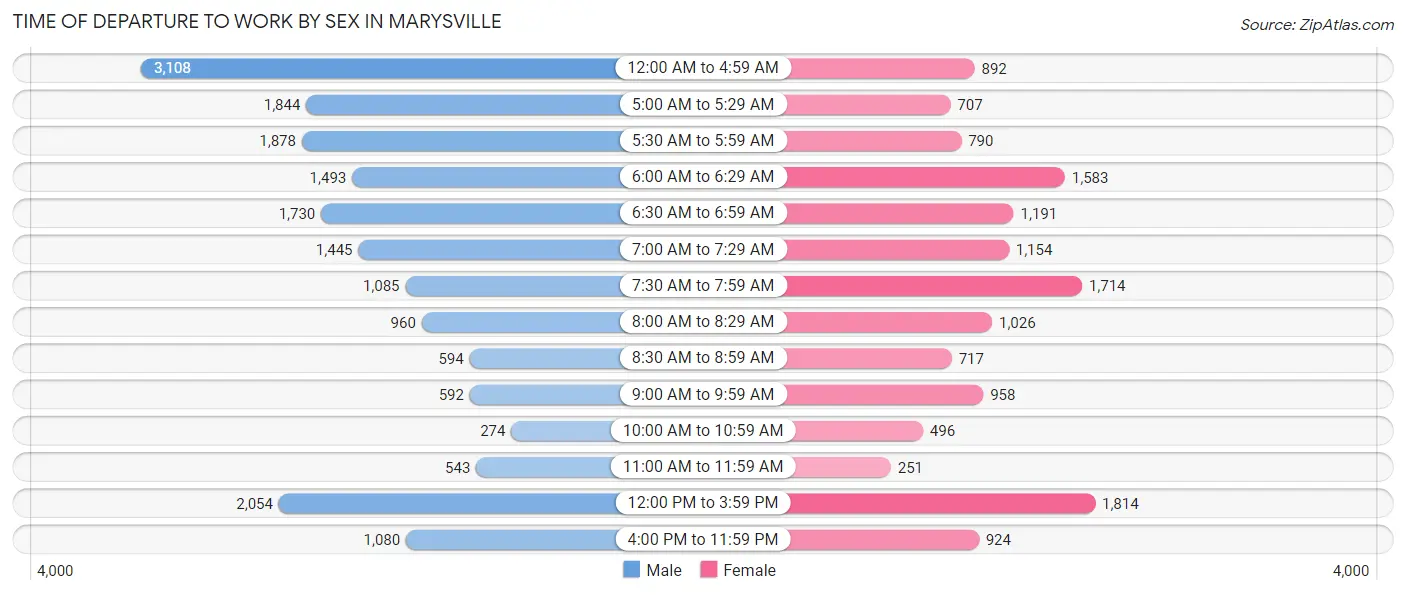
| Time of Departure | Male | Female |
| 12:00 AM to 4:59 AM | 3,108 (16.6%) | 892 (6.3%) |
| 5:00 AM to 5:29 AM | 1,844 (9.9%) | 707 (5.0%) |
| 5:30 AM to 5:59 AM | 1,878 (10.1%) | 790 (5.6%) |
| 6:00 AM to 6:29 AM | 1,493 (8.0%) | 1,583 (11.1%) |
| 6:30 AM to 6:59 AM | 1,730 (9.3%) | 1,191 (8.4%) |
| 7:00 AM to 7:29 AM | 1,445 (7.7%) | 1,154 (8.1%) |
| 7:30 AM to 7:59 AM | 1,085 (5.8%) | 1,714 (12.1%) |
| 8:00 AM to 8:29 AM | 960 (5.1%) | 1,026 (7.2%) |
| 8:30 AM to 8:59 AM | 594 (3.2%) | 717 (5.0%) |
| 9:00 AM to 9:59 AM | 592 (3.2%) | 958 (6.7%) |
| 10:00 AM to 10:59 AM | 274 (1.5%) | 496 (3.5%) |
| 11:00 AM to 11:59 AM | 543 (2.9%) | 251 (1.8%) |
| 12:00 PM to 3:59 PM | 2,054 (11.0%) | 1,814 (12.8%) |
| 4:00 PM to 11:59 PM | 1,080 (5.8%) | 924 (6.5%) |
| Total | 18,680 (100.0%) | 14,217 (100.0%) |
Housing Occupancy in Marysville
Occupancy by Ownership in Marysville
Of the total 25,423 dwellings in Marysville, owner-occupied units account for 17,984 (70.7%), while renter-occupied units make up 7,439 (29.3%).
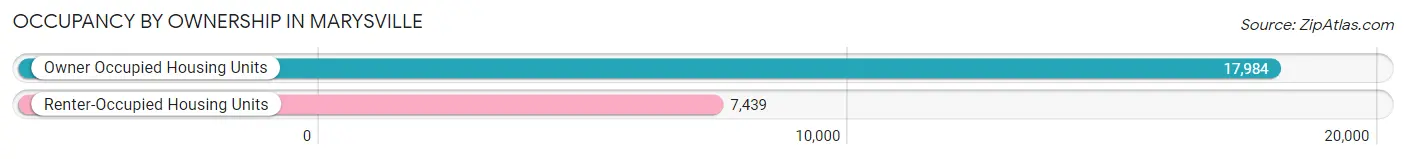
| Occupancy | # Housing Units | % Housing Units |
| Owner Occupied Housing Units | 17,984 | 70.7% |
| Renter-Occupied Housing Units | 7,439 | 29.3% |
| Total Occupied Housing Units | 25,423 | 100.0% |
Occupancy by Household Size in Marysville
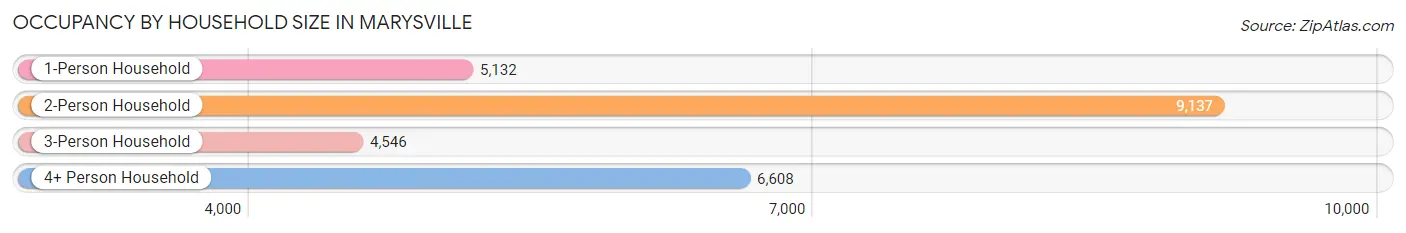
| Household Size | # Housing Units | % Housing Units |
| 1-Person Household | 5,132 | 20.2% |
| 2-Person Household | 9,137 | 35.9% |
| 3-Person Household | 4,546 | 17.9% |
| 4+ Person Household | 6,608 | 26.0% |
| Total Housing Units | 25,423 | 100.0% |
Occupancy by Ownership by Household Size in Marysville
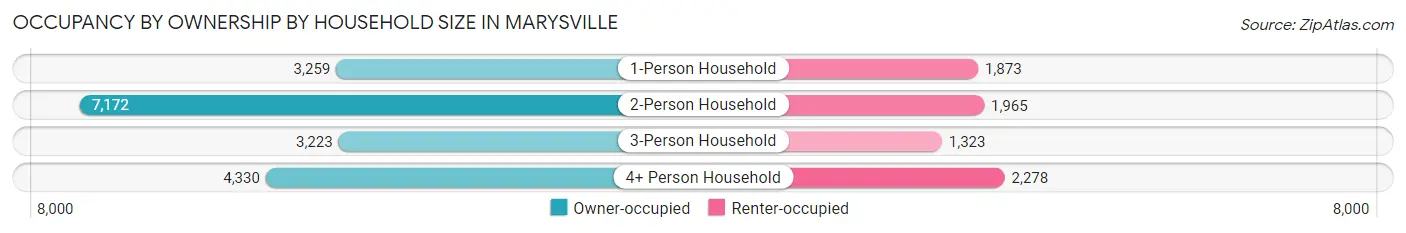
| Household Size | Owner-occupied | Renter-occupied |
| 1-Person Household | 3,259 (63.5%) | 1,873 (36.5%) |
| 2-Person Household | 7,172 (78.5%) | 1,965 (21.5%) |
| 3-Person Household | 3,223 (70.9%) | 1,323 (29.1%) |
| 4+ Person Household | 4,330 (65.5%) | 2,278 (34.5%) |
| Total Housing Units | 17,984 (70.7%) | 7,439 (29.3%) |
Occupancy by Educational Attainment in Marysville
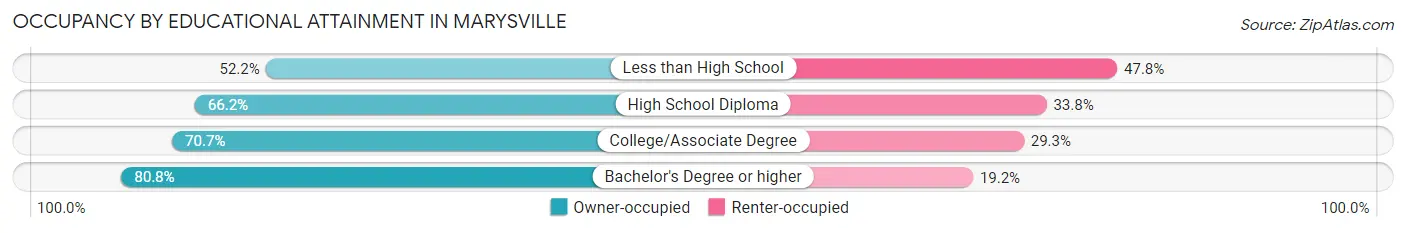
| Household Size | Owner-occupied | Renter-occupied |
| Less than High School | 819 (52.2%) | 749 (47.8%) |
| High School Diploma | 4,546 (66.2%) | 2,318 (33.8%) |
| College/Associate Degree | 7,813 (70.7%) | 3,231 (29.3%) |
| Bachelor's Degree or higher | 4,806 (80.8%) | 1,141 (19.2%) |
Occupancy by Age of Householder in Marysville
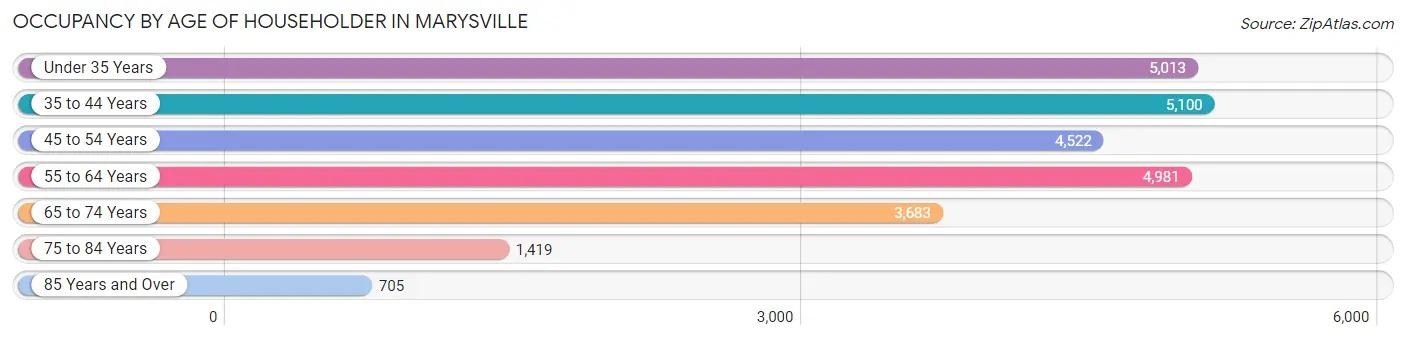
| Age Bracket | # Households | % Households |
| Under 35 Years | 5,013 | 19.7% |
| 35 to 44 Years | 5,100 | 20.1% |
| 45 to 54 Years | 4,522 | 17.8% |
| 55 to 64 Years | 4,981 | 19.6% |
| 65 to 74 Years | 3,683 | 14.5% |
| 75 to 84 Years | 1,419 | 5.6% |
| 85 Years and Over | 705 | 2.8% |
| Total | 25,423 | 100.0% |
Housing Finances in Marysville
Median Income by Occupancy in Marysville
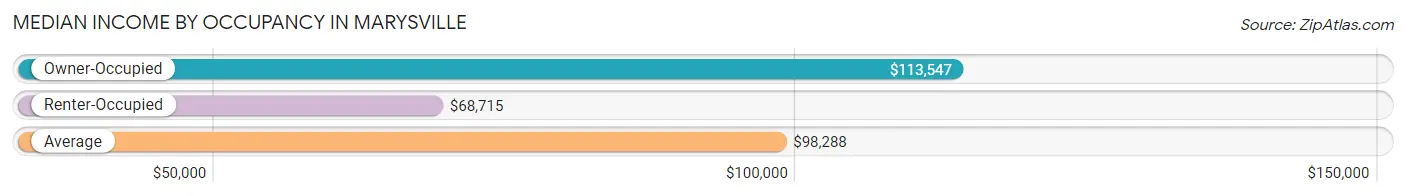
| Occupancy Type | # Households | Median Income |
| Owner-Occupied | 17,984 (70.7%) | $113,547 |
| Renter-Occupied | 7,439 (29.3%) | $68,715 |
| Average | 25,423 (100.0%) | $98,288 |
Occupancy by Householder Income Bracket in Marysville
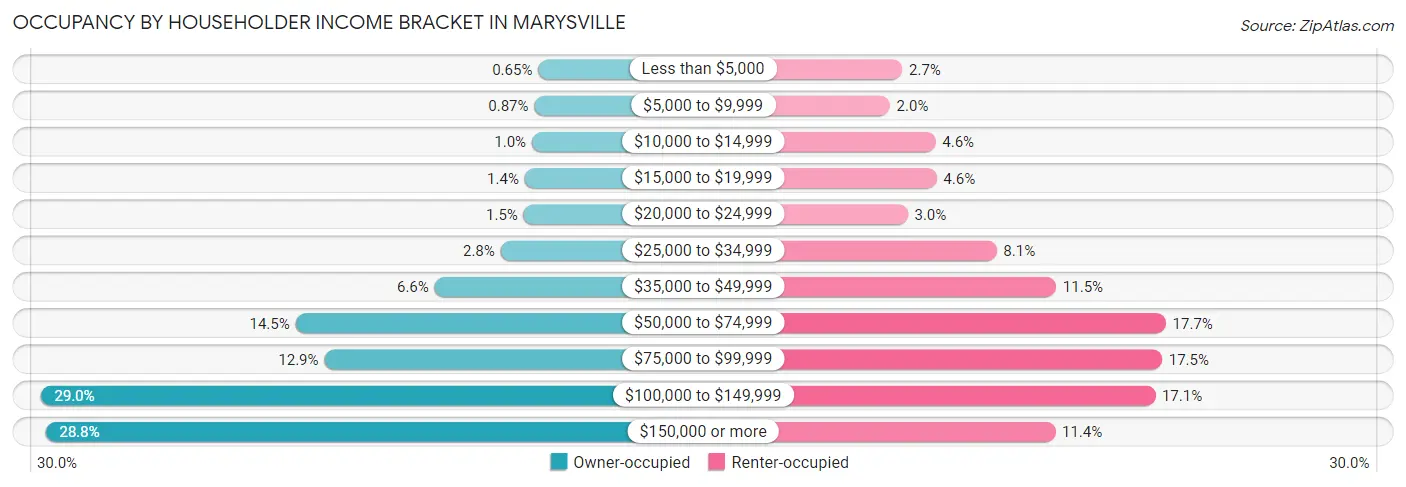
| Income Bracket | Owner-occupied | Renter-occupied |
| Less than $5,000 | 116 (0.6%) | 198 (2.7%) |
| $5,000 to $9,999 | 157 (0.9%) | 145 (1.9%) |
| $10,000 to $14,999 | 182 (1.0%) | 339 (4.6%) |
| $15,000 to $19,999 | 255 (1.4%) | 344 (4.6%) |
| $20,000 to $24,999 | 267 (1.5%) | 221 (3.0%) |
| $25,000 to $34,999 | 503 (2.8%) | 599 (8.1%) |
| $35,000 to $49,999 | 1,181 (6.6%) | 852 (11.5%) |
| $50,000 to $74,999 | 2,612 (14.5%) | 1,318 (17.7%) |
| $75,000 to $99,999 | 2,315 (12.9%) | 1,302 (17.5%) |
| $100,000 to $149,999 | 5,223 (29.0%) | 1,273 (17.1%) |
| $150,000 or more | 5,173 (28.8%) | 848 (11.4%) |
| Total | 17,984 (100.0%) | 7,439 (100.0%) |
Monthly Housing Cost Tiers in Marysville
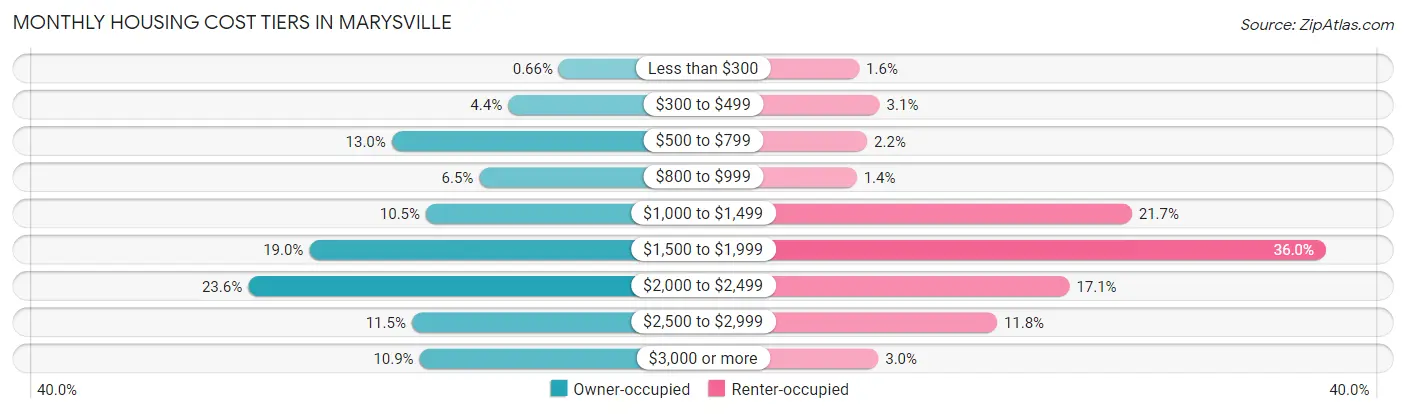
| Monthly Cost | Owner-occupied | Renter-occupied |
| Less than $300 | 118 (0.7%) | 119 (1.6%) |
| $300 to $499 | 791 (4.4%) | 231 (3.1%) |
| $500 to $799 | 2,333 (13.0%) | 163 (2.2%) |
| $800 to $999 | 1,173 (6.5%) | 106 (1.4%) |
| $1,000 to $1,499 | 1,879 (10.4%) | 1,613 (21.7%) |
| $1,500 to $1,999 | 3,425 (19.0%) | 2,676 (36.0%) |
| $2,000 to $2,499 | 4,236 (23.5%) | 1,271 (17.1%) |
| $2,500 to $2,999 | 2,066 (11.5%) | 874 (11.7%) |
| $3,000 or more | 1,963 (10.9%) | 224 (3.0%) |
| Total | 17,984 (100.0%) | 7,439 (100.0%) |
Physical Housing Characteristics in Marysville
Housing Structures in Marysville
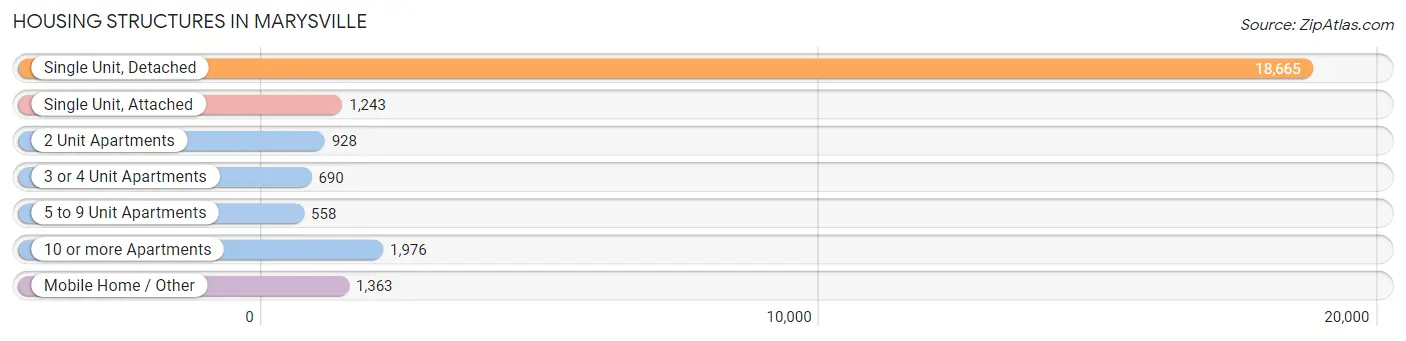
| Structure Type | # Housing Units | % Housing Units |
| Single Unit, Detached | 18,665 | 73.4% |
| Single Unit, Attached | 1,243 | 4.9% |
| 2 Unit Apartments | 928 | 3.6% |
| 3 or 4 Unit Apartments | 690 | 2.7% |
| 5 to 9 Unit Apartments | 558 | 2.2% |
| 10 or more Apartments | 1,976 | 7.8% |
| Mobile Home / Other | 1,363 | 5.4% |
| Total | 25,423 | 100.0% |
Housing Structures by Occupancy in Marysville
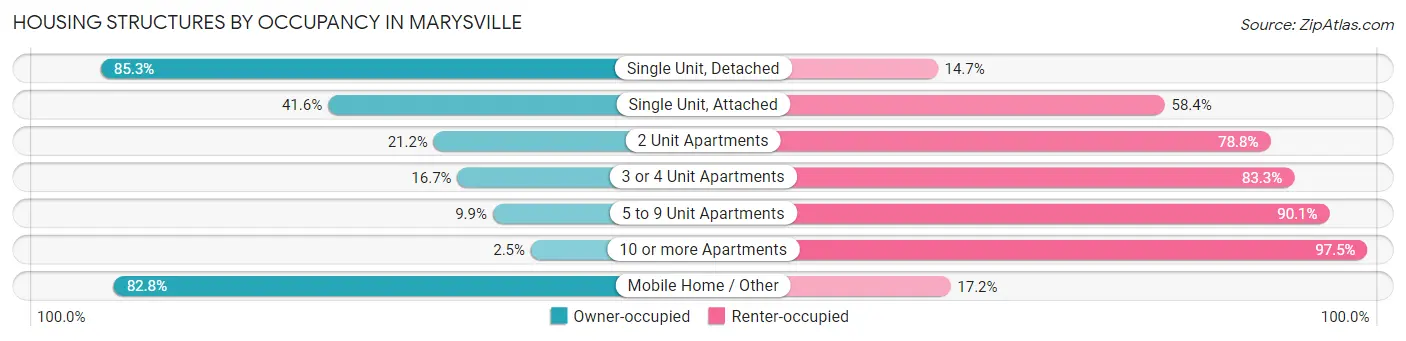
| Structure Type | Owner-occupied | Renter-occupied |
| Single Unit, Detached | 15,921 (85.3%) | 2,744 (14.7%) |
| Single Unit, Attached | 517 (41.6%) | 726 (58.4%) |
| 2 Unit Apartments | 197 (21.2%) | 731 (78.8%) |
| 3 or 4 Unit Apartments | 115 (16.7%) | 575 (83.3%) |
| 5 to 9 Unit Apartments | 55 (9.9%) | 503 (90.1%) |
| 10 or more Apartments | 50 (2.5%) | 1,926 (97.5%) |
| Mobile Home / Other | 1,129 (82.8%) | 234 (17.2%) |
| Total | 17,984 (70.7%) | 7,439 (29.3%) |
Housing Structures by Number of Rooms in Marysville
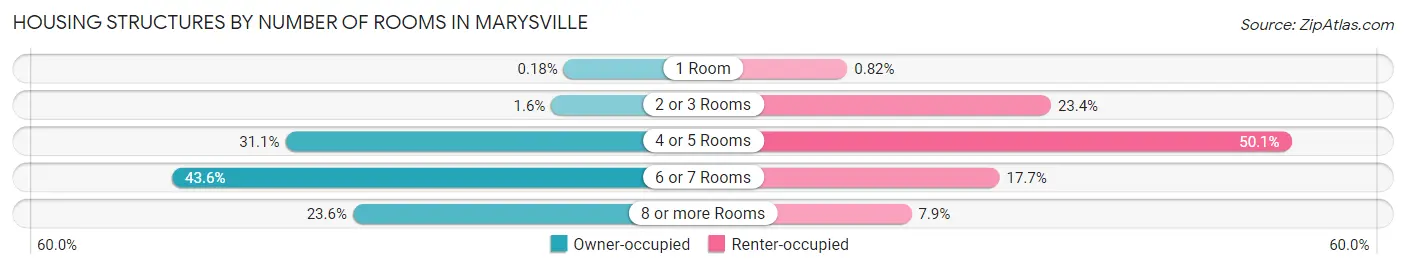
| Number of Rooms | Owner-occupied | Renter-occupied |
| 1 Room | 32 (0.2%) | 61 (0.8%) |
| 2 or 3 Rooms | 281 (1.6%) | 1,742 (23.4%) |
| 4 or 5 Rooms | 5,587 (31.1%) | 3,727 (50.1%) |
| 6 or 7 Rooms | 7,844 (43.6%) | 1,318 (17.7%) |
| 8 or more Rooms | 4,240 (23.6%) | 591 (7.9%) |
| Total | 17,984 (100.0%) | 7,439 (100.0%) |
Housing Structure by Heating Type in Marysville
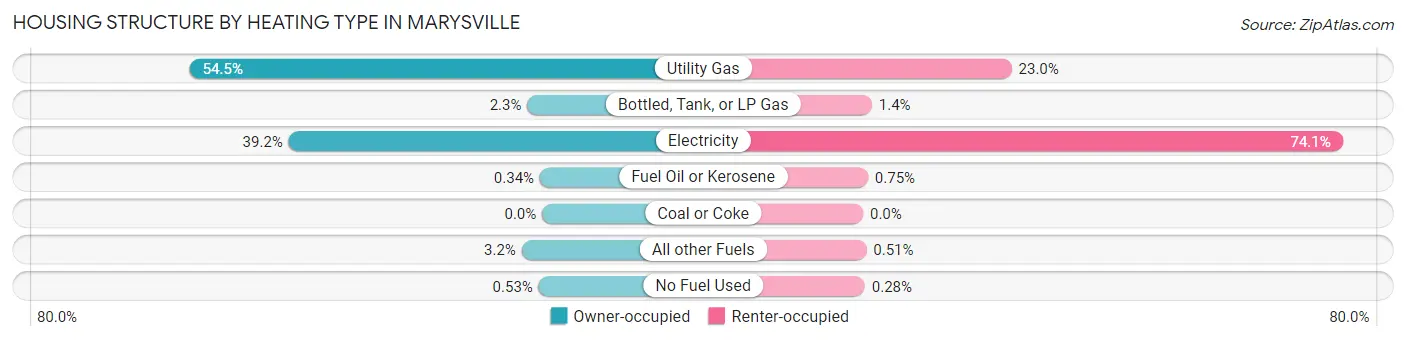
| Heating Type | Owner-occupied | Renter-occupied |
| Utility Gas | 9,802 (54.5%) | 1,709 (23.0%) |
| Bottled, Tank, or LP Gas | 411 (2.3%) | 101 (1.4%) |
| Electricity | 7,046 (39.2%) | 5,514 (74.1%) |
| Fuel Oil or Kerosene | 61 (0.3%) | 56 (0.7%) |
| Coal or Coke | 0 (0.0%) | 0 (0.0%) |
| All other Fuels | 568 (3.2%) | 38 (0.5%) |
| No Fuel Used | 96 (0.5%) | 21 (0.3%) |
| Total | 17,984 (100.0%) | 7,439 (100.0%) |
Household Vehicle Usage in Marysville
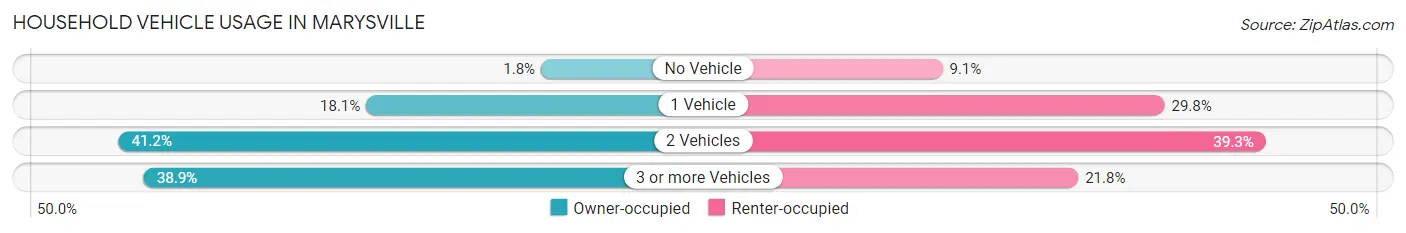
| Vehicles per Household | Owner-occupied | Renter-occupied |
| No Vehicle | 323 (1.8%) | 678 (9.1%) |
| 1 Vehicle | 3,259 (18.1%) | 2,220 (29.8%) |
| 2 Vehicles | 7,414 (41.2%) | 2,921 (39.3%) |
| 3 or more Vehicles | 6,988 (38.9%) | 1,620 (21.8%) |
| Total | 17,984 (100.0%) | 7,439 (100.0%) |
Real Estate & Mortgages in Marysville
Real Estate and Mortgage Overview in Marysville
| Characteristic | Without Mortgage | With Mortgage |
| Housing Units | 4,537 | 13,447 |
| Median Property Value | $418,800 | $465,800 |
| Median Household Income | $82,075 | $4,254 |
| Monthly Housing Costs | $685 | $1,948 |
| Real Estate Taxes | $3,616 | $278 |
Property Value by Mortgage Status in Marysville
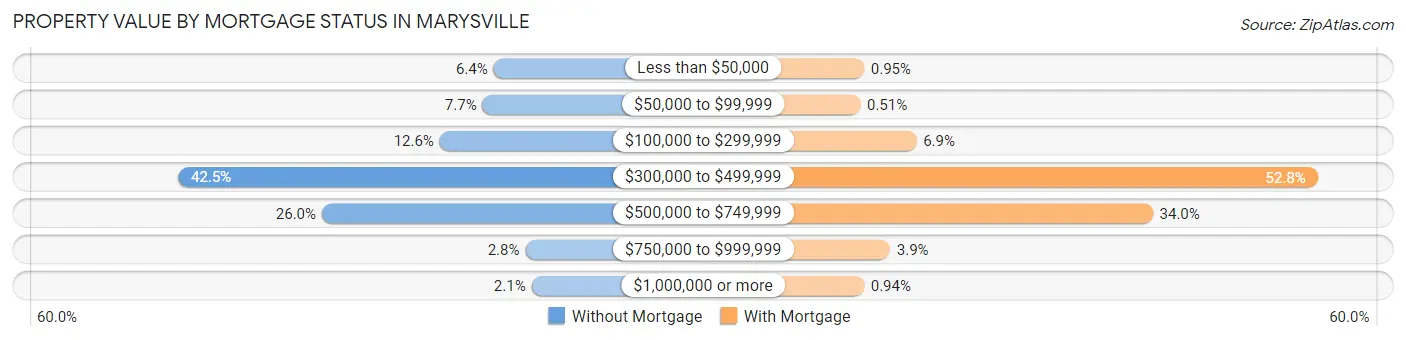
| Property Value | Without Mortgage | With Mortgage |
| Less than $50,000 | 291 (6.4%) | 128 (0.9%) |
| $50,000 to $99,999 | 348 (7.7%) | 68 (0.5%) |
| $100,000 to $299,999 | 570 (12.6%) | 932 (6.9%) |
| $300,000 to $499,999 | 1,927 (42.5%) | 7,101 (52.8%) |
| $500,000 to $749,999 | 1,181 (26.0%) | 4,565 (34.0%) |
| $750,000 to $999,999 | 126 (2.8%) | 527 (3.9%) |
| $1,000,000 or more | 94 (2.1%) | 126 (0.9%) |
| Total | 4,537 (100.0%) | 13,447 (100.0%) |
Household Income by Mortgage Status in Marysville
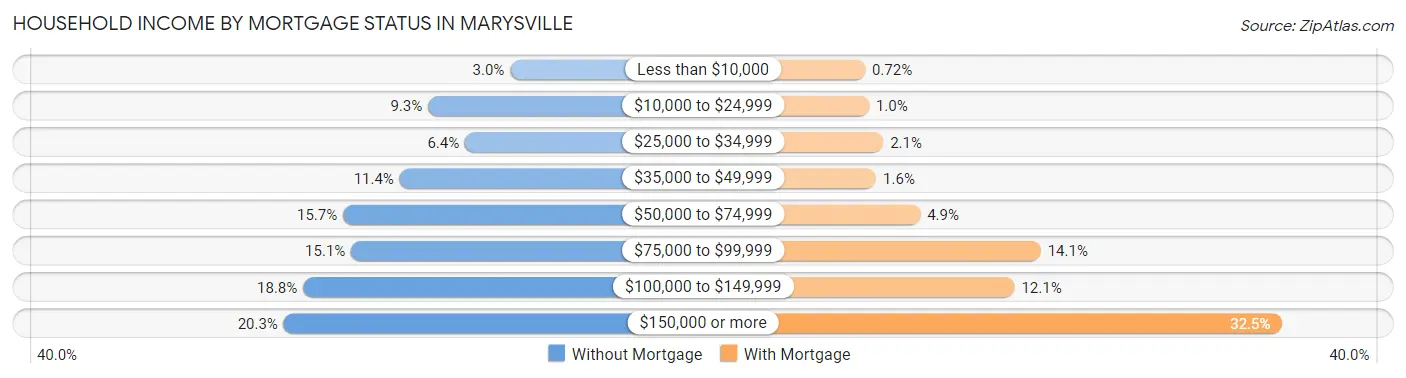
| Household Income | Without Mortgage | With Mortgage |
| Less than $10,000 | 136 (3.0%) | 97 (0.7%) |
| $10,000 to $24,999 | 420 (9.3%) | 137 (1.0%) |
| $25,000 to $34,999 | 292 (6.4%) | 284 (2.1%) |
| $35,000 to $49,999 | 518 (11.4%) | 211 (1.6%) |
| $50,000 to $74,999 | 714 (15.7%) | 663 (4.9%) |
| $75,000 to $99,999 | 686 (15.1%) | 1,898 (14.1%) |
| $100,000 to $149,999 | 852 (18.8%) | 1,629 (12.1%) |
| $150,000 or more | 919 (20.3%) | 4,371 (32.5%) |
| Total | 4,537 (100.0%) | 13,447 (100.0%) |
Property Value to Household Income Ratio in Marysville
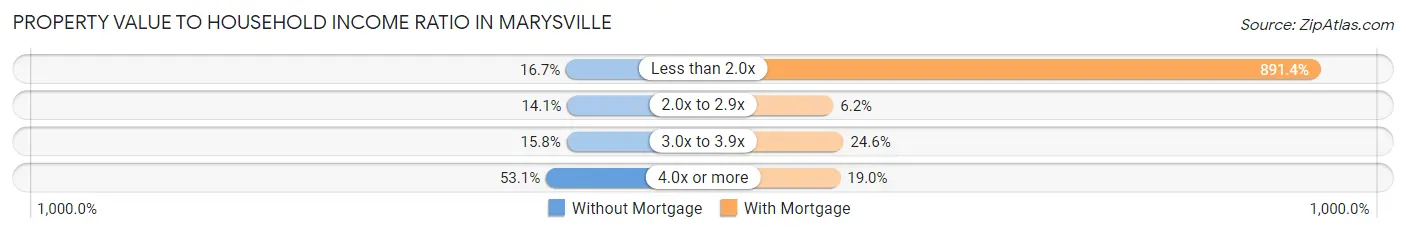
| Value-to-Income Ratio | Without Mortgage | With Mortgage |
| Less than 2.0x | 758 (16.7%) | 119,862 (891.4%) |
| 2.0x to 2.9x | 641 (14.1%) | 833 (6.2%) |
| 3.0x to 3.9x | 715 (15.8%) | 3,306 (24.6%) |
| 4.0x or more | 2,408 (53.1%) | 2,552 (19.0%) |
| Total | 4,537 (100.0%) | 13,447 (100.0%) |
Real Estate Taxes by Mortgage Status in Marysville
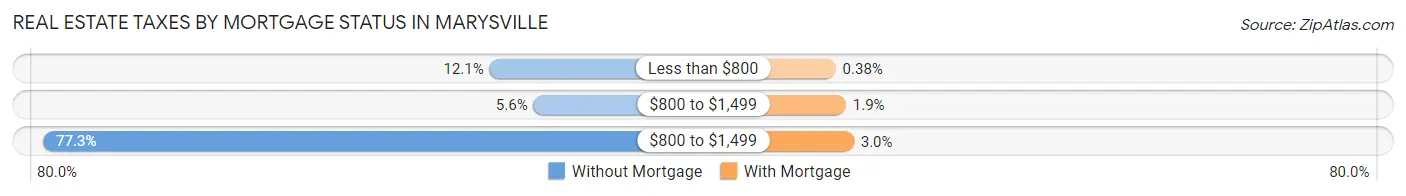
| Property Taxes | Without Mortgage | With Mortgage |
| Less than $800 | 547 (12.1%) | 51 (0.4%) |
| $800 to $1,499 | 256 (5.6%) | 252 (1.9%) |
| $800 to $1,499 | 3,507 (77.3%) | 407 (3.0%) |
| Total | 4,537 (100.0%) | 13,447 (100.0%) |
Health & Disability in Marysville
Health Insurance Coverage by Age in Marysville
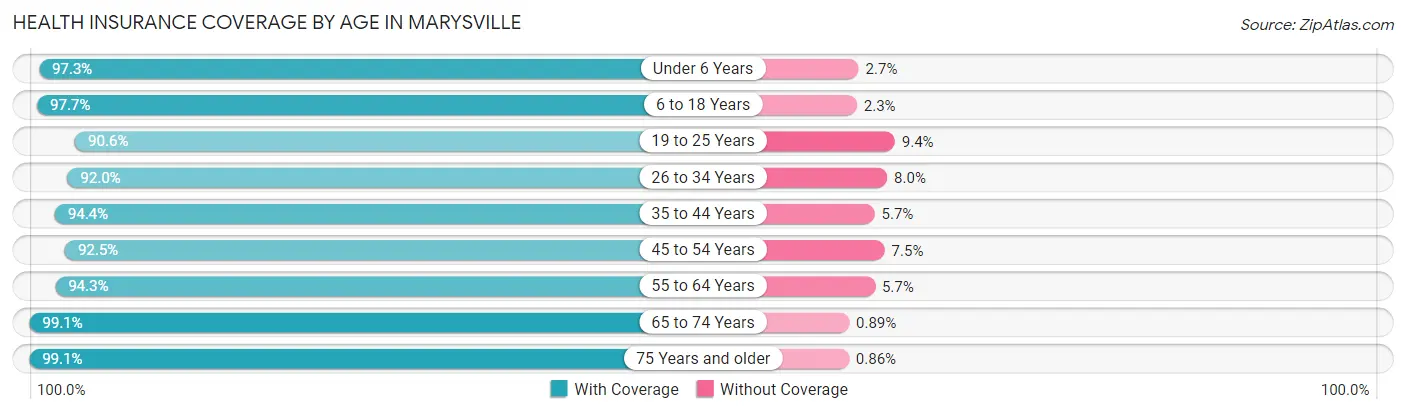
| Age Bracket | With Coverage | Without Coverage |
| Under 6 Years | 5,447 (97.3%) | 150 (2.7%) |
| 6 to 18 Years | 10,930 (97.7%) | 262 (2.3%) |
| 19 to 25 Years | 5,858 (90.6%) | 609 (9.4%) |
| 26 to 34 Years | 8,741 (92.0%) | 759 (8.0%) |
| 35 to 44 Years | 9,828 (94.4%) | 589 (5.7%) |
| 45 to 54 Years | 7,837 (92.5%) | 638 (7.5%) |
| 55 to 64 Years | 8,540 (94.3%) | 518 (5.7%) |
| 65 to 74 Years | 6,030 (99.1%) | 54 (0.9%) |
| 75 Years and older | 3,362 (99.1%) | 29 (0.9%) |
| Total | 66,573 (94.9%) | 3,608 (5.1%) |
Health Insurance Coverage by Citizenship Status in Marysville
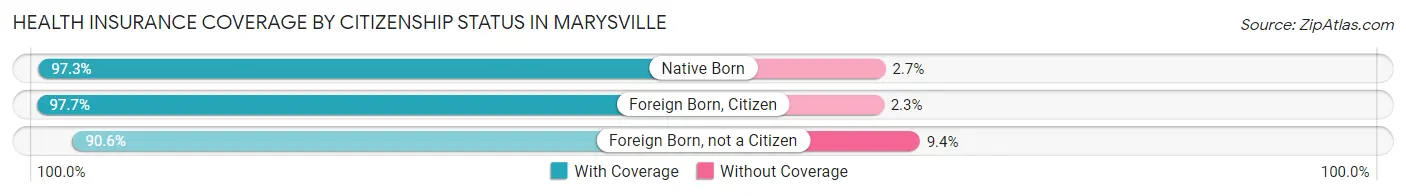
| Citizenship Status | With Coverage | Without Coverage |
| Native Born | 5,447 (97.3%) | 150 (2.7%) |
| Foreign Born, Citizen | 10,930 (97.7%) | 262 (2.3%) |
| Foreign Born, not a Citizen | 5,858 (90.6%) | 609 (9.4%) |
Health Insurance Coverage by Household Income in Marysville
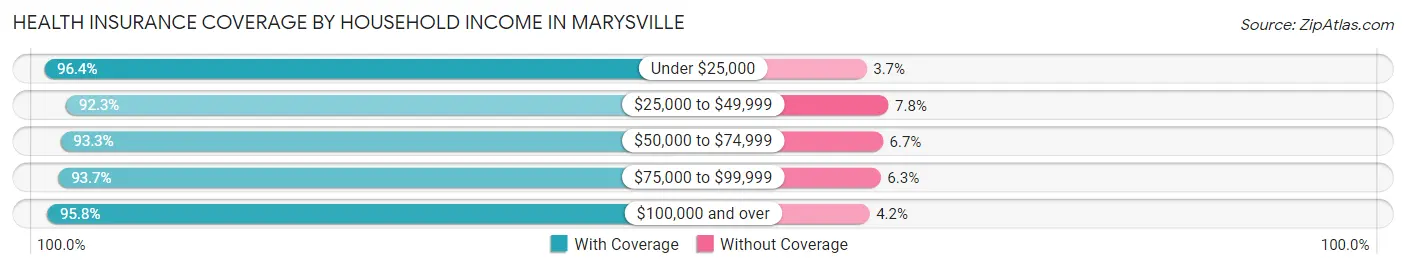
| Household Income | With Coverage | Without Coverage |
| Under $25,000 | 3,694 (96.4%) | 140 (3.6%) |
| $25,000 to $49,999 | 5,729 (92.2%) | 481 (7.7%) |
| $50,000 to $74,999 | 8,881 (93.3%) | 639 (6.7%) |
| $75,000 to $99,999 | 9,733 (93.7%) | 654 (6.3%) |
| $100,000 and over | 38,313 (95.8%) | 1,678 (4.2%) |
Public vs Private Health Insurance Coverage by Age in Marysville
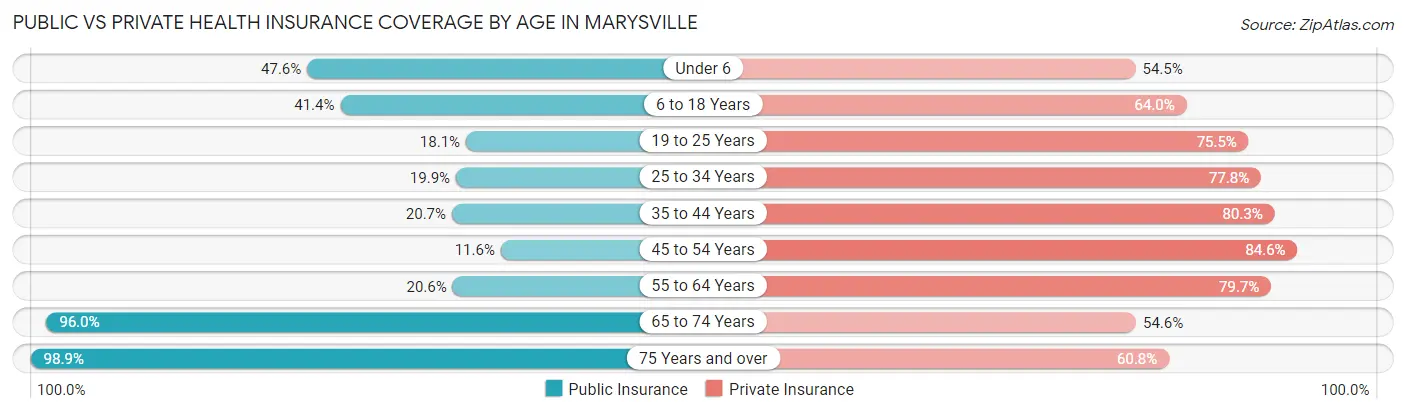
| Age Bracket | Public Insurance | Private Insurance |
| Under 6 | 2,662 (47.6%) | 3,052 (54.5%) |
| 6 to 18 Years | 4,634 (41.4%) | 7,162 (64.0%) |
| 19 to 25 Years | 1,170 (18.1%) | 4,884 (75.5%) |
| 25 to 34 Years | 1,894 (19.9%) | 7,392 (77.8%) |
| 35 to 44 Years | 2,156 (20.7%) | 8,369 (80.3%) |
| 45 to 54 Years | 985 (11.6%) | 7,167 (84.6%) |
| 55 to 64 Years | 1,863 (20.6%) | 7,218 (79.7%) |
| 65 to 74 Years | 5,839 (96.0%) | 3,323 (54.6%) |
| 75 Years and over | 3,353 (98.9%) | 2,060 (60.8%) |
| Total | 24,556 (35.0%) | 50,627 (72.1%) |
Disability Status by Sex by Age in Marysville
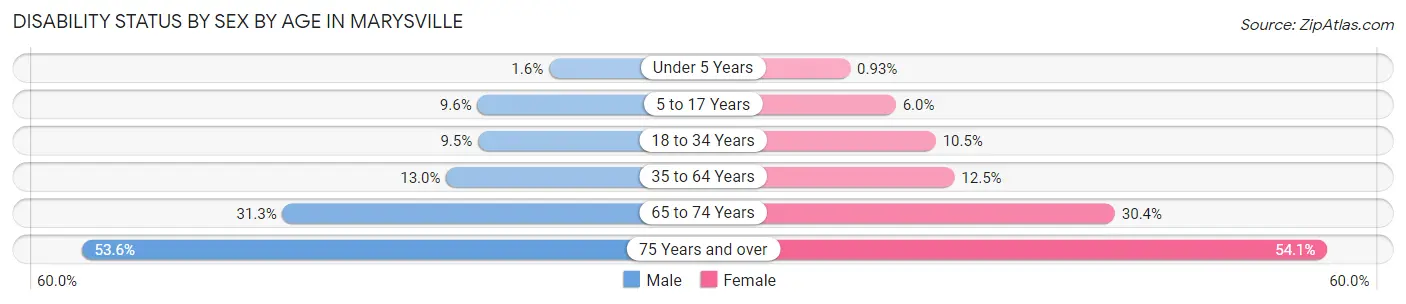
| Age Bracket | Male | Female |
| Under 5 Years | 40 (1.6%) | 22 (0.9%) |
| 5 to 17 Years | 551 (9.6%) | 296 (6.0%) |
| 18 to 34 Years | 830 (9.5%) | 886 (10.5%) |
| 35 to 64 Years | 1,881 (13.0%) | 1,696 (12.5%) |
| 65 to 74 Years | 794 (31.3%) | 1,078 (30.4%) |
| 75 Years and over | 700 (53.6%) | 1,128 (54.1%) |
Disability Class by Sex by Age in Marysville
Disability Class: Hearing Difficulty
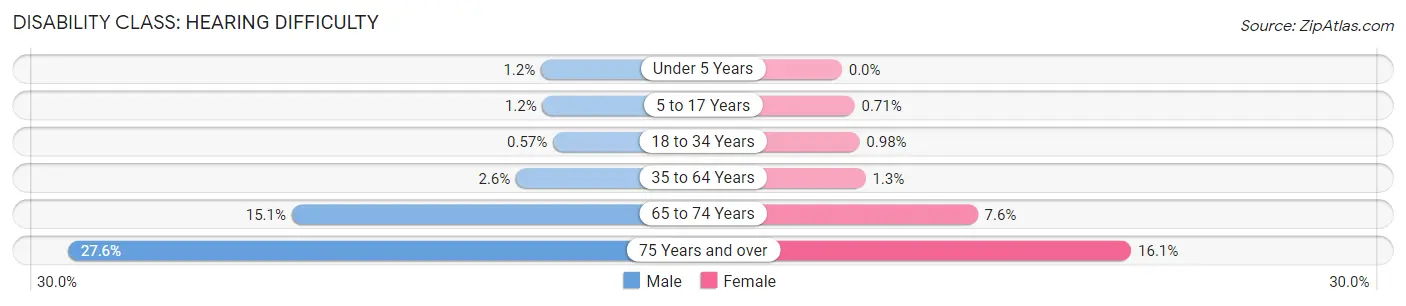
| Age Bracket | Male | Female |
| Under 5 Years | 31 (1.2%) | 0 (0.0%) |
| 5 to 17 Years | 67 (1.2%) | 35 (0.7%) |
| 18 to 34 Years | 50 (0.6%) | 83 (1.0%) |
| 35 to 64 Years | 380 (2.6%) | 179 (1.3%) |
| 65 to 74 Years | 384 (15.1%) | 268 (7.6%) |
| 75 Years and over | 360 (27.6%) | 336 (16.1%) |
Disability Class: Vision Difficulty
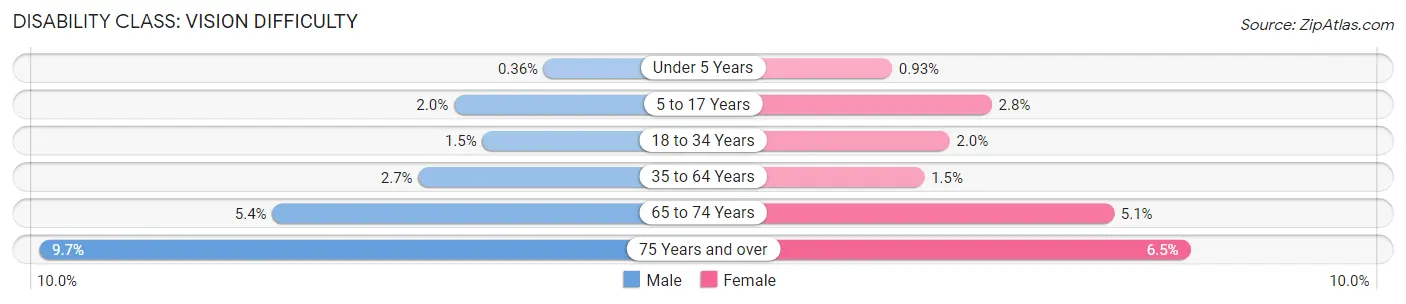
| Age Bracket | Male | Female |
| Under 5 Years | 9 (0.4%) | 22 (0.9%) |
| 5 to 17 Years | 117 (2.0%) | 137 (2.8%) |
| 18 to 34 Years | 131 (1.5%) | 169 (2.0%) |
| 35 to 64 Years | 388 (2.7%) | 207 (1.5%) |
| 65 to 74 Years | 137 (5.4%) | 179 (5.1%) |
| 75 Years and over | 127 (9.7%) | 135 (6.5%) |
Disability Class: Cognitive Difficulty
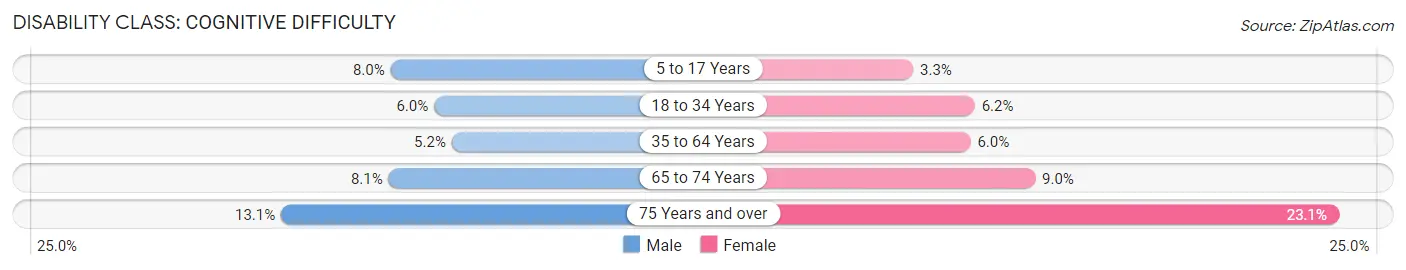
| Age Bracket | Male | Female |
| 5 to 17 Years | 462 (8.0%) | 163 (3.3%) |
| 18 to 34 Years | 524 (6.0%) | 523 (6.2%) |
| 35 to 64 Years | 747 (5.2%) | 808 (6.0%) |
| 65 to 74 Years | 206 (8.1%) | 318 (9.0%) |
| 75 Years and over | 171 (13.1%) | 481 (23.1%) |
Disability Class: Ambulatory Difficulty
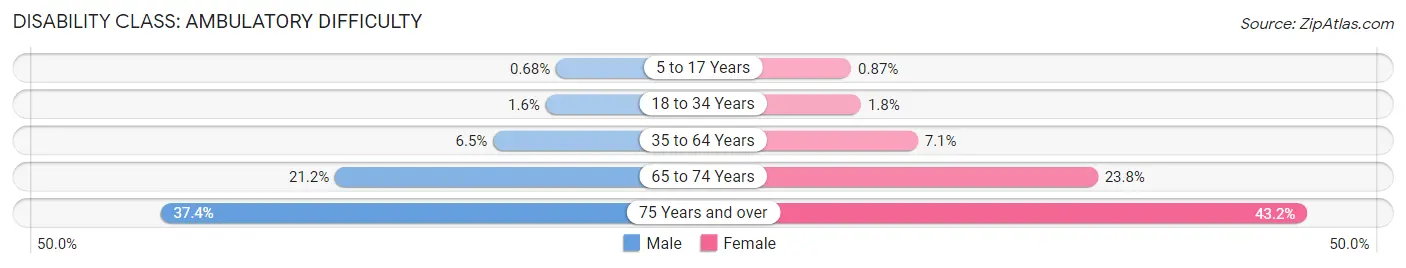
| Age Bracket | Male | Female |
| 5 to 17 Years | 39 (0.7%) | 43 (0.9%) |
| 18 to 34 Years | 143 (1.6%) | 151 (1.8%) |
| 35 to 64 Years | 939 (6.5%) | 953 (7.0%) |
| 65 to 74 Years | 538 (21.2%) | 842 (23.7%) |
| 75 Years and over | 488 (37.4%) | 901 (43.2%) |
Disability Class: Self-Care Difficulty
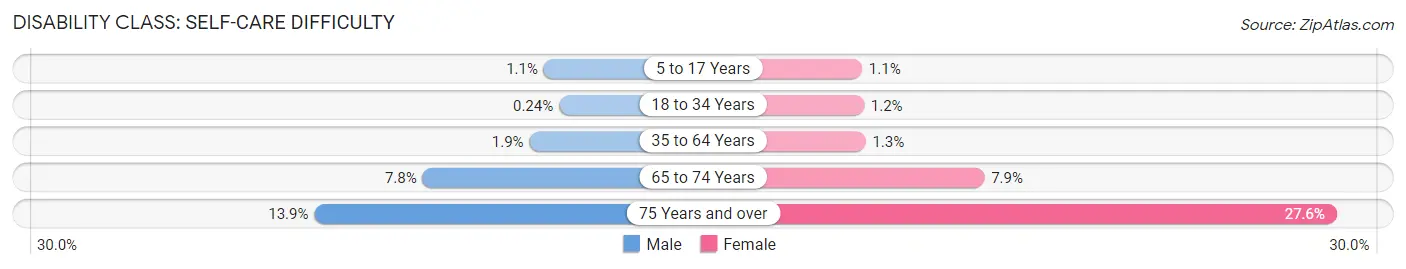
| Age Bracket | Male | Female |
| 5 to 17 Years | 63 (1.1%) | 55 (1.1%) |
| 18 to 34 Years | 21 (0.2%) | 104 (1.2%) |
| 35 to 64 Years | 273 (1.9%) | 179 (1.3%) |
| 65 to 74 Years | 199 (7.8%) | 281 (7.9%) |
| 75 Years and over | 181 (13.9%) | 575 (27.6%) |
Technology Access in Marysville
Computing Device Access in Marysville
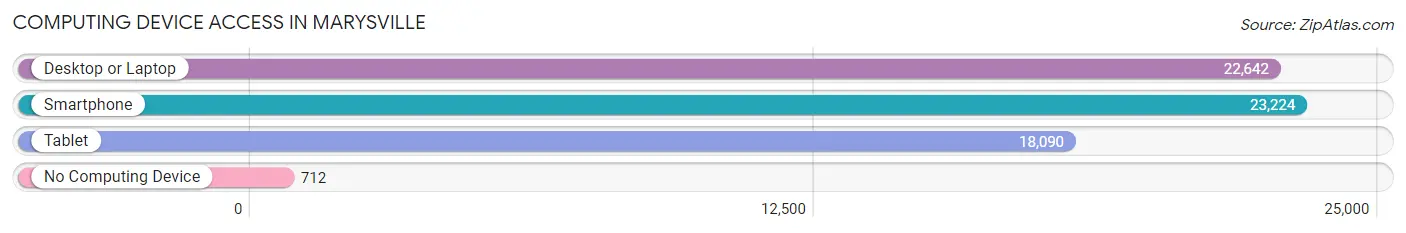
| Device Type | # Households | % Households |
| Desktop or Laptop | 22,642 | 89.1% |
| Smartphone | 23,224 | 91.3% |
| Tablet | 18,090 | 71.2% |
| No Computing Device | 712 | 2.8% |
| Total | 25,423 | 100.0% |
Internet Access in Marysville
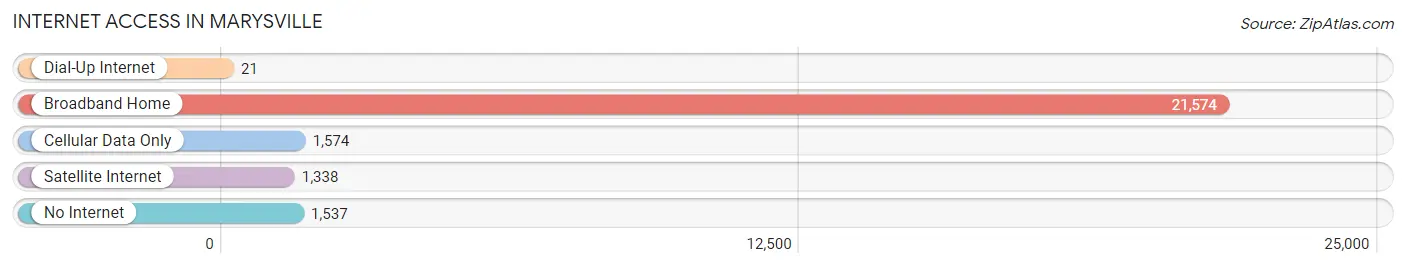
| Internet Type | # Households | % Households |
| Dial-Up Internet | 21 | 0.1% |
| Broadband Home | 21,574 | 84.9% |
| Cellular Data Only | 1,574 | 6.2% |
| Satellite Internet | 1,338 | 5.3% |
| No Internet | 1,537 | 6.0% |
| Total | 25,423 | 100.0% |
Marysville Summary
Marysville, Washington is a city located in Snohomish County, Washington, United States. The city is located 35 miles north of Seattle and is part of the Seattle metropolitan area. As of the 2010 census, the city had a population of 60,020, making it the second-largest city in Snohomish County after Everett.
History
The area that is now Marysville was first settled in 1872 by James P. Comeford, who established a homestead on the banks of the Snohomish River. The town was originally named Comeford, but was later changed to Marysville in 1883 in honor of Comeford's wife, Mary. The town was officially incorporated in 1891.
In the early 1900s, Marysville was a small farming community, with the main industry being logging. The town was also home to a number of sawmills and shingle mills. In the 1920s, the town began to grow rapidly as the Great Northern Railway built a line through the town, connecting it to Seattle and other cities in the region.
In the 1950s, Marysville began to experience a population boom as the city became a popular bedroom community for people working in Seattle. The city continued to grow throughout the 1960s and 1970s, and by the 1980s, Marysville had become a major retail and commercial center.
Geography
Marysville is located in Snohomish County, Washington, at the confluence of the Snohomish and Pilchuck Rivers. The city is located 35 miles north of Seattle and is part of the Seattle metropolitan area. The city has a total area of 16.3 square miles, of which 15.9 square miles is land and 0.4 square miles is water.
The city is located in a temperate climate zone, with mild winters and warm summers. The average annual temperature is 52.2°F, with an average high of 61.2°F and an average low of 43.2°F. The average annual precipitation is 37.3 inches.
Economy
Marysville is a major retail and commercial center for the region. The city is home to a number of large retail stores, including Walmart, Target, and Home Depot. The city is also home to a number of manufacturing companies, including Boeing, Microsoft, and Amazon.
The city's largest employer is the Naval Station Everett, which is located just outside of Marysville. The base employs over 10,000 people and is the largest employer in Snohomish County.
Demographics
As of the 2010 census, the city had a population of 60,020. The racial makeup of the city was 77.2% White, 8.2% Asian, 6.3% Hispanic or Latino, 4.2% African American, and 2.2% Native American.
The median household income in Marysville was $60,945, and the median family income was $71,845. The per capita income was $27,845. The city's poverty rate was 11.2%.
Conclusion
Marysville, Washington is a city located in Snohomish County, Washington, United States. The city is located 35 miles north of Seattle and is part of the Seattle metropolitan area. As of the 2010 census, the city had a population of 60,020, making it the second-largest city in Snohomish County after Everett. The city is a major retail and commercial center for the region, and is home to a number of large retail stores and manufacturing companies. The city's largest employer is the Naval Station Everett, which is located just outside of Marysville. The city has a diverse population, with a median household income of $60,945 and a poverty rate of 11.2%.
Common Questions
What is Per Capita Income in Marysville?
Per Capita income in Marysville is $40,238.
What is the Median Family Income in Marysville?
Median Family Income in Marysville is $110,041.
What is the Median Household income in Marysville?
Median Household Income in Marysville is $98,288.
What is Income or Wage Gap in Marysville?
Income or Wage Gap in Marysville is 32.1%.
Women in Marysville earn 67.9 cents for every dollar earned by a man.
What is Family Income Deficit in Marysville?
Family Income Deficit in Marysville is $11,469.
Families that are below poverty line in Marysville earn $11,469 less on average than the poverty threshold level.
What is Inequality or Gini Index in Marysville?
Inequality or Gini Index in Marysville is 0.36.
What is the Total Population of Marysville?
Total Population of Marysville is 70,847.
What is the Total Male Population of Marysville?
Total Male Population of Marysville is 35,729.
What is the Total Female Population of Marysville?
Total Female Population of Marysville is 35,118.
What is the Ratio of Males per 100 Females in Marysville?
There are 101.74 Males per 100 Females in Marysville.
What is the Ratio of Females per 100 Males in Marysville?
There are 98.29 Females per 100 Males in Marysville.
What is the Median Population Age in Marysville?
Median Population Age in Marysville is 37.1 Years.
What is the Average Family Size in Marysville
Average Family Size in Marysville is 3.2 People.
What is the Average Household Size in Marysville
Average Household Size in Marysville is 2.8 People.
How Large is the Labor Force in Marysville?
There are 38,575 People in the Labor Forcein in Marysville.
What is the Percentage of People in the Labor Force in Marysville?
67.7% of People are in the Labor Force in Marysville.
What is the Unemployment Rate in Marysville?
Unemployment Rate in Marysville is 4.2%.