Cities with the Lowest Poverty Level Among Children Under the Age of 5 in New Mexico
RELATED REPORTS & OPTIONS
Lowest Poverty | Child 0-5
New Mexico
Compare Cities
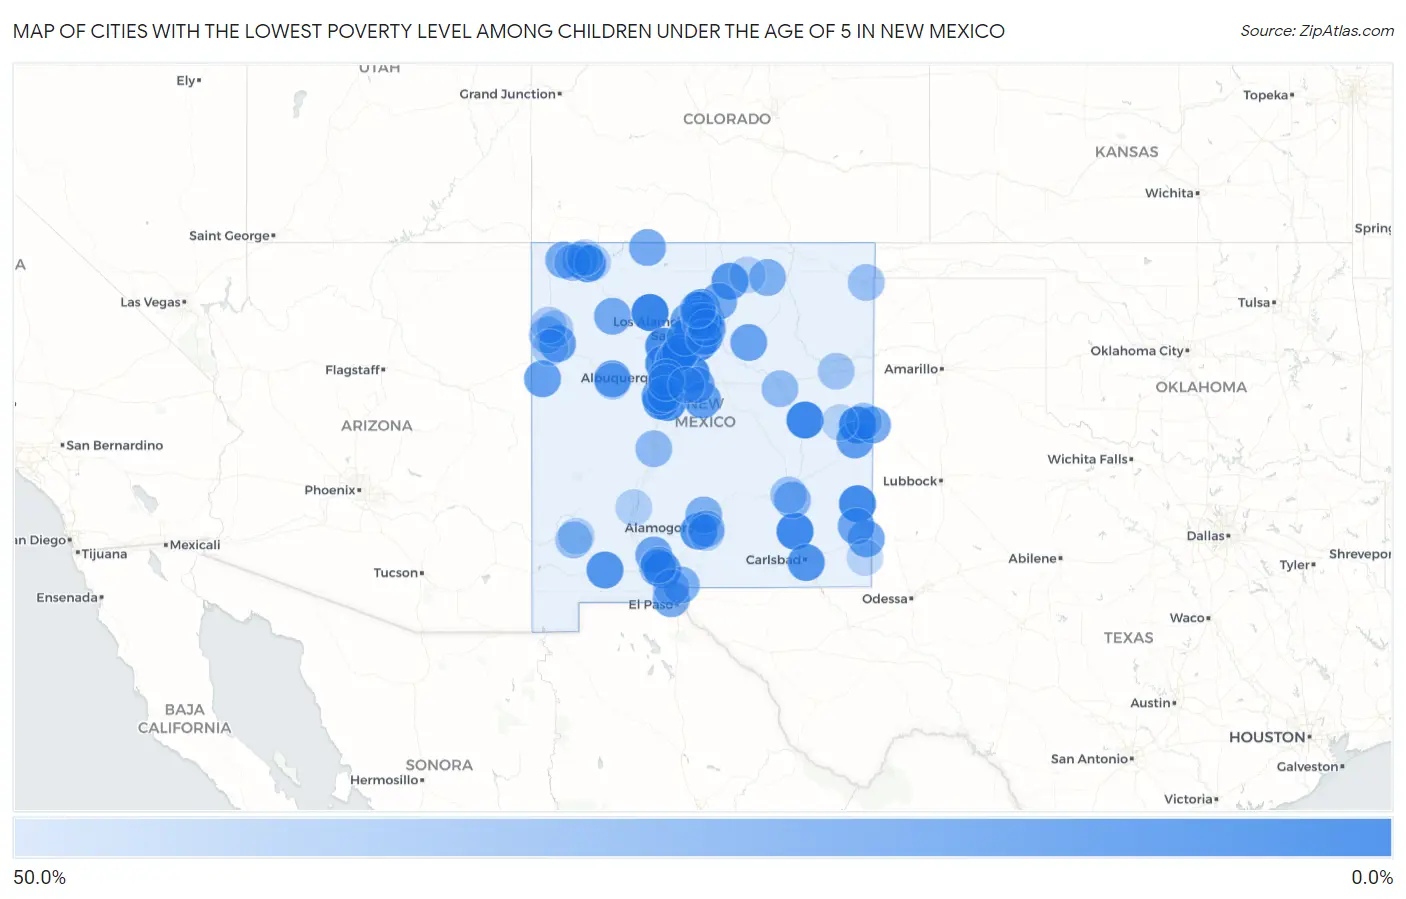
Map of Cities with the Lowest Poverty Level Among Children Under the Age of 5 in New Mexico
50.0%
0.0%
Cities with the Lowest Poverty Level Among Children Under the Age of 5 in New Mexico
| City | Child Poverty | vs State | vs National | |
| 1. | White Rock | 2.6% | 27.4%(-24.8)#1 | 18.1%(-15.5)#539 |
| 2. | Cuba | 2.9% | 27.4%(-24.5)#2 | 18.1%(-15.2)#655 |
| 3. | Fort Sumner | 3.6% | 27.4%(-23.7)#3 | 18.1%(-14.4)#975 |
| 4. | Artesia | 5.1% | 27.4%(-22.3)#4 | 18.1%(-13.0)#1,608 |
| 5. | North Valley | 5.3% | 27.4%(-22.1)#5 | 18.1%(-12.8)#1,702 |
| 6. | La Cienega | 5.4% | 27.4%(-22.0)#6 | 18.1%(-12.7)#1,741 |
| 7. | Cannon Afb | 5.4% | 27.4%(-22.0)#7 | 18.1%(-12.7)#1,742 |
| 8. | Alcalde | 5.6% | 27.4%(-21.8)#8 | 18.1%(-12.5)#1,819 |
| 9. | Tatum | 6.1% | 27.4%(-21.3)#9 | 18.1%(-11.9)#2,032 |
| 10. | Edgewood | 6.9% | 27.4%(-20.5)#10 | 18.1%(-11.1)#2,392 |
| 11. | Corrales | 6.9% | 27.4%(-20.4)#11 | 18.1%(-11.1)#2,396 |
| 12. | Zia Pueblo | 8.4% | 27.4%(-18.9)#12 | 18.1%(-9.63)#3,011 |
| 13. | Rio Rancho | 8.5% | 27.4%(-18.9)#13 | 18.1%(-9.59)#3,025 |
| 14. | Las Maravillas | 8.7% | 27.4%(-18.7)#14 | 18.1%(-9.37)#3,121 |
| 15. | Pueblo Of Sandia Village | 9.4% | 27.4%(-18.0)#15 | 18.1%(-8.65)#3,428 |
| 16. | Lee Acres | 9.5% | 27.4%(-17.9)#16 | 18.1%(-8.54)#3,464 |
| 17. | Williams Acres | 10.1% | 27.4%(-17.3)#17 | 18.1%(-7.95)#3,708 |
| 18. | Carlsbad | 10.4% | 27.4%(-17.0)#18 | 18.1%(-7.64)#3,815 |
| 19. | Deming | 11.3% | 27.4%(-16.1)#19 | 18.1%(-6.77)#4,178 |
| 20. | Los Chaves | 11.5% | 27.4%(-15.9)#20 | 18.1%(-6.59)#4,255 |
| 21. | Holloman Afb | 11.5% | 27.4%(-15.9)#21 | 18.1%(-6.54)#4,269 |
| 22. | University Park | 12.5% | 27.4%(-14.9)#22 | 18.1%(-5.56)#4,598 |
| 23. | Taos Pueblo | 12.6% | 27.4%(-14.8)#23 | 18.1%(-5.48)#4,686 |
| 24. | Bernalillo | 13.5% | 27.4%(-13.9)#24 | 18.1%(-4.61)#4,999 |
| 25. | Ohkay Owingeh | 13.8% | 27.4%(-13.6)#25 | 18.1%(-4.27)#5,130 |
| 26. | Peak Place | 14.5% | 27.4%(-12.9)#26 | 18.1%(-3.59)#5,406 |
| 27. | Santo Domingo Pueblo | 15.0% | 27.4%(-12.4)#27 | 18.1%(-3.06)#5,586 |
| 28. | Santa Ana Pueblo | 15.1% | 27.4%(-12.3)#28 | 18.1%(-2.99)#5,617 |
| 29. | Cuyamungue | 15.4% | 27.4%(-12.0)#29 | 18.1%(-2.68)#5,731 |
| 30. | Church Rock | 15.5% | 27.4%(-11.9)#30 | 18.1%(-2.60)#5,764 |
| 31. | Portales | 15.8% | 27.4%(-11.6)#31 | 18.1%(-2.31)#5,846 |
| 32. | Estancia | 16.1% | 27.4%(-11.3)#32 | 18.1%(-1.97)#5,968 |
| 33. | Acomita Lake | 16.7% | 27.4%(-10.7)#33 | 18.1%(-1.40)#6,158 |
| 34. | Zuni Pueblo | 16.7% | 27.4%(-10.7)#34 | 18.1%(-1.34)#6,213 |
| 35. | Los Lunas | 17.3% | 27.4%(-10.1)#35 | 18.1%(-0.790)#6,359 |
| 36. | Picacho Hills | 17.9% | 27.4%(-9.52)#36 | 18.1%(-0.206)#6,563 |
| 37. | Los Alamos | 17.9% | 27.4%(-9.49)#37 | 18.1%(-0.177)#6,584 |
| 38. | Algodones | 18.5% | 27.4%(-8.86)#38 | 18.1%(+0.456)#6,780 |
| 39. | Las Vegas | 18.6% | 27.4%(-8.80)#39 | 18.1%(+0.515)#6,804 |
| 40. | Hobbs | 19.0% | 27.4%(-8.40)#40 | 18.1%(+0.917)#6,929 |
| 41. | Texico | 20.0% | 27.4%(-7.38)#41 | 18.1%(+1.94)#7,244 |
| 42. | Radium Springs | 20.3% | 27.4%(-7.07)#42 | 18.1%(+2.25)#7,364 |
| 43. | Santa Clara Pueblo | 20.4% | 27.4%(-7.01)#43 | 18.1%(+2.31)#7,376 |
| 44. | Lovington | 20.4% | 27.4%(-6.94)#44 | 18.1%(+2.37)#7,401 |
| 45. | Sunland Park | 20.7% | 27.4%(-6.63)#45 | 18.1%(+2.68)#7,496 |
| 46. | Nambe | 21.4% | 27.4%(-5.95)#46 | 18.1%(+3.37)#7,692 |
| 47. | Indian Hills | 21.4% | 27.4%(-5.95)#47 | 18.1%(+3.37)#7,694 |
| 48. | Pueblo Pintado | 21.4% | 27.4%(-5.95)#48 | 18.1%(+3.37)#7,711 |
| 49. | Dulce | 21.6% | 27.4%(-5.76)#49 | 18.1%(+3.56)#7,769 |
| 50. | Espanola | 22.0% | 27.4%(-5.40)#50 | 18.1%(+3.92)#7,892 |
| 51. | Chamisal | 22.2% | 27.4%(-5.16)#51 | 18.1%(+4.16)#7,971 |
| 52. | San Felipe Pueblo | 22.3% | 27.4%(-5.04)#52 | 18.1%(+4.28)#8,006 |
| 53. | Waterflow | 23.1% | 27.4%(-4.30)#53 | 18.1%(+5.01)#8,206 |
| 54. | Albuquerque | 24.7% | 27.4%(-2.71)#54 | 18.1%(+6.60)#8,653 |
| 55. | Chaparral | 24.7% | 27.4%(-2.63)#55 | 18.1%(+6.69)#8,670 |
| 56. | Tularosa | 25.8% | 27.4%(-1.57)#56 | 18.1%(+7.74)#8,982 |
| 57. | Cimarron | 25.9% | 27.4%(-1.52)#57 | 18.1%(+7.80)#8,994 |
| 58. | Santa Fe | 25.9% | 27.4%(-1.45)#58 | 18.1%(+7.87)#9,019 |
| 59. | Midway | 26.9% | 27.4%(-0.456)#59 | 18.1%(+8.86)#9,248 |
| 60. | Cochiti Lake | 27.8% | 27.4%(+0.399)#60 | 18.1%(+9.71)#9,465 |
| 61. | San Antonito Cdp Bernalillo County | 27.8% | 27.4%(+0.469)#61 | 18.1%(+9.79)#9,488 |
| 62. | Fairacres | 28.3% | 27.4%(+0.923)#62 | 18.1%(+10.2)#9,586 |
| 63. | Alamogordo | 28.7% | 27.4%(+1.29)#63 | 18.1%(+10.6)#9,716 |
| 64. | Farmington | 29.0% | 27.4%(+1.63)#64 | 18.1%(+10.9)#9,791 |
| 65. | La Mesilla | 29.3% | 27.4%(+1.87)#65 | 18.1%(+11.2)#9,842 |
| 66. | Socorro | 30.3% | 27.4%(+2.88)#66 | 18.1%(+12.2)#10,082 |
| 67. | Twin Lakes | 30.4% | 27.4%(+3.06)#67 | 18.1%(+12.4)#10,121 |
| 68. | Pojoaque | 31.3% | 27.4%(+3.92)#68 | 18.1%(+13.2)#10,311 |
| 69. | Santa Rosa | 31.7% | 27.4%(+4.31)#69 | 18.1%(+13.6)#10,378 |
| 70. | Upper Fruitland | 32.1% | 27.4%(+4.70)#70 | 18.1%(+14.0)#10,450 |
| 71. | Bosque Farms | 32.2% | 27.4%(+4.81)#71 | 18.1%(+14.1)#10,473 |
| 72. | Tyrone | 33.1% | 27.4%(+5.69)#72 | 18.1%(+15.0)#10,618 |
| 73. | Clayton | 33.5% | 27.4%(+6.13)#73 | 18.1%(+15.4)#10,802 |
| 74. | Anthony | 33.7% | 27.4%(+6.33)#74 | 18.1%(+15.6)#10,827 |
| 75. | Las Cruces | 33.9% | 27.4%(+6.48)#75 | 18.1%(+15.8)#10,853 |
| 76. | Clovis | 34.6% | 27.4%(+7.19)#76 | 18.1%(+16.5)#10,976 |
| 77. | South Valley | 34.7% | 27.4%(+7.33)#77 | 18.1%(+16.6)#11,000 |
| 78. | Iyanbito | 34.8% | 27.4%(+7.40)#78 | 18.1%(+16.7)#11,015 |
| 79. | Roswell | 35.4% | 27.4%(+8.02)#79 | 18.1%(+17.3)#11,126 |
| 80. | Tucumcari | 35.9% | 27.4%(+8.50)#80 | 18.1%(+17.8)#11,233 |
| 81. | San Jose Cdp Rio Arriba County | 36.7% | 27.4%(+9.29)#81 | 18.1%(+18.6)#11,373 |
| 82. | Skyline Ganipa | 37.7% | 27.4%(+10.3)#82 | 18.1%(+19.6)#11,555 |
| 83. | Brimhall Nizhoni | 38.5% | 27.4%(+11.1)#83 | 18.1%(+20.4)#11,682 |
| 84. | Ponderosa Pine | 38.6% | 27.4%(+11.2)#84 | 18.1%(+20.5)#11,705 |
| 85. | Tohatchi | 38.9% | 27.4%(+11.5)#85 | 18.1%(+20.8)#11,746 |
| 86. | El Rancho | 39.4% | 27.4%(+12.0)#86 | 18.1%(+21.3)#11,825 |
| 87. | Bloomfield | 39.6% | 27.4%(+12.2)#87 | 18.1%(+21.5)#11,860 |
| 88. | Gallup | 40.2% | 27.4%(+12.8)#88 | 18.1%(+22.1)#11,997 |
| 89. | Silver City | 40.6% | 27.4%(+13.2)#89 | 18.1%(+22.5)#12,050 |
| 90. | Eagle Nest | 40.9% | 27.4%(+13.5)#90 | 18.1%(+22.8)#12,098 |
| 91. | Kirtland Afb | 41.0% | 27.4%(+13.6)#91 | 18.1%(+22.9)#12,102 |
| 92. | Truth Or Consequences | 41.1% | 27.4%(+13.7)#92 | 18.1%(+23.0)#12,115 |
| 93. | Boles Acres | 41.3% | 27.4%(+13.9)#93 | 18.1%(+23.2)#12,147 |
| 94. | Chamita | 41.3% | 27.4%(+13.9)#94 | 18.1%(+23.2)#12,149 |
| 95. | Agua Fria | 42.1% | 27.4%(+14.7)#95 | 18.1%(+24.0)#12,254 |
| 96. | Flora Vista | 42.6% | 27.4%(+15.3)#96 | 18.1%(+24.6)#12,334 |
| 97. | Tesuque Pueblo | 42.9% | 27.4%(+15.5)#97 | 18.1%(+24.8)#12,363 |
| 98. | Melrose | 42.9% | 27.4%(+15.5)#98 | 18.1%(+24.8)#12,365 |
| 99. | Hernandez | 43.1% | 27.4%(+15.7)#99 | 18.1%(+25.0)#12,416 |
| 100. | Eunice | 43.3% | 27.4%(+15.9)#100 | 18.1%(+25.2)#12,435 |
Common Questions
What are the Top 10 Cities with the Lowest Poverty Level Among Children Under the Age of 5 in New Mexico?
Top 10 Cities with the Lowest Poverty Level Among Children Under the Age of 5 in New Mexico are:
#1
2.6%
#2
2.9%
#3
3.6%
#4
5.1%
#5
5.3%
#6
5.4%
#7
5.4%
#8
5.6%
#9
6.1%
#10
6.9%
What city has the Lowest Poverty Level Among Children Under the Age of 5 in New Mexico?
White Rock has the Lowest Poverty Level Among Children Under the Age of 5 in New Mexico with 2.6%.
What is the Poverty Level Among Children Under the Age of 5 in the State of New Mexico?
Poverty Level Among Children Under the Age of 5 in New Mexico is 27.4%.
What is the Poverty Level Among Children Under the Age of 5 in the United States?
Poverty Level Among Children Under the Age of 5 in the United States is 18.1%.