Covington, WA Map & Demographics
Covington Map
Covington Overview
$51,581
PER CAPITA INCOME
$129,946
AVG FAMILY INCOME
$123,065
AVG HOUSEHOLD INCOME
36.9%
WAGE / INCOME GAP [ % ]
63.1¢/ $1
WAGE / INCOME GAP [ $ ]
$10,102
FAMILY INCOME DEFICIT
0.38
INEQUALITY / GINI INDEX
20,814
TOTAL POPULATION
10,639
MALE POPULATION
10,175
FEMALE POPULATION
104.56
MALES / 100 FEMALES
95.64
FEMALES / 100 MALES
38.6
MEDIAN AGE
3.2
AVG FAMILY SIZE
2.8
AVG HOUSEHOLD SIZE
11,596
LABOR FORCE [ PEOPLE ]
70.0%
PERCENT IN LABOR FORCE
3.4%
UNEMPLOYMENT RATE
Income in Covington
Income Overview in Covington
Per Capita Income in Covington is $51,581, while median incomes of families and households are $129,946 and $123,065 respectively.
| Characteristic | Number | Measure |
| Per Capita Income | 20,814 | $51,581 |
| Median Family Income | 5,511 | $129,946 |
| Mean Family Income | 5,511 | $152,895 |
| Median Household Income | 7,306 | $123,065 |
| Mean Household Income | 7,306 | $145,359 |
| Income Deficit | 5,511 | $10,102 |
| Wage / Income Gap (%) | 20,814 | 36.92% |
| Wage / Income Gap ($) | 20,814 | 63.08¢ per $1 |
| Gini / Inequality Index | 20,814 | 0.38 |
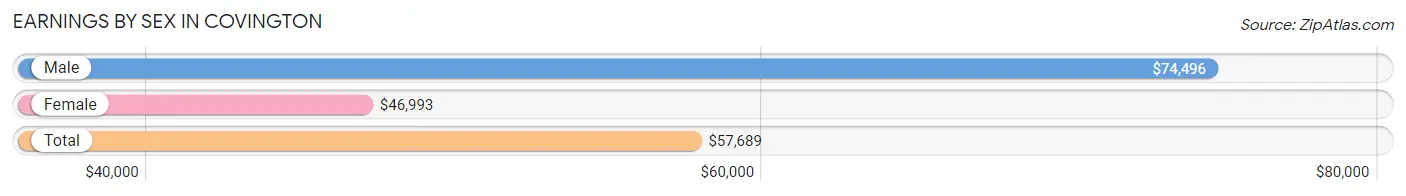
Earnings by Sex in Covington
Average Earnings in Covington are $57,689, $74,496 for men and $46,993 for women, a difference of 36.9%.
| Sex | Number | Average Earnings |
| Male | 6,438 (52.6%) | $74,496 |
| Female | 5,795 (47.4%) | $46,993 |
| Total | 12,233 (100.0%) | $57,689 |
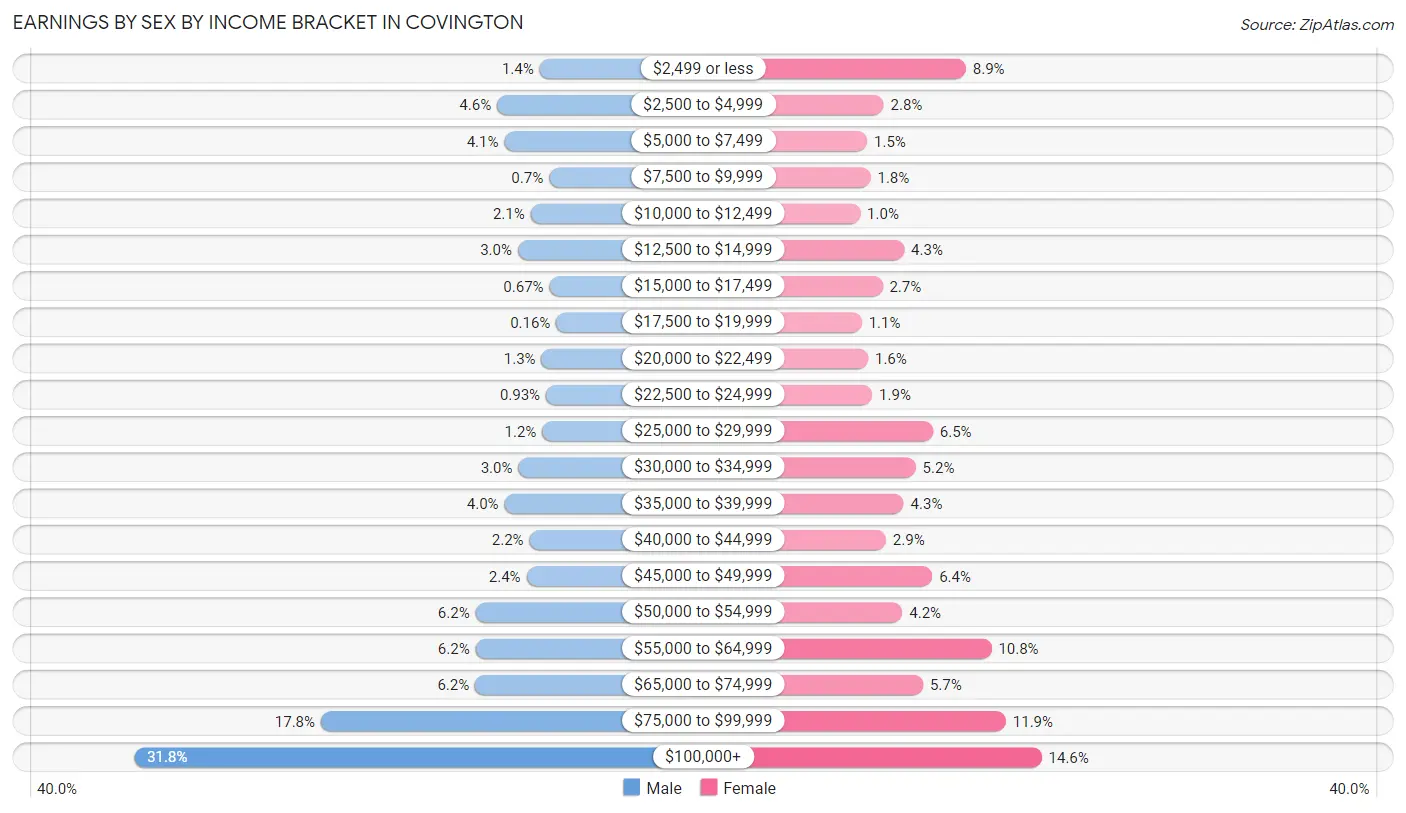
Earnings by Sex by Income Bracket in Covington
The most common earnings brackets in Covington are $100,000+ for men (2,047 | 31.8%) and $100,000+ for women (846 | 14.6%).
| Income | Male | Female |
| $2,499 or less | 91 (1.4%) | 517 (8.9%) |
| $2,500 to $4,999 | 296 (4.6%) | 160 (2.8%) |
| $5,000 to $7,499 | 261 (4.1%) | 88 (1.5%) |
| $7,500 to $9,999 | 45 (0.7%) | 103 (1.8%) |
| $10,000 to $12,499 | 134 (2.1%) | 58 (1.0%) |
| $12,500 to $14,999 | 196 (3.0%) | 249 (4.3%) |
| $15,000 to $17,499 | 43 (0.7%) | 155 (2.7%) |
| $17,500 to $19,999 | 10 (0.2%) | 65 (1.1%) |
| $20,000 to $22,499 | 82 (1.3%) | 92 (1.6%) |
| $22,500 to $24,999 | 60 (0.9%) | 110 (1.9%) |
| $25,000 to $29,999 | 78 (1.2%) | 374 (6.5%) |
| $30,000 to $34,999 | 193 (3.0%) | 299 (5.2%) |
| $35,000 to $39,999 | 260 (4.0%) | 247 (4.3%) |
| $40,000 to $44,999 | 140 (2.2%) | 170 (2.9%) |
| $45,000 to $49,999 | 154 (2.4%) | 371 (6.4%) |
| $50,000 to $54,999 | 400 (6.2%) | 241 (4.2%) |
| $55,000 to $64,999 | 400 (6.2%) | 628 (10.8%) |
| $65,000 to $74,999 | 402 (6.2%) | 331 (5.7%) |
| $75,000 to $99,999 | 1,146 (17.8%) | 691 (11.9%) |
| $100,000+ | 2,047 (31.8%) | 846 (14.6%) |
| Total | 6,438 (100.0%) | 5,795 (100.0%) |
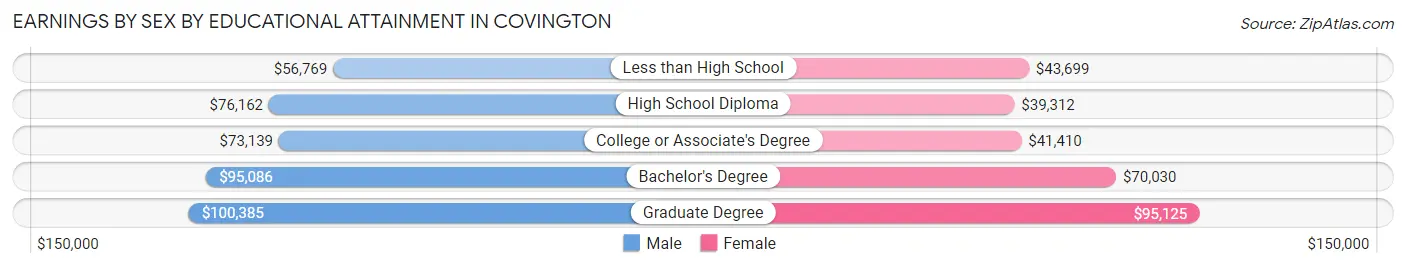
Earnings by Sex by Educational Attainment in Covington
Average earnings in Covington are $79,677 for men and $51,360 for women, a difference of 35.5%. Men with an educational attainment of graduate degree enjoy the highest average annual earnings of $100,385, while those with less than high school education earn the least with $56,769. Women with an educational attainment of graduate degree earn the most with the average annual earnings of $95,125, while those with high school diploma education have the smallest earnings of $39,312.
| Educational Attainment | Male Income | Female Income |
| Less than High School | $56,769 | $43,699 |
| High School Diploma | $76,162 | $39,312 |
| College or Associate's Degree | $73,139 | $41,410 |
| Bachelor's Degree | $95,086 | $70,030 |
| Graduate Degree | $100,385 | $95,125 |
| Total | $79,677 | $51,360 |
Family Income in Covington
Family Income Brackets in Covington
According to the Covington family income data, there are 1,350 families falling into the $100,000 to $149,999 income range, which is the most common income bracket and makes up 24.5% of all families. Conversely, the $10,000 to $14,999 income bracket is the least frequent group with only 22 families (0.4%) belonging to this category.
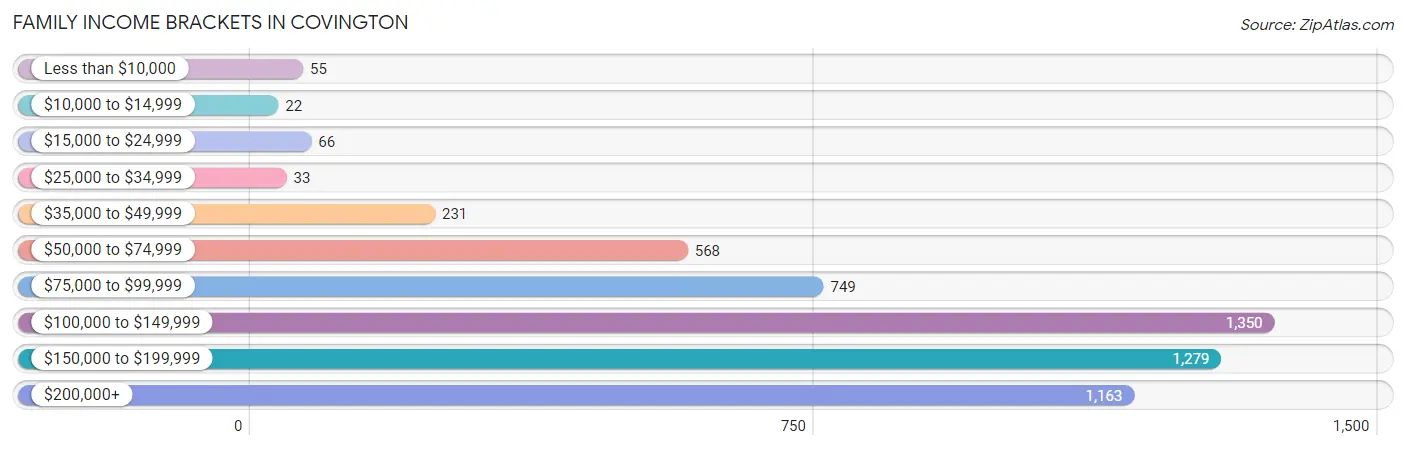
| Income Bracket | # Families | % Families |
| Less than $10,000 | 55 | 1.0% |
| $10,000 to $14,999 | 22 | 0.4% |
| $15,000 to $24,999 | 66 | 1.2% |
| $25,000 to $34,999 | 33 | 0.6% |
| $35,000 to $49,999 | 231 | 4.2% |
| $50,000 to $74,999 | 568 | 10.3% |
| $75,000 to $99,999 | 749 | 13.6% |
| $100,000 to $149,999 | 1,350 | 24.5% |
| $150,000 to $199,999 | 1,279 | 23.2% |
| $200,000+ | 1,163 | 21.1% |
Family Income by Famaliy Size in Covington
6-person families (184 | 3.3%) account for the highest median family income in Covington with $178,395 per family, while 2-person families (2,087 | 37.9%) have the highest median income of $61,012 per family member.
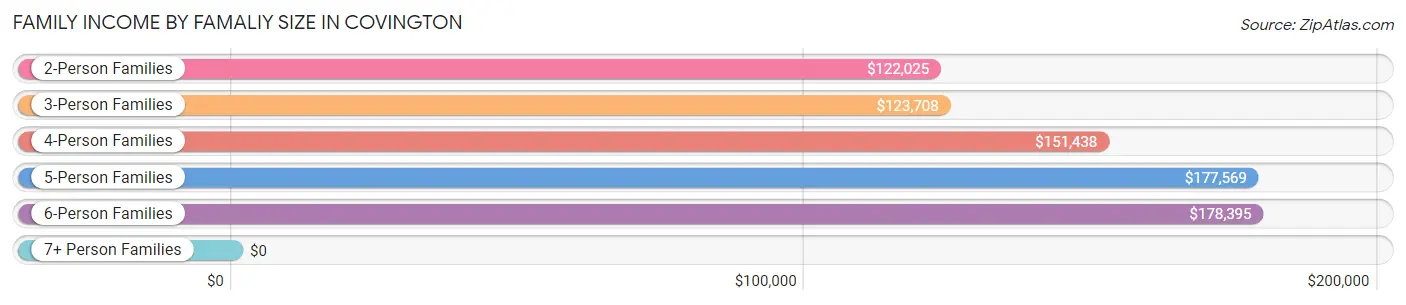
| Income Bracket | # Families | Median Income |
| 2-Person Families | 2,087 (37.9%) | $122,025 |
| 3-Person Families | 1,427 (25.9%) | $123,708 |
| 4-Person Families | 1,393 (25.3%) | $151,438 |
| 5-Person Families | 344 (6.2%) | $177,569 |
| 6-Person Families | 184 (3.3%) | $178,395 |
| 7+ Person Families | 76 (1.4%) | $0 |
| Total | 5,511 (100.0%) | $129,946 |
Family Income by Number of Earners in Covington
The median family income in Covington is $129,946, with families comprising 3+ earners (911) having the highest median family income of $169,453, while families with 1 earner (1,240) have the lowest median family income of $80,188, accounting for 16.5% and 22.5% of families, respectively.
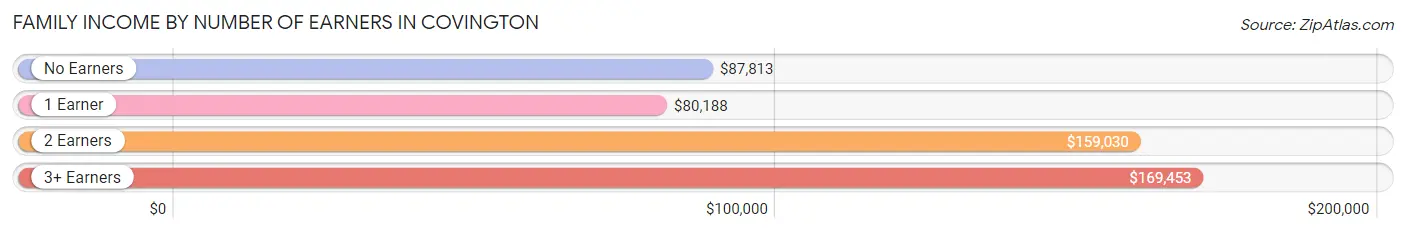
| Number of Earners | # Families | Median Income |
| No Earners | 463 (8.4%) | $87,813 |
| 1 Earner | 1,240 (22.5%) | $80,188 |
| 2 Earners | 2,897 (52.6%) | $159,030 |
| 3+ Earners | 911 (16.5%) | $169,453 |
| Total | 5,511 (100.0%) | $129,946 |
Household Income in Covington
Household Income Brackets in Covington
With 1,848 households falling in the category, the $100,000 to $149,999 income range is the most frequent in Covington, accounting for 25.3% of all households. In contrast, only 66 households (0.9%) fall into the $10,000 to $14,999 income bracket, making it the least populous group.
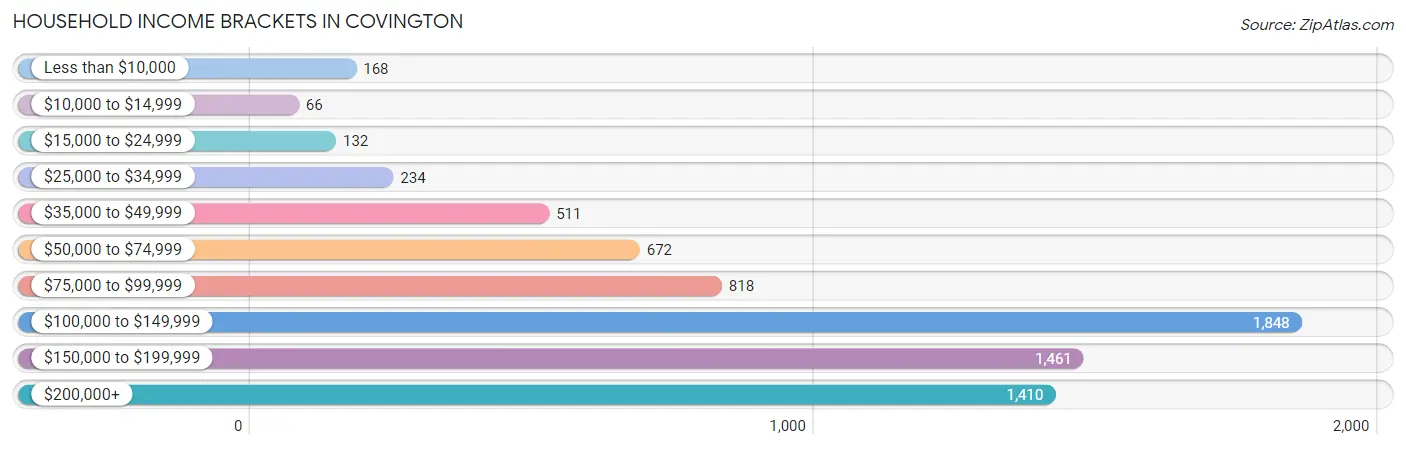
| Income Bracket | # Households | % Households |
| Less than $10,000 | 168 | 2.3% |
| $10,000 to $14,999 | 66 | 0.9% |
| $15,000 to $24,999 | 132 | 1.8% |
| $25,000 to $34,999 | 234 | 3.2% |
| $35,000 to $49,999 | 511 | 7.0% |
| $50,000 to $74,999 | 672 | 9.2% |
| $75,000 to $99,999 | 818 | 11.2% |
| $100,000 to $149,999 | 1,848 | 25.3% |
| $150,000 to $199,999 | 1,461 | 20.0% |
| $200,000+ | 1,410 | 19.3% |
Household Income by Householder Age in Covington
The median household income in Covington is $123,065, with the highest median household income of $150,734 found in the 45 to 64 years age bracket for the primary householder. A total of 3,267 households (44.7%) fall into this category. Meanwhile, the 65+ years age bracket for the primary householder has the lowest median household income of $81,685, with 1,356 households (18.6%) in this group.
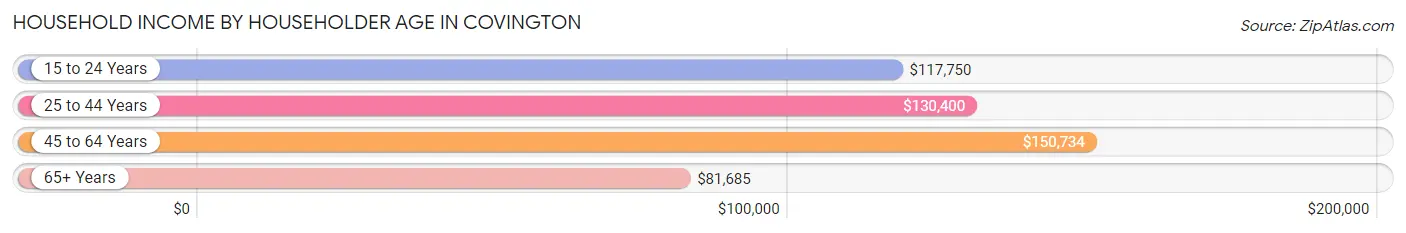
| Income Bracket | # Households | Median Income |
| 15 to 24 Years | 153 (2.1%) | $117,750 |
| 25 to 44 Years | 2,530 (34.6%) | $130,400 |
| 45 to 64 Years | 3,267 (44.7%) | $150,734 |
| 65+ Years | 1,356 (18.6%) | $81,685 |
| Total | 7,306 (100.0%) | $123,065 |
Poverty in Covington
Income Below Poverty by Sex and Age in Covington
With 3.3% poverty level for males and 6.8% for females among the residents of Covington, 15 year old males and 15 year old females are the most vulnerable to poverty, with 22 males (16.8%) and 24 females (32.4%) in their respective age groups living below the poverty level.
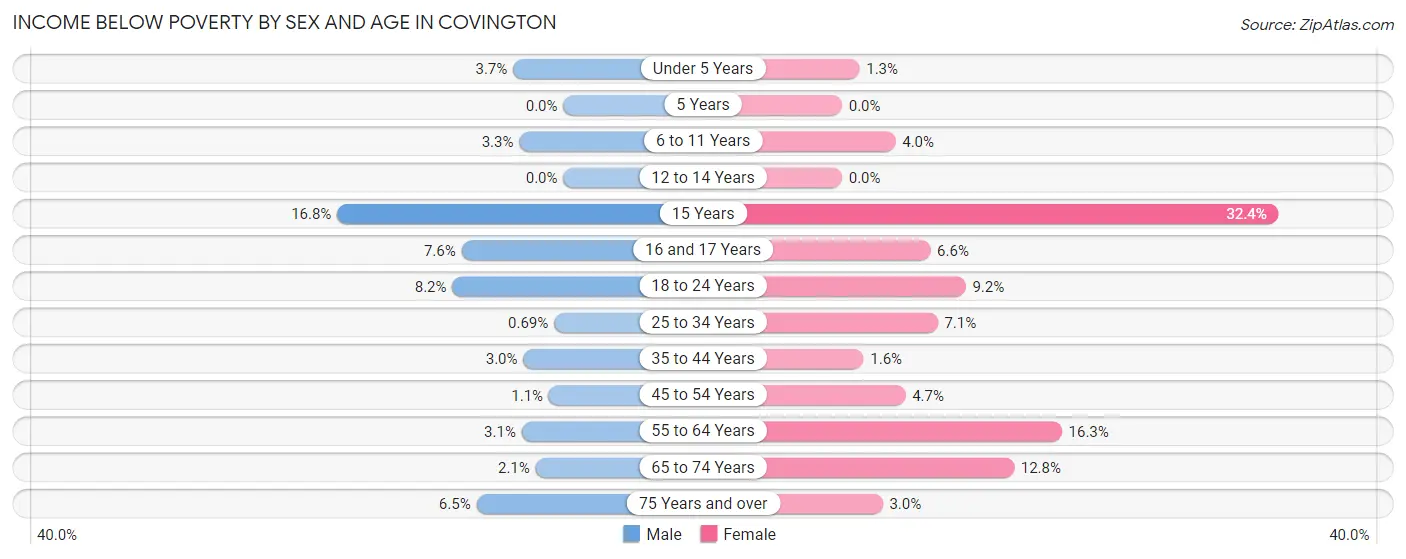
| Age Bracket | Male | Female |
| Under 5 Years | 27 (3.7%) | 7 (1.3%) |
| 5 Years | 0 (0.0%) | 0 (0.0%) |
| 6 to 11 Years | 24 (3.3%) | 31 (4.0%) |
| 12 to 14 Years | 0 (0.0%) | 0 (0.0%) |
| 15 Years | 22 (16.8%) | 24 (32.4%) |
| 16 and 17 Years | 40 (7.6%) | 16 (6.6%) |
| 18 to 24 Years | 77 (8.2%) | 79 (9.2%) |
| 25 to 34 Years | 8 (0.7%) | 86 (7.1%) |
| 35 to 44 Years | 50 (3.0%) | 28 (1.6%) |
| 45 to 54 Years | 16 (1.1%) | 68 (4.7%) |
| 55 to 64 Years | 41 (3.1%) | 252 (16.3%) |
| 65 to 74 Years | 18 (2.1%) | 90 (12.8%) |
| 75 Years and over | 24 (6.5%) | 13 (3.0%) |
| Total | 347 (3.3%) | 694 (6.8%) |
Income Above Poverty by Sex and Age in Covington
According to the poverty statistics in Covington, males aged 5 years and females aged 5 years are the age groups that are most secure financially, with 100.0% of males and 100.0% of females in these age groups living above the poverty line.
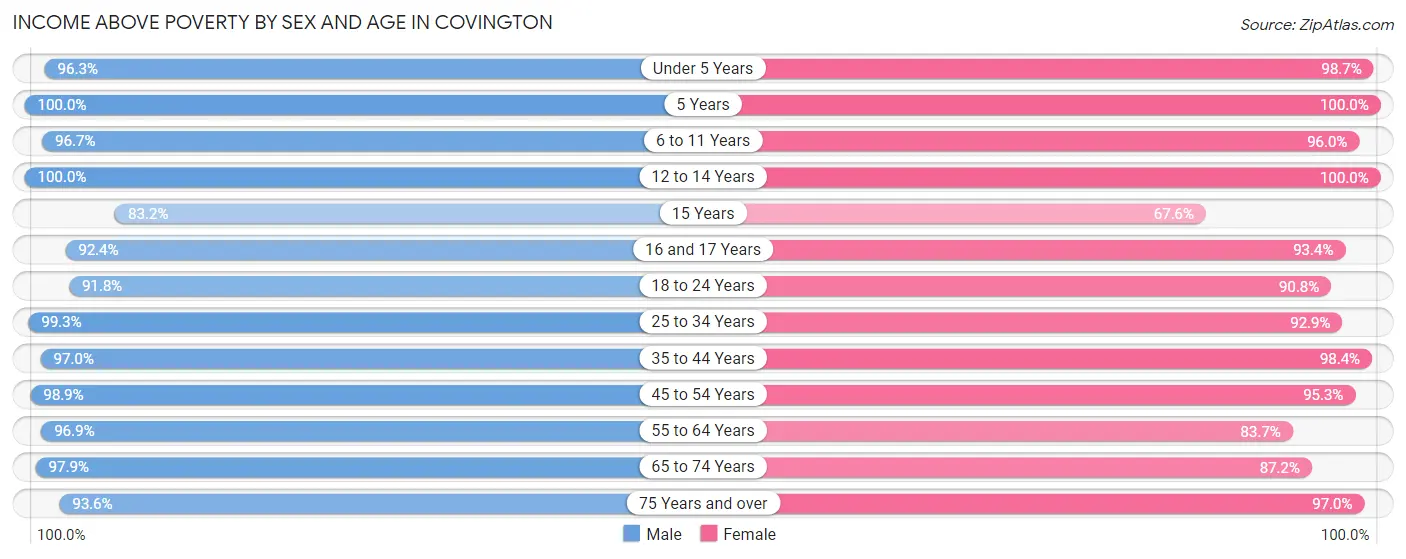
| Age Bracket | Male | Female |
| Under 5 Years | 697 (96.3%) | 531 (98.7%) |
| 5 Years | 177 (100.0%) | 203 (100.0%) |
| 6 to 11 Years | 711 (96.7%) | 750 (96.0%) |
| 12 to 14 Years | 484 (100.0%) | 372 (100.0%) |
| 15 Years | 109 (83.2%) | 50 (67.6%) |
| 16 and 17 Years | 489 (92.4%) | 228 (93.4%) |
| 18 to 24 Years | 858 (91.8%) | 782 (90.8%) |
| 25 to 34 Years | 1,152 (99.3%) | 1,125 (92.9%) |
| 35 to 44 Years | 1,634 (97.0%) | 1,724 (98.4%) |
| 45 to 54 Years | 1,476 (98.9%) | 1,375 (95.3%) |
| 55 to 64 Years | 1,288 (96.9%) | 1,292 (83.7%) |
| 65 to 74 Years | 855 (97.9%) | 615 (87.2%) |
| 75 Years and over | 348 (93.5%) | 418 (97.0%) |
| Total | 10,278 (96.7%) | 9,465 (93.2%) |
Income Below Poverty Among Married-Couple Families in Covington
The poverty statistics for married-couple families in Covington show that 1.4% or 63 of the total 4,384 families live below the poverty line. Families with 5 or more children have the highest poverty rate of 6.6%, comprising of 5 families. On the other hand, families with 3 or 4 children have the lowest poverty rate of 0.0%, which includes 0 families.
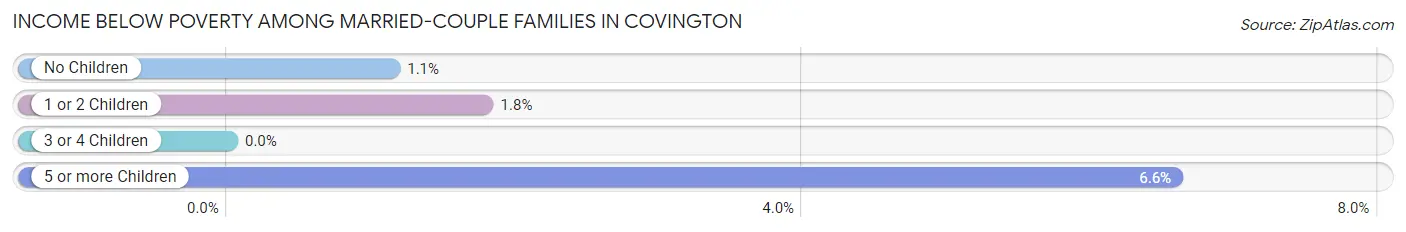
| Children | Above Poverty | Below Poverty |
| No Children | 2,266 (98.9%) | 26 (1.1%) |
| 1 or 2 Children | 1,769 (98.2%) | 32 (1.8%) |
| 3 or 4 Children | 215 (100.0%) | 0 (0.0%) |
| 5 or more Children | 71 (93.4%) | 5 (6.6%) |
| Total | 4,321 (98.6%) | 63 (1.4%) |
Income Below Poverty Among Single-Parent Households in Covington
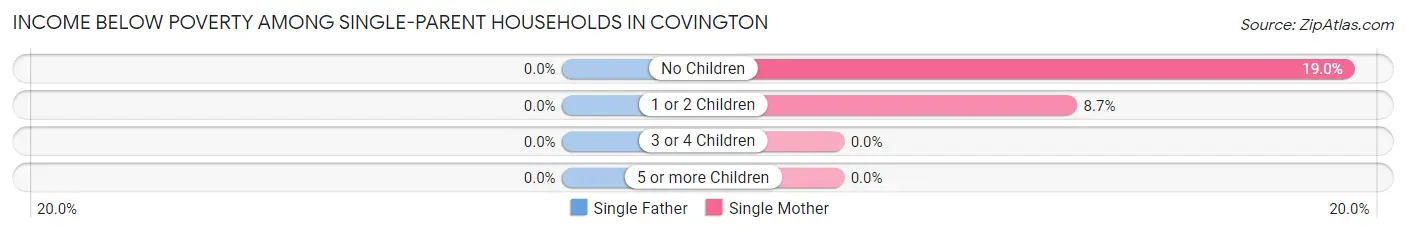
| Children | Single Father | Single Mother |
| No Children | 0 (0.0%) | 43 (19.0%) |
| 1 or 2 Children | 0 (0.0%) | 44 (8.7%) |
| 3 or 4 Children | 0 (0.0%) | 0 (0.0%) |
| 5 or more Children | 0 (0.0%) | 0 (0.0%) |
| Total | 0 (0.0%) | 87 (11.5%) |
Income Below Poverty Among Married-Couple vs Single-Parent Households in Covington
The poverty data for Covington shows that 63 of the married-couple family households (1.4%) and 87 of the single-parent households (7.7%) are living below the poverty level. Within the married-couple family households, those with 5 or more children have the highest poverty rate, with 5 households (6.6%) falling below the poverty line. Among the single-parent households, those with no children have the highest poverty rate, with 43 household (9.4%) living below poverty.
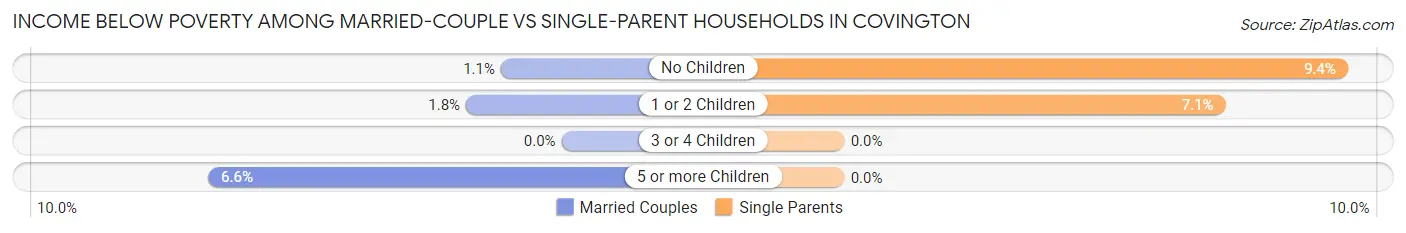
| Children | Married-Couple Families | Single-Parent Households |
| No Children | 26 (1.1%) | 43 (9.4%) |
| 1 or 2 Children | 32 (1.8%) | 44 (7.1%) |
| 3 or 4 Children | 0 (0.0%) | 0 (0.0%) |
| 5 or more Children | 5 (6.6%) | 0 (0.0%) |
| Total | 63 (1.4%) | 87 (7.7%) |
Race in Covington
The most populous races in Covington are White / Caucasian (14,036 | 67.4%), Asian (2,417 | 11.6%), and Two or more Races (2,402 | 11.5%).
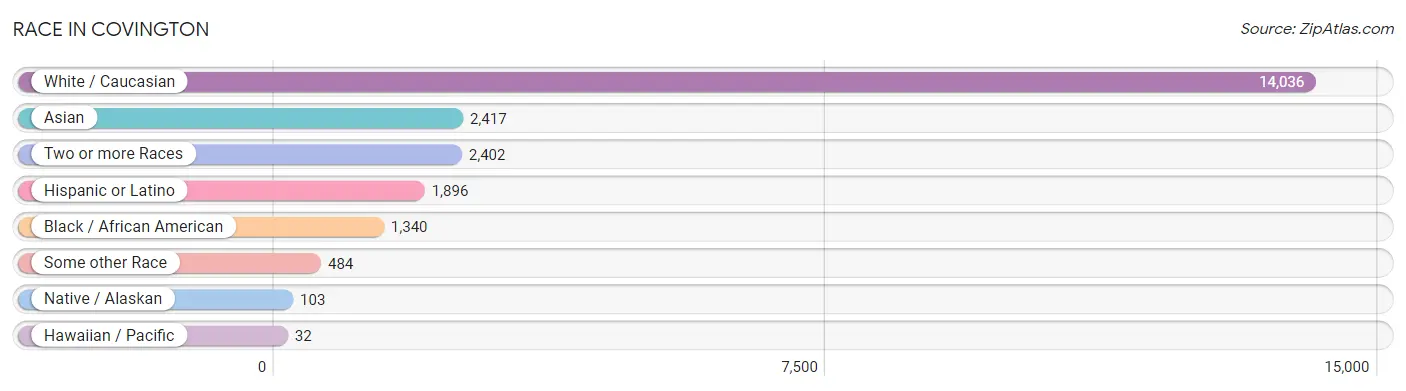
| Race | # Population | % Population |
| Asian | 2,417 | 11.6% |
| Black / African American | 1,340 | 6.4% |
| Hawaiian / Pacific | 32 | 0.2% |
| Hispanic or Latino | 1,896 | 9.1% |
| Native / Alaskan | 103 | 0.5% |
| White / Caucasian | 14,036 | 67.4% |
| Two or more Races | 2,402 | 11.5% |
| Some other Race | 484 | 2.3% |
| Total | 20,814 | 100.0% |
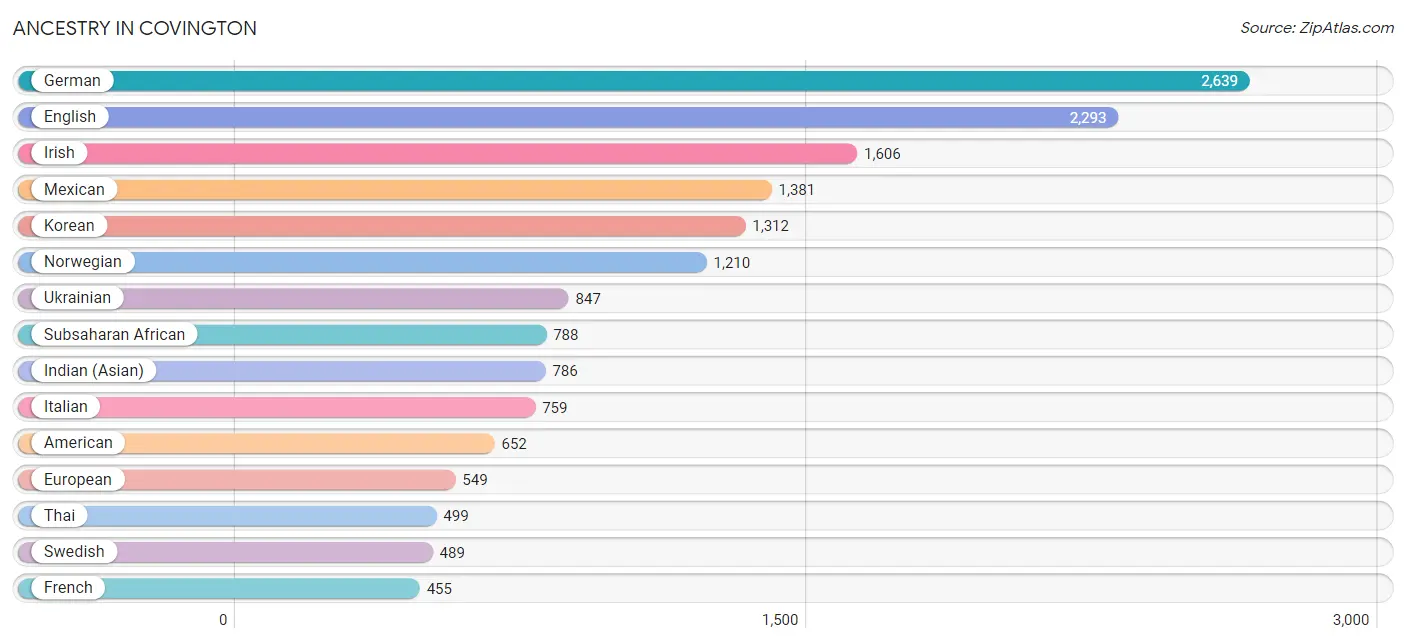
Ancestry in Covington
The most populous ancestries reported in Covington are German (2,639 | 12.7%), English (2,293 | 11.0%), Irish (1,606 | 7.7%), Mexican (1,381 | 6.6%), and Korean (1,312 | 6.3%), together accounting for 44.3% of all Covington residents.
| Ancestry | # Population | % Population |
| African | 88 | 0.4% |
| American | 652 | 3.1% |
| Arab | 82 | 0.4% |
| Armenian | 48 | 0.2% |
| Australian | 22 | 0.1% |
| Austrian | 142 | 0.7% |
| Belgian | 31 | 0.2% |
| Bhutanese | 308 | 1.5% |
| Blackfeet | 21 | 0.1% |
| Brazilian | 65 | 0.3% |
| British | 78 | 0.4% |
| Burmese | 179 | 0.9% |
| Canadian | 83 | 0.4% |
| Central American | 123 | 0.6% |
| Central American Indian | 17 | 0.1% |
| Chippewa | 47 | 0.2% |
| Colville | 76 | 0.4% |
| Croatian | 27 | 0.1% |
| Cuban | 14 | 0.1% |
| Czech | 65 | 0.3% |
| Czechoslovakian | 19 | 0.1% |
| Danish | 106 | 0.5% |
| Dutch | 196 | 0.9% |
| Eastern European | 116 | 0.6% |
| English | 2,293 | 11.0% |
| Estonian | 13 | 0.1% |
| Ethiopian | 71 | 0.3% |
| European | 549 | 2.6% |
| Finnish | 15 | 0.1% |
| French | 455 | 2.2% |
| French American Indian | 14 | 0.1% |
| French Canadian | 109 | 0.5% |
| German | 2,639 | 12.7% |
| Greek | 77 | 0.4% |
| Guatemalan | 24 | 0.1% |
| Honduran | 3 | 0.0% |
| Hungarian | 247 | 1.2% |
| Icelander | 29 | 0.1% |
| Indian (Asian) | 786 | 3.8% |
| Iranian | 123 | 0.6% |
| Iraqi | 50 | 0.2% |
| Irish | 1,606 | 7.7% |
| Italian | 759 | 3.6% |
| Japanese | 35 | 0.2% |
| Korean | 1,312 | 6.3% |
| Lebanese | 12 | 0.1% |
| Lithuanian | 185 | 0.9% |
| Malaysian | 142 | 0.7% |
| Mexican | 1,381 | 6.6% |
| Mexican American Indian | 18 | 0.1% |
| Native Hawaiian | 76 | 0.4% |
| New Zealander | 7 | 0.0% |
| Nicaraguan | 23 | 0.1% |
| Nigerian | 177 | 0.9% |
| Northern European | 204 | 1.0% |
| Norwegian | 1,210 | 5.8% |
| Pakistani | 17 | 0.1% |
| Polish | 157 | 0.7% |
| Puerto Rican | 24 | 0.1% |
| Puget Sound Salish | 12 | 0.1% |
| Romanian | 92 | 0.4% |
| Russian | 319 | 1.5% |
| Salvadoran | 73 | 0.4% |
| Samoan | 45 | 0.2% |
| Scandinavian | 99 | 0.5% |
| Scotch-Irish | 58 | 0.3% |
| Scottish | 411 | 2.0% |
| Senegalese | 191 | 0.9% |
| Slovak | 25 | 0.1% |
| Somali | 128 | 0.6% |
| Spaniard | 209 | 1.0% |
| Spanish | 42 | 0.2% |
| Sri Lankan | 353 | 1.7% |
| Subsaharan African | 788 | 3.8% |
| Swedish | 489 | 2.4% |
| Swiss | 55 | 0.3% |
| Thai | 499 | 2.4% |
| Tlingit-Haida | 48 | 0.2% |
| Ukrainian | 847 | 4.1% |
| Welsh | 237 | 1.1% |
| Yugoslavian | 15 | 0.1% | View All 81 Rows |
Immigrants in Covington
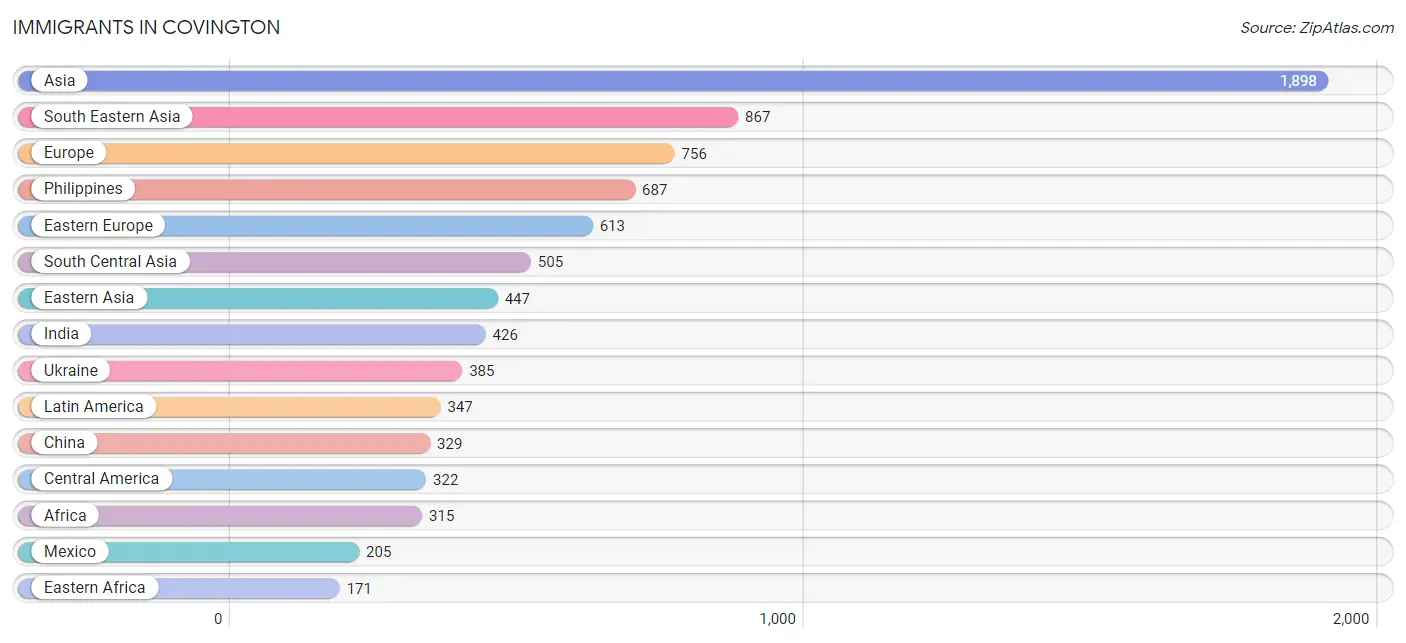
The most numerous immigrant groups reported in Covington came from Asia (1,898 | 9.1%), South Eastern Asia (867 | 4.2%), Europe (756 | 3.6%), Philippines (687 | 3.3%), and Eastern Europe (613 | 2.9%), together accounting for 23.2% of all Covington residents.
| Immigration Origin | # Population | % Population |
| Africa | 315 | 1.5% |
| Asia | 1,898 | 9.1% |
| Belarus | 57 | 0.3% |
| Brazil | 25 | 0.1% |
| Canada | 133 | 0.6% |
| Central America | 322 | 1.5% |
| China | 329 | 1.6% |
| Eastern Africa | 171 | 0.8% |
| Eastern Asia | 447 | 2.1% |
| Eastern Europe | 613 | 2.9% |
| El Salvador | 73 | 0.4% |
| England | 31 | 0.2% |
| Ethiopia | 70 | 0.3% |
| Europe | 756 | 3.6% |
| France | 37 | 0.2% |
| Germany | 10 | 0.1% |
| Guatemala | 24 | 0.1% |
| Honduras | 3 | 0.0% |
| Hong Kong | 139 | 0.7% |
| Hungary | 59 | 0.3% |
| India | 426 | 2.1% |
| Iran | 32 | 0.2% |
| Iraq | 59 | 0.3% |
| Israel | 20 | 0.1% |
| Japan | 84 | 0.4% |
| Kazakhstan | 18 | 0.1% |
| Korea | 34 | 0.2% |
| Laos | 36 | 0.2% |
| Latin America | 347 | 1.7% |
| Latvia | 15 | 0.1% |
| Mexico | 205 | 1.0% |
| Nicaragua | 17 | 0.1% |
| Nigeria | 42 | 0.2% |
| Northern Europe | 96 | 0.5% |
| Norway | 11 | 0.1% |
| Oceania | 7 | 0.0% |
| Philippines | 687 | 3.3% |
| Romania | 14 | 0.1% |
| Russia | 83 | 0.4% |
| Senegal | 87 | 0.4% |
| Somalia | 55 | 0.3% |
| South America | 25 | 0.1% |
| South Central Asia | 505 | 2.4% |
| South Eastern Asia | 867 | 4.2% |
| Thailand | 17 | 0.1% |
| Ukraine | 385 | 1.8% |
| Uzbekistan | 29 | 0.1% |
| Vietnam | 127 | 0.6% |
| Western Africa | 144 | 0.7% |
| Western Asia | 79 | 0.4% |
| Western Europe | 47 | 0.2% | View All 51 Rows |
Sex and Age in Covington
Sex and Age in Covington
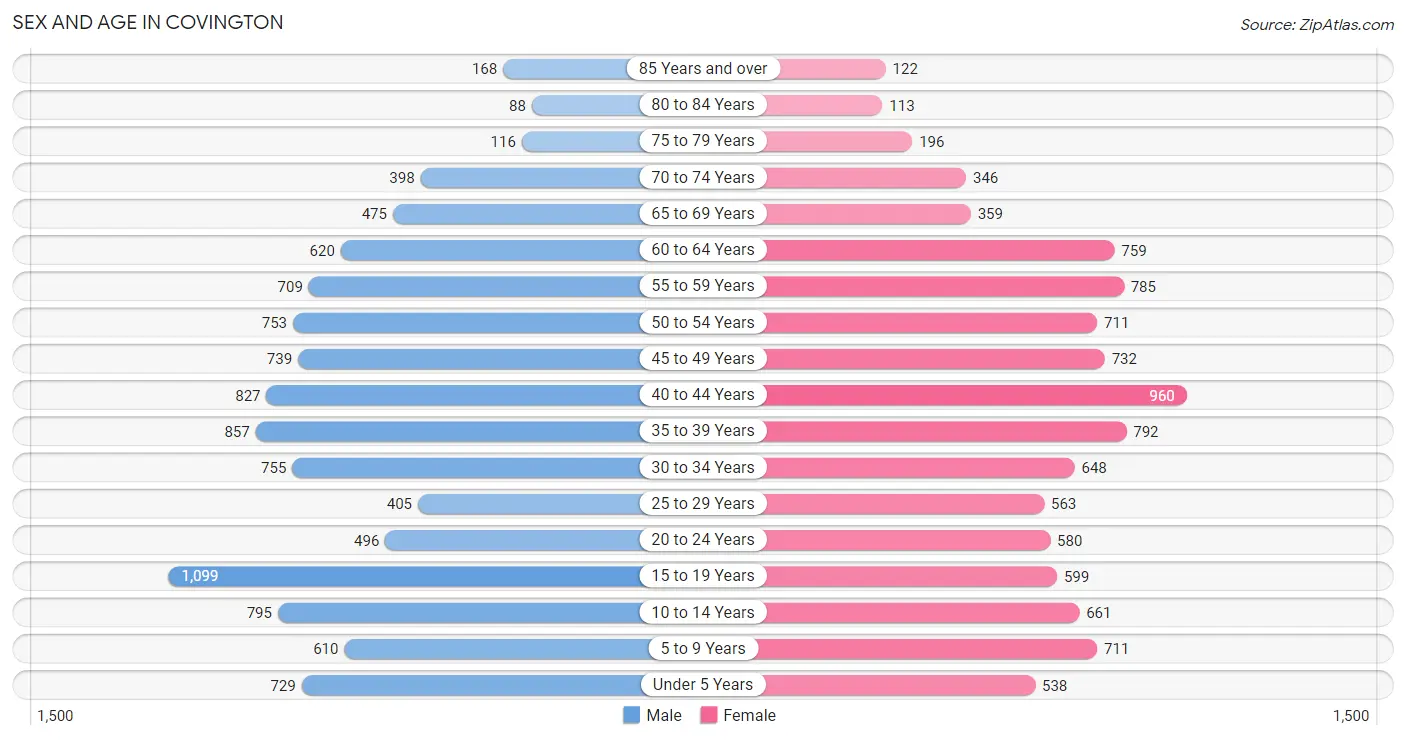
The most populous age groups in Covington are 15 to 19 Years (1,099 | 10.3%) for men and 40 to 44 Years (960 | 9.4%) for women.
| Age Bracket | Male | Female |
| Under 5 Years | 729 (6.9%) | 538 (5.3%) |
| 5 to 9 Years | 610 (5.7%) | 711 (7.0%) |
| 10 to 14 Years | 795 (7.5%) | 661 (6.5%) |
| 15 to 19 Years | 1,099 (10.3%) | 599 (5.9%) |
| 20 to 24 Years | 496 (4.7%) | 580 (5.7%) |
| 25 to 29 Years | 405 (3.8%) | 563 (5.5%) |
| 30 to 34 Years | 755 (7.1%) | 648 (6.4%) |
| 35 to 39 Years | 857 (8.1%) | 792 (7.8%) |
| 40 to 44 Years | 827 (7.8%) | 960 (9.4%) |
| 45 to 49 Years | 739 (7.0%) | 732 (7.2%) |
| 50 to 54 Years | 753 (7.1%) | 711 (7.0%) |
| 55 to 59 Years | 709 (6.7%) | 785 (7.7%) |
| 60 to 64 Years | 620 (5.8%) | 759 (7.5%) |
| 65 to 69 Years | 475 (4.5%) | 359 (3.5%) |
| 70 to 74 Years | 398 (3.7%) | 346 (3.4%) |
| 75 to 79 Years | 116 (1.1%) | 196 (1.9%) |
| 80 to 84 Years | 88 (0.8%) | 113 (1.1%) |
| 85 Years and over | 168 (1.6%) | 122 (1.2%) |
| Total | 10,639 (100.0%) | 10,175 (100.0%) |
Families and Households in Covington
Median Family Size in Covington
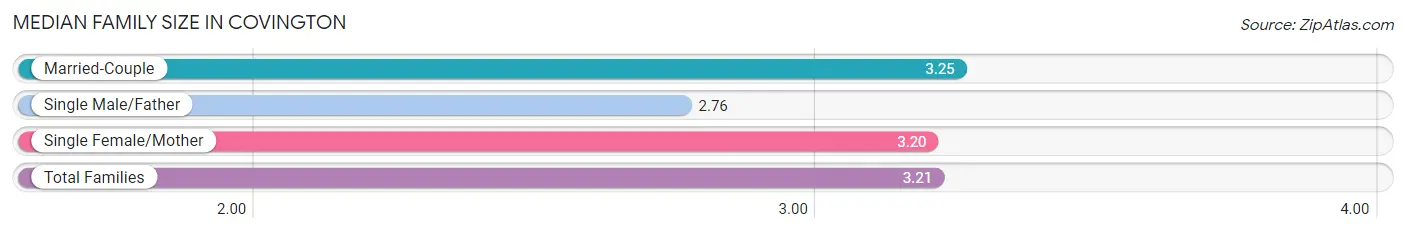
The median family size in Covington is 3.21 persons per family, with married-couple families (4,384 | 79.5%) accounting for the largest median family size of 3.25 persons per family. On the other hand, single male/father families (373 | 6.8%) represent the smallest median family size with 2.76 persons per family.
| Family Type | # Families | Family Size |
| Married-Couple | 4,384 (79.5%) | 3.25 |
| Single Male/Father | 373 (6.8%) | 2.76 |
| Single Female/Mother | 754 (13.7%) | 3.20 |
| Total Families | 5,511 (100.0%) | 3.21 |
Median Household Size in Covington
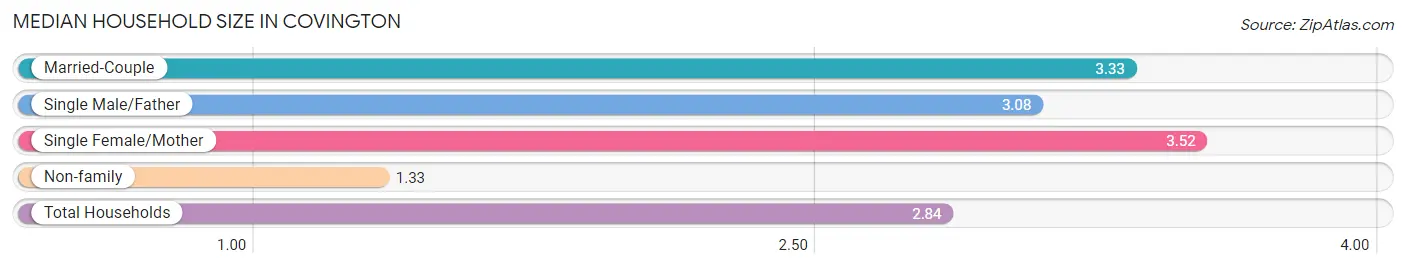
The median household size in Covington is 2.84 persons per household, with single female/mother households (754 | 10.3%) accounting for the largest median household size of 3.52 persons per household. non-family households (1,795 | 24.6%) represent the smallest median household size with 1.33 persons per household.
| Household Type | # Households | Household Size |
| Married-Couple | 4,384 (60.0%) | 3.33 |
| Single Male/Father | 373 (5.1%) | 3.08 |
| Single Female/Mother | 754 (10.3%) | 3.52 |
| Non-family | 1,795 (24.6%) | 1.33 |
| Total Households | 7,306 (100.0%) | 2.84 |
Household Size by Marriage Status in Covington
Out of a total of 7,306 households in Covington, 5,511 (75.4%) are family households, while 1,795 (24.6%) are nonfamily households. The most numerous type of family households are 2-person households, comprising 1,915, and the most common type of nonfamily households are 1-person households, comprising 1,372.
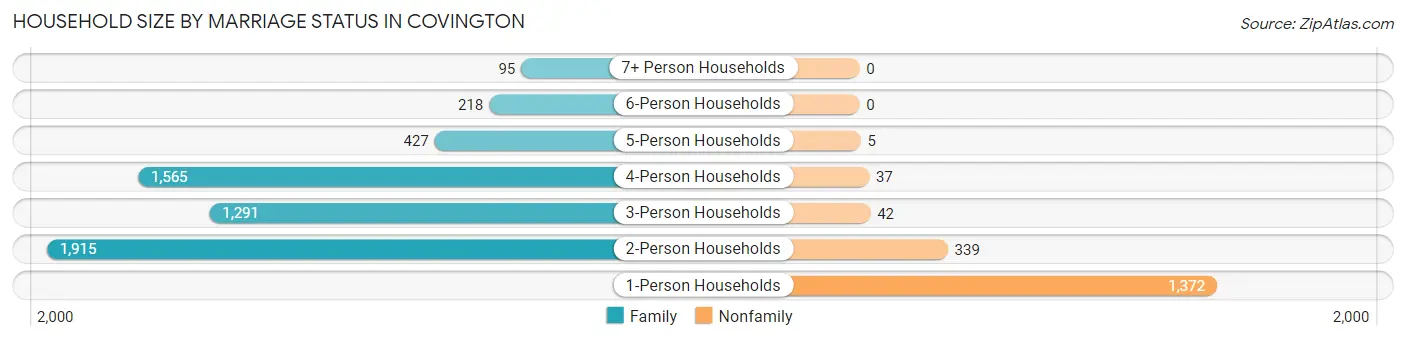
| Household Size | Family Households | Nonfamily Households |
| 1-Person Households | - | 1,372 (18.8%) |
| 2-Person Households | 1,915 (26.2%) | 339 (4.6%) |
| 3-Person Households | 1,291 (17.7%) | 42 (0.6%) |
| 4-Person Households | 1,565 (21.4%) | 37 (0.5%) |
| 5-Person Households | 427 (5.8%) | 5 (0.1%) |
| 6-Person Households | 218 (3.0%) | 0 (0.0%) |
| 7+ Person Households | 95 (1.3%) | 0 (0.0%) |
| Total | 5,511 (75.4%) | 1,795 (24.6%) |
Female Fertility in Covington
Fertility by Age in Covington
Average fertility rate in Covington is 73.0 births per 1,000 women. Women in the age bracket of 20 to 34 years have the highest fertility rate with 171.0 births per 1,000 women. Women in the age bracket of 20 to 34 years acount for 83.4% of all women with births.
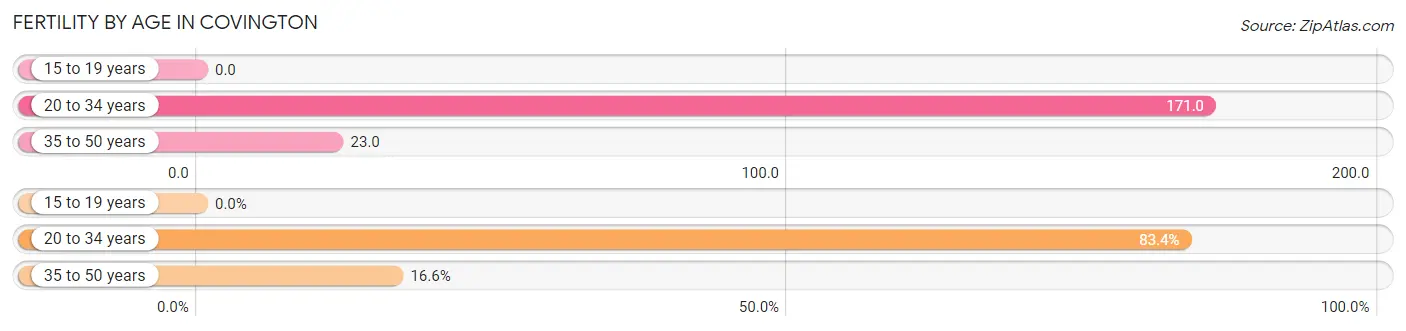
| Age Bracket | Women with Births | Births / 1,000 Women |
| 15 to 19 years | 0 (0.0%) | 0.0 |
| 20 to 34 years | 307 (83.4%) | 171.0 |
| 35 to 50 years | 61 (16.6%) | 23.0 |
| Total | 368 (100.0%) | 73.0 |
Fertility by Age by Marriage Status in Covington
81.2% of women with births (368) in Covington are married. The highest percentage of unmarried women with births falls into 20 to 34 years age bracket with 22.5% of them unmarried at the time of birth, while the lowest percentage of unmarried women with births belong to 35 to 50 years age bracket with 0.0% of them unmarried.
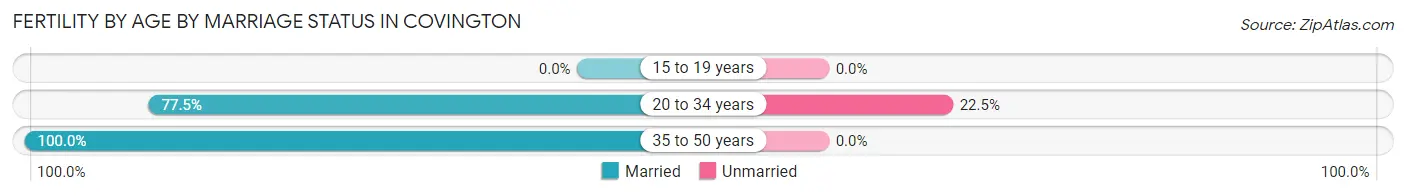
| Age Bracket | Married | Unmarried |
| 15 to 19 years | 0 (0.0%) | 0 (0.0%) |
| 20 to 34 years | 238 (77.5%) | 69 (22.5%) |
| 35 to 50 years | 61 (100.0%) | 0 (0.0%) |
| Total | 299 (81.2%) | 69 (18.8%) |
Fertility by Education in Covington
Average fertility rate in Covington is 73.0 births per 1,000 women. Women with the education attainment of bachelor's degree have the highest fertility rate of 101.0 births per 1,000 women, while women with the education attainment of graduate degree have the lowest fertility at 22.0 births per 1,000 women. Women with the education attainment of college or associate's degree represent 36.4% of all women with births.
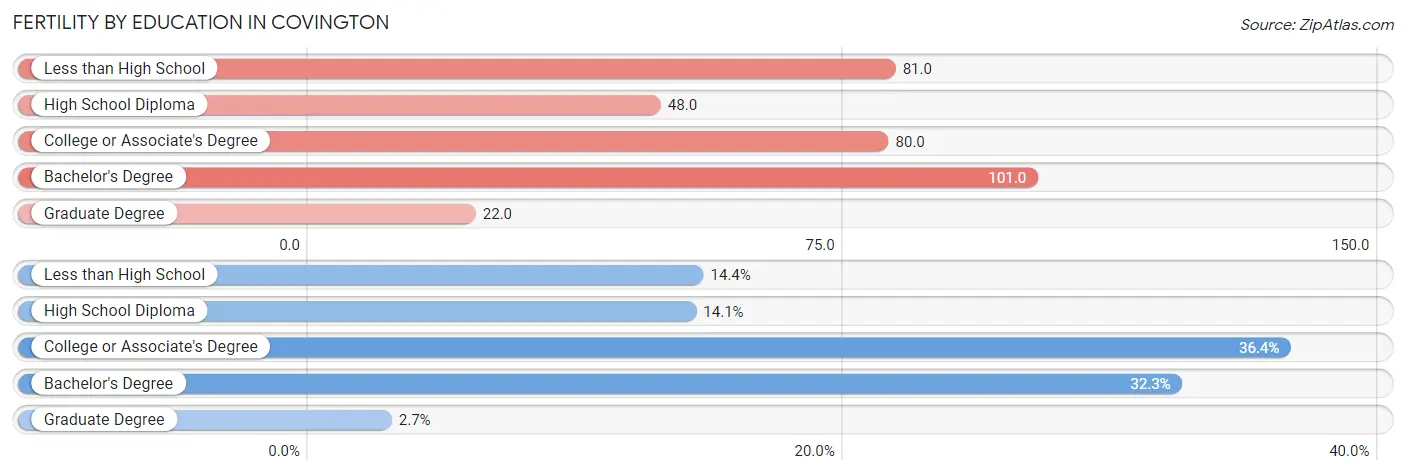
| Educational Attainment | Women with Births | Births / 1,000 Women |
| Less than High School | 53 (14.4%) | 81.0 |
| High School Diploma | 52 (14.1%) | 48.0 |
| College or Associate's Degree | 134 (36.4%) | 80.0 |
| Bachelor's Degree | 119 (32.3%) | 101.0 |
| Graduate Degree | 10 (2.7%) | 22.0 |
| Total | 368 (100.0%) | 73.0 |
Fertility by Education by Marriage Status in Covington
18.8% of women with births in Covington are unmarried. Women with the educational attainment of less than high school are most likely to be married with 100.0% of them married at childbirth, while women with the educational attainment of graduate degree are least likely to be married with 100.0% of them unmarried at childbirth.
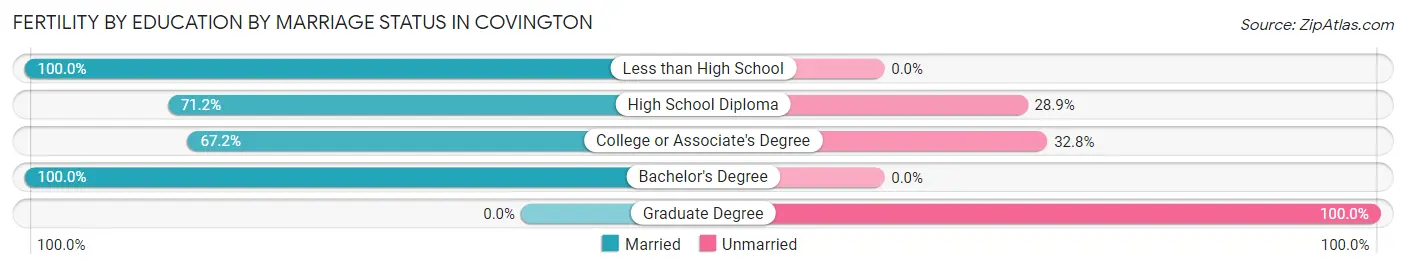
| Educational Attainment | Married | Unmarried |
| Less than High School | 53 (100.0%) | 0 (0.0%) |
| High School Diploma | 37 (71.2%) | 15 (28.8%) |
| College or Associate's Degree | 90 (67.2%) | 44 (32.8%) |
| Bachelor's Degree | 119 (100.0%) | 0 (0.0%) |
| Graduate Degree | 0 (0.0%) | 10 (100.0%) |
| Total | 299 (81.2%) | 69 (18.8%) |
Employment Characteristics in Covington
Employment by Class of Employer in Covington
Among the 10,936 employed individuals in Covington, private company employees (8,103 | 74.1%), local government employees (855 | 7.8%), and not-for-profit organizations (771 | 7.0%) make up the most common classes of employment.
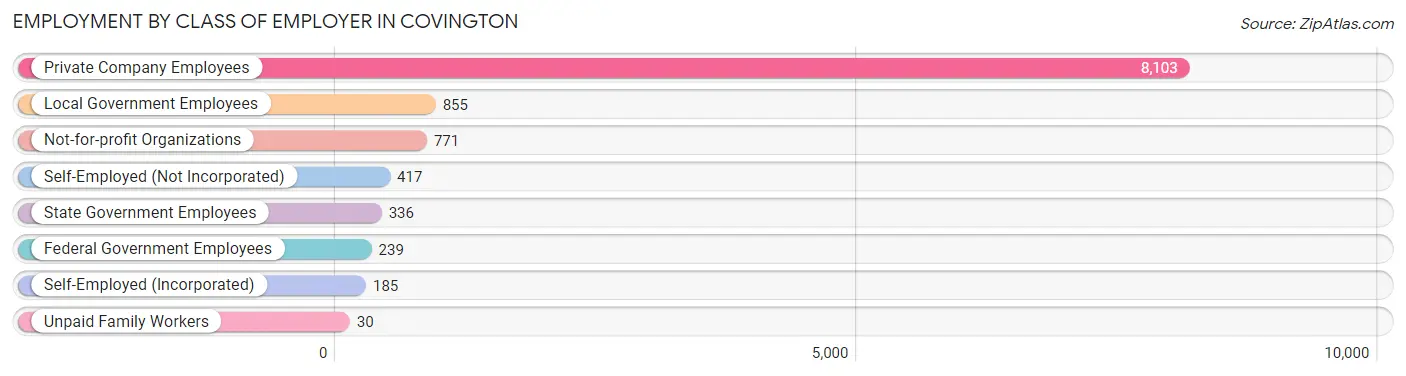
| Employer Class | # Employees | % Employees |
| Private Company Employees | 8,103 | 74.1% |
| Self-Employed (Incorporated) | 185 | 1.7% |
| Self-Employed (Not Incorporated) | 417 | 3.8% |
| Not-for-profit Organizations | 771 | 7.0% |
| Local Government Employees | 855 | 7.8% |
| State Government Employees | 336 | 3.1% |
| Federal Government Employees | 239 | 2.2% |
| Unpaid Family Workers | 30 | 0.3% |
| Total | 10,936 | 100.0% |
Employment Status by Age in Covington
According to the labor force statistics for Covington, out of the total population over 16 years of age (16,565), 70.0% or 11,596 individuals are in the labor force, with 3.4% or 394 of them unemployed. The age group with the highest labor force participation rate is 45 to 54 years, with 91.9% or 2,697 individuals in the labor force. Within the labor force, the 16 to 19 years age range has the highest percentage of unemployed individuals, with 9.8% or 61 of them being unemployed.
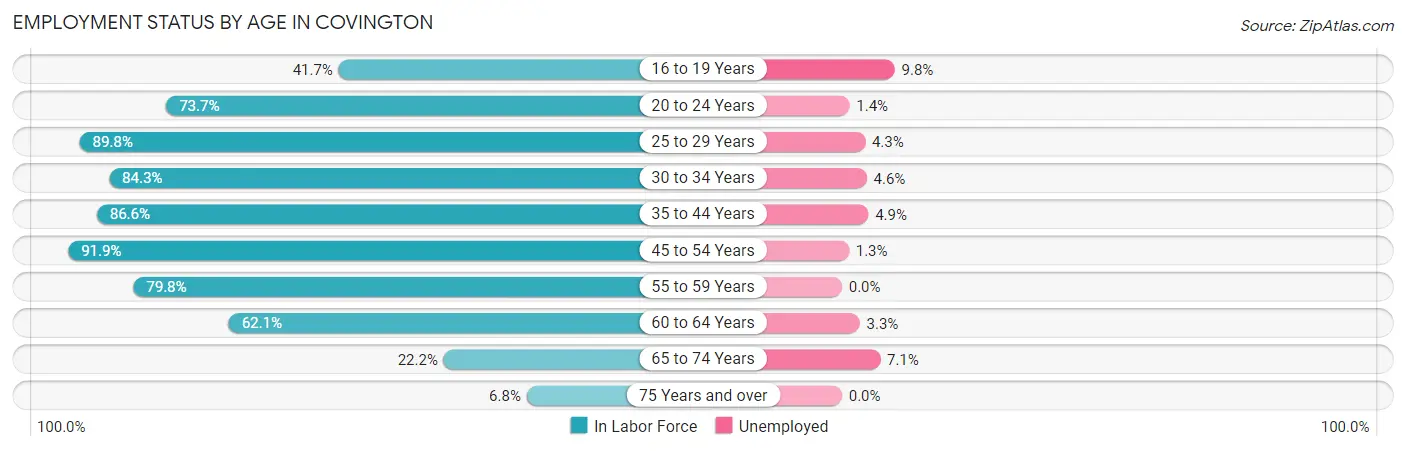
| Age Bracket | In Labor Force | Unemployed |
| 16 to 19 Years | 623 (41.7%) | 61 (9.8%) |
| 20 to 24 Years | 793 (73.7%) | 11 (1.4%) |
| 25 to 29 Years | 869 (89.8%) | 37 (4.3%) |
| 30 to 34 Years | 1,183 (84.3%) | 54 (4.6%) |
| 35 to 44 Years | 2,976 (86.6%) | 146 (4.9%) |
| 45 to 54 Years | 2,697 (91.9%) | 35 (1.3%) |
| 55 to 59 Years | 1,192 (79.8%) | 0 (0.0%) |
| 60 to 64 Years | 856 (62.1%) | 28 (3.3%) |
| 65 to 74 Years | 350 (22.2%) | 25 (7.1%) |
| 75 Years and over | 55 (6.8%) | 0 (0.0%) |
| Total | 11,596 (70.0%) | 394 (3.4%) |
Employment Status by Educational Attainment in Covington
According to labor force statistics for Covington, 84.1% of individuals (9,768) out of the total population between 25 and 64 years of age (11,615) are in the labor force, with 3.1% or 303 of them being unemployed. The group with the highest labor force participation rate are those with the educational attainment of bachelor's degree or higher, with 89.5% or 3,604 individuals in the labor force. Within the labor force, individuals with less than high school education have the highest percentage of unemployment, with 23.2% or 95 of them being unemployed.
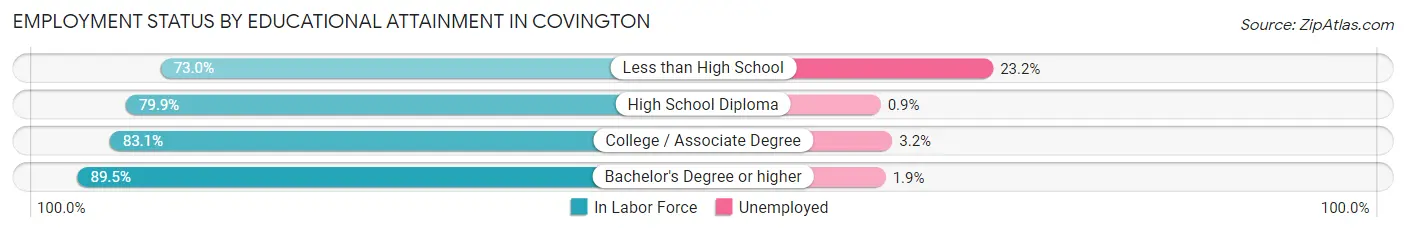
| Educational Attainment | In Labor Force | Unemployed |
| Less than High School | 410 (73.0%) | 130 (23.2%) |
| High School Diploma | 2,067 (79.9%) | 23 (0.9%) |
| College / Associate Degree | 3,689 (83.1%) | 142 (3.2%) |
| Bachelor's Degree or higher | 3,604 (89.5%) | 77 (1.9%) |
| Total | 9,768 (84.1%) | 360 (3.1%) |
Employment Occupations by Sex in Covington
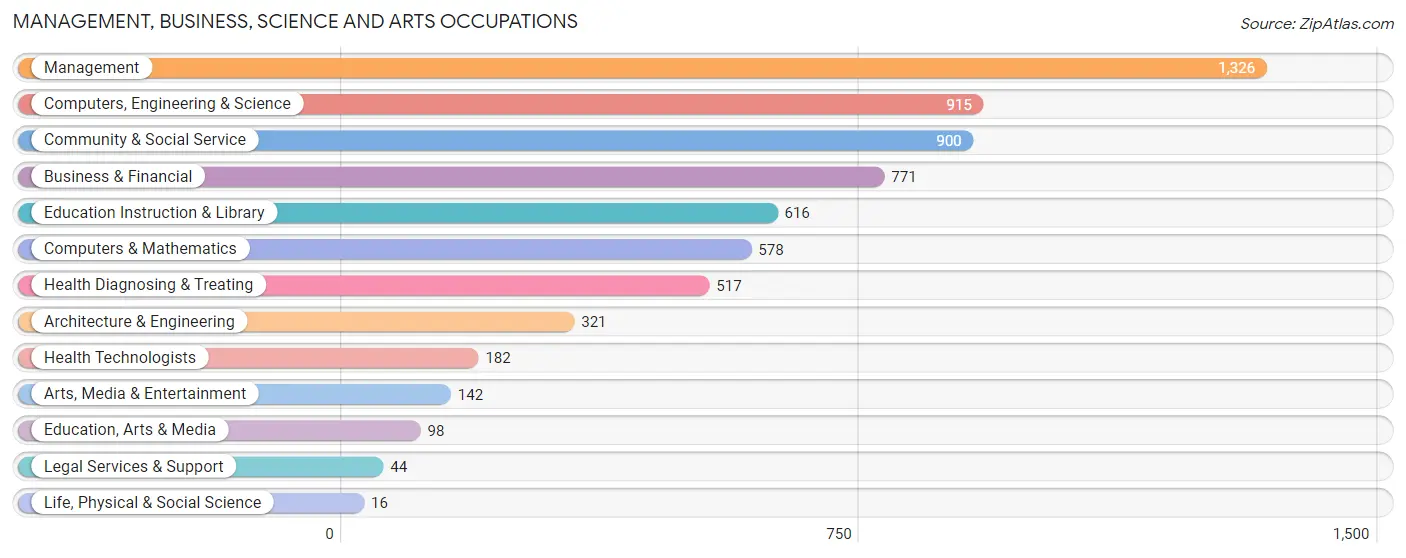
Management, Business, Science and Arts Occupations
The most common Management, Business, Science and Arts occupations in Covington are Management (1,326 | 11.8%), Computers, Engineering & Science (915 | 8.2%), Community & Social Service (900 | 8.0%), Business & Financial (771 | 6.9%), and Education Instruction & Library (616 | 5.5%).
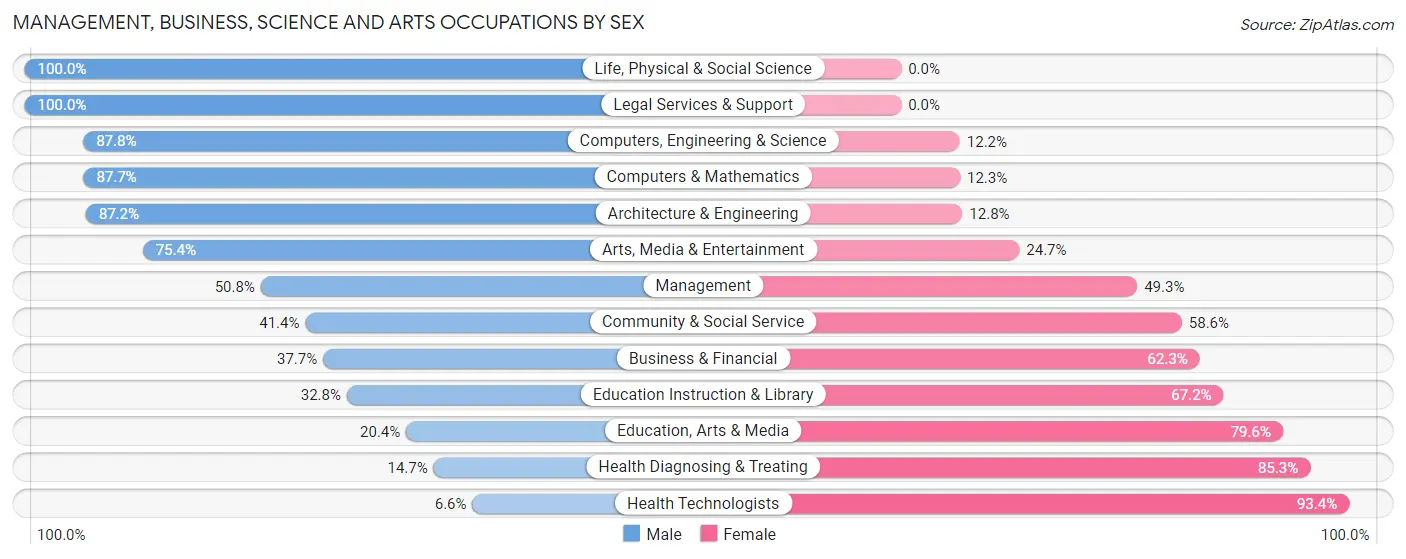
Management, Business, Science and Arts Occupations by Sex
Within the Management, Business, Science and Arts occupations in Covington, the most male-oriented occupations are Life, Physical & Social Science (100.0%), Legal Services & Support (100.0%), and Computers, Engineering & Science (87.8%), while the most female-oriented occupations are Health Technologists (93.4%), Health Diagnosing & Treating (85.3%), and Education, Arts & Media (79.6%).
| Occupation | Male | Female |
| Management | 673 (50.7%) | 653 (49.2%) |
| Business & Financial | 291 (37.7%) | 480 (62.3%) |
| Computers, Engineering & Science | 803 (87.8%) | 112 (12.2%) |
| Computers & Mathematics | 507 (87.7%) | 71 (12.3%) |
| Architecture & Engineering | 280 (87.2%) | 41 (12.8%) |
| Life, Physical & Social Science | 16 (100.0%) | 0 (0.0%) |
| Community & Social Service | 373 (41.4%) | 527 (58.6%) |
| Education, Arts & Media | 20 (20.4%) | 78 (79.6%) |
| Legal Services & Support | 44 (100.0%) | 0 (0.0%) |
| Education Instruction & Library | 202 (32.8%) | 414 (67.2%) |
| Arts, Media & Entertainment | 107 (75.3%) | 35 (24.6%) |
| Health Diagnosing & Treating | 76 (14.7%) | 441 (85.3%) |
| Health Technologists | 12 (6.6%) | 170 (93.4%) |
| Total (Category) | 2,216 (50.0%) | 2,213 (50.0%) |
| Total (Overall) | 5,772 (51.6%) | 5,423 (48.4%) |
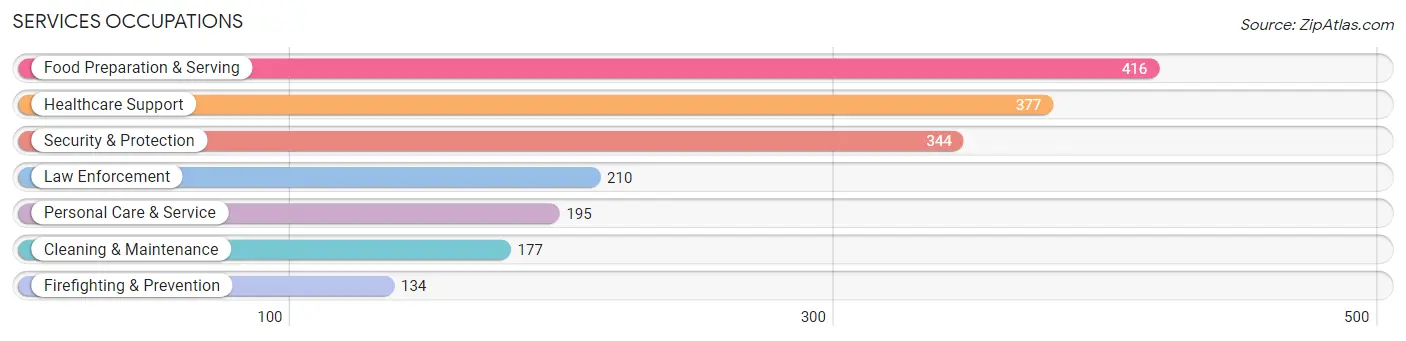
Services Occupations
The most common Services occupations in Covington are Food Preparation & Serving (416 | 3.7%), Healthcare Support (377 | 3.4%), Security & Protection (344 | 3.1%), Law Enforcement (210 | 1.9%), and Personal Care & Service (195 | 1.7%).
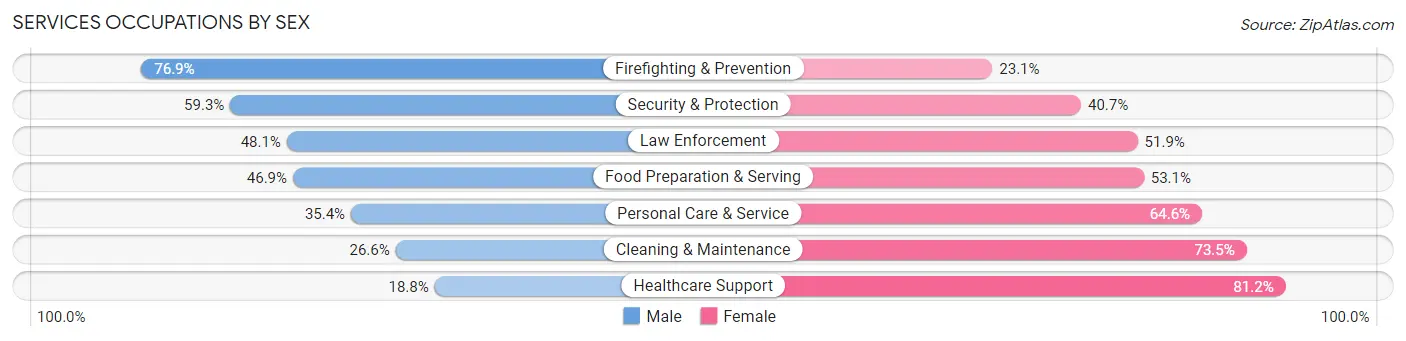
Services Occupations by Sex
Within the Services occupations in Covington, the most male-oriented occupations are Firefighting & Prevention (76.9%), Security & Protection (59.3%), and Law Enforcement (48.1%), while the most female-oriented occupations are Healthcare Support (81.2%), Cleaning & Maintenance (73.5%), and Personal Care & Service (64.6%).
| Occupation | Male | Female |
| Healthcare Support | 71 (18.8%) | 306 (81.2%) |
| Security & Protection | 204 (59.3%) | 140 (40.7%) |
| Firefighting & Prevention | 103 (76.9%) | 31 (23.1%) |
| Law Enforcement | 101 (48.1%) | 109 (51.9%) |
| Food Preparation & Serving | 195 (46.9%) | 221 (53.1%) |
| Cleaning & Maintenance | 47 (26.6%) | 130 (73.5%) |
| Personal Care & Service | 69 (35.4%) | 126 (64.6%) |
| Total (Category) | 586 (38.8%) | 923 (61.2%) |
| Total (Overall) | 5,772 (51.6%) | 5,423 (48.4%) |
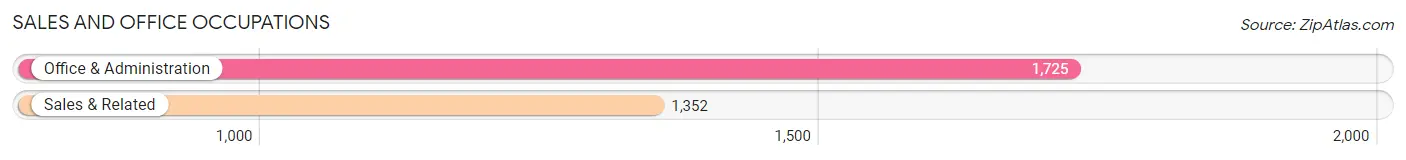
Sales and Office Occupations
The most common Sales and Office occupations in Covington are Office & Administration (1,725 | 15.4%), and Sales & Related (1,352 | 12.1%).
Sales and Office Occupations by Sex
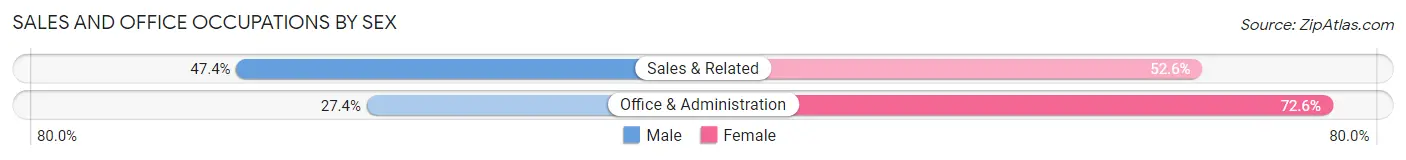
| Occupation | Male | Female |
| Sales & Related | 641 (47.4%) | 711 (52.6%) |
| Office & Administration | 472 (27.4%) | 1,253 (72.6%) |
| Total (Category) | 1,113 (36.2%) | 1,964 (63.8%) |
| Total (Overall) | 5,772 (51.6%) | 5,423 (48.4%) |
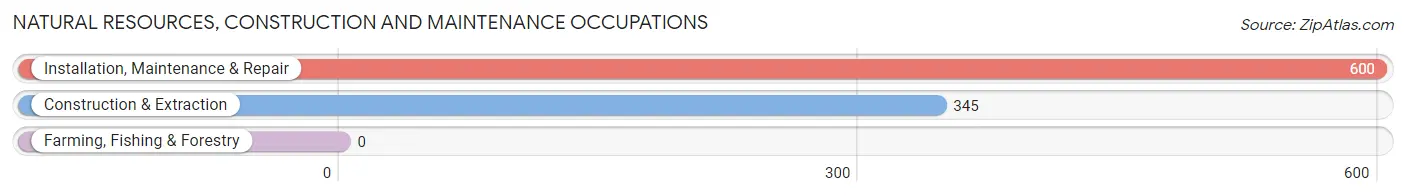
Natural Resources, Construction and Maintenance Occupations
The most common Natural Resources, Construction and Maintenance occupations in Covington are Installation, Maintenance & Repair (600 | 5.4%), and Construction & Extraction (345 | 3.1%).
Natural Resources, Construction and Maintenance Occupations by Sex
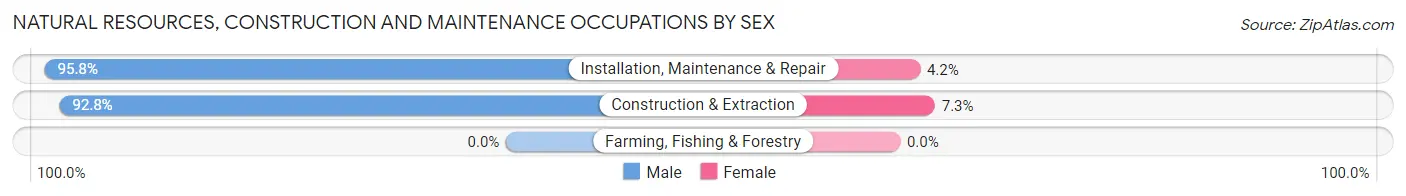
| Occupation | Male | Female |
| Farming, Fishing & Forestry | 0 (0.0%) | 0 (0.0%) |
| Construction & Extraction | 320 (92.7%) | 25 (7.2%) |
| Installation, Maintenance & Repair | 575 (95.8%) | 25 (4.2%) |
| Total (Category) | 895 (94.7%) | 50 (5.3%) |
| Total (Overall) | 5,772 (51.6%) | 5,423 (48.4%) |
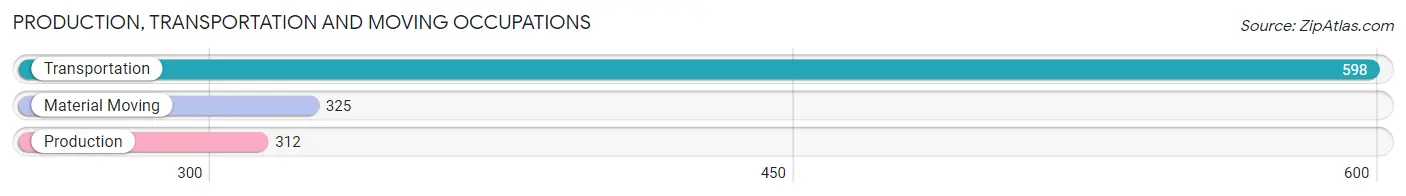
Production, Transportation and Moving Occupations
The most common Production, Transportation and Moving occupations in Covington are Transportation (598 | 5.3%), Material Moving (325 | 2.9%), and Production (312 | 2.8%).
Production, Transportation and Moving Occupations by Sex
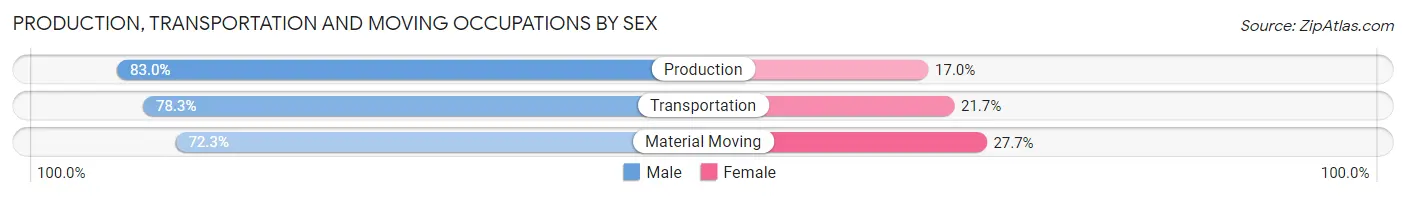
| Occupation | Male | Female |
| Production | 259 (83.0%) | 53 (17.0%) |
| Transportation | 468 (78.3%) | 130 (21.7%) |
| Material Moving | 235 (72.3%) | 90 (27.7%) |
| Total (Category) | 962 (77.9%) | 273 (22.1%) |
| Total (Overall) | 5,772 (51.6%) | 5,423 (48.4%) |
Employment Industries by Sex in Covington
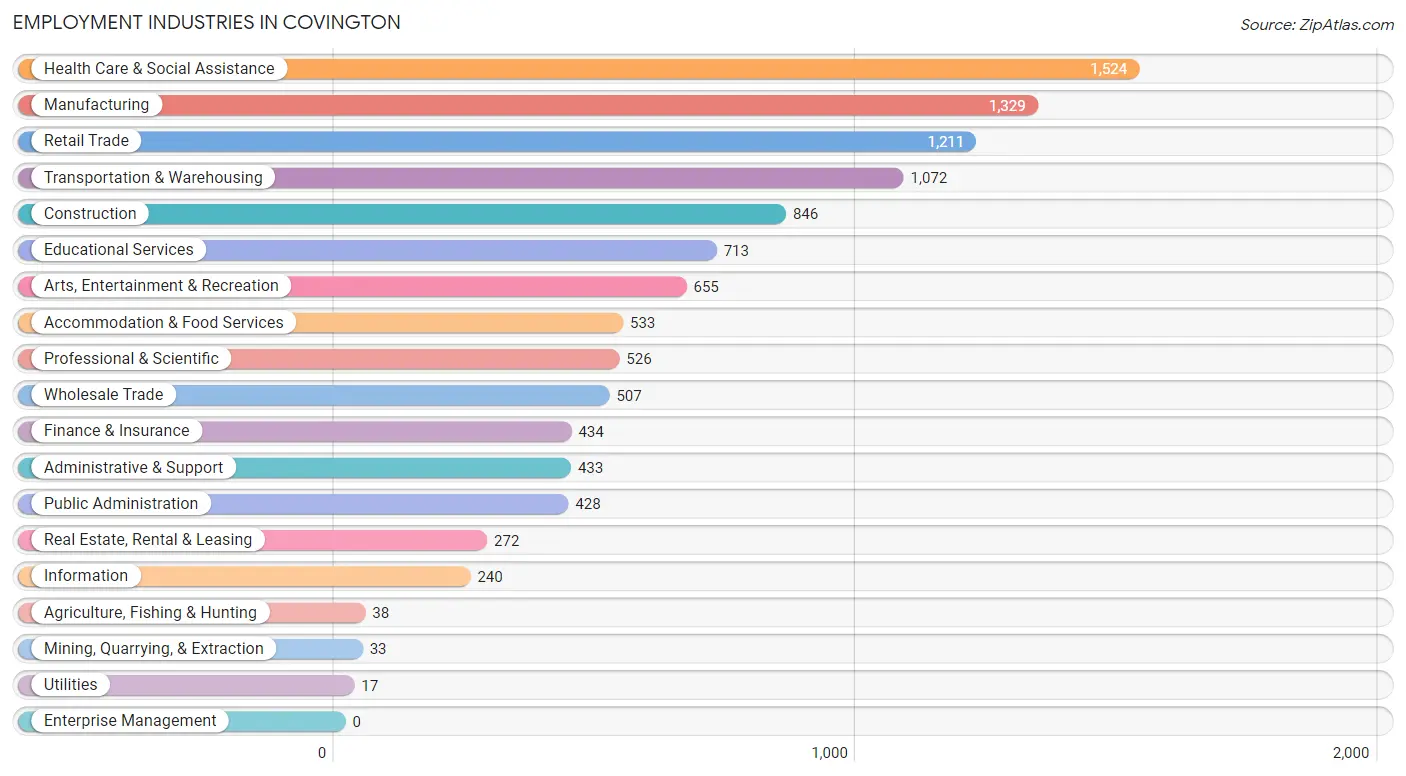
Employment Industries in Covington
The major employment industries in Covington include Health Care & Social Assistance (1,524 | 13.6%), Manufacturing (1,329 | 11.9%), Retail Trade (1,211 | 10.8%), Transportation & Warehousing (1,072 | 9.6%), and Construction (846 | 7.6%).
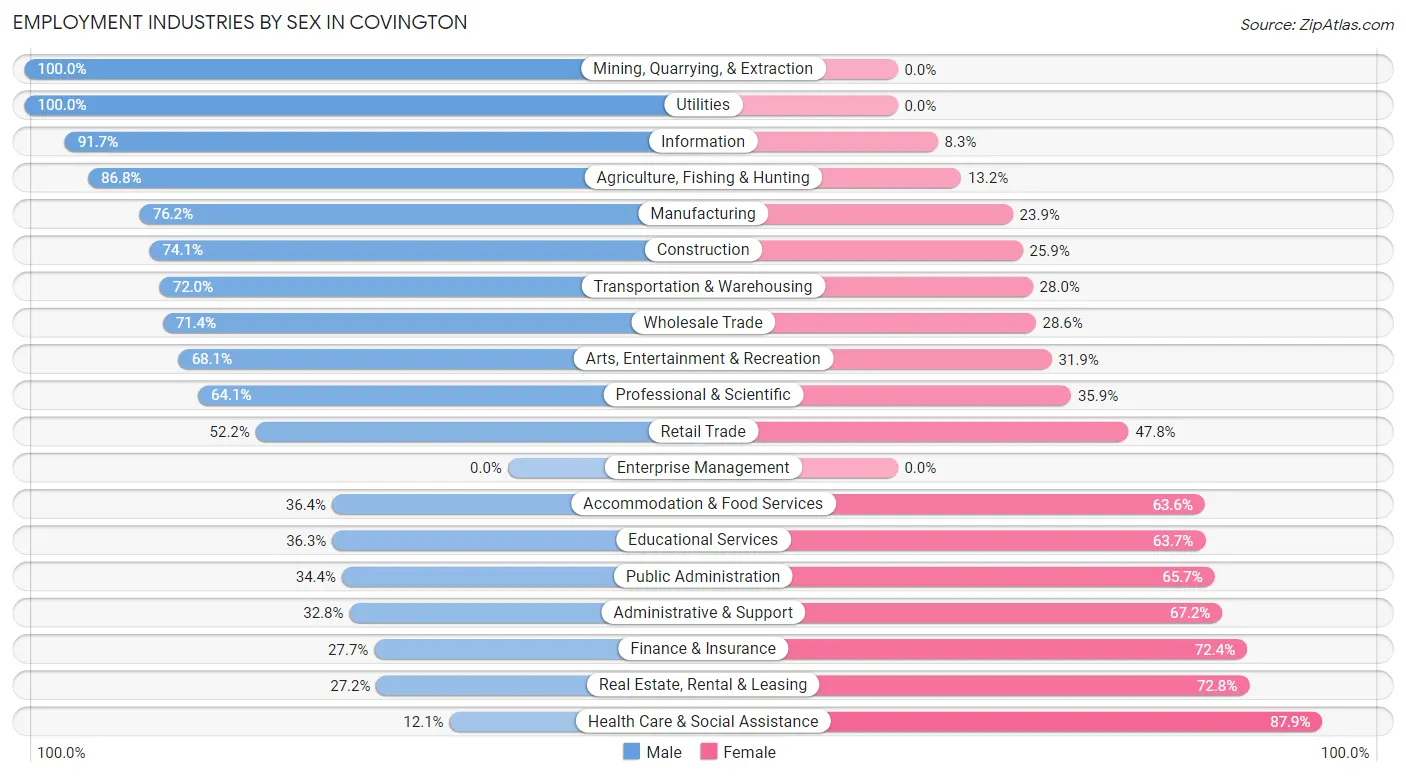
Employment Industries by Sex in Covington
The Covington industries that see more men than women are Mining, Quarrying, & Extraction (100.0%), Utilities (100.0%), and Information (91.7%), whereas the industries that tend to have a higher number of women are Health Care & Social Assistance (87.9%), Real Estate, Rental & Leasing (72.8%), and Finance & Insurance (72.4%).
| Industry | Male | Female |
| Agriculture, Fishing & Hunting | 33 (86.8%) | 5 (13.2%) |
| Mining, Quarrying, & Extraction | 33 (100.0%) | 0 (0.0%) |
| Construction | 627 (74.1%) | 219 (25.9%) |
| Manufacturing | 1,012 (76.1%) | 317 (23.8%) |
| Wholesale Trade | 362 (71.4%) | 145 (28.6%) |
| Retail Trade | 632 (52.2%) | 579 (47.8%) |
| Transportation & Warehousing | 772 (72.0%) | 300 (28.0%) |
| Utilities | 17 (100.0%) | 0 (0.0%) |
| Information | 220 (91.7%) | 20 (8.3%) |
| Finance & Insurance | 120 (27.7%) | 314 (72.4%) |
| Real Estate, Rental & Leasing | 74 (27.2%) | 198 (72.8%) |
| Professional & Scientific | 337 (64.1%) | 189 (35.9%) |
| Enterprise Management | 0 (0.0%) | 0 (0.0%) |
| Administrative & Support | 142 (32.8%) | 291 (67.2%) |
| Educational Services | 259 (36.3%) | 454 (63.7%) |
| Health Care & Social Assistance | 184 (12.1%) | 1,340 (87.9%) |
| Arts, Entertainment & Recreation | 446 (68.1%) | 209 (31.9%) |
| Accommodation & Food Services | 194 (36.4%) | 339 (63.6%) |
| Public Administration | 147 (34.4%) | 281 (65.6%) |
| Total | 5,772 (51.6%) | 5,423 (48.4%) |
Education in Covington
School Enrollment in Covington
The most common levels of schooling among the 5,138 students in Covington are high school (1,373 | 26.7%), middle school (1,056 | 20.5%), and elementary school (1,028 | 20.0%).
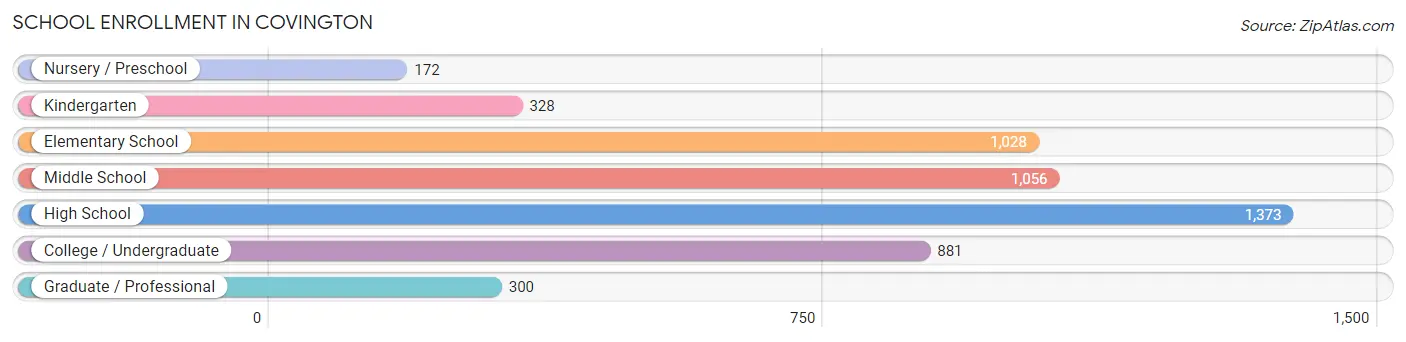
| School Level | # Students | % Students |
| Nursery / Preschool | 172 | 3.4% |
| Kindergarten | 328 | 6.4% |
| Elementary School | 1,028 | 20.0% |
| Middle School | 1,056 | 20.5% |
| High School | 1,373 | 26.7% |
| College / Undergraduate | 881 | 17.2% |
| Graduate / Professional | 300 | 5.8% |
| Total | 5,138 | 100.0% |
School Enrollment by Age by Funding Source in Covington
Out of a total of 5,138 students who are enrolled in schools in Covington, 781 (15.2%) attend a private institution, while the remaining 4,357 (84.8%) are enrolled in public schools. The age group of 35 years and over has the highest likelihood of being enrolled in private schools, with 78 (31.7% in the age bracket) enrolled. Conversely, the age group of 18 to 19 year olds has the lowest likelihood of being enrolled in a private school, with 485 (100.0% in the age bracket) attending a public institution.
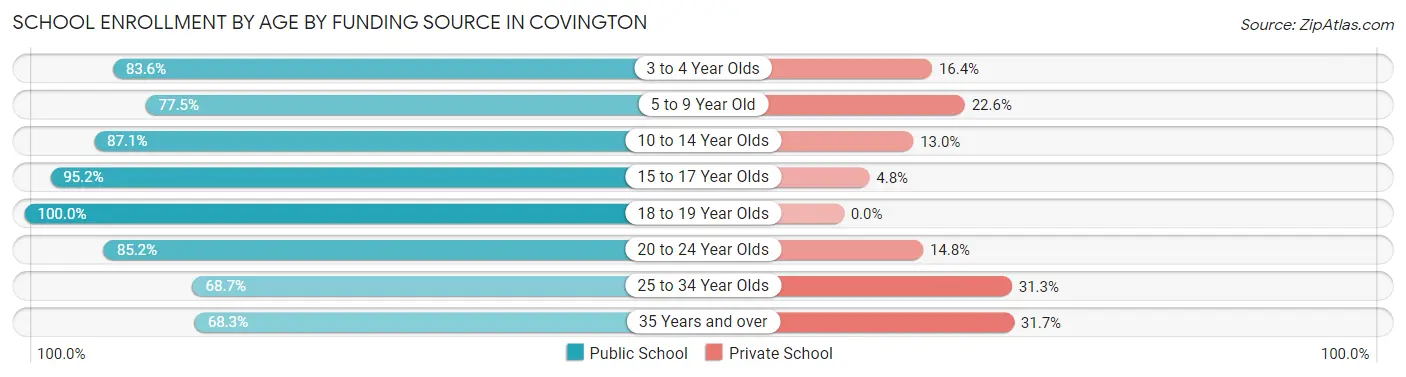
| Age Bracket | Public School | Private School |
| 3 to 4 Year Olds | 122 (83.6%) | 24 (16.4%) |
| 5 to 9 Year Old | 931 (77.4%) | 271 (22.6%) |
| 10 to 14 Year Olds | 1,264 (87.1%) | 188 (13.0%) |
| 15 to 17 Year Olds | 856 (95.2%) | 43 (4.8%) |
| 18 to 19 Year Olds | 485 (100.0%) | 0 (0.0%) |
| 20 to 24 Year Olds | 225 (85.2%) | 39 (14.8%) |
| 25 to 34 Year Olds | 305 (68.7%) | 139 (31.3%) |
| 35 Years and over | 168 (68.3%) | 78 (31.7%) |
| Total | 4,357 (84.8%) | 781 (15.2%) |
Educational Attainment by Field of Study in Covington
Business (996 | 18.7%), science & technology (699 | 13.1%), engineering (697 | 13.1%), arts & humanities (465 | 8.7%), and social sciences (410 | 7.7%) are the most common fields of study among 5,335 individuals in Covington who have obtained a bachelor's degree or higher.
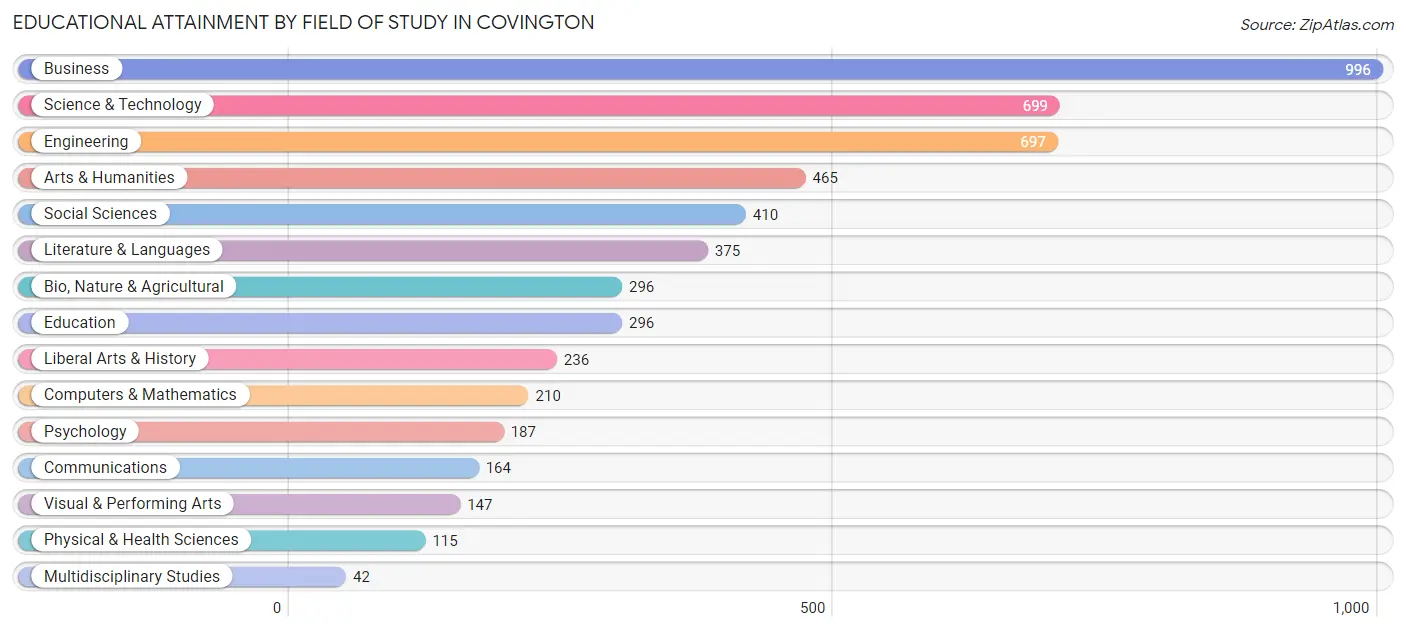
| Field of Study | # Graduates | % Graduates |
| Computers & Mathematics | 210 | 3.9% |
| Bio, Nature & Agricultural | 296 | 5.6% |
| Physical & Health Sciences | 115 | 2.2% |
| Psychology | 187 | 3.5% |
| Social Sciences | 410 | 7.7% |
| Engineering | 697 | 13.1% |
| Multidisciplinary Studies | 42 | 0.8% |
| Science & Technology | 699 | 13.1% |
| Business | 996 | 18.7% |
| Education | 296 | 5.6% |
| Literature & Languages | 375 | 7.0% |
| Liberal Arts & History | 236 | 4.4% |
| Visual & Performing Arts | 147 | 2.8% |
| Communications | 164 | 3.1% |
| Arts & Humanities | 465 | 8.7% |
| Total | 5,335 | 100.0% |
Transportation & Commute in Covington
Vehicle Availability by Sex in Covington
The most prevalent vehicle ownership categories in Covington are males with 2 vehicles (2,335, accounting for 41.1%) and females with 2 vehicles (1,810, making up 44.4%).
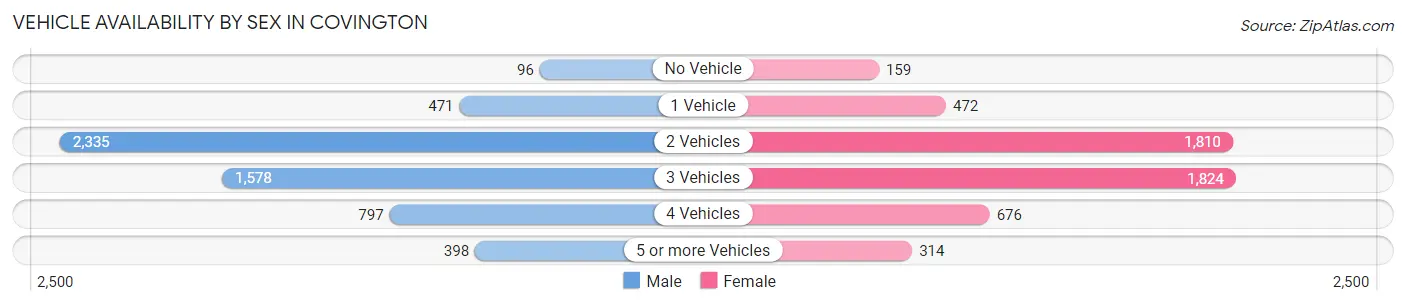
| Vehicles Available | Male | Female |
| No Vehicle | 96 (1.7%) | 159 (3.0%) |
| 1 Vehicle | 471 (8.3%) | 472 (9.0%) |
| 2 Vehicles | 2,335 (41.1%) | 1,810 (34.4%) |
| 3 Vehicles | 1,578 (27.8%) | 1,824 (34.7%) |
| 4 Vehicles | 797 (14.0%) | 676 (12.9%) |
| 5 or more Vehicles | 398 (7.0%) | 314 (6.0%) |
| Total | 5,675 (100.0%) | 5,255 (100.0%) |
Commute Time in Covington
The most frequently occuring commute durations in Covington are 30 to 34 minutes (1,920 commuters, 20.2%), 45 to 59 minutes (1,587 commuters, 16.7%), and 60 to 89 minutes (1,000 commuters, 10.5%).
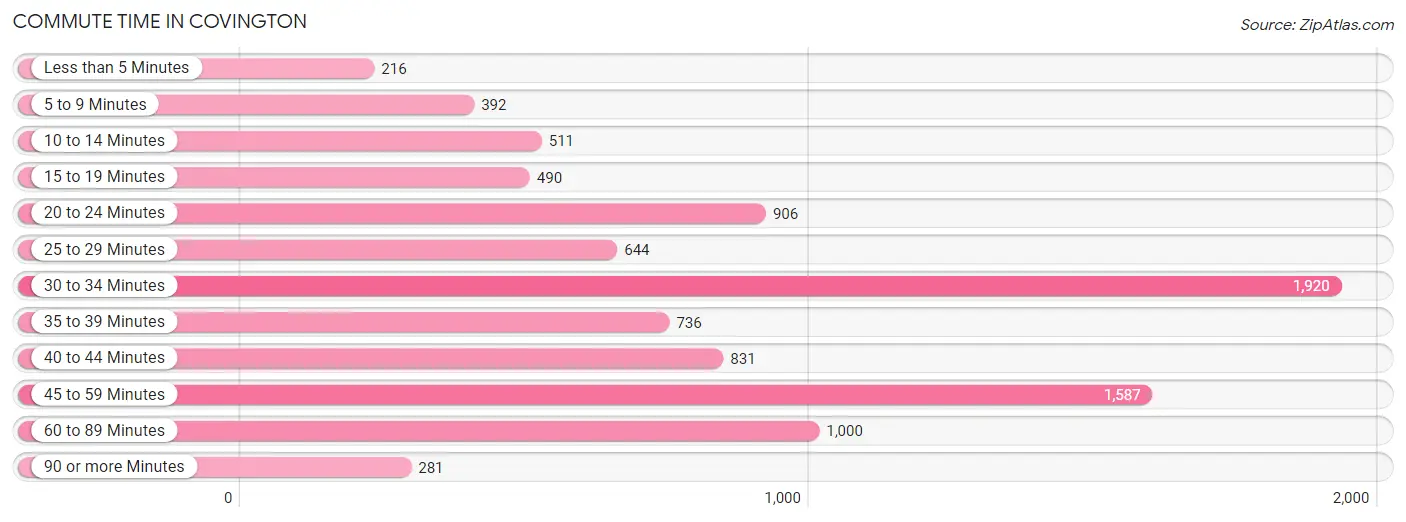
| Commute Time | # Commuters | % Commuters |
| Less than 5 Minutes | 216 | 2.3% |
| 5 to 9 Minutes | 392 | 4.1% |
| 10 to 14 Minutes | 511 | 5.4% |
| 15 to 19 Minutes | 490 | 5.1% |
| 20 to 24 Minutes | 906 | 9.5% |
| 25 to 29 Minutes | 644 | 6.8% |
| 30 to 34 Minutes | 1,920 | 20.2% |
| 35 to 39 Minutes | 736 | 7.7% |
| 40 to 44 Minutes | 831 | 8.7% |
| 45 to 59 Minutes | 1,587 | 16.7% |
| 60 to 89 Minutes | 1,000 | 10.5% |
| 90 or more Minutes | 281 | 2.9% |
Commute Time by Sex in Covington
The most common commute times in Covington are 30 to 34 minutes (1,248 commuters, 24.9%) for males and 45 to 59 minutes (786 commuters, 17.5%) for females.
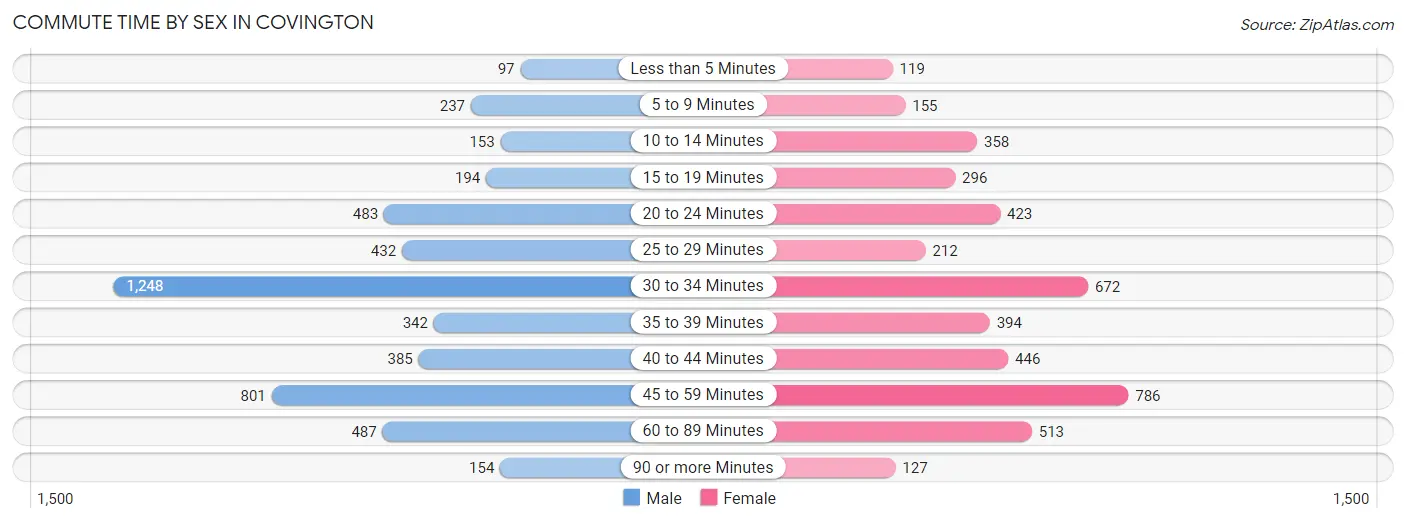
| Commute Time | Male | Female |
| Less than 5 Minutes | 97 (1.9%) | 119 (2.6%) |
| 5 to 9 Minutes | 237 (4.7%) | 155 (3.4%) |
| 10 to 14 Minutes | 153 (3.0%) | 358 (8.0%) |
| 15 to 19 Minutes | 194 (3.9%) | 296 (6.6%) |
| 20 to 24 Minutes | 483 (9.6%) | 423 (9.4%) |
| 25 to 29 Minutes | 432 (8.6%) | 212 (4.7%) |
| 30 to 34 Minutes | 1,248 (24.9%) | 672 (14.9%) |
| 35 to 39 Minutes | 342 (6.8%) | 394 (8.7%) |
| 40 to 44 Minutes | 385 (7.7%) | 446 (9.9%) |
| 45 to 59 Minutes | 801 (16.0%) | 786 (17.5%) |
| 60 to 89 Minutes | 487 (9.7%) | 513 (11.4%) |
| 90 or more Minutes | 154 (3.1%) | 127 (2.8%) |
Time of Departure to Work by Sex in Covington
The most frequent times of departure to work in Covington are 6:00 AM to 6:29 AM (787, 15.7%) for males and 7:00 AM to 7:29 AM (803, 17.8%) for females.
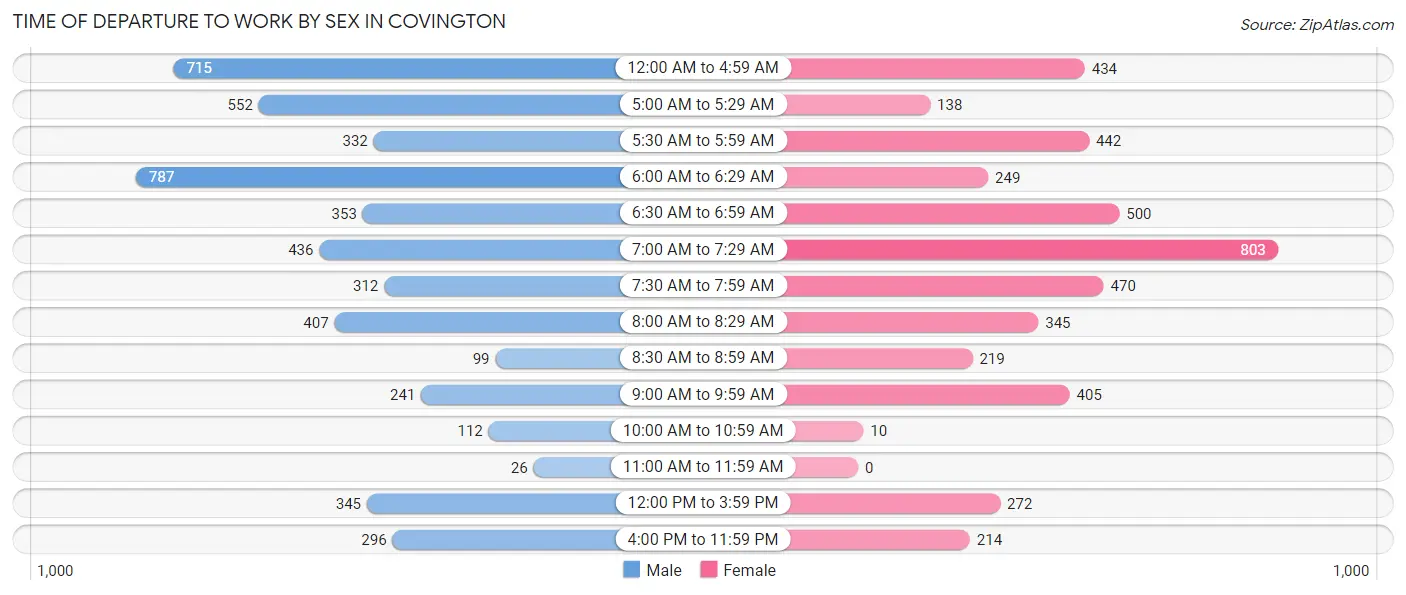
| Time of Departure | Male | Female |
| 12:00 AM to 4:59 AM | 715 (14.3%) | 434 (9.6%) |
| 5:00 AM to 5:29 AM | 552 (11.0%) | 138 (3.1%) |
| 5:30 AM to 5:59 AM | 332 (6.6%) | 442 (9.8%) |
| 6:00 AM to 6:29 AM | 787 (15.7%) | 249 (5.5%) |
| 6:30 AM to 6:59 AM | 353 (7.0%) | 500 (11.1%) |
| 7:00 AM to 7:29 AM | 436 (8.7%) | 803 (17.8%) |
| 7:30 AM to 7:59 AM | 312 (6.2%) | 470 (10.4%) |
| 8:00 AM to 8:29 AM | 407 (8.1%) | 345 (7.7%) |
| 8:30 AM to 8:59 AM | 99 (2.0%) | 219 (4.9%) |
| 9:00 AM to 9:59 AM | 241 (4.8%) | 405 (9.0%) |
| 10:00 AM to 10:59 AM | 112 (2.2%) | 10 (0.2%) |
| 11:00 AM to 11:59 AM | 26 (0.5%) | 0 (0.0%) |
| 12:00 PM to 3:59 PM | 345 (6.9%) | 272 (6.0%) |
| 4:00 PM to 11:59 PM | 296 (5.9%) | 214 (4.8%) |
| Total | 5,013 (100.0%) | 4,501 (100.0%) |
Housing Occupancy in Covington
Occupancy by Ownership in Covington
Of the total 7,306 dwellings in Covington, owner-occupied units account for 5,932 (81.2%), while renter-occupied units make up 1,374 (18.8%).
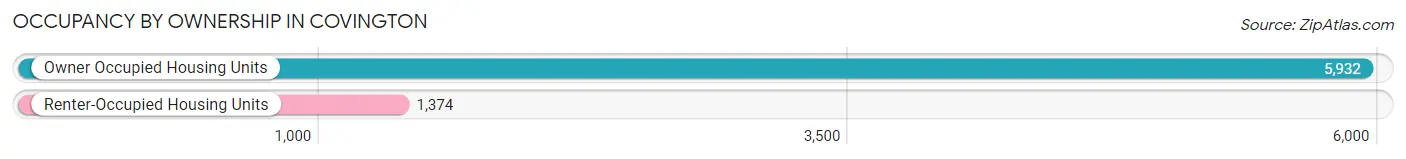
| Occupancy | # Housing Units | % Housing Units |
| Owner Occupied Housing Units | 5,932 | 81.2% |
| Renter-Occupied Housing Units | 1,374 | 18.8% |
| Total Occupied Housing Units | 7,306 | 100.0% |
Occupancy by Household Size in Covington
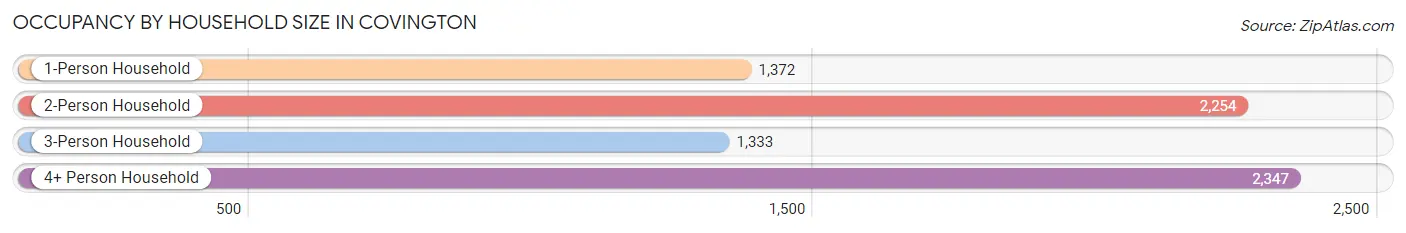
| Household Size | # Housing Units | % Housing Units |
| 1-Person Household | 1,372 | 18.8% |
| 2-Person Household | 2,254 | 30.8% |
| 3-Person Household | 1,333 | 18.2% |
| 4+ Person Household | 2,347 | 32.1% |
| Total Housing Units | 7,306 | 100.0% |
Occupancy by Ownership by Household Size in Covington
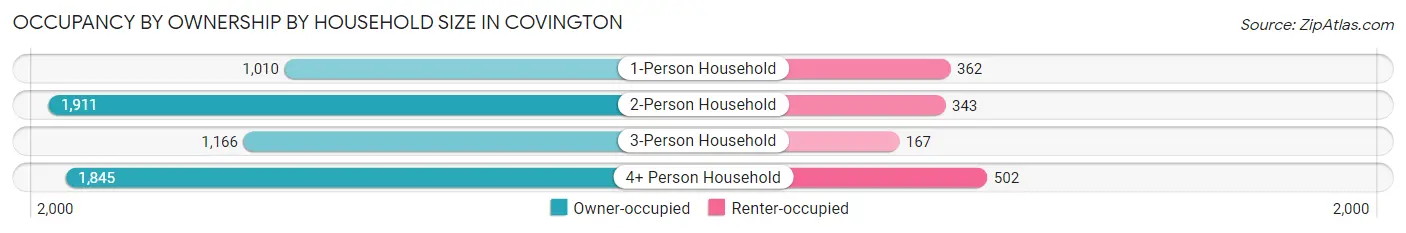
| Household Size | Owner-occupied | Renter-occupied |
| 1-Person Household | 1,010 (73.6%) | 362 (26.4%) |
| 2-Person Household | 1,911 (84.8%) | 343 (15.2%) |
| 3-Person Household | 1,166 (87.5%) | 167 (12.5%) |
| 4+ Person Household | 1,845 (78.6%) | 502 (21.4%) |
| Total Housing Units | 5,932 (81.2%) | 1,374 (18.8%) |
Occupancy by Educational Attainment in Covington
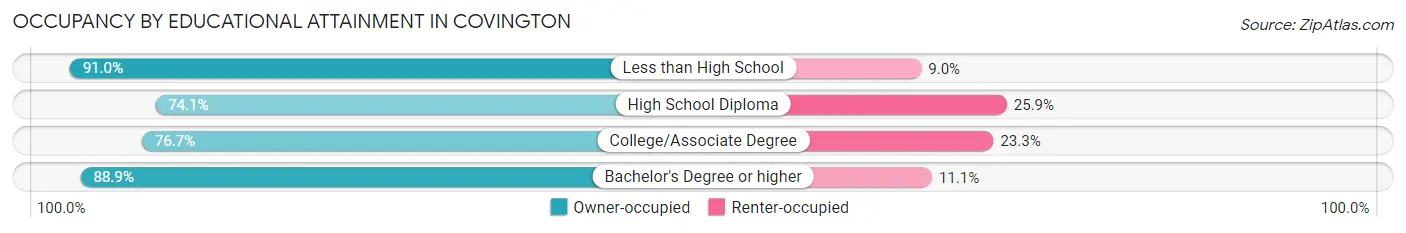
| Household Size | Owner-occupied | Renter-occupied |
| Less than High School | 315 (91.0%) | 31 (9.0%) |
| High School Diploma | 1,235 (74.1%) | 432 (25.9%) |
| College/Associate Degree | 2,042 (76.7%) | 619 (23.3%) |
| Bachelor's Degree or higher | 2,340 (88.9%) | 292 (11.1%) |
Occupancy by Age of Householder in Covington
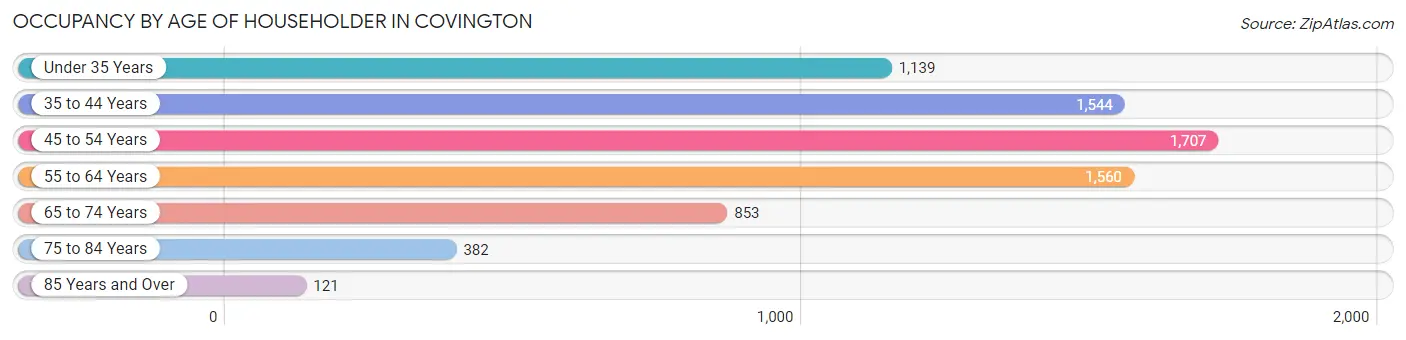
| Age Bracket | # Households | % Households |
| Under 35 Years | 1,139 | 15.6% |
| 35 to 44 Years | 1,544 | 21.1% |
| 45 to 54 Years | 1,707 | 23.4% |
| 55 to 64 Years | 1,560 | 21.3% |
| 65 to 74 Years | 853 | 11.7% |
| 75 to 84 Years | 382 | 5.2% |
| 85 Years and Over | 121 | 1.7% |
| Total | 7,306 | 100.0% |
Housing Finances in Covington
Median Income by Occupancy in Covington
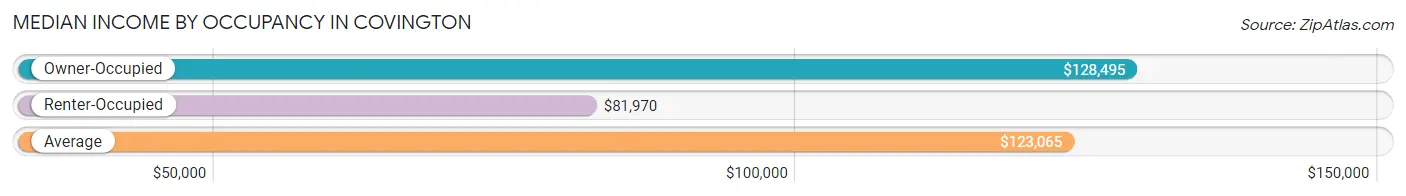
| Occupancy Type | # Households | Median Income |
| Owner-Occupied | 5,932 (81.2%) | $128,495 |
| Renter-Occupied | 1,374 (18.8%) | $81,970 |
| Average | 7,306 (100.0%) | $123,065 |
Occupancy by Householder Income Bracket in Covington
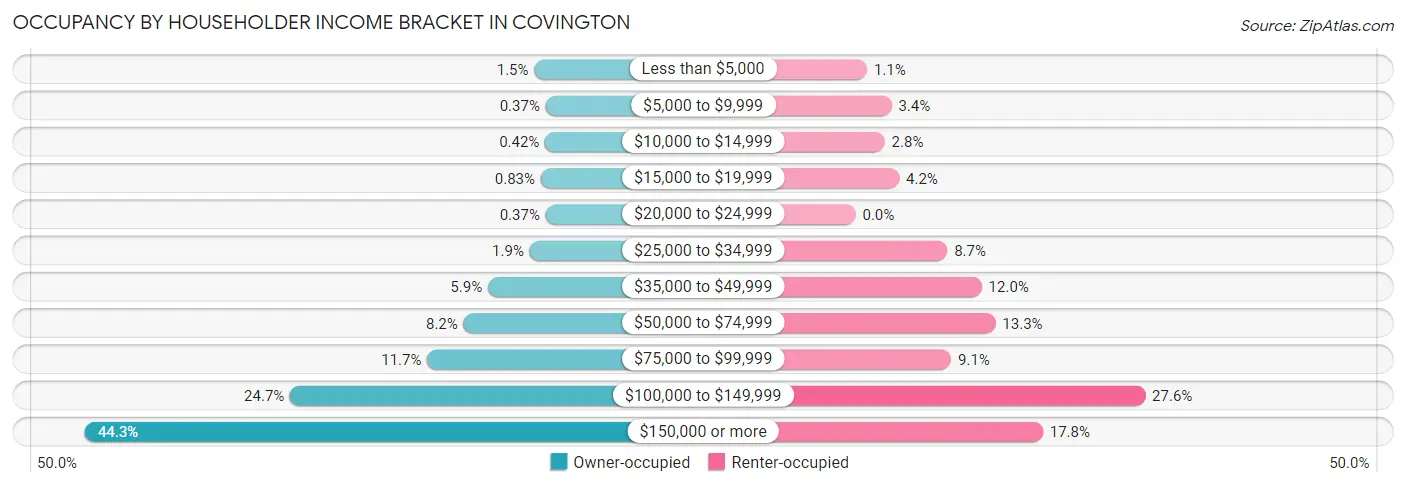
| Income Bracket | Owner-occupied | Renter-occupied |
| Less than $5,000 | 86 (1.5%) | 15 (1.1%) |
| $5,000 to $9,999 | 22 (0.4%) | 47 (3.4%) |
| $10,000 to $14,999 | 25 (0.4%) | 38 (2.8%) |
| $15,000 to $19,999 | 49 (0.8%) | 57 (4.2%) |
| $20,000 to $24,999 | 22 (0.4%) | 0 (0.0%) |
| $25,000 to $34,999 | 112 (1.9%) | 120 (8.7%) |
| $35,000 to $49,999 | 348 (5.9%) | 165 (12.0%) |
| $50,000 to $74,999 | 486 (8.2%) | 183 (13.3%) |
| $75,000 to $99,999 | 691 (11.7%) | 125 (9.1%) |
| $100,000 to $149,999 | 1,466 (24.7%) | 379 (27.6%) |
| $150,000 or more | 2,625 (44.3%) | 245 (17.8%) |
| Total | 5,932 (100.0%) | 1,374 (100.0%) |
Monthly Housing Cost Tiers in Covington
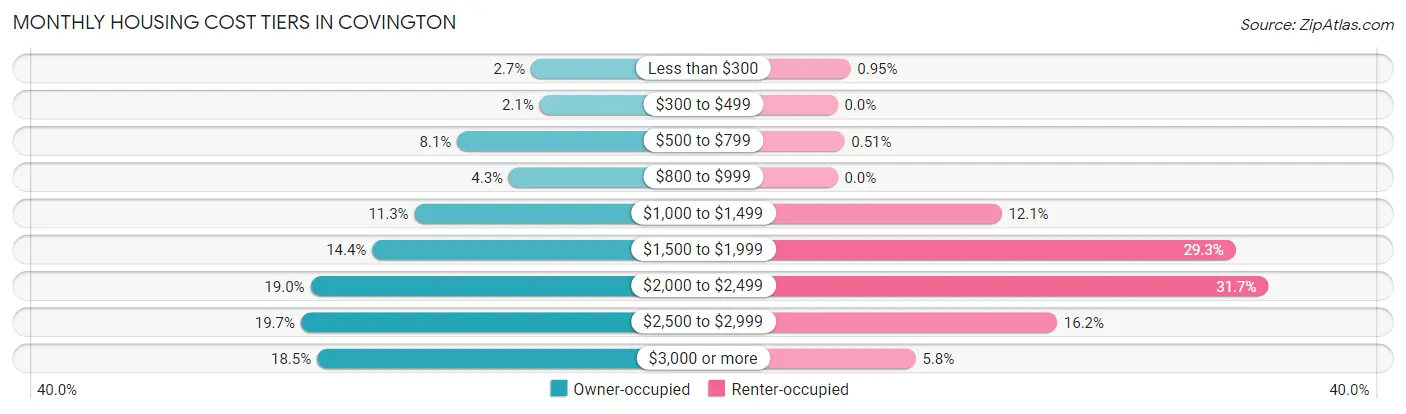
| Monthly Cost | Owner-occupied | Renter-occupied |
| Less than $300 | 160 (2.7%) | 13 (0.9%) |
| $300 to $499 | 123 (2.1%) | 0 (0.0%) |
| $500 to $799 | 483 (8.1%) | 7 (0.5%) |
| $800 to $999 | 257 (4.3%) | 0 (0.0%) |
| $1,000 to $1,499 | 670 (11.3%) | 166 (12.1%) |
| $1,500 to $1,999 | 854 (14.4%) | 403 (29.3%) |
| $2,000 to $2,499 | 1,124 (19.0%) | 436 (31.7%) |
| $2,500 to $2,999 | 1,166 (19.7%) | 222 (16.2%) |
| $3,000 or more | 1,095 (18.5%) | 79 (5.8%) |
| Total | 5,932 (100.0%) | 1,374 (100.0%) |
Physical Housing Characteristics in Covington
Housing Structures in Covington
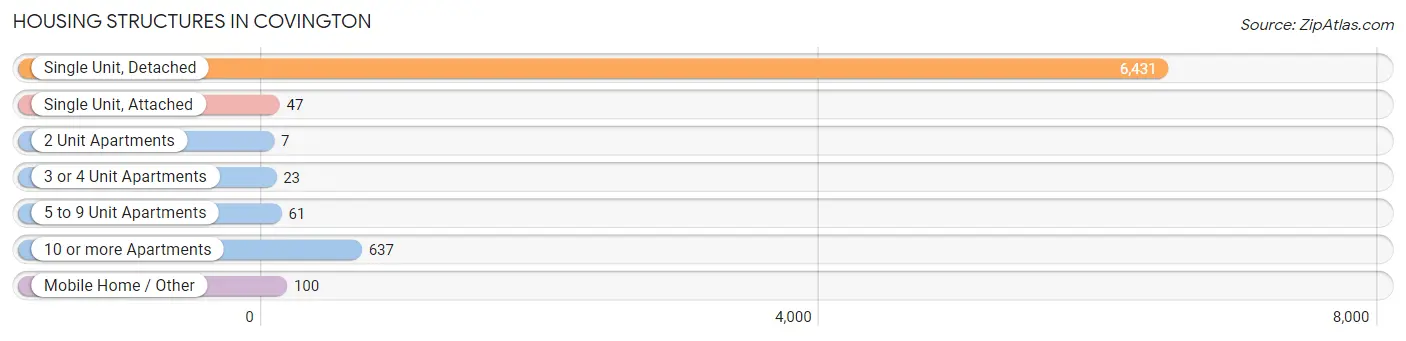
| Structure Type | # Housing Units | % Housing Units |
| Single Unit, Detached | 6,431 | 88.0% |
| Single Unit, Attached | 47 | 0.6% |
| 2 Unit Apartments | 7 | 0.1% |
| 3 or 4 Unit Apartments | 23 | 0.3% |
| 5 to 9 Unit Apartments | 61 | 0.8% |
| 10 or more Apartments | 637 | 8.7% |
| Mobile Home / Other | 100 | 1.4% |
| Total | 7,306 | 100.0% |
Housing Structures by Occupancy in Covington
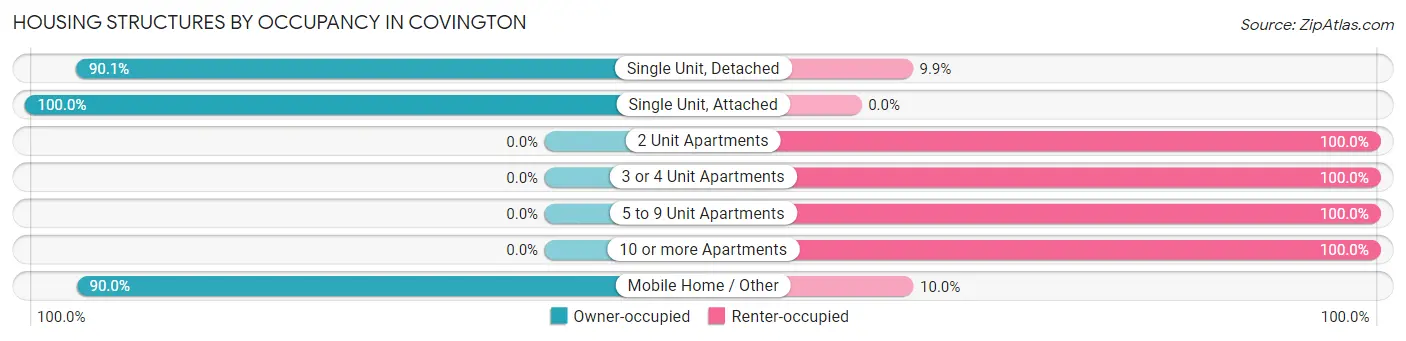
| Structure Type | Owner-occupied | Renter-occupied |
| Single Unit, Detached | 5,795 (90.1%) | 636 (9.9%) |
| Single Unit, Attached | 47 (100.0%) | 0 (0.0%) |
| 2 Unit Apartments | 0 (0.0%) | 7 (100.0%) |
| 3 or 4 Unit Apartments | 0 (0.0%) | 23 (100.0%) |
| 5 to 9 Unit Apartments | 0 (0.0%) | 61 (100.0%) |
| 10 or more Apartments | 0 (0.0%) | 637 (100.0%) |
| Mobile Home / Other | 90 (90.0%) | 10 (10.0%) |
| Total | 5,932 (81.2%) | 1,374 (18.8%) |
Housing Structures by Number of Rooms in Covington
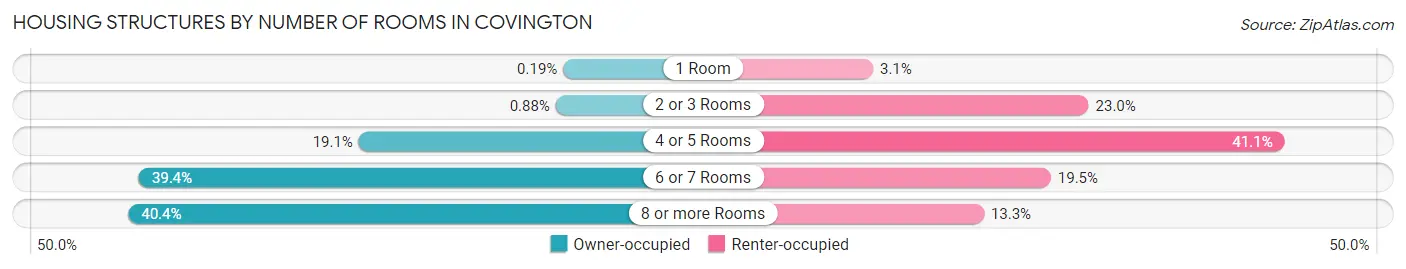
| Number of Rooms | Owner-occupied | Renter-occupied |
| 1 Room | 11 (0.2%) | 42 (3.1%) |
| 2 or 3 Rooms | 52 (0.9%) | 316 (23.0%) |
| 4 or 5 Rooms | 1,133 (19.1%) | 565 (41.1%) |
| 6 or 7 Rooms | 2,339 (39.4%) | 268 (19.5%) |
| 8 or more Rooms | 2,397 (40.4%) | 183 (13.3%) |
| Total | 5,932 (100.0%) | 1,374 (100.0%) |
Housing Structure by Heating Type in Covington
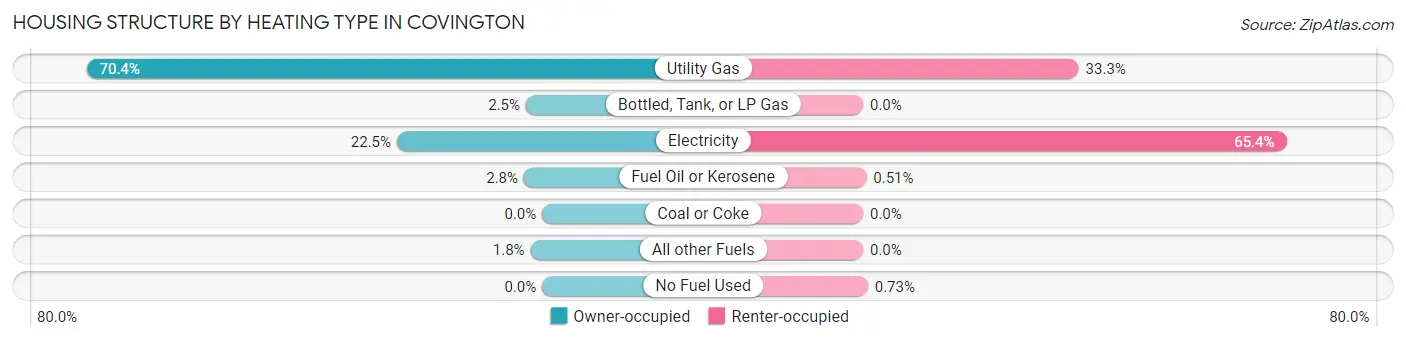
| Heating Type | Owner-occupied | Renter-occupied |
| Utility Gas | 4,177 (70.4%) | 458 (33.3%) |
| Bottled, Tank, or LP Gas | 149 (2.5%) | 0 (0.0%) |
| Electricity | 1,332 (22.5%) | 899 (65.4%) |
| Fuel Oil or Kerosene | 167 (2.8%) | 7 (0.5%) |
| Coal or Coke | 0 (0.0%) | 0 (0.0%) |
| All other Fuels | 107 (1.8%) | 0 (0.0%) |
| No Fuel Used | 0 (0.0%) | 10 (0.7%) |
| Total | 5,932 (100.0%) | 1,374 (100.0%) |
Household Vehicle Usage in Covington
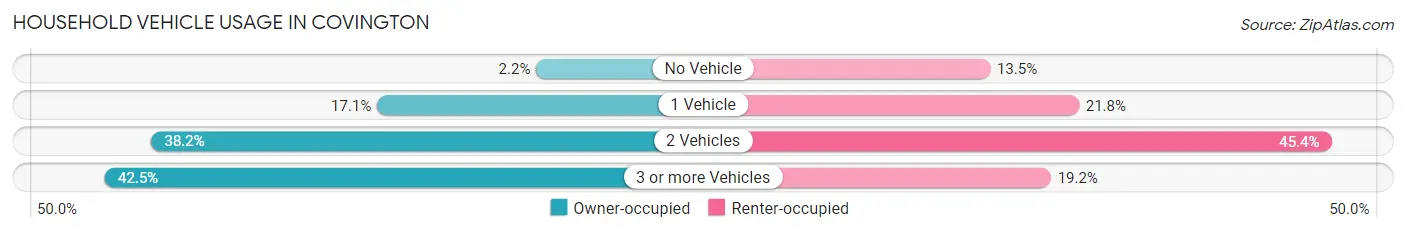
| Vehicles per Household | Owner-occupied | Renter-occupied |
| No Vehicle | 133 (2.2%) | 186 (13.5%) |
| 1 Vehicle | 1,014 (17.1%) | 300 (21.8%) |
| 2 Vehicles | 2,264 (38.2%) | 624 (45.4%) |
| 3 or more Vehicles | 2,521 (42.5%) | 264 (19.2%) |
| Total | 5,932 (100.0%) | 1,374 (100.0%) |
Real Estate & Mortgages in Covington
Real Estate and Mortgage Overview in Covington
| Characteristic | Without Mortgage | With Mortgage |
| Housing Units | 1,151 | 4,781 |
| Median Property Value | $533,700 | $548,700 |
| Median Household Income | $113,882 | $2,270 |
| Monthly Housing Costs | $755 | $1,085 |
| Real Estate Taxes | $5,687 | $97 |
Property Value by Mortgage Status in Covington
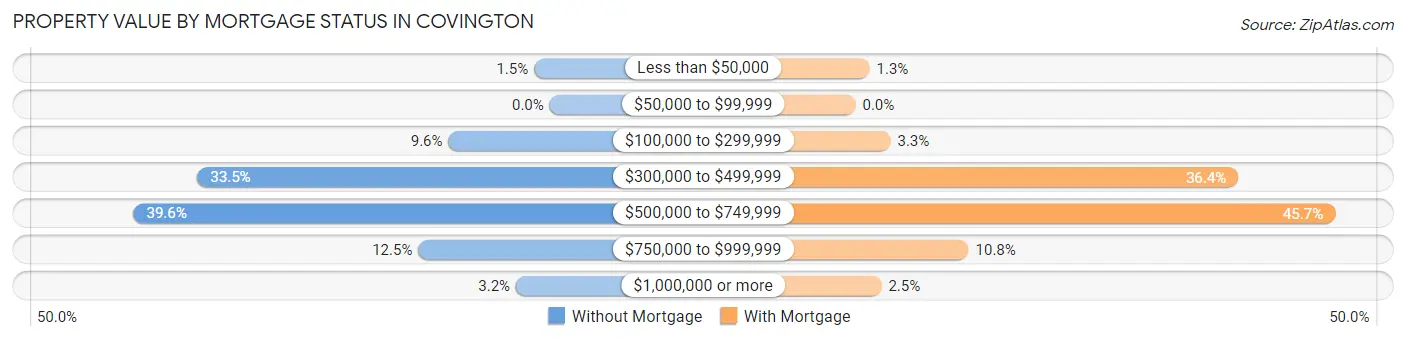
| Property Value | Without Mortgage | With Mortgage |
| Less than $50,000 | 17 (1.5%) | 64 (1.3%) |
| $50,000 to $99,999 | 0 (0.0%) | 0 (0.0%) |
| $100,000 to $299,999 | 111 (9.6%) | 159 (3.3%) |
| $300,000 to $499,999 | 386 (33.5%) | 1,742 (36.4%) |
| $500,000 to $749,999 | 456 (39.6%) | 2,183 (45.7%) |
| $750,000 to $999,999 | 144 (12.5%) | 515 (10.8%) |
| $1,000,000 or more | 37 (3.2%) | 118 (2.5%) |
| Total | 1,151 (100.0%) | 4,781 (100.0%) |
Household Income by Mortgage Status in Covington
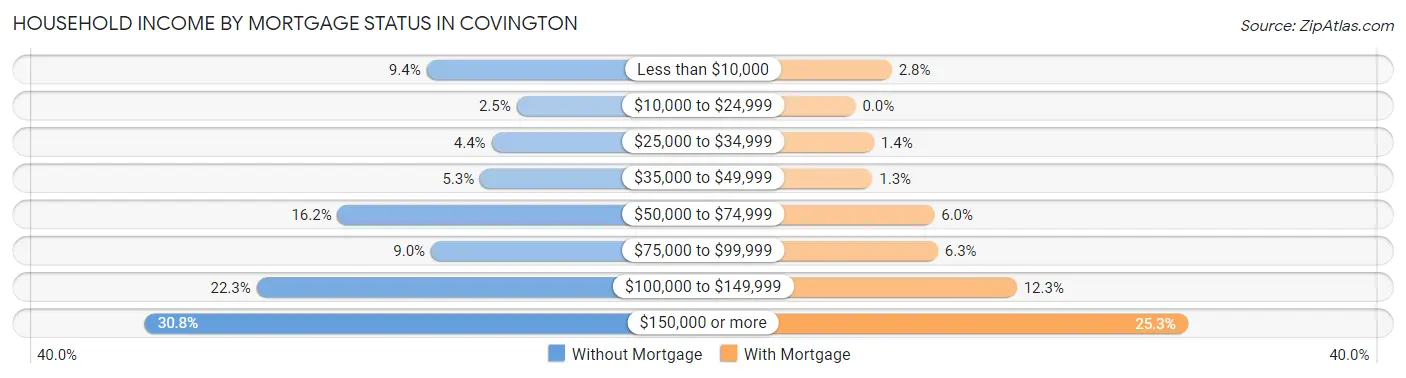
| Household Income | Without Mortgage | With Mortgage |
| Less than $10,000 | 108 (9.4%) | 132 (2.8%) |
| $10,000 to $24,999 | 29 (2.5%) | 0 (0.0%) |
| $25,000 to $34,999 | 51 (4.4%) | 67 (1.4%) |
| $35,000 to $49,999 | 61 (5.3%) | 61 (1.3%) |
| $50,000 to $74,999 | 186 (16.2%) | 287 (6.0%) |
| $75,000 to $99,999 | 104 (9.0%) | 300 (6.3%) |
| $100,000 to $149,999 | 257 (22.3%) | 587 (12.3%) |
| $150,000 or more | 355 (30.8%) | 1,209 (25.3%) |
| Total | 1,151 (100.0%) | 4,781 (100.0%) |
Property Value to Household Income Ratio in Covington
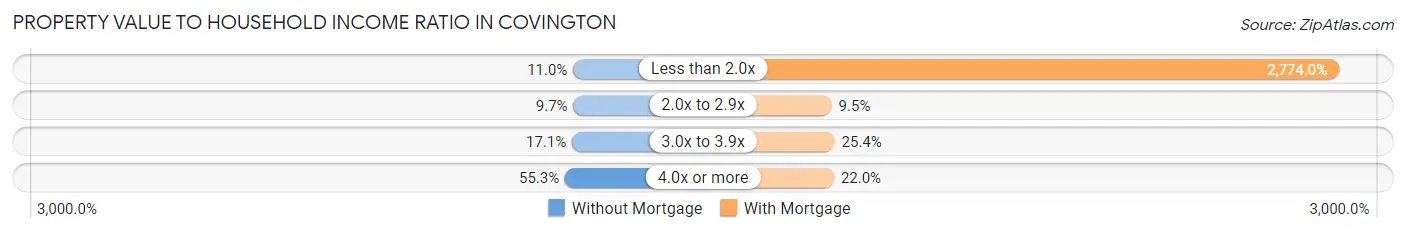
| Value-to-Income Ratio | Without Mortgage | With Mortgage |
| Less than 2.0x | 127 (11.0%) | 132,625 (2,774.0%) |
| 2.0x to 2.9x | 112 (9.7%) | 456 (9.5%) |
| 3.0x to 3.9x | 197 (17.1%) | 1,215 (25.4%) |
| 4.0x or more | 637 (55.3%) | 1,052 (22.0%) |
| Total | 1,151 (100.0%) | 4,781 (100.0%) |
Real Estate Taxes by Mortgage Status in Covington
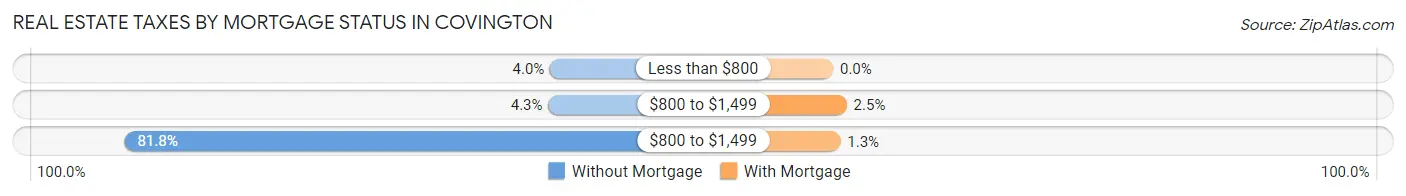
| Property Taxes | Without Mortgage | With Mortgage |
| Less than $800 | 46 (4.0%) | 0 (0.0%) |
| $800 to $1,499 | 50 (4.3%) | 119 (2.5%) |
| $800 to $1,499 | 941 (81.8%) | 64 (1.3%) |
| Total | 1,151 (100.0%) | 4,781 (100.0%) |
Health & Disability in Covington
Health Insurance Coverage by Age in Covington
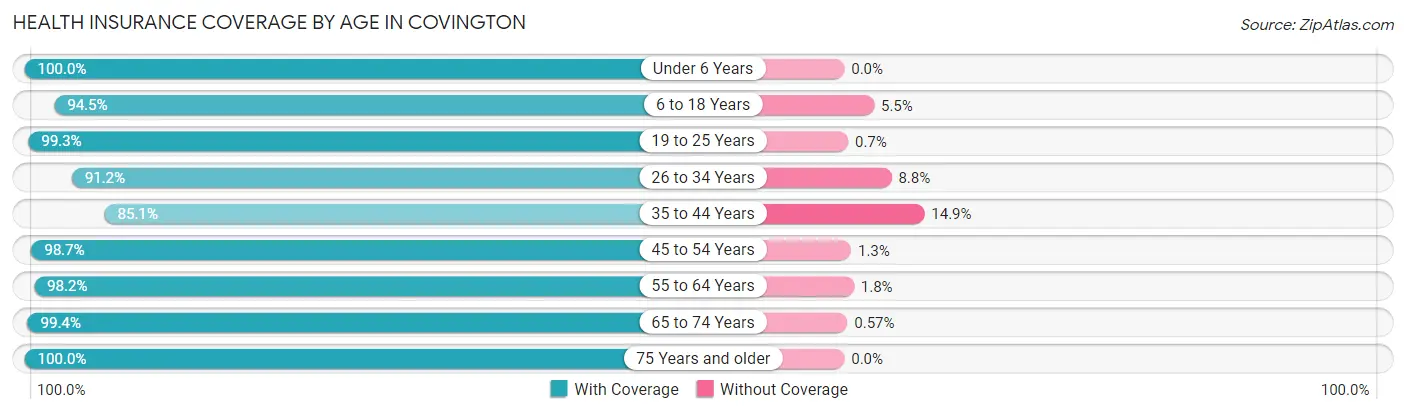
| Age Bracket | With Coverage | Without Coverage |
| Under 6 Years | 1,647 (100.0%) | 0 (0.0%) |
| 6 to 18 Years | 3,544 (94.5%) | 208 (5.5%) |
| 19 to 25 Years | 1,564 (99.3%) | 11 (0.7%) |
| 26 to 34 Years | 2,020 (91.2%) | 195 (8.8%) |
| 35 to 44 Years | 2,923 (85.1%) | 513 (14.9%) |
| 45 to 54 Years | 2,898 (98.7%) | 37 (1.3%) |
| 55 to 64 Years | 2,822 (98.2%) | 51 (1.8%) |
| 65 to 74 Years | 1,569 (99.4%) | 9 (0.6%) |
| 75 Years and older | 803 (100.0%) | 0 (0.0%) |
| Total | 19,790 (95.1%) | 1,024 (4.9%) |
Health Insurance Coverage by Citizenship Status in Covington
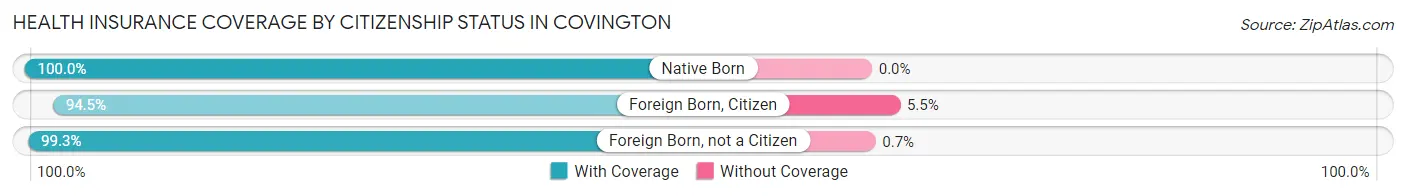
| Citizenship Status | With Coverage | Without Coverage |
| Native Born | 1,647 (100.0%) | 0 (0.0%) |
| Foreign Born, Citizen | 3,544 (94.5%) | 208 (5.5%) |
| Foreign Born, not a Citizen | 1,564 (99.3%) | 11 (0.7%) |
Health Insurance Coverage by Household Income in Covington
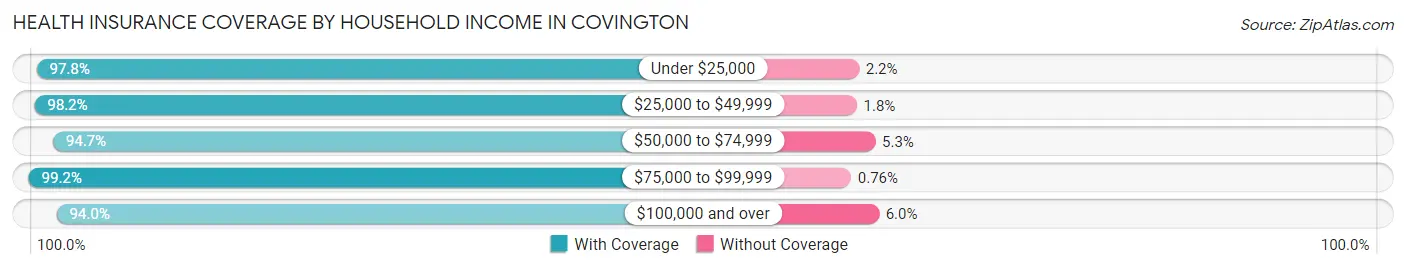
| Household Income | With Coverage | Without Coverage |
| Under $25,000 | 656 (97.8%) | 15 (2.2%) |
| $25,000 to $49,999 | 1,558 (98.2%) | 29 (1.8%) |
| $50,000 to $74,999 | 1,448 (94.7%) | 81 (5.3%) |
| $75,000 to $99,999 | 2,230 (99.2%) | 17 (0.8%) |
| $100,000 and over | 13,866 (94.0%) | 882 (6.0%) |
Public vs Private Health Insurance Coverage by Age in Covington
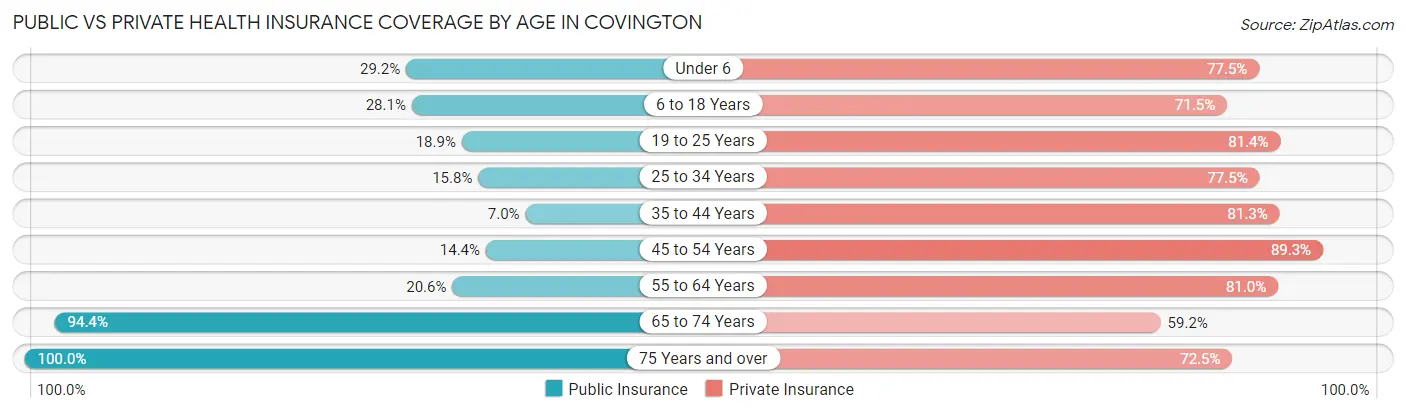
| Age Bracket | Public Insurance | Private Insurance |
| Under 6 | 481 (29.2%) | 1,276 (77.5%) |
| 6 to 18 Years | 1,056 (28.1%) | 2,683 (71.5%) |
| 19 to 25 Years | 297 (18.9%) | 1,282 (81.4%) |
| 25 to 34 Years | 350 (15.8%) | 1,717 (77.5%) |
| 35 to 44 Years | 242 (7.0%) | 2,792 (81.3%) |
| 45 to 54 Years | 422 (14.4%) | 2,621 (89.3%) |
| 55 to 64 Years | 592 (20.6%) | 2,326 (81.0%) |
| 65 to 74 Years | 1,490 (94.4%) | 934 (59.2%) |
| 75 Years and over | 803 (100.0%) | 582 (72.5%) |
| Total | 5,733 (27.5%) | 16,213 (77.9%) |
Disability Status by Sex by Age in Covington
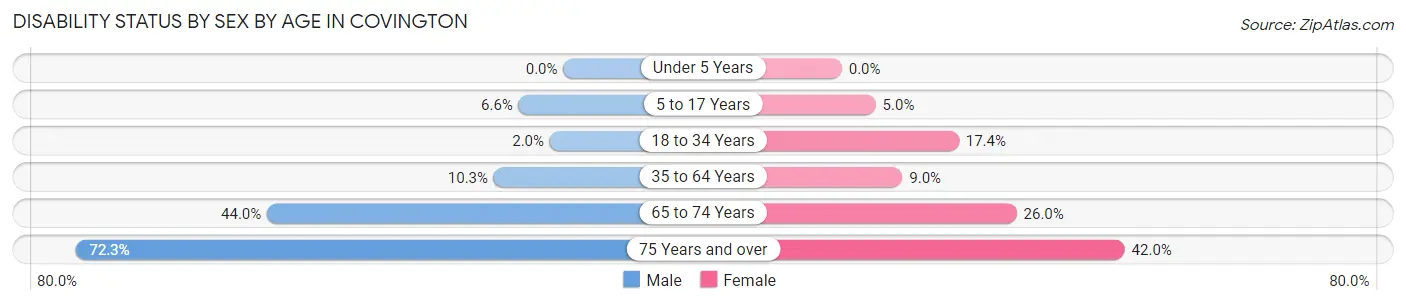
| Age Bracket | Male | Female |
| Under 5 Years | 0 (0.0%) | 0 (0.0%) |
| 5 to 17 Years | 137 (6.6%) | 85 (5.0%) |
| 18 to 34 Years | 42 (2.0%) | 360 (17.4%) |
| 35 to 64 Years | 465 (10.3%) | 426 (9.0%) |
| 65 to 74 Years | 384 (44.0%) | 183 (26.0%) |
| 75 Years and over | 269 (72.3%) | 181 (42.0%) |
Disability Class by Sex by Age in Covington
Disability Class: Hearing Difficulty
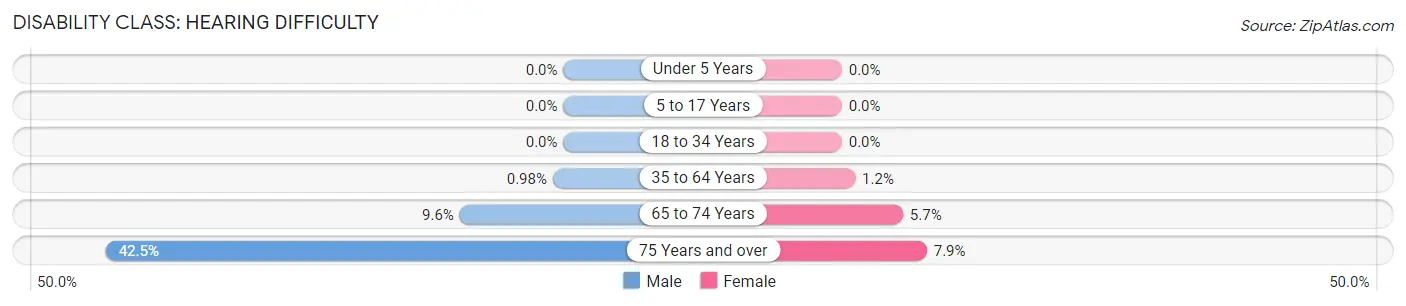
| Age Bracket | Male | Female |
| Under 5 Years | 0 (0.0%) | 0 (0.0%) |
| 5 to 17 Years | 0 (0.0%) | 0 (0.0%) |
| 18 to 34 Years | 0 (0.0%) | 0 (0.0%) |
| 35 to 64 Years | 44 (1.0%) | 59 (1.2%) |
| 65 to 74 Years | 84 (9.6%) | 40 (5.7%) |
| 75 Years and over | 158 (42.5%) | 34 (7.9%) |
Disability Class: Vision Difficulty
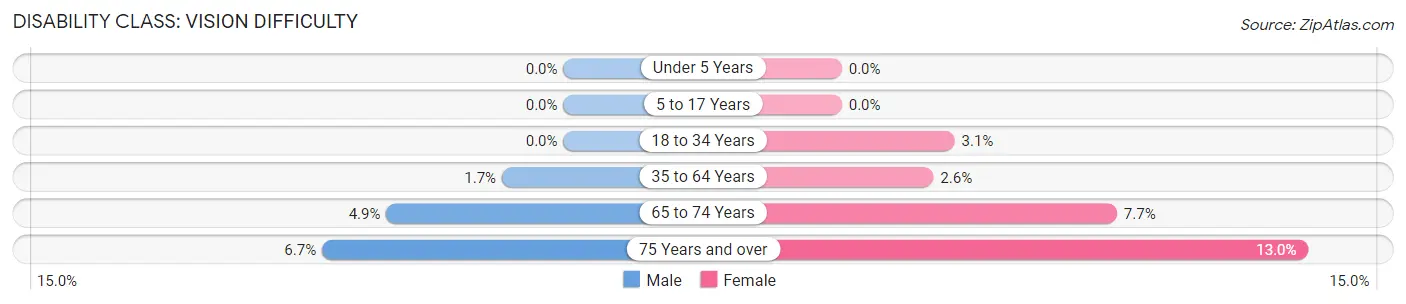
| Age Bracket | Male | Female |
| Under 5 Years | 0 (0.0%) | 0 (0.0%) |
| 5 to 17 Years | 0 (0.0%) | 0 (0.0%) |
| 18 to 34 Years | 0 (0.0%) | 65 (3.1%) |
| 35 to 64 Years | 77 (1.7%) | 121 (2.5%) |
| 65 to 74 Years | 43 (4.9%) | 54 (7.7%) |
| 75 Years and over | 25 (6.7%) | 56 (13.0%) |
Disability Class: Cognitive Difficulty
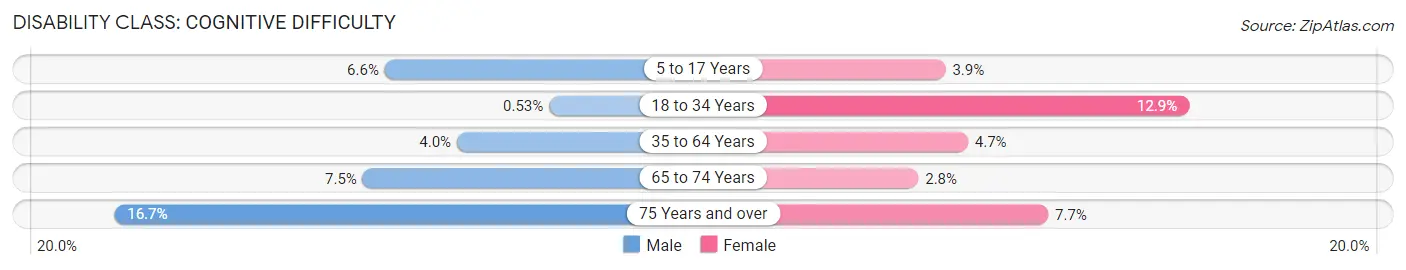
| Age Bracket | Male | Female |
| 5 to 17 Years | 137 (6.6%) | 65 (3.8%) |
| 18 to 34 Years | 11 (0.5%) | 267 (12.9%) |
| 35 to 64 Years | 178 (4.0%) | 222 (4.7%) |
| 65 to 74 Years | 65 (7.4%) | 20 (2.8%) |
| 75 Years and over | 62 (16.7%) | 33 (7.7%) |
Disability Class: Ambulatory Difficulty
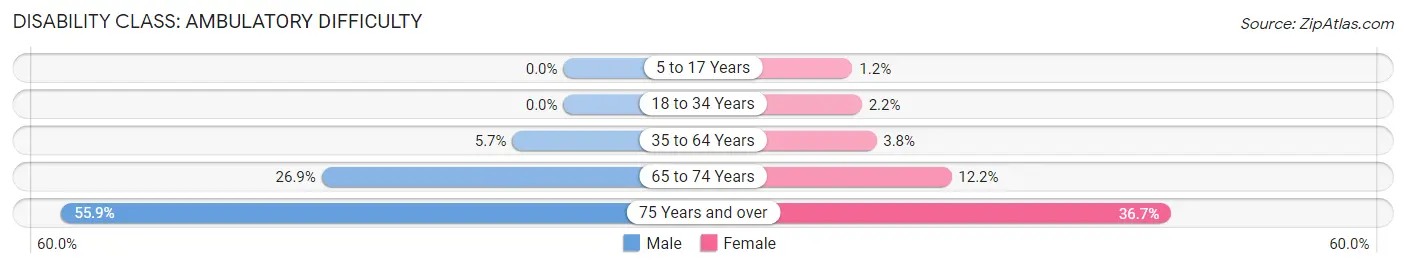
| Age Bracket | Male | Female |
| 5 to 17 Years | 0 (0.0%) | 20 (1.2%) |
| 18 to 34 Years | 0 (0.0%) | 46 (2.2%) |
| 35 to 64 Years | 256 (5.7%) | 182 (3.8%) |
| 65 to 74 Years | 235 (26.9%) | 86 (12.2%) |
| 75 Years and over | 208 (55.9%) | 158 (36.7%) |
Disability Class: Self-Care Difficulty
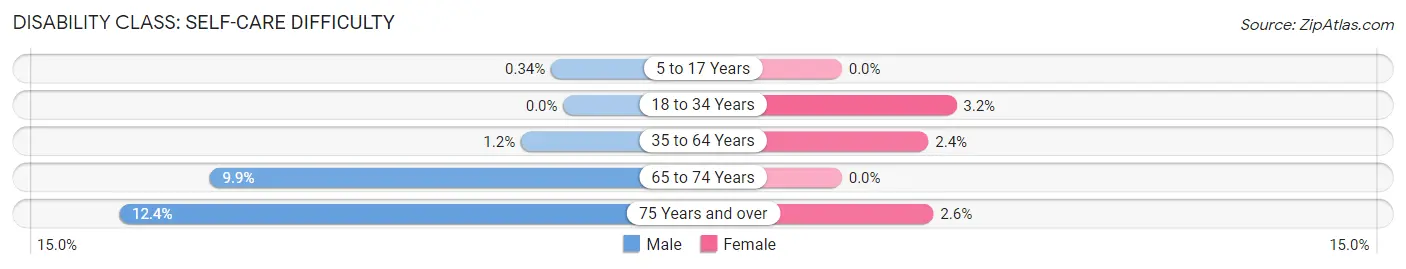
| Age Bracket | Male | Female |
| 5 to 17 Years | 7 (0.3%) | 0 (0.0%) |
| 18 to 34 Years | 0 (0.0%) | 66 (3.2%) |
| 35 to 64 Years | 53 (1.2%) | 114 (2.4%) |
| 65 to 74 Years | 86 (9.9%) | 0 (0.0%) |
| 75 Years and over | 46 (12.4%) | 11 (2.5%) |
Technology Access in Covington
Computing Device Access in Covington
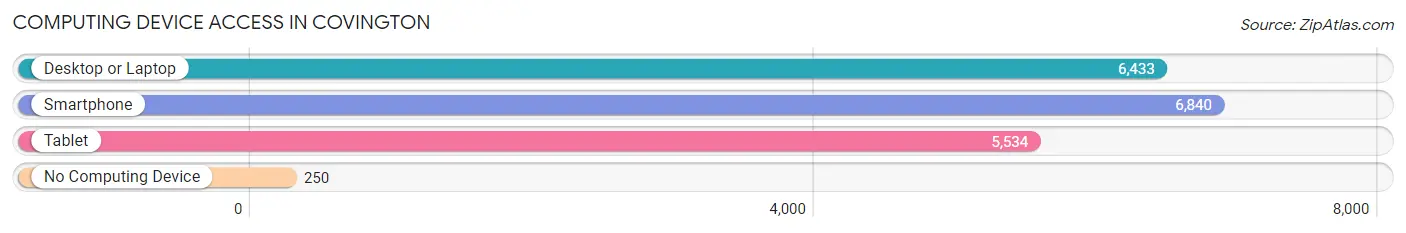
| Device Type | # Households | % Households |
| Desktop or Laptop | 6,433 | 88.0% |
| Smartphone | 6,840 | 93.6% |
| Tablet | 5,534 | 75.7% |
| No Computing Device | 250 | 3.4% |
| Total | 7,306 | 100.0% |
Internet Access in Covington
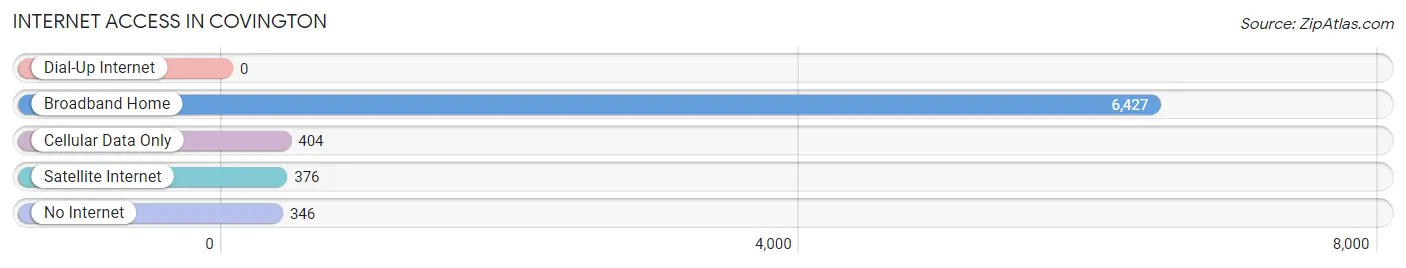
| Internet Type | # Households | % Households |
| Dial-Up Internet | 0 | 0.0% |
| Broadband Home | 6,427 | 88.0% |
| Cellular Data Only | 404 | 5.5% |
| Satellite Internet | 376 | 5.1% |
| No Internet | 346 | 4.7% |
| Total | 7,306 | 100.0% |
Covington Summary
Covington, Washington is a city located in King County, Washington, United States. The city is located about 20 miles southeast of Seattle and is part of the Seattle metropolitan area. As of the 2010 census, the population of Covington was 17,575.
History
The area that is now Covington was first settled in the late 1800s by homesteaders. The area was originally known as Jenkins Prairie, named after the first settler, William Jenkins. In 1891, the area was renamed Covington in honor of General Leonard Covington, a hero of the War of 1812.
In the early 1900s, the area began to grow as logging and farming became more popular. The area was also home to several small sawmills and a brickyard. In the 1920s, the area began to develop into a residential community. The first school was built in 1923 and the first post office opened in 1925.
In the 1950s, Covington began to experience rapid growth as the Seattle metropolitan area expanded. The population of Covington increased from 1,000 in 1950 to over 10,000 by the 1970s.
Geography
Covington is located in King County, Washington, United States. The city is located about 20 miles southeast of Seattle and is part of the Seattle metropolitan area. The city is situated on the western edge of the Cascade Mountains and is bordered by the cities of Maple Valley to the north, Kent to the west, and Black Diamond to the south.
The city has a total area of 8.7 square miles, of which 8.6 square miles is land and 0.1 square miles is water. The city is located at an elevation of 441 feet above sea level.
Economy
Covington is home to a variety of businesses and industries. The city is home to several large employers, including Boeing, Amazon, and Microsoft. The city is also home to several small businesses, including restaurants, retail stores, and professional services.
The city is also home to several industrial parks, which are home to a variety of manufacturing and distribution companies. The city is also home to several medical facilities, including Valley Medical Center and MultiCare Covington Medical Center.
Demographics
As of the 2010 census, the population of Covington was 17,575. The racial makeup of the city was 77.3% White, 8.2% African American, 0.7% Native American, 5.2% Asian, 0.2% Pacific Islander, 4.2% from other races, and 4.2% from two or more races. Hispanic or Latino of any race were 11.2% of the population.
The median income for a household in the city was $68,945, and the median income for a family was $77,945. The per capita income for the city was $30,945. About 5.2% of families and 7.2% of the population were below the poverty line, including 8.2% of those under age 18 and 5.2% of those age 65 or over.
Common Questions
What is Per Capita Income in Covington?
Per Capita income in Covington is $51,581.
What is the Median Family Income in Covington?
Median Family Income in Covington is $129,946.
What is the Median Household income in Covington?
Median Household Income in Covington is $123,065.
What is Income or Wage Gap in Covington?
Income or Wage Gap in Covington is 36.9%.
Women in Covington earn 63.1 cents for every dollar earned by a man.
What is Family Income Deficit in Covington?
Family Income Deficit in Covington is $10,102.
Families that are below poverty line in Covington earn $10,102 less on average than the poverty threshold level.
What is Inequality or Gini Index in Covington?
Inequality or Gini Index in Covington is 0.38.
What is the Total Population of Covington?
Total Population of Covington is 20,814.
What is the Total Male Population of Covington?
Total Male Population of Covington is 10,639.
What is the Total Female Population of Covington?
Total Female Population of Covington is 10,175.
What is the Ratio of Males per 100 Females in Covington?
There are 104.56 Males per 100 Females in Covington.
What is the Ratio of Females per 100 Males in Covington?
There are 95.64 Females per 100 Males in Covington.
What is the Median Population Age in Covington?
Median Population Age in Covington is 38.6 Years.
What is the Average Family Size in Covington
Average Family Size in Covington is 3.2 People.
What is the Average Household Size in Covington
Average Household Size in Covington is 2.8 People.
How Large is the Labor Force in Covington?
There are 11,596 People in the Labor Forcein in Covington.
What is the Percentage of People in the Labor Force in Covington?
70.0% of People are in the Labor Force in Covington.
What is the Unemployment Rate in Covington?
Unemployment Rate in Covington is 3.4%.