Central Park, WA Map & Demographics
Central Park Map
Central Park Overview
$41,497
PER CAPITA INCOME
$110,000
AVG FAMILY INCOME
$96,170
AVG HOUSEHOLD INCOME
44.0%
WAGE / INCOME GAP [ % ]
56.0¢/ $1
WAGE / INCOME GAP [ $ ]
0.34
INEQUALITY / GINI INDEX
3,416
TOTAL POPULATION
1,854
MALE POPULATION
1,562
FEMALE POPULATION
118.69
MALES / 100 FEMALES
84.25
FEMALES / 100 MALES
47.2
MEDIAN AGE
2.9
AVG FAMILY SIZE
2.6
AVG HOUSEHOLD SIZE
1,831
LABOR FORCE [ PEOPLE ]
65.8%
PERCENT IN LABOR FORCE
0.7%
UNEMPLOYMENT RATE
Income in Central Park
Income Overview in Central Park
Per Capita Income in Central Park is $41,497, while median incomes of families and households are $110,000 and $96,170 respectively.
| Characteristic | Number | Measure |
| Per Capita Income | 3,416 | $41,497 |
| Median Family Income | 908 | $110,000 |
| Mean Family Income | 908 | $117,212 |
| Median Household Income | 1,316 | $96,170 |
| Mean Household Income | 1,316 | $104,084 |
| Income Deficit | 908 | $0 |
| Wage / Income Gap (%) | 3,416 | 44.02% |
| Wage / Income Gap ($) | 3,416 | 55.98¢ per $1 |
| Gini / Inequality Index | 3,416 | 0.34 |
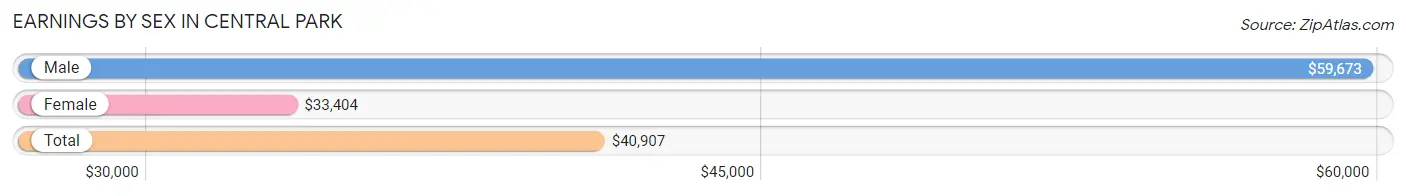
Earnings by Sex in Central Park
Average Earnings in Central Park are $40,907, $59,673 for men and $33,404 for women, a difference of 44.0%.
| Sex | Number | Average Earnings |
| Male | 1,085 (55.8%) | $59,673 |
| Female | 859 (44.2%) | $33,404 |
| Total | 1,944 (100.0%) | $40,907 |
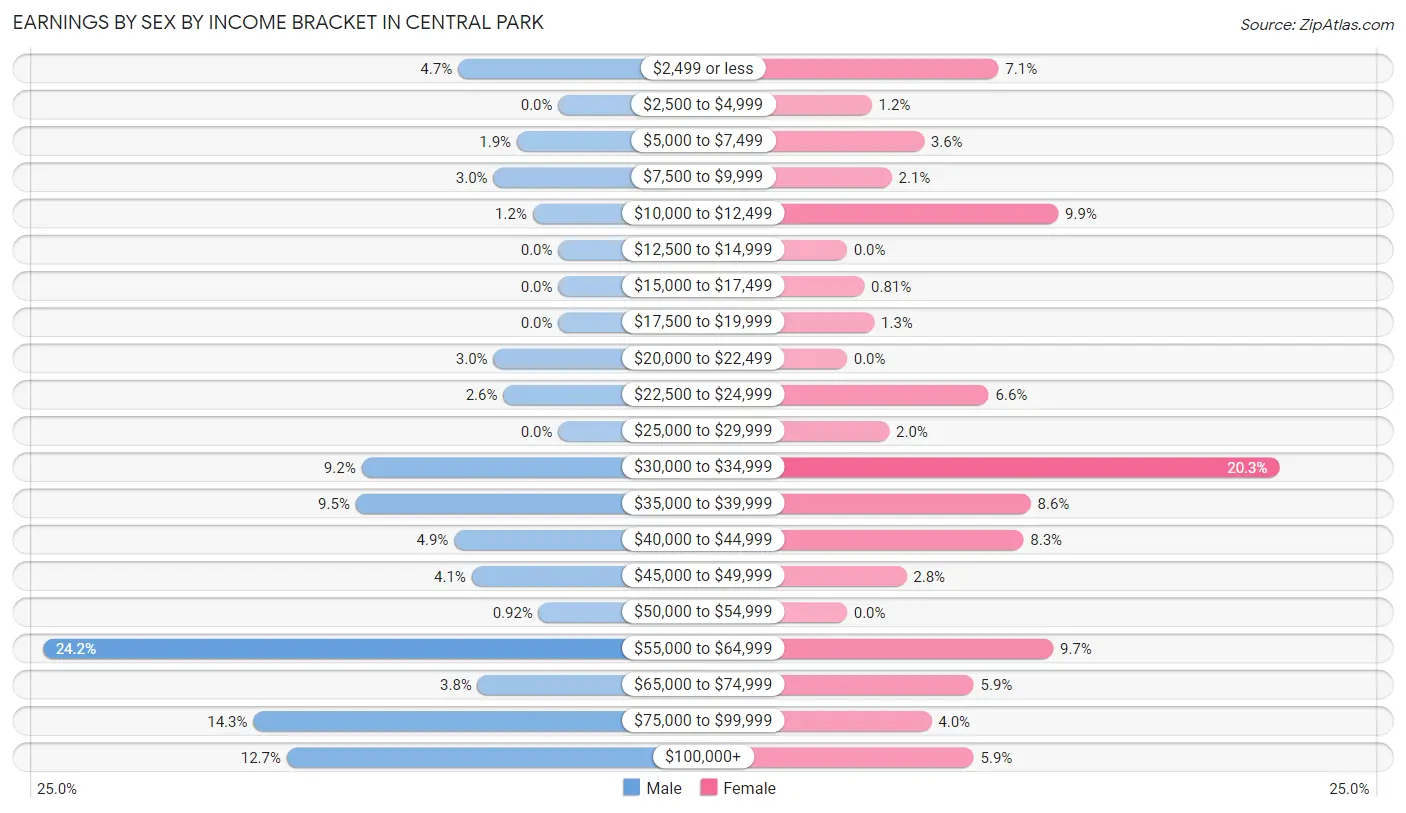
Earnings by Sex by Income Bracket in Central Park
The most common earnings brackets in Central Park are $55,000 to $64,999 for men (262 | 24.1%) and $30,000 to $34,999 for women (174 | 20.3%).
| Income | Male | Female |
| $2,499 or less | 51 (4.7%) | 61 (7.1%) |
| $2,500 to $4,999 | 0 (0.0%) | 10 (1.2%) |
| $5,000 to $7,499 | 21 (1.9%) | 31 (3.6%) |
| $7,500 to $9,999 | 33 (3.0%) | 18 (2.1%) |
| $10,000 to $12,499 | 13 (1.2%) | 85 (9.9%) |
| $12,500 to $14,999 | 0 (0.0%) | 0 (0.0%) |
| $15,000 to $17,499 | 0 (0.0%) | 7 (0.8%) |
| $17,500 to $19,999 | 0 (0.0%) | 11 (1.3%) |
| $20,000 to $22,499 | 33 (3.0%) | 0 (0.0%) |
| $22,500 to $24,999 | 28 (2.6%) | 57 (6.6%) |
| $25,000 to $29,999 | 0 (0.0%) | 17 (2.0%) |
| $30,000 to $34,999 | 100 (9.2%) | 174 (20.3%) |
| $35,000 to $39,999 | 103 (9.5%) | 74 (8.6%) |
| $40,000 to $44,999 | 53 (4.9%) | 71 (8.3%) |
| $45,000 to $49,999 | 44 (4.1%) | 24 (2.8%) |
| $50,000 to $54,999 | 10 (0.9%) | 0 (0.0%) |
| $55,000 to $64,999 | 262 (24.1%) | 83 (9.7%) |
| $65,000 to $74,999 | 41 (3.8%) | 51 (5.9%) |
| $75,000 to $99,999 | 155 (14.3%) | 34 (4.0%) |
| $100,000+ | 138 (12.7%) | 51 (5.9%) |
| Total | 1,085 (100.0%) | 859 (100.0%) |
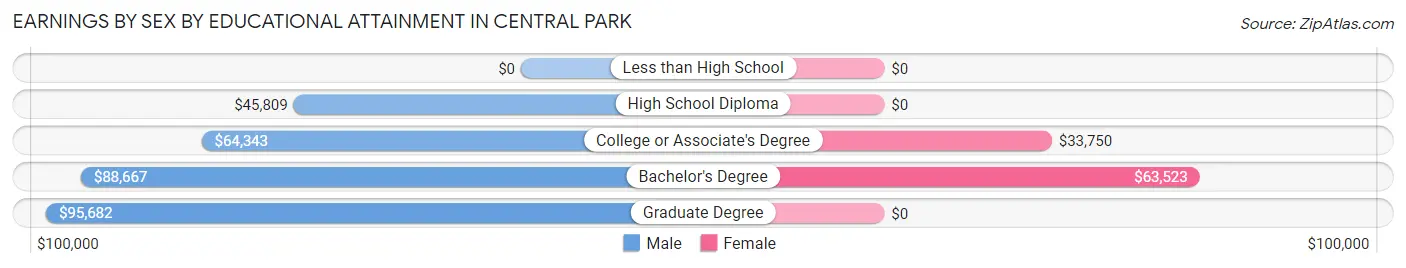
Earnings by Sex by Educational Attainment in Central Park
Average earnings in Central Park are $63,705 for men and $36,220 for women, a difference of 43.1%. Men with an educational attainment of graduate degree enjoy the highest average annual earnings of $95,682, while those with high school diploma education earn the least with $45,809. Women with an educational attainment of bachelor's degree earn the most with the average annual earnings of $63,523, while those with college or associate's degree education have the smallest earnings of $33,750.
| Educational Attainment | Male Income | Female Income |
| Less than High School | - | - |
| High School Diploma | $45,809 | $0 |
| College or Associate's Degree | $64,343 | $33,750 |
| Bachelor's Degree | $88,667 | $63,523 |
| Graduate Degree | $95,682 | $0 |
| Total | $63,705 | $36,220 |
Family Income in Central Park
Family Income Brackets in Central Park
According to the Central Park family income data, there are 267 families falling into the $100,000 to $149,999 income range, which is the most common income bracket and makes up 29.4% of all families.
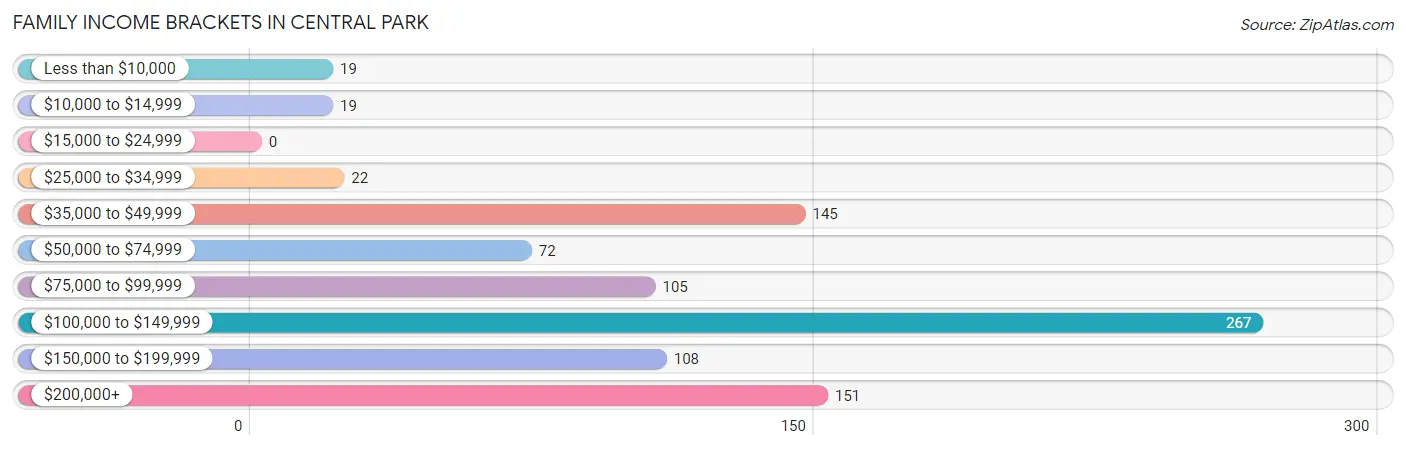
| Income Bracket | # Families | % Families |
| Less than $10,000 | 19 | 2.1% |
| $10,000 to $14,999 | 19 | 2.1% |
| $15,000 to $24,999 | 0 | 0.0% |
| $25,000 to $34,999 | 22 | 2.4% |
| $35,000 to $49,999 | 145 | 16.0% |
| $50,000 to $74,999 | 72 | 7.9% |
| $75,000 to $99,999 | 105 | 11.6% |
| $100,000 to $149,999 | 267 | 29.4% |
| $150,000 to $199,999 | 108 | 11.9% |
| $200,000+ | 151 | 16.6% |
Family Income by Famaliy Size in Central Park
5-person families (68 | 7.5%) account for the highest median family income in Central Park with $167,717 per family, while 2-person families (589 | 64.9%) have the highest median income of $50,234 per family member.
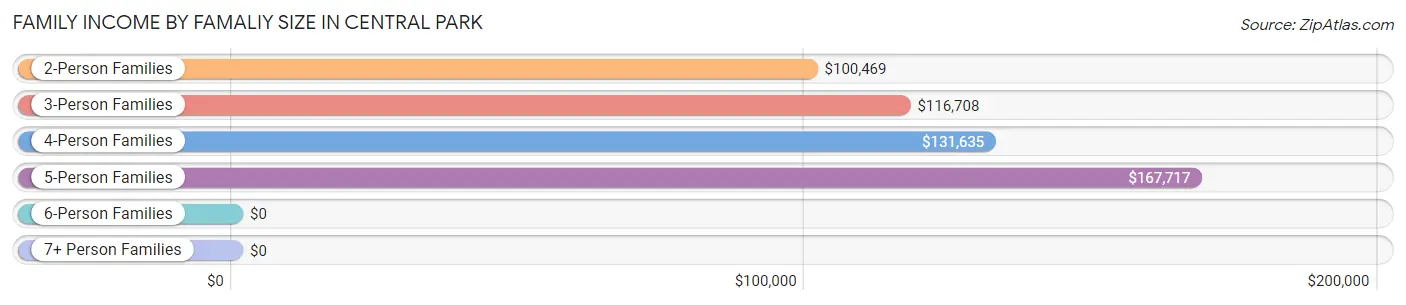
| Income Bracket | # Families | Median Income |
| 2-Person Families | 589 (64.9%) | $100,469 |
| 3-Person Families | 149 (16.4%) | $116,708 |
| 4-Person Families | 49 (5.4%) | $131,635 |
| 5-Person Families | 68 (7.5%) | $167,717 |
| 6-Person Families | 0 (0.0%) | $0 |
| 7+ Person Families | 53 (5.8%) | $0 |
| Total | 908 (100.0%) | $110,000 |
Family Income by Number of Earners in Central Park
The median family income in Central Park is $110,000, with families comprising 2 earners (363) having the highest median family income of $165,972, while families with no earners (200) have the lowest median family income of $58,125, accounting for 40.0% and 22.0% of families, respectively.
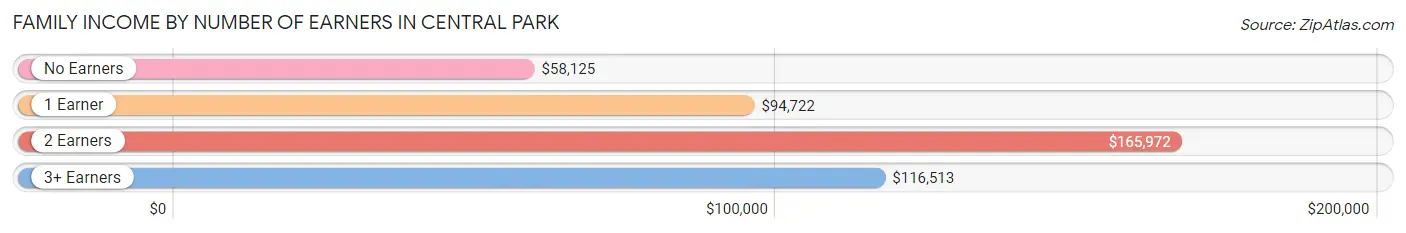
| Number of Earners | # Families | Median Income |
| No Earners | 200 (22.0%) | $58,125 |
| 1 Earner | 218 (24.0%) | $94,722 |
| 2 Earners | 363 (40.0%) | $165,972 |
| 3+ Earners | 127 (14.0%) | $116,513 |
| Total | 908 (100.0%) | $110,000 |
Household Income in Central Park
Household Income Brackets in Central Park
With 343 households falling in the category, the $100,000 to $149,999 income range is the most frequent in Central Park, accounting for 26.1% of all households. In contrast, only 36 households (2.7%) fall into the $15,000 to $24,999 income bracket, making it the least populous group.
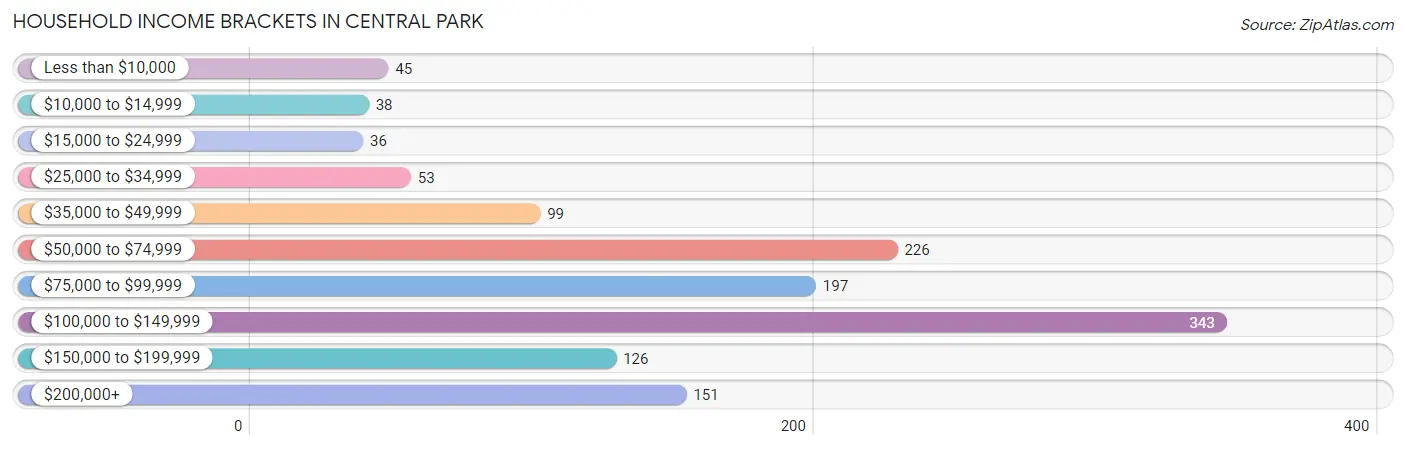
| Income Bracket | # Households | % Households |
| Less than $10,000 | 45 | 3.4% |
| $10,000 to $14,999 | 38 | 2.9% |
| $15,000 to $24,999 | 36 | 2.7% |
| $25,000 to $34,999 | 53 | 4.0% |
| $35,000 to $49,999 | 99 | 7.5% |
| $50,000 to $74,999 | 226 | 17.2% |
| $75,000 to $99,999 | 197 | 15.0% |
| $100,000 to $149,999 | 343 | 26.1% |
| $150,000 to $199,999 | 126 | 9.6% |
| $200,000+ | 151 | 11.5% |
Household Income by Householder Age in Central Park
The median household income in Central Park is $96,170, with the highest median household income of $113,496 found in the 25 to 44 years age bracket for the primary householder. A total of 257 households (19.5%) fall into this category. Meanwhile, the 65+ years age bracket for the primary householder has the lowest median household income of $60,536, with 328 households (24.9%) in this group.
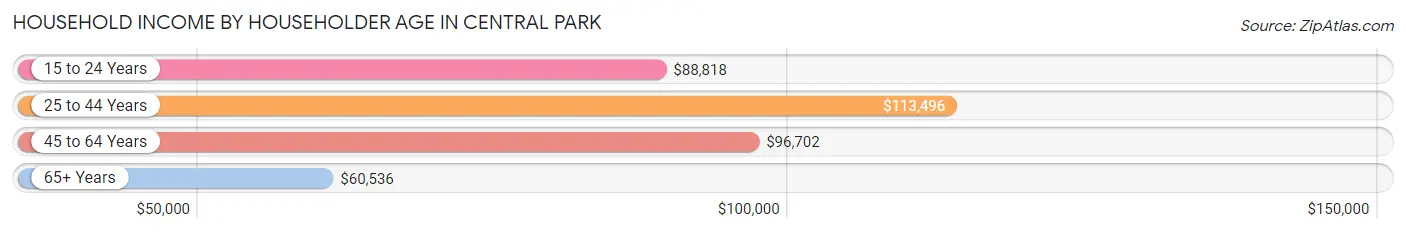
| Income Bracket | # Households | Median Income |
| 15 to 24 Years | 51 (3.9%) | $88,818 |
| 25 to 44 Years | 257 (19.5%) | $113,496 |
| 45 to 64 Years | 680 (51.7%) | $96,702 |
| 65+ Years | 328 (24.9%) | $60,536 |
| Total | 1,316 (100.0%) | $96,170 |
Poverty in Central Park
Income Below Poverty by Sex and Age in Central Park
With 7.3% poverty level for males and 7.9% for females among the residents of Central Park, 75 year old and over males and 35 to 44 year old females are the most vulnerable to poverty, with 22 males (24.4%) and 24 females (18.0%) in their respective age groups living below the poverty level.
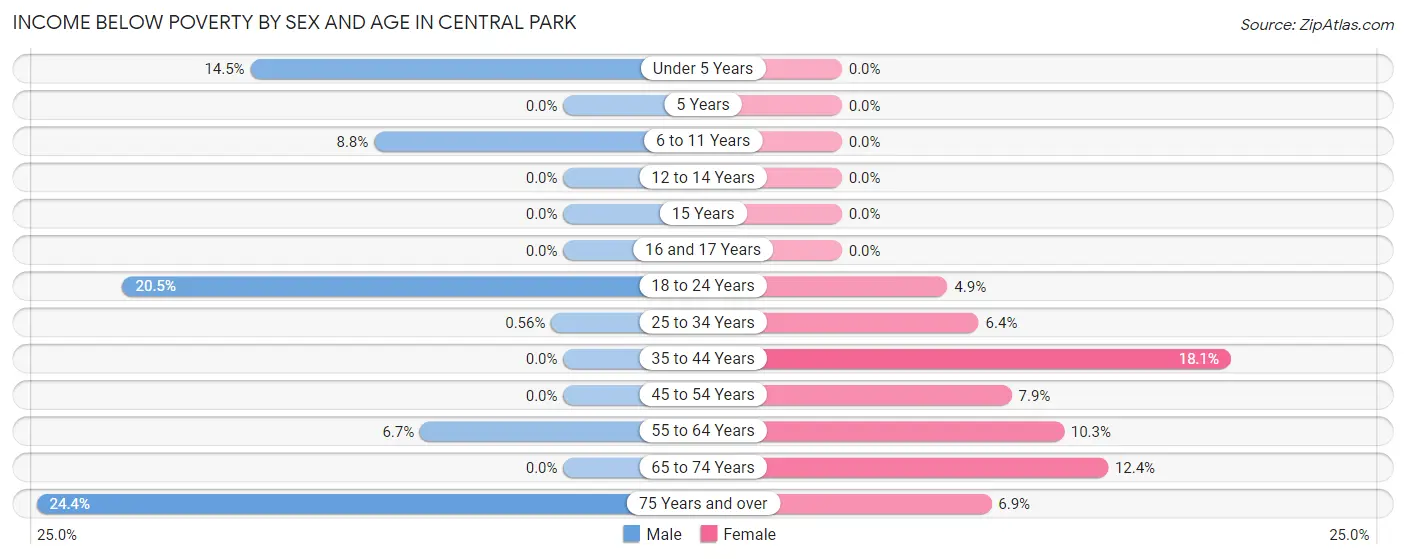
| Age Bracket | Male | Female |
| Under 5 Years | 9 (14.5%) | 0 (0.0%) |
| 5 Years | 0 (0.0%) | 0 (0.0%) |
| 6 to 11 Years | 18 (8.8%) | 0 (0.0%) |
| 12 to 14 Years | 0 (0.0%) | 0 (0.0%) |
| 15 Years | 0 (0.0%) | 0 (0.0%) |
| 16 and 17 Years | 0 (0.0%) | 0 (0.0%) |
| 18 to 24 Years | 54 (20.4%) | 7 (4.9%) |
| 25 to 34 Years | 1 (0.6%) | 8 (6.4%) |
| 35 to 44 Years | 0 (0.0%) | 24 (18.0%) |
| 45 to 54 Years | 0 (0.0%) | 19 (7.9%) |
| 55 to 64 Years | 29 (6.7%) | 34 (10.3%) |
| 65 to 74 Years | 0 (0.0%) | 20 (12.3%) |
| 75 Years and over | 22 (24.4%) | 10 (6.9%) |
| Total | 133 (7.3%) | 122 (7.9%) |
Income Above Poverty by Sex and Age in Central Park
According to the poverty statistics in Central Park, males aged 12 to 14 years and females aged under 5 years are the age groups that are most secure financially, with 100.0% of males and 100.0% of females in these age groups living above the poverty line.
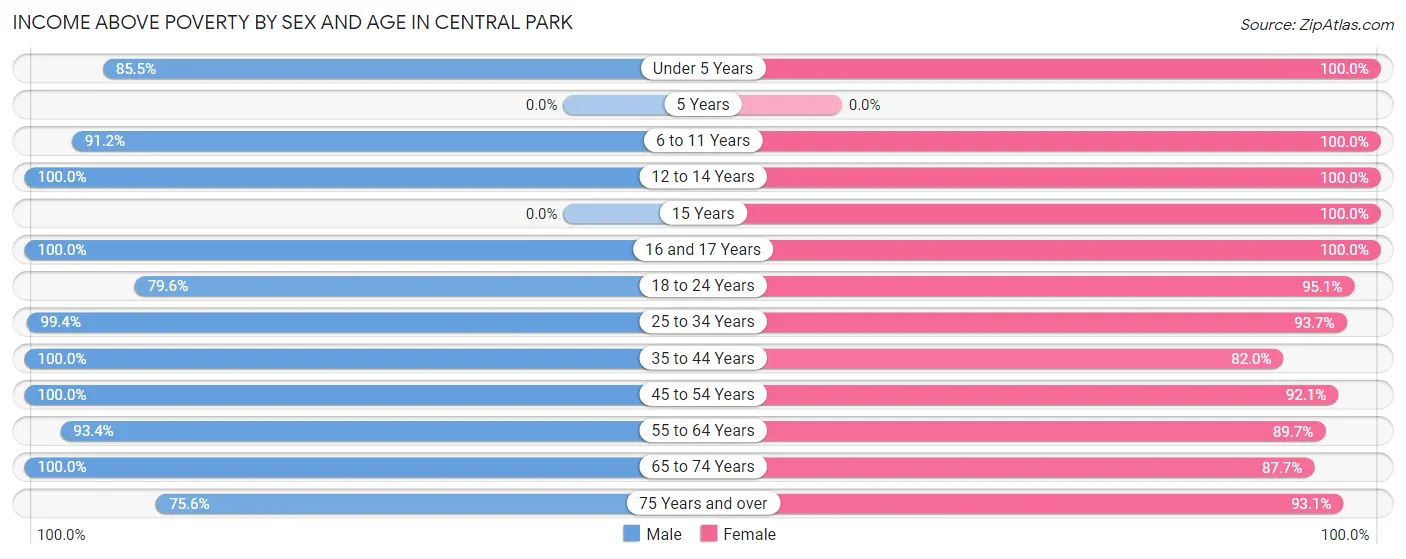
| Age Bracket | Male | Female |
| Under 5 Years | 53 (85.5%) | 78 (100.0%) |
| 5 Years | 0 (0.0%) | 0 (0.0%) |
| 6 to 11 Years | 187 (91.2%) | 123 (100.0%) |
| 12 to 14 Years | 59 (100.0%) | 50 (100.0%) |
| 15 Years | 0 (0.0%) | 9 (100.0%) |
| 16 and 17 Years | 48 (100.0%) | 13 (100.0%) |
| 18 to 24 Years | 210 (79.5%) | 136 (95.1%) |
| 25 to 34 Years | 177 (99.4%) | 118 (93.6%) |
| 35 to 44 Years | 112 (100.0%) | 109 (82.0%) |
| 45 to 54 Years | 217 (100.0%) | 222 (92.1%) |
| 55 to 64 Years | 407 (93.3%) | 296 (89.7%) |
| 65 to 74 Years | 146 (100.0%) | 142 (87.6%) |
| 75 Years and over | 68 (75.6%) | 134 (93.1%) |
| Total | 1,684 (92.7%) | 1,430 (92.1%) |
Income Below Poverty Among Married-Couple Families in Central Park
The poverty statistics for married-couple families in Central Park show that 2.9% or 21 of the total 722 families live below the poverty line. Families with no children have the highest poverty rate of 3.8%, comprising of 21 families. On the other hand, families with 1 or 2 children have the lowest poverty rate of 0.0%, which includes 0 families.
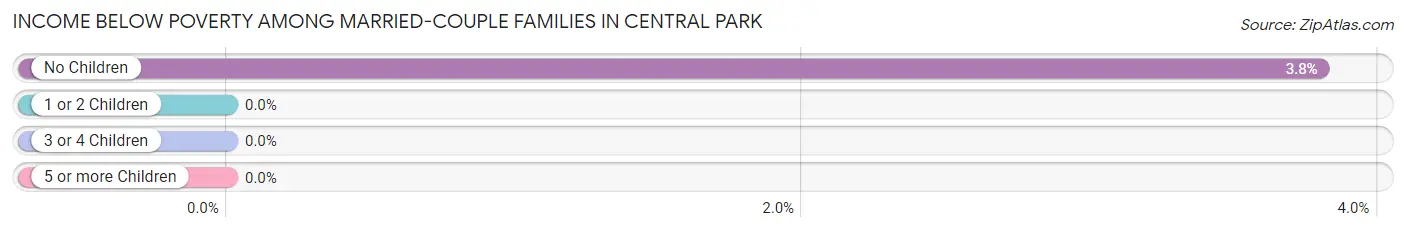
| Children | Above Poverty | Below Poverty |
| No Children | 531 (96.2%) | 21 (3.8%) |
| 1 or 2 Children | 68 (100.0%) | 0 (0.0%) |
| 3 or 4 Children | 68 (100.0%) | 0 (0.0%) |
| 5 or more Children | 34 (100.0%) | 0 (0.0%) |
| Total | 701 (97.1%) | 21 (2.9%) |
Income Below Poverty Among Single-Parent Households in Central Park
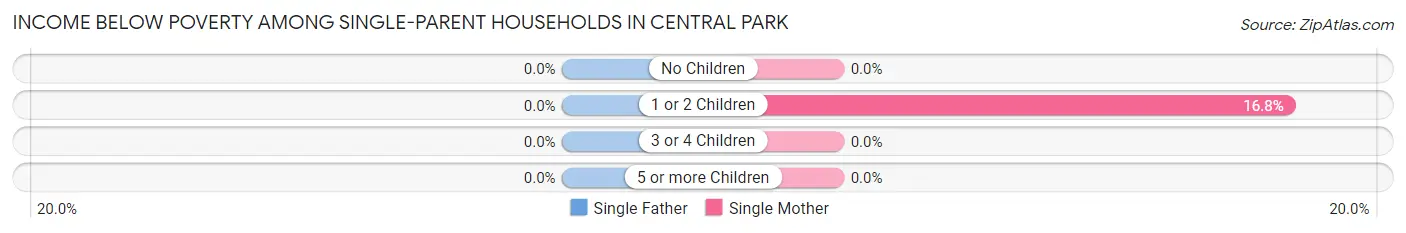
| Children | Single Father | Single Mother |
| No Children | 0 (0.0%) | 0 (0.0%) |
| 1 or 2 Children | 0 (0.0%) | 17 (16.8%) |
| 3 or 4 Children | 0 (0.0%) | 0 (0.0%) |
| 5 or more Children | 0 (0.0%) | 0 (0.0%) |
| Total | 0 (0.0%) | 17 (13.8%) |
Income Below Poverty Among Married-Couple vs Single-Parent Households in Central Park
The poverty data for Central Park shows that 21 of the married-couple family households (2.9%) and 17 of the single-parent households (9.1%) are living below the poverty level. Within the married-couple family households, those with no children have the highest poverty rate, with 21 households (3.8%) falling below the poverty line. Among the single-parent households, those with 1 or 2 children have the highest poverty rate, with 17 household (13.6%) living below poverty.
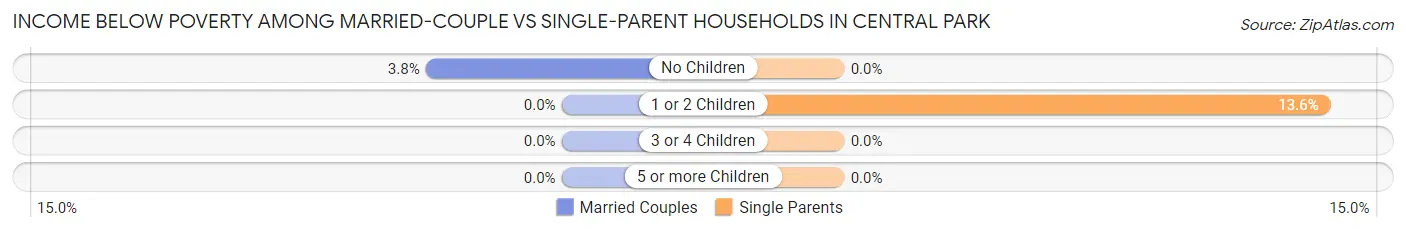
| Children | Married-Couple Families | Single-Parent Households |
| No Children | 21 (3.8%) | 0 (0.0%) |
| 1 or 2 Children | 0 (0.0%) | 17 (13.6%) |
| 3 or 4 Children | 0 (0.0%) | 0 (0.0%) |
| 5 or more Children | 0 (0.0%) | 0 (0.0%) |
| Total | 21 (2.9%) | 17 (9.1%) |
Race in Central Park
The most populous races in Central Park are White / Caucasian (2,837 | 83.1%), Hispanic or Latino (402 | 11.8%), and Some other Race (328 | 9.6%).
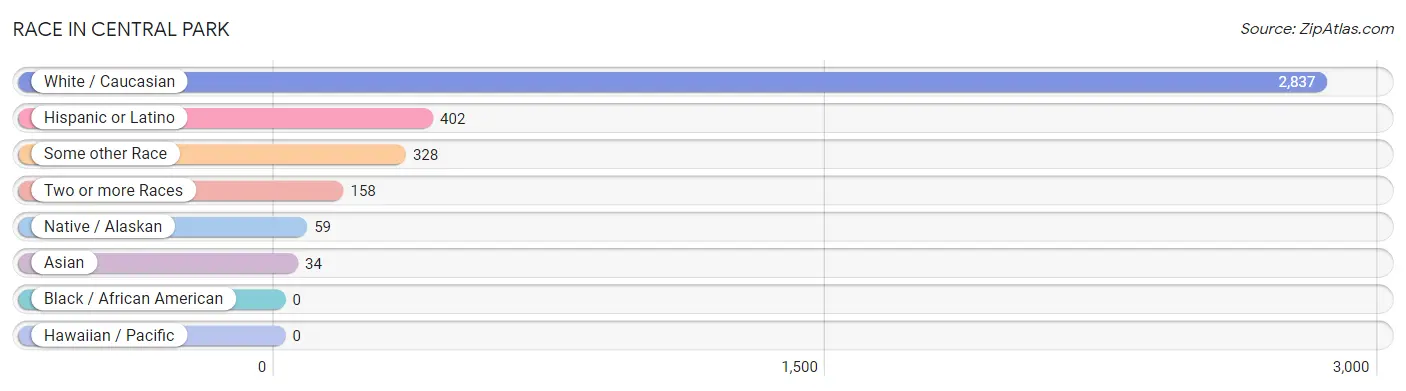
| Race | # Population | % Population |
| Asian | 34 | 1.0% |
| Black / African American | 0 | 0.0% |
| Hawaiian / Pacific | 0 | 0.0% |
| Hispanic or Latino | 402 | 11.8% |
| Native / Alaskan | 59 | 1.7% |
| White / Caucasian | 2,837 | 83.1% |
| Two or more Races | 158 | 4.6% |
| Some other Race | 328 | 9.6% |
| Total | 3,416 | 100.0% |
Ancestry in Central Park
The most populous ancestries reported in Central Park are German (728 | 21.3%), Irish (496 | 14.5%), Norwegian (463 | 13.6%), English (336 | 9.8%), and Mexican (328 | 9.6%), together accounting for 68.8% of all Central Park residents.
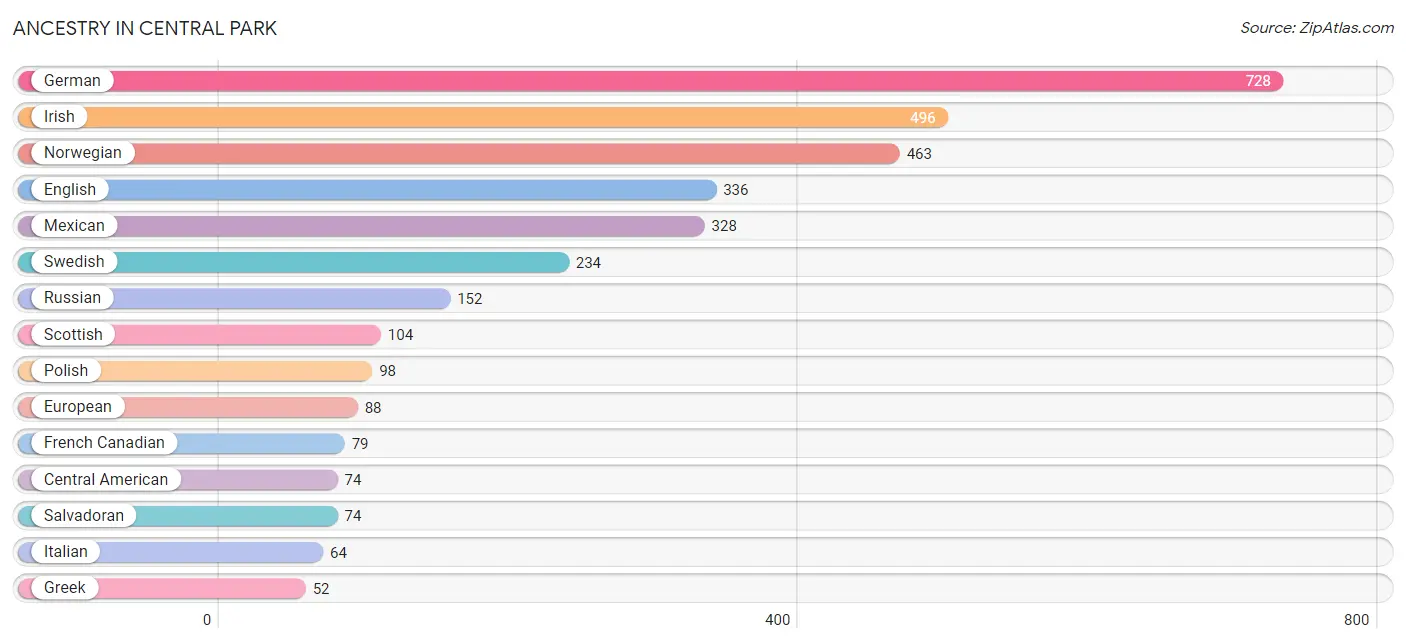
| Ancestry | # Population | % Population |
| American | 43 | 1.3% |
| Bhutanese | 14 | 0.4% |
| British | 35 | 1.0% |
| Burmese | 20 | 0.6% |
| Canadian | 12 | 0.4% |
| Central American | 74 | 2.2% |
| Cherokee | 8 | 0.2% |
| Croatian | 16 | 0.5% |
| Danish | 13 | 0.4% |
| Dutch | 37 | 1.1% |
| Eastern European | 21 | 0.6% |
| English | 336 | 9.8% |
| European | 88 | 2.6% |
| Finnish | 20 | 0.6% |
| French | 48 | 1.4% |
| French Canadian | 79 | 2.3% |
| German | 728 | 21.3% |
| Greek | 52 | 1.5% |
| Irish | 496 | 14.5% |
| Iroquois | 7 | 0.2% |
| Italian | 64 | 1.9% |
| Mexican | 328 | 9.6% |
| Norwegian | 463 | 13.6% |
| Polish | 98 | 2.9% |
| Russian | 152 | 4.4% |
| Salvadoran | 74 | 2.2% |
| Samoan | 33 | 1.0% |
| Scandinavian | 30 | 0.9% |
| Scotch-Irish | 33 | 1.0% |
| Scottish | 104 | 3.0% |
| Sioux | 4 | 0.1% |
| Swedish | 234 | 6.9% |
| Swiss | 11 | 0.3% |
| Welsh | 21 | 0.6% | View All 34 Rows |
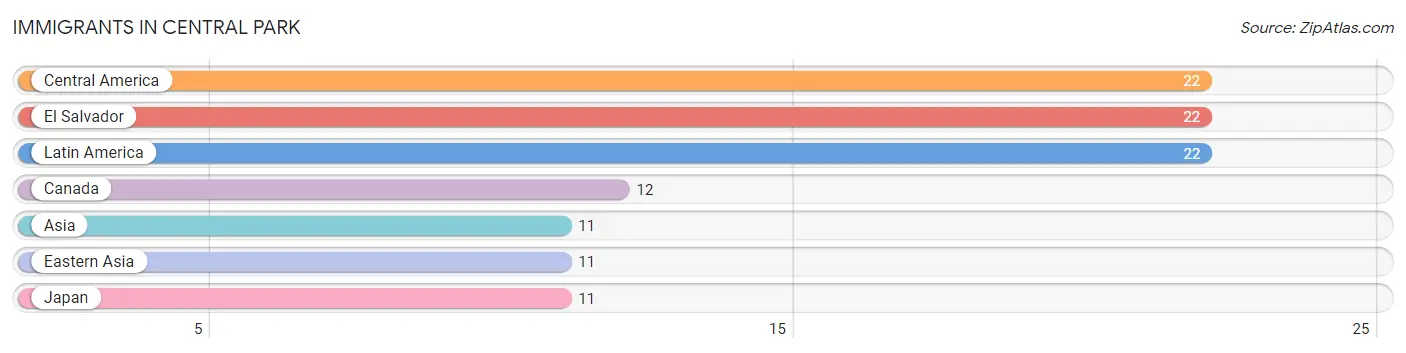
Immigrants in Central Park
The most numerous immigrant groups reported in Central Park came from Central America (22 | 0.6%), El Salvador (22 | 0.6%), Latin America (22 | 0.6%), Canada (12 | 0.4%), and Asia (11 | 0.3%), together accounting for 2.6% of all Central Park residents.
| Immigration Origin | # Population | % Population |
| Asia | 11 | 0.3% |
| Canada | 12 | 0.4% |
| Central America | 22 | 0.6% |
| Eastern Asia | 11 | 0.3% |
| El Salvador | 22 | 0.6% |
| Japan | 11 | 0.3% |
| Latin America | 22 | 0.6% | View All 7 Rows |
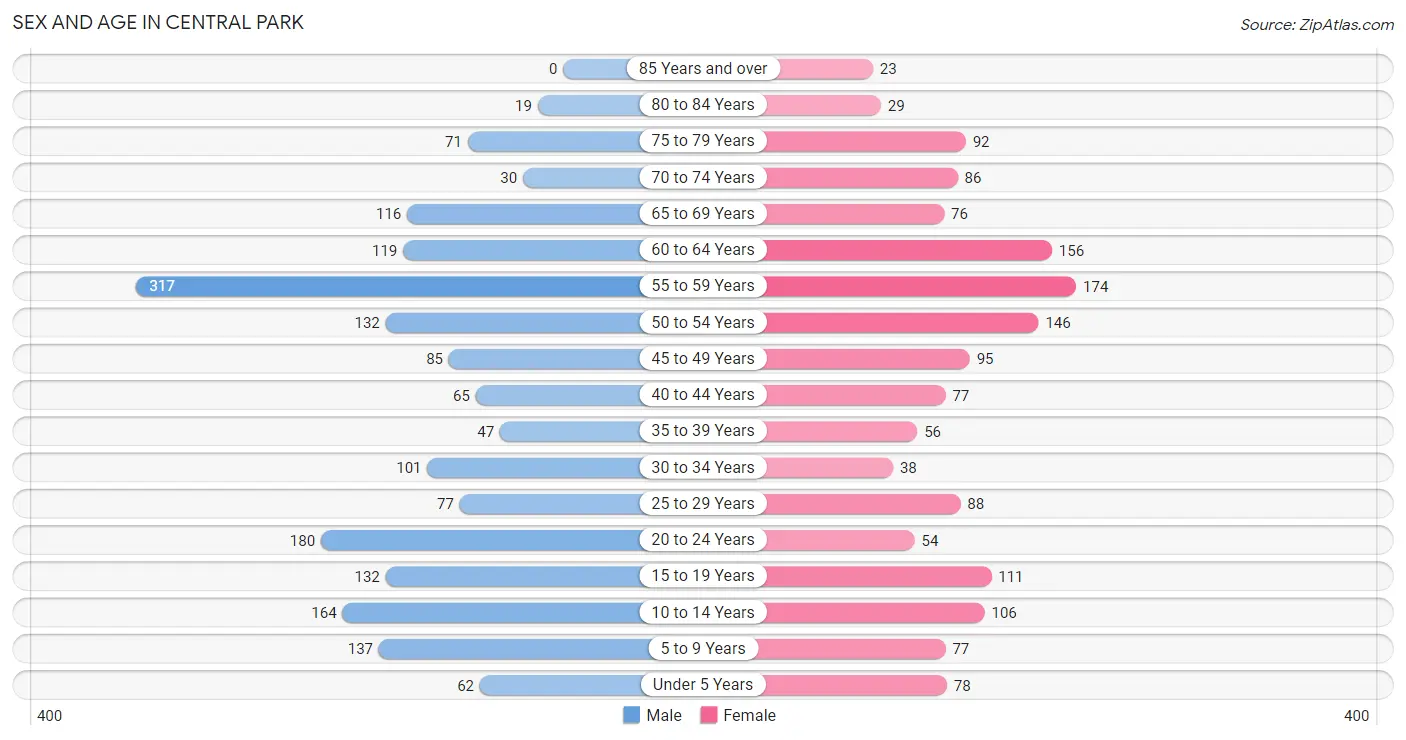
Sex and Age in Central Park
Sex and Age in Central Park
The most populous age groups in Central Park are 55 to 59 Years (317 | 17.1%) for men and 55 to 59 Years (174 | 11.1%) for women.
| Age Bracket | Male | Female |
| Under 5 Years | 62 (3.3%) | 78 (5.0%) |
| 5 to 9 Years | 137 (7.4%) | 77 (4.9%) |
| 10 to 14 Years | 164 (8.8%) | 106 (6.8%) |
| 15 to 19 Years | 132 (7.1%) | 111 (7.1%) |
| 20 to 24 Years | 180 (9.7%) | 54 (3.5%) |
| 25 to 29 Years | 77 (4.2%) | 88 (5.6%) |
| 30 to 34 Years | 101 (5.4%) | 38 (2.4%) |
| 35 to 39 Years | 47 (2.5%) | 56 (3.6%) |
| 40 to 44 Years | 65 (3.5%) | 77 (4.9%) |
| 45 to 49 Years | 85 (4.6%) | 95 (6.1%) |
| 50 to 54 Years | 132 (7.1%) | 146 (9.3%) |
| 55 to 59 Years | 317 (17.1%) | 174 (11.1%) |
| 60 to 64 Years | 119 (6.4%) | 156 (10.0%) |
| 65 to 69 Years | 116 (6.3%) | 76 (4.9%) |
| 70 to 74 Years | 30 (1.6%) | 86 (5.5%) |
| 75 to 79 Years | 71 (3.8%) | 92 (5.9%) |
| 80 to 84 Years | 19 (1.0%) | 29 (1.9%) |
| 85 Years and over | 0 (0.0%) | 23 (1.5%) |
| Total | 1,854 (100.0%) | 1,562 (100.0%) |
Families and Households in Central Park
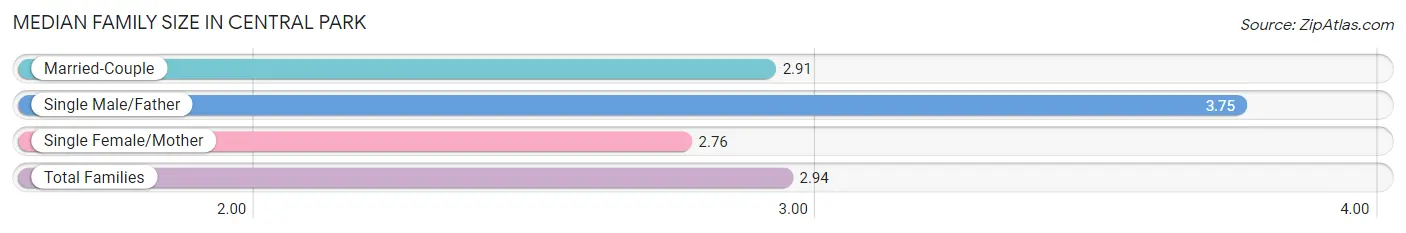
Median Family Size in Central Park
The median family size in Central Park is 2.94 persons per family, with single male/father families (63 | 6.9%) accounting for the largest median family size of 3.75 persons per family. On the other hand, single female/mother families (123 | 13.6%) represent the smallest median family size with 2.76 persons per family.
| Family Type | # Families | Family Size |
| Married-Couple | 722 (79.5%) | 2.91 |
| Single Male/Father | 63 (6.9%) | 3.75 |
| Single Female/Mother | 123 (13.6%) | 2.76 |
| Total Families | 908 (100.0%) | 2.94 |
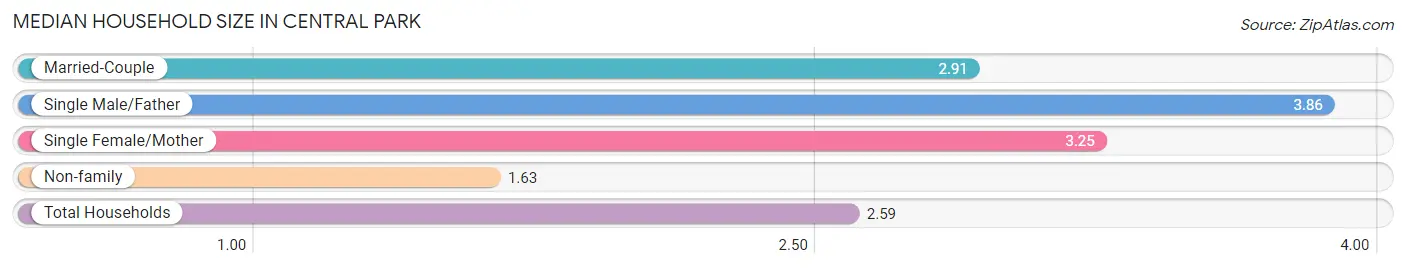
Median Household Size in Central Park
The median household size in Central Park is 2.59 persons per household, with single male/father households (63 | 4.8%) accounting for the largest median household size of 3.86 persons per household. non-family households (408 | 31.0%) represent the smallest median household size with 1.63 persons per household.
| Household Type | # Households | Household Size |
| Married-Couple | 722 (54.9%) | 2.91 |
| Single Male/Father | 63 (4.8%) | 3.86 |
| Single Female/Mother | 123 (9.3%) | 3.25 |
| Non-family | 408 (31.0%) | 1.63 |
| Total Households | 1,316 (100.0%) | 2.59 |
Household Size by Marriage Status in Central Park
Out of a total of 1,316 households in Central Park, 908 (69.0%) are family households, while 408 (31.0%) are nonfamily households. The most numerous type of family households are 2-person households, comprising 514, and the most common type of nonfamily households are 1-person households, comprising 232.
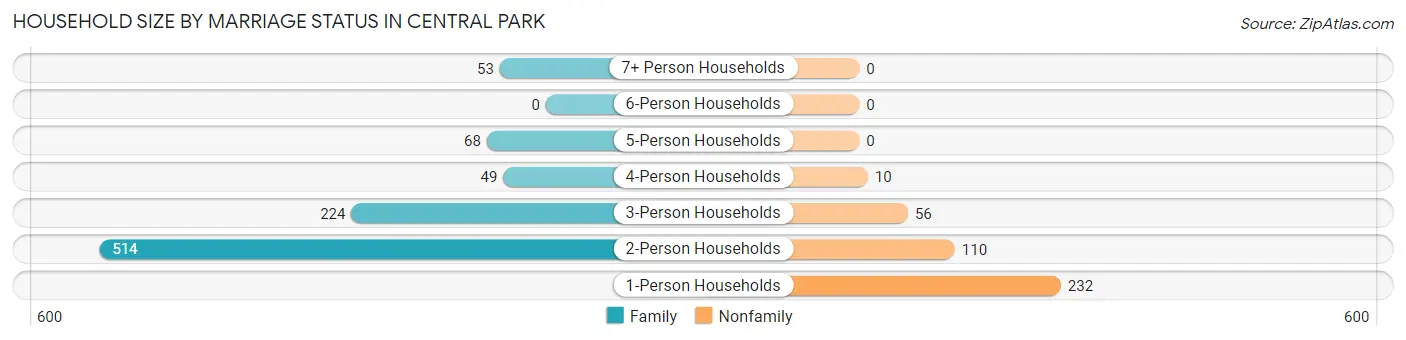
| Household Size | Family Households | Nonfamily Households |
| 1-Person Households | - | 232 (17.6%) |
| 2-Person Households | 514 (39.1%) | 110 (8.4%) |
| 3-Person Households | 224 (17.0%) | 56 (4.3%) |
| 4-Person Households | 49 (3.7%) | 10 (0.8%) |
| 5-Person Households | 68 (5.2%) | 0 (0.0%) |
| 6-Person Households | 0 (0.0%) | 0 (0.0%) |
| 7+ Person Households | 53 (4.0%) | 0 (0.0%) |
| Total | 908 (69.0%) | 408 (31.0%) |
Female Fertility in Central Park
Fertility by Age in Central Park
Average fertility rate in Central Park is 152.0 births per 1,000 women. Women in the age bracket of 20 to 34 years have the highest fertility rate with 417.0 births per 1,000 women. Women in the age bracket of 20 to 34 years acount for 91.5% of all women with births.
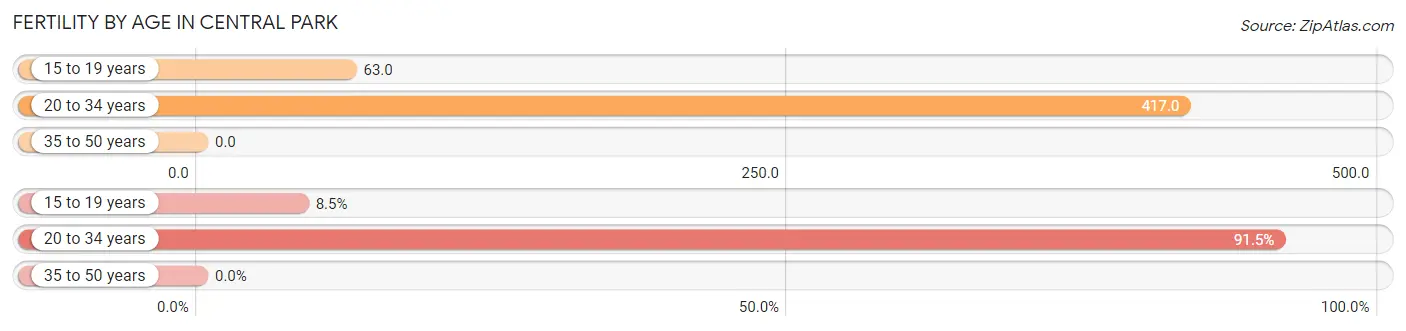
| Age Bracket | Women with Births | Births / 1,000 Women |
| 15 to 19 years | 7 (8.5%) | 63.0 |
| 20 to 34 years | 75 (91.5%) | 417.0 |
| 35 to 50 years | 0 (0.0%) | 0.0 |
| Total | 82 (100.0%) | 152.0 |
Fertility by Age by Marriage Status in Central Park
19.5% of women with births (82) in Central Park are married. The highest percentage of unmarried women with births falls into 15 to 19 years age bracket with 100.0% of them unmarried at the time of birth, while the lowest percentage of unmarried women with births belong to 20 to 34 years age bracket with 78.7% of them unmarried.
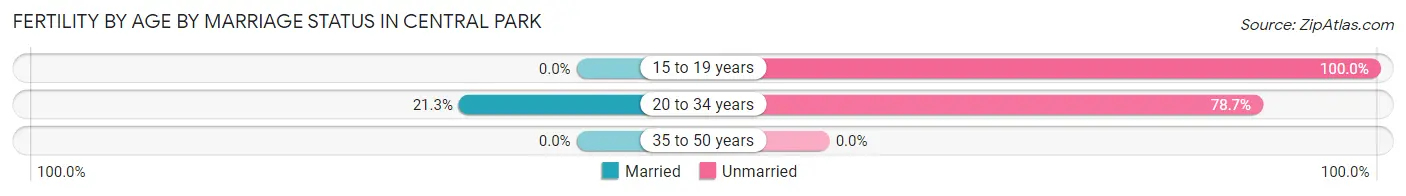
| Age Bracket | Married | Unmarried |
| 15 to 19 years | 0 (0.0%) | 7 (100.0%) |
| 20 to 34 years | 16 (21.3%) | 59 (78.7%) |
| 35 to 50 years | 0 (0.0%) | 0 (0.0%) |
| Total | 16 (19.5%) | 66 (80.5%) |
Fertility by Education in Central Park
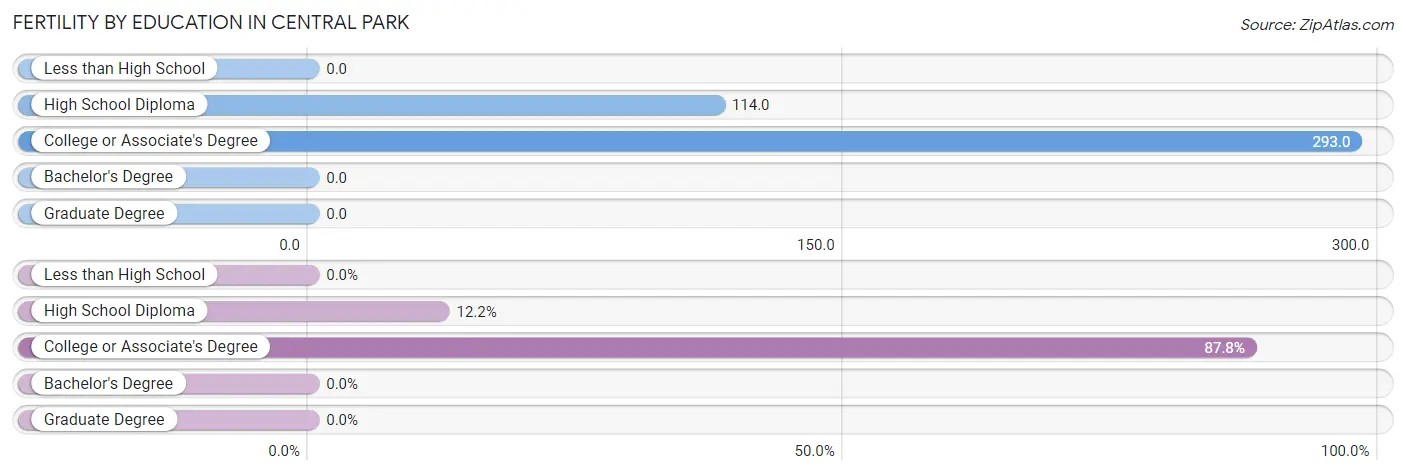
| Educational Attainment | Women with Births | Births / 1,000 Women |
| Less than High School | 0 (0.0%) | 0.0 |
| High School Diploma | 10 (12.2%) | 114.0 |
| College or Associate's Degree | 72 (87.8%) | 293.0 |
| Bachelor's Degree | 0 (0.0%) | 0.0 |
| Graduate Degree | 0 (0.0%) | 0.0 |
| Total | 82 (100.0%) | 152.0 |
Fertility by Education by Marriage Status in Central Park
80.5% of women with births in Central Park are unmarried. Women with the educational attainment of high school diploma are most likely to be married with 100.0% of them married at childbirth, while women with the educational attainment of college or associate's degree are least likely to be married with 91.7% of them unmarried at childbirth.
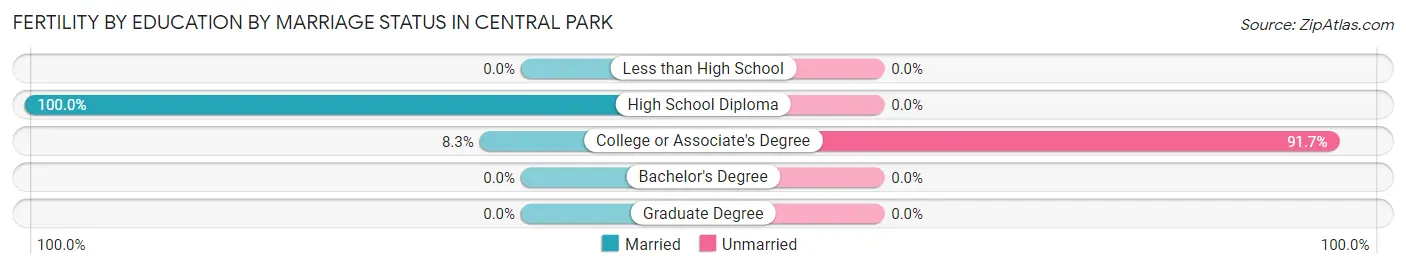
| Educational Attainment | Married | Unmarried |
| Less than High School | 0 (0.0%) | 0 (0.0%) |
| High School Diploma | 10 (100.0%) | 0 (0.0%) |
| College or Associate's Degree | 6 (8.3%) | 66 (91.7%) |
| Bachelor's Degree | 0 (0.0%) | 0 (0.0%) |
| Graduate Degree | 0 (0.0%) | 0 (0.0%) |
| Total | 16 (19.5%) | 66 (80.5%) |
Employment Characteristics in Central Park
Employment by Class of Employer in Central Park
Among the 1,801 employed individuals in Central Park, private company employees (1,184 | 65.7%), local government employees (249 | 13.8%), and self-employed (not incorporated) (158 | 8.8%) make up the most common classes of employment.
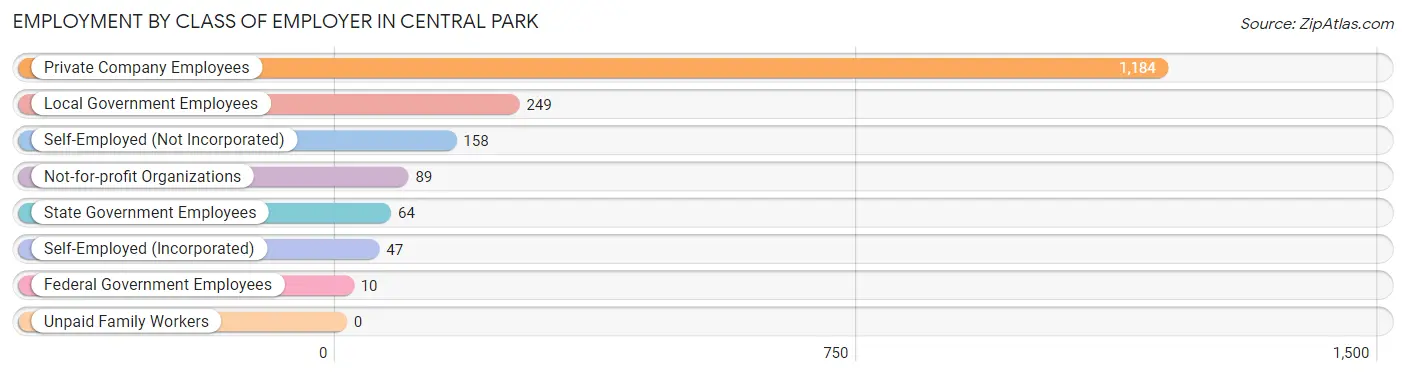
| Employer Class | # Employees | % Employees |
| Private Company Employees | 1,184 | 65.7% |
| Self-Employed (Incorporated) | 47 | 2.6% |
| Self-Employed (Not Incorporated) | 158 | 8.8% |
| Not-for-profit Organizations | 89 | 4.9% |
| Local Government Employees | 249 | 13.8% |
| State Government Employees | 64 | 3.5% |
| Federal Government Employees | 10 | 0.6% |
| Unpaid Family Workers | 0 | 0.0% |
| Total | 1,801 | 100.0% |
Employment Status by Age in Central Park
According to the labor force statistics for Central Park, out of the total population over 16 years of age (2,783), 65.8% or 1,831 individuals are in the labor force, with 0.7% or 13 of them unemployed. The age group with the highest labor force participation rate is 30 to 34 years, with 100.0% or 139 individuals in the labor force. Within the labor force, the 60 to 64 years age range has the highest percentage of unemployed individuals, with 11.8% or 12 of them being unemployed.
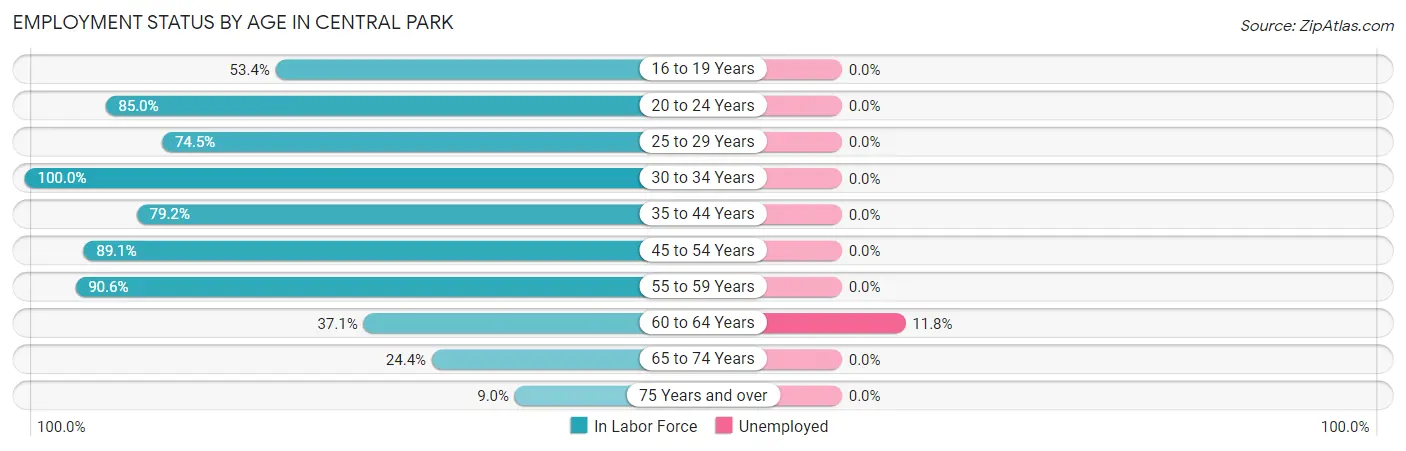
| Age Bracket | In Labor Force | Unemployed |
| 16 to 19 Years | 125 (53.4%) | 0 (0.0%) |
| 20 to 24 Years | 199 (85.0%) | 0 (0.0%) |
| 25 to 29 Years | 123 (74.5%) | 0 (0.0%) |
| 30 to 34 Years | 139 (100.0%) | 0 (0.0%) |
| 35 to 44 Years | 194 (79.2%) | 0 (0.0%) |
| 45 to 54 Years | 408 (89.1%) | 0 (0.0%) |
| 55 to 59 Years | 445 (90.6%) | 0 (0.0%) |
| 60 to 64 Years | 102 (37.1%) | 12 (11.8%) |
| 65 to 74 Years | 75 (24.4%) | 0 (0.0%) |
| 75 Years and over | 21 (9.0%) | 0 (0.0%) |
| Total | 1,831 (65.8%) | 13 (0.7%) |
Employment Status by Educational Attainment in Central Park
According to labor force statistics for Central Park, 79.6% of individuals (1,411) out of the total population between 25 and 64 years of age (1,773) are in the labor force, with 0.9% or 13 of them being unemployed. The group with the highest labor force participation rate are those with the educational attainment of bachelor's degree or higher, with 85.7% or 355 individuals in the labor force. Within the labor force, individuals with college / associate degree education have the highest percentage of unemployment, with 1.8% or 12 of them being unemployed.
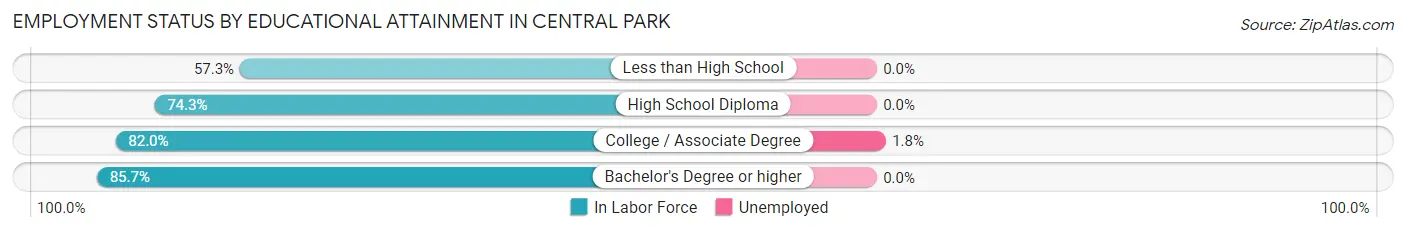
| Educational Attainment | In Labor Force | Unemployed |
| Less than High School | 55 (57.3%) | 0 (0.0%) |
| High School Diploma | 333 (74.3%) | 0 (0.0%) |
| College / Associate Degree | 668 (82.0%) | 15 (1.8%) |
| Bachelor's Degree or higher | 355 (85.7%) | 0 (0.0%) |
| Total | 1,411 (79.6%) | 16 (0.9%) |
Employment Occupations by Sex in Central Park
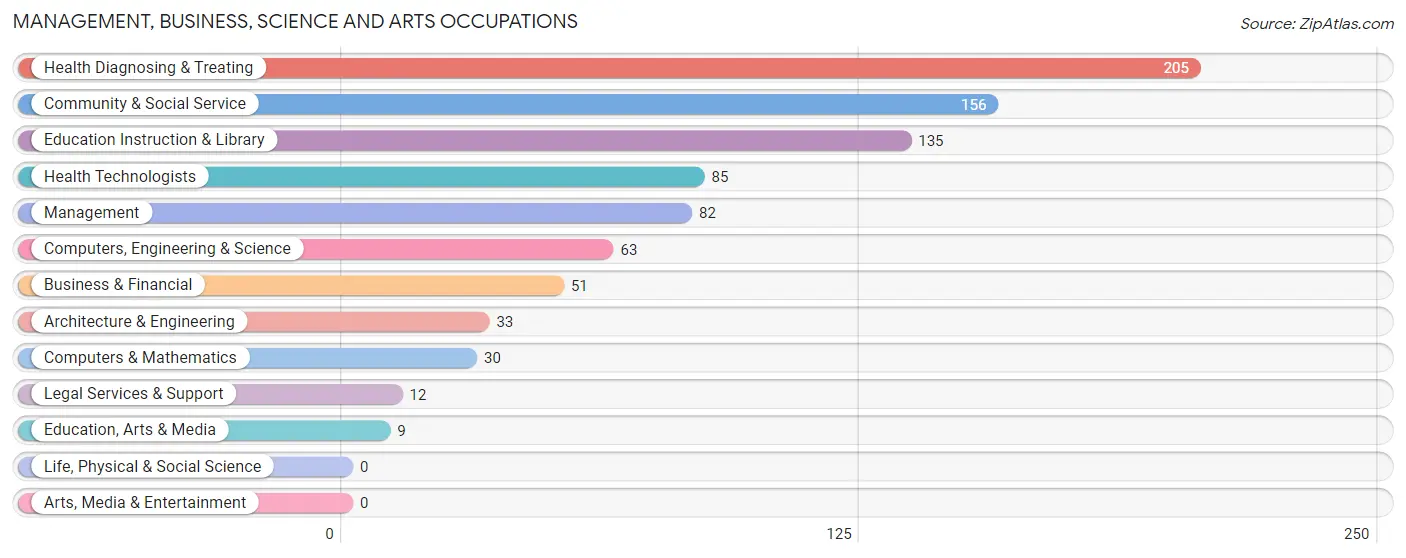
Management, Business, Science and Arts Occupations
The most common Management, Business, Science and Arts occupations in Central Park are Health Diagnosing & Treating (205 | 11.3%), Community & Social Service (156 | 8.6%), Education Instruction & Library (135 | 7.4%), Health Technologists (85 | 4.7%), and Management (82 | 4.5%).
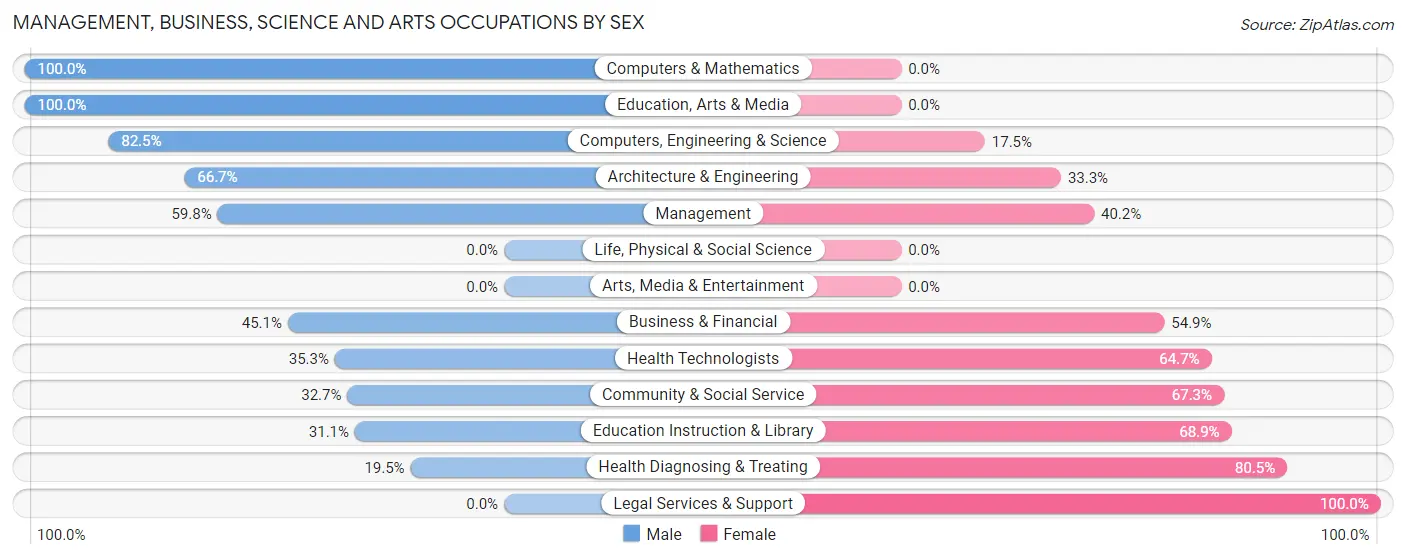
Management, Business, Science and Arts Occupations by Sex
Within the Management, Business, Science and Arts occupations in Central Park, the most male-oriented occupations are Computers & Mathematics (100.0%), Education, Arts & Media (100.0%), and Computers, Engineering & Science (82.5%), while the most female-oriented occupations are Legal Services & Support (100.0%), Health Diagnosing & Treating (80.5%), and Education Instruction & Library (68.9%).
| Occupation | Male | Female |
| Management | 49 (59.8%) | 33 (40.2%) |
| Business & Financial | 23 (45.1%) | 28 (54.9%) |
| Computers, Engineering & Science | 52 (82.5%) | 11 (17.5%) |
| Computers & Mathematics | 30 (100.0%) | 0 (0.0%) |
| Architecture & Engineering | 22 (66.7%) | 11 (33.3%) |
| Life, Physical & Social Science | 0 (0.0%) | 0 (0.0%) |
| Community & Social Service | 51 (32.7%) | 105 (67.3%) |
| Education, Arts & Media | 9 (100.0%) | 0 (0.0%) |
| Legal Services & Support | 0 (0.0%) | 12 (100.0%) |
| Education Instruction & Library | 42 (31.1%) | 93 (68.9%) |
| Arts, Media & Entertainment | 0 (0.0%) | 0 (0.0%) |
| Health Diagnosing & Treating | 40 (19.5%) | 165 (80.5%) |
| Health Technologists | 30 (35.3%) | 55 (64.7%) |
| Total (Category) | 215 (38.6%) | 342 (61.4%) |
| Total (Overall) | 1,054 (57.9%) | 765 (42.1%) |
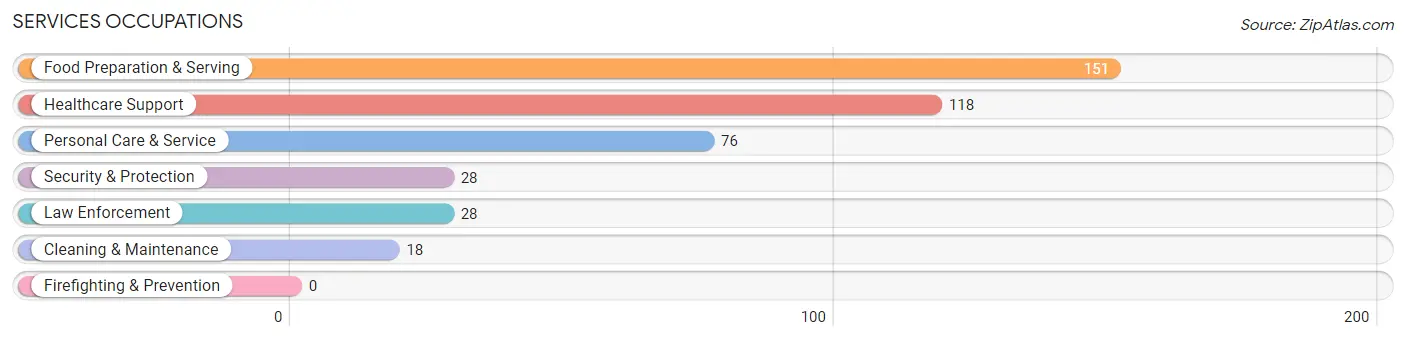
Services Occupations
The most common Services occupations in Central Park are Food Preparation & Serving (151 | 8.3%), Healthcare Support (118 | 6.5%), Personal Care & Service (76 | 4.2%), Security & Protection (28 | 1.5%), and Law Enforcement (28 | 1.5%).
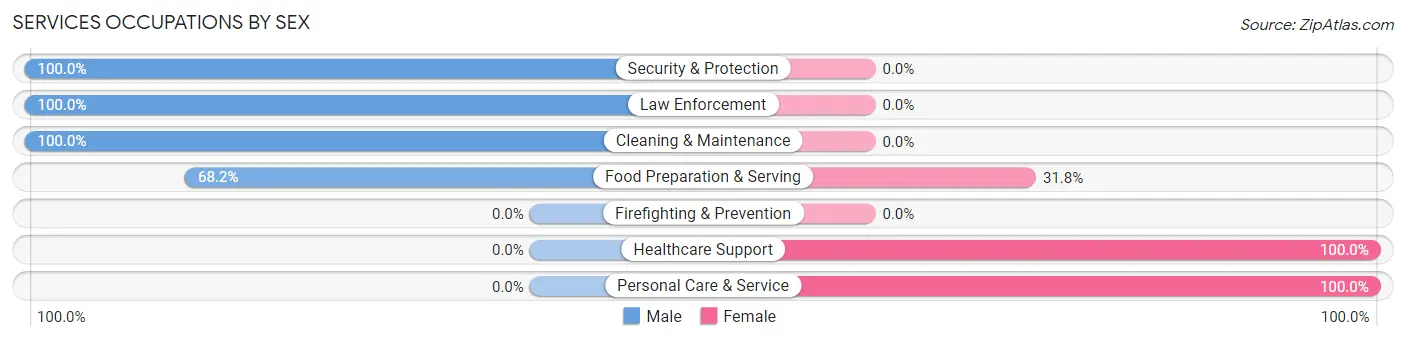
Services Occupations by Sex
Within the Services occupations in Central Park, the most male-oriented occupations are Security & Protection (100.0%), Law Enforcement (100.0%), and Cleaning & Maintenance (100.0%), while the most female-oriented occupations are Healthcare Support (100.0%), Personal Care & Service (100.0%), and Food Preparation & Serving (31.8%).
| Occupation | Male | Female |
| Healthcare Support | 0 (0.0%) | 118 (100.0%) |
| Security & Protection | 28 (100.0%) | 0 (0.0%) |
| Firefighting & Prevention | 0 (0.0%) | 0 (0.0%) |
| Law Enforcement | 28 (100.0%) | 0 (0.0%) |
| Food Preparation & Serving | 103 (68.2%) | 48 (31.8%) |
| Cleaning & Maintenance | 18 (100.0%) | 0 (0.0%) |
| Personal Care & Service | 0 (0.0%) | 76 (100.0%) |
| Total (Category) | 149 (38.1%) | 242 (61.9%) |
| Total (Overall) | 1,054 (57.9%) | 765 (42.1%) |
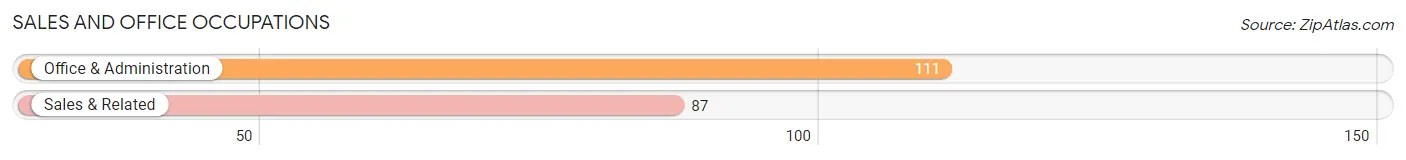
Sales and Office Occupations
The most common Sales and Office occupations in Central Park are Office & Administration (111 | 6.1%), and Sales & Related (87 | 4.8%).
Sales and Office Occupations by Sex
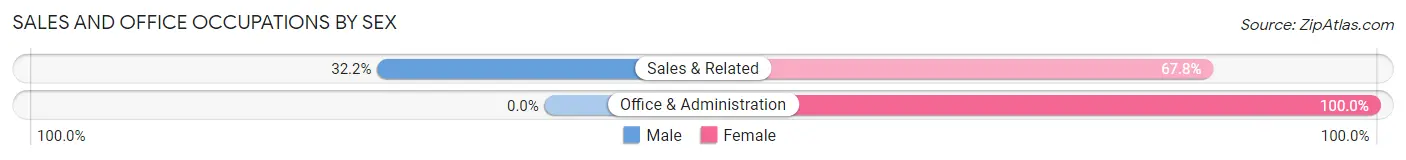
| Occupation | Male | Female |
| Sales & Related | 28 (32.2%) | 59 (67.8%) |
| Office & Administration | 0 (0.0%) | 111 (100.0%) |
| Total (Category) | 28 (14.1%) | 170 (85.9%) |
| Total (Overall) | 1,054 (57.9%) | 765 (42.1%) |
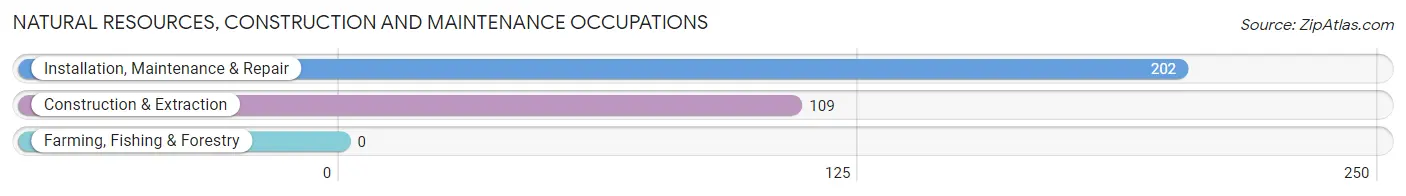
Natural Resources, Construction and Maintenance Occupations
The most common Natural Resources, Construction and Maintenance occupations in Central Park are Installation, Maintenance & Repair (202 | 11.1%), and Construction & Extraction (109 | 6.0%).
Natural Resources, Construction and Maintenance Occupations by Sex
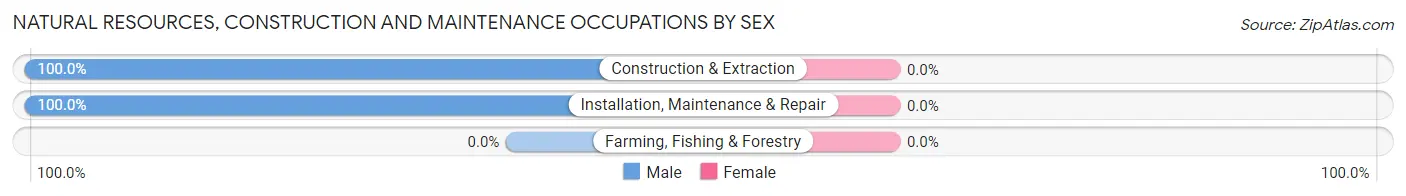
| Occupation | Male | Female |
| Farming, Fishing & Forestry | 0 (0.0%) | 0 (0.0%) |
| Construction & Extraction | 109 (100.0%) | 0 (0.0%) |
| Installation, Maintenance & Repair | 202 (100.0%) | 0 (0.0%) |
| Total (Category) | 311 (100.0%) | 0 (0.0%) |
| Total (Overall) | 1,054 (57.9%) | 765 (42.1%) |
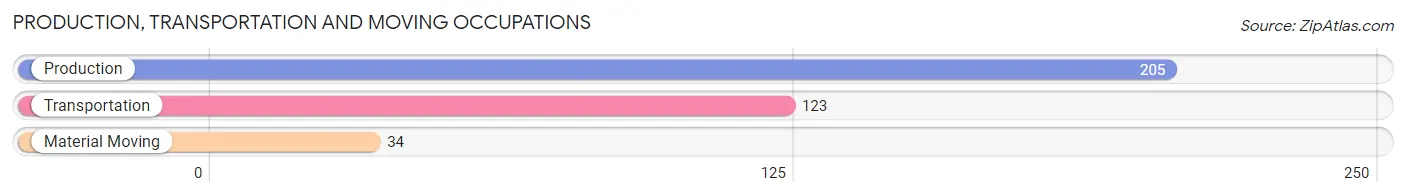
Production, Transportation and Moving Occupations
The most common Production, Transportation and Moving occupations in Central Park are Production (205 | 11.3%), Transportation (123 | 6.8%), and Material Moving (34 | 1.9%).
Production, Transportation and Moving Occupations by Sex
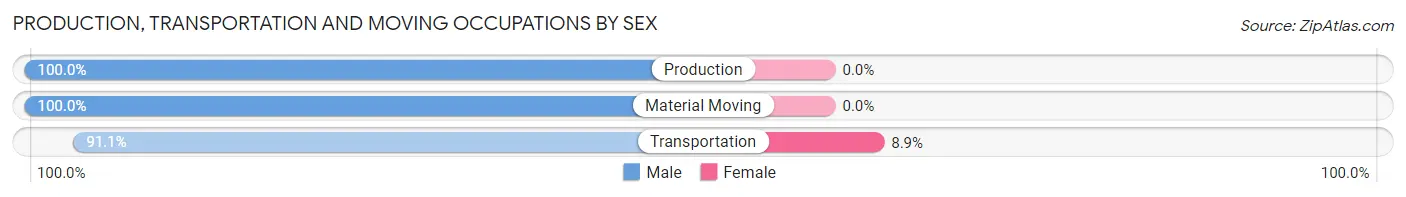
| Occupation | Male | Female |
| Production | 205 (100.0%) | 0 (0.0%) |
| Transportation | 112 (91.1%) | 11 (8.9%) |
| Material Moving | 34 (100.0%) | 0 (0.0%) |
| Total (Category) | 351 (97.0%) | 11 (3.0%) |
| Total (Overall) | 1,054 (57.9%) | 765 (42.1%) |
Employment Industries by Sex in Central Park
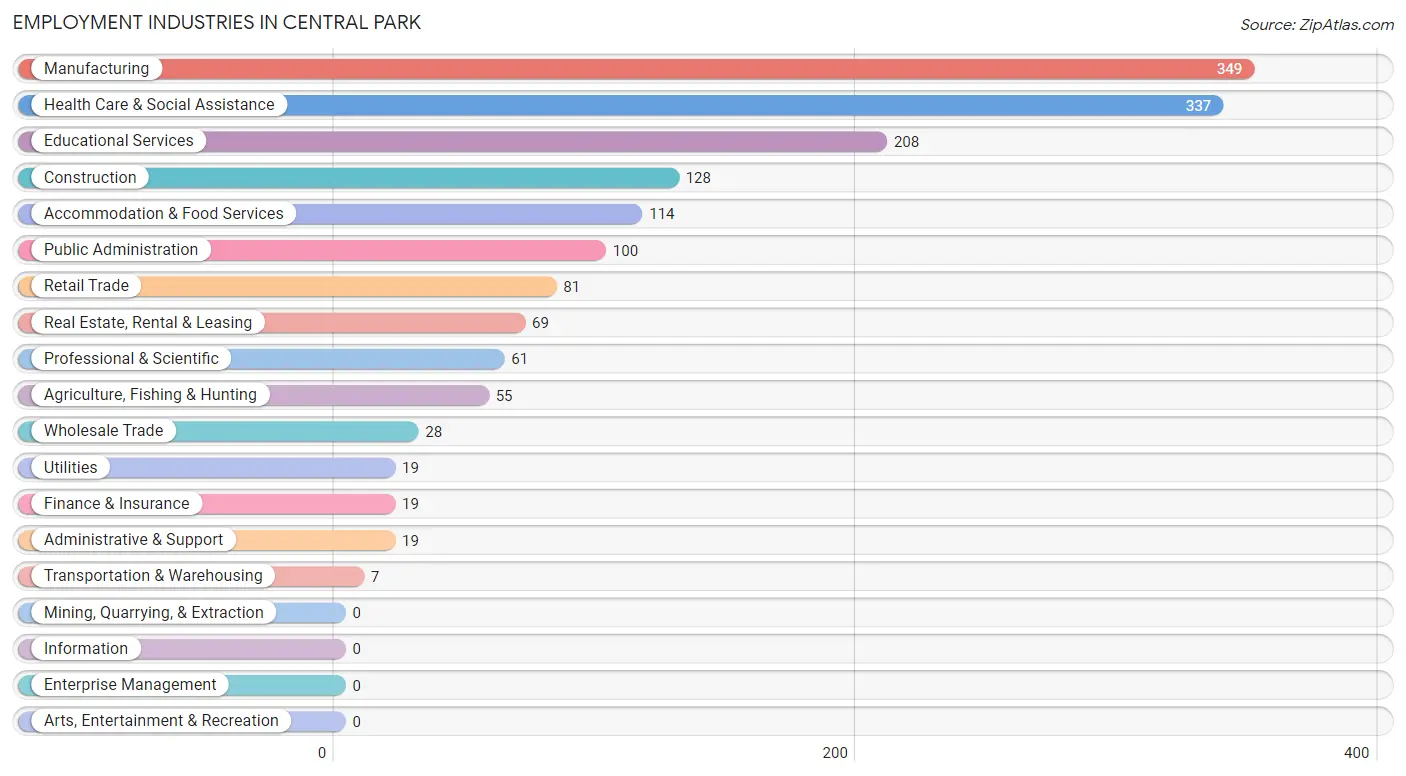
Employment Industries in Central Park
The major employment industries in Central Park include Manufacturing (349 | 19.2%), Health Care & Social Assistance (337 | 18.5%), Educational Services (208 | 11.4%), Construction (128 | 7.0%), and Accommodation & Food Services (114 | 6.3%).
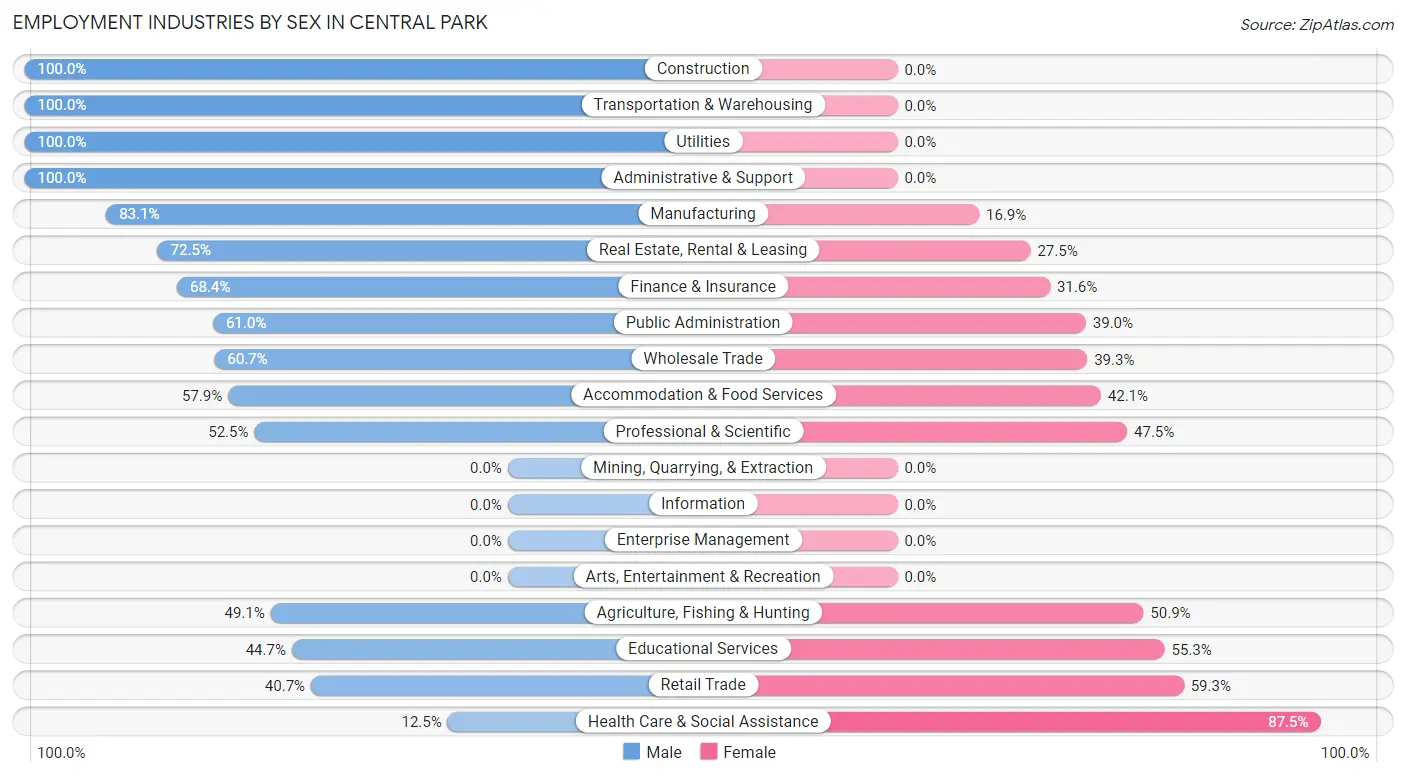
Employment Industries by Sex in Central Park
The Central Park industries that see more men than women are Construction (100.0%), Transportation & Warehousing (100.0%), and Utilities (100.0%), whereas the industries that tend to have a higher number of women are Health Care & Social Assistance (87.5%), Retail Trade (59.3%), and Educational Services (55.3%).
| Industry | Male | Female |
| Agriculture, Fishing & Hunting | 27 (49.1%) | 28 (50.9%) |
| Mining, Quarrying, & Extraction | 0 (0.0%) | 0 (0.0%) |
| Construction | 128 (100.0%) | 0 (0.0%) |
| Manufacturing | 290 (83.1%) | 59 (16.9%) |
| Wholesale Trade | 17 (60.7%) | 11 (39.3%) |
| Retail Trade | 33 (40.7%) | 48 (59.3%) |
| Transportation & Warehousing | 7 (100.0%) | 0 (0.0%) |
| Utilities | 19 (100.0%) | 0 (0.0%) |
| Information | 0 (0.0%) | 0 (0.0%) |
| Finance & Insurance | 13 (68.4%) | 6 (31.6%) |
| Real Estate, Rental & Leasing | 50 (72.5%) | 19 (27.5%) |
| Professional & Scientific | 32 (52.5%) | 29 (47.5%) |
| Enterprise Management | 0 (0.0%) | 0 (0.0%) |
| Administrative & Support | 19 (100.0%) | 0 (0.0%) |
| Educational Services | 93 (44.7%) | 115 (55.3%) |
| Health Care & Social Assistance | 42 (12.5%) | 295 (87.5%) |
| Arts, Entertainment & Recreation | 0 (0.0%) | 0 (0.0%) |
| Accommodation & Food Services | 66 (57.9%) | 48 (42.1%) |
| Public Administration | 61 (61.0%) | 39 (39.0%) |
| Total | 1,054 (57.9%) | 765 (42.1%) |
Education in Central Park
School Enrollment in Central Park
The most common levels of schooling among the 733 students in Central Park are middle school (259 | 35.3%), elementary school (225 | 30.7%), and high school (164 | 22.4%).
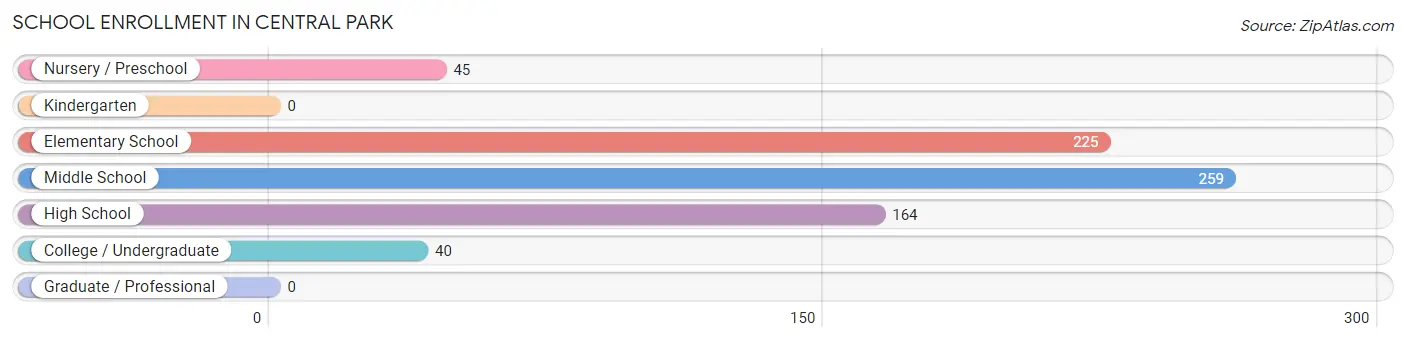
| School Level | # Students | % Students |
| Nursery / Preschool | 45 | 6.1% |
| Kindergarten | 0 | 0.0% |
| Elementary School | 225 | 30.7% |
| Middle School | 259 | 35.3% |
| High School | 164 | 22.4% |
| College / Undergraduate | 40 | 5.5% |
| Graduate / Professional | 0 | 0.0% |
| Total | 733 | 100.0% |
School Enrollment by Age by Funding Source in Central Park
Out of a total of 733 students who are enrolled in schools in Central Park, 54 (7.4%) attend a private institution, while the remaining 679 (92.6%) are enrolled in public schools. The age group of 3 to 4 year olds has the highest likelihood of being enrolled in private schools, with 36 (80.0% in the age bracket) enrolled. Conversely, the age group of 15 to 17 year olds has the lowest likelihood of being enrolled in a private school, with 60 (100.0% in the age bracket) attending a public institution.
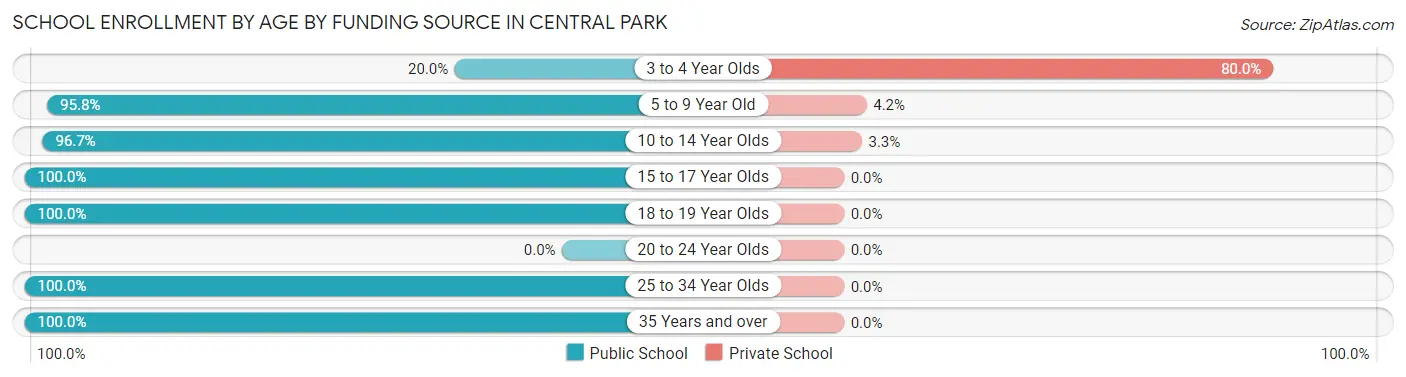
| Age Bracket | Public School | Private School |
| 3 to 4 Year Olds | 9 (20.0%) | 36 (80.0%) |
| 5 to 9 Year Old | 205 (95.8%) | 9 (4.2%) |
| 10 to 14 Year Olds | 261 (96.7%) | 9 (3.3%) |
| 15 to 17 Year Olds | 60 (100.0%) | 0 (0.0%) |
| 18 to 19 Year Olds | 121 (100.0%) | 0 (0.0%) |
| 20 to 24 Year Olds | 0 (0.0%) | 0 (0.0%) |
| 25 to 34 Year Olds | 8 (100.0%) | 0 (0.0%) |
| 35 Years and over | 15 (100.0%) | 0 (0.0%) |
| Total | 679 (92.6%) | 54 (7.4%) |
Educational Attainment by Field of Study in Central Park
Science & technology (113 | 19.1%), education (93 | 15.7%), social sciences (88 | 14.8%), bio, nature & agricultural (80 | 13.5%), and engineering (59 | 10.0%) are the most common fields of study among 593 individuals in Central Park who have obtained a bachelor's degree or higher.
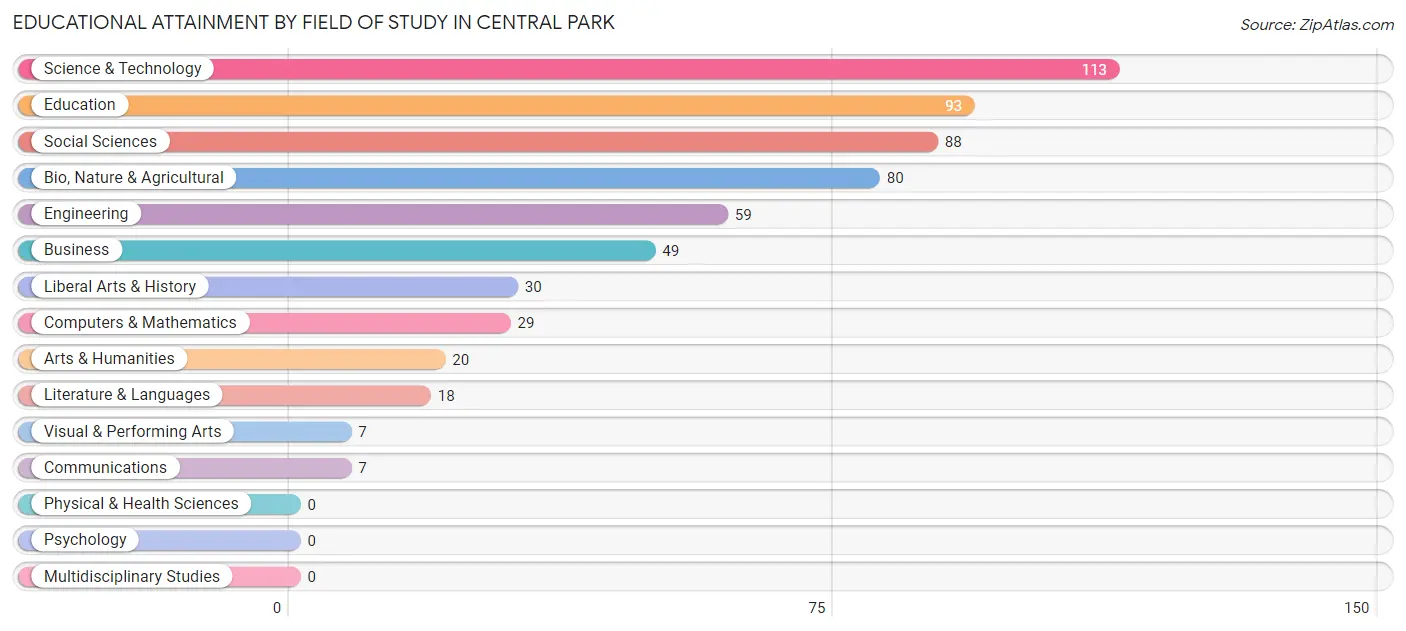
| Field of Study | # Graduates | % Graduates |
| Computers & Mathematics | 29 | 4.9% |
| Bio, Nature & Agricultural | 80 | 13.5% |
| Physical & Health Sciences | 0 | 0.0% |
| Psychology | 0 | 0.0% |
| Social Sciences | 88 | 14.8% |
| Engineering | 59 | 10.0% |
| Multidisciplinary Studies | 0 | 0.0% |
| Science & Technology | 113 | 19.1% |
| Business | 49 | 8.3% |
| Education | 93 | 15.7% |
| Literature & Languages | 18 | 3.0% |
| Liberal Arts & History | 30 | 5.1% |
| Visual & Performing Arts | 7 | 1.2% |
| Communications | 7 | 1.2% |
| Arts & Humanities | 20 | 3.4% |
| Total | 593 | 100.0% |
Transportation & Commute in Central Park
Vehicle Availability by Sex in Central Park
The most prevalent vehicle ownership categories in Central Park are males with 3 vehicles (403, accounting for 38.9%) and females with 3 vehicles (317, making up 52.7%).
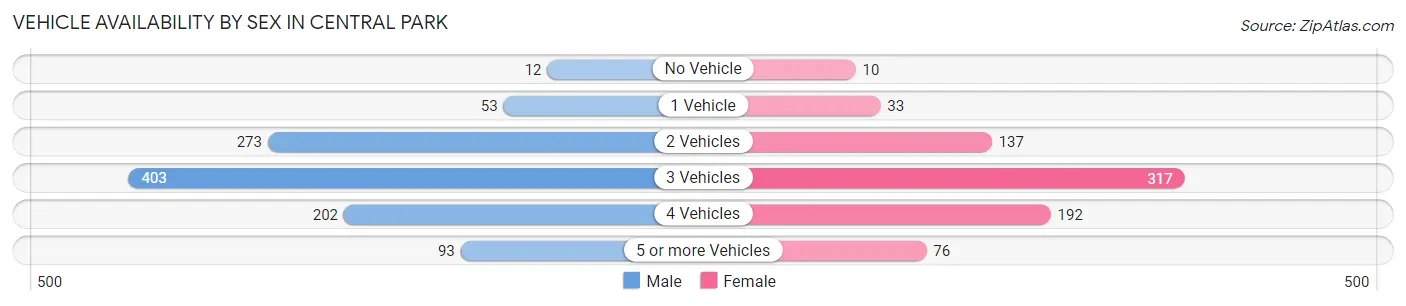
| Vehicles Available | Male | Female |
| No Vehicle | 12 (1.2%) | 10 (1.3%) |
| 1 Vehicle | 53 (5.1%) | 33 (4.3%) |
| 2 Vehicles | 273 (26.4%) | 137 (17.9%) |
| 3 Vehicles | 403 (38.9%) | 317 (41.4%) |
| 4 Vehicles | 202 (19.5%) | 192 (25.1%) |
| 5 or more Vehicles | 93 (9.0%) | 76 (9.9%) |
| Total | 1,036 (100.0%) | 765 (100.0%) |
Commute Time in Central Park
The most frequently occuring commute durations in Central Park are 15 to 19 minutes (619 commuters, 37.3%), 10 to 14 minutes (212 commuters, 12.8%), and 20 to 24 minutes (208 commuters, 12.5%).
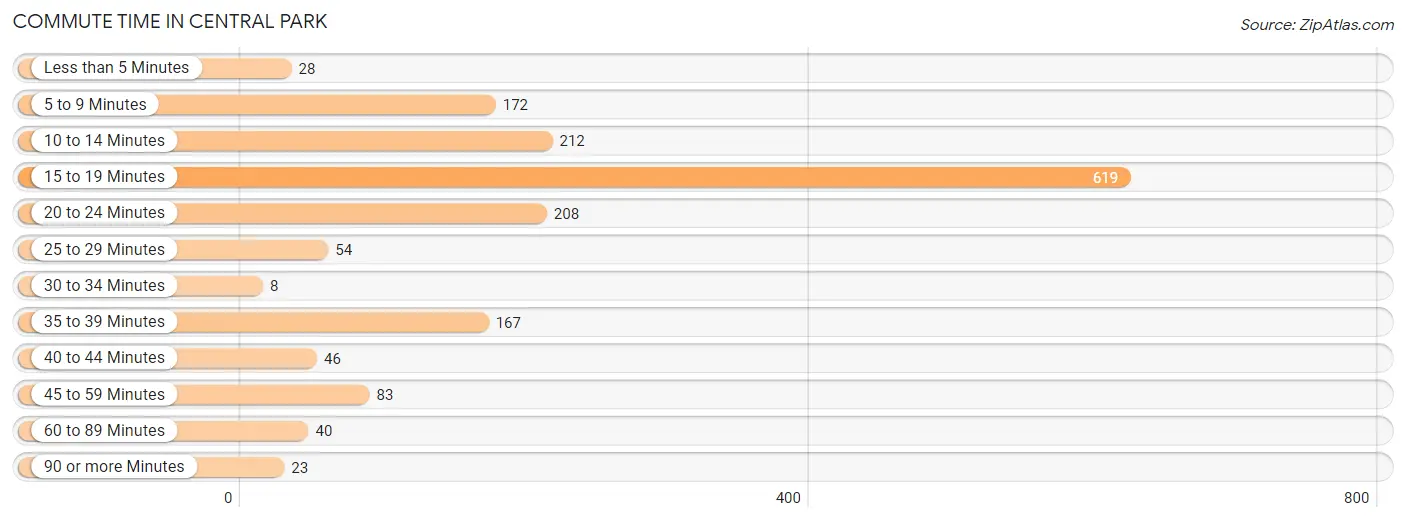
| Commute Time | # Commuters | % Commuters |
| Less than 5 Minutes | 28 | 1.7% |
| 5 to 9 Minutes | 172 | 10.4% |
| 10 to 14 Minutes | 212 | 12.8% |
| 15 to 19 Minutes | 619 | 37.3% |
| 20 to 24 Minutes | 208 | 12.5% |
| 25 to 29 Minutes | 54 | 3.3% |
| 30 to 34 Minutes | 8 | 0.5% |
| 35 to 39 Minutes | 167 | 10.1% |
| 40 to 44 Minutes | 46 | 2.8% |
| 45 to 59 Minutes | 83 | 5.0% |
| 60 to 89 Minutes | 40 | 2.4% |
| 90 or more Minutes | 23 | 1.4% |
Commute Time by Sex in Central Park
The most common commute times in Central Park are 15 to 19 minutes (385 commuters, 41.6%) for males and 15 to 19 minutes (234 commuters, 31.9%) for females.
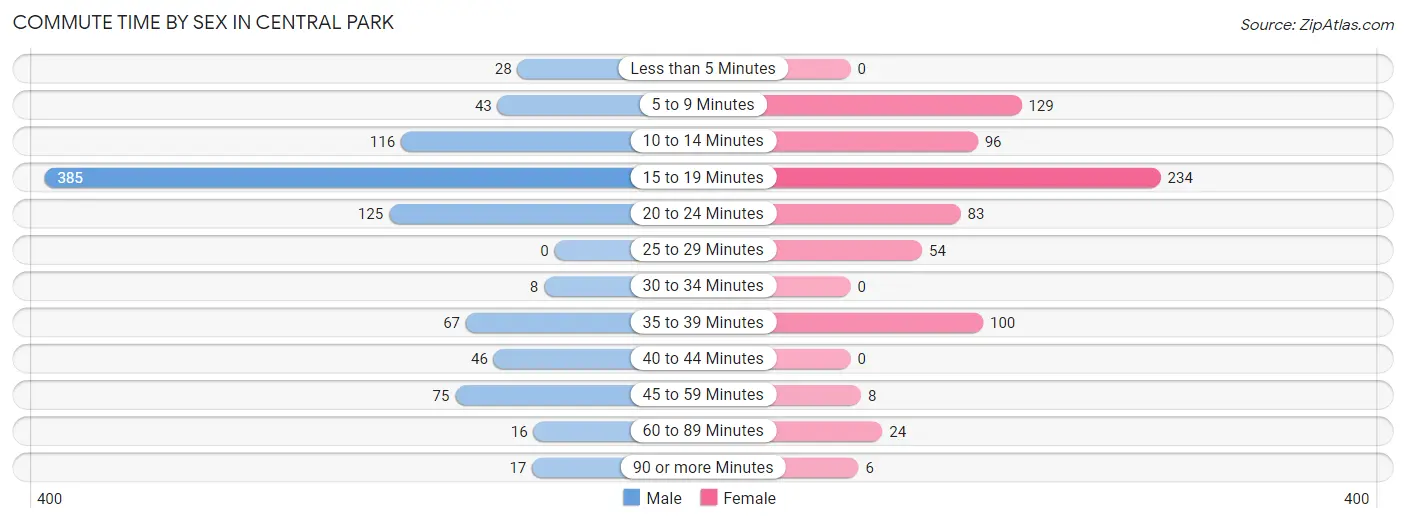
| Commute Time | Male | Female |
| Less than 5 Minutes | 28 (3.0%) | 0 (0.0%) |
| 5 to 9 Minutes | 43 (4.6%) | 129 (17.6%) |
| 10 to 14 Minutes | 116 (12.5%) | 96 (13.1%) |
| 15 to 19 Minutes | 385 (41.6%) | 234 (31.9%) |
| 20 to 24 Minutes | 125 (13.5%) | 83 (11.3%) |
| 25 to 29 Minutes | 0 (0.0%) | 54 (7.4%) |
| 30 to 34 Minutes | 8 (0.9%) | 0 (0.0%) |
| 35 to 39 Minutes | 67 (7.2%) | 100 (13.6%) |
| 40 to 44 Minutes | 46 (5.0%) | 0 (0.0%) |
| 45 to 59 Minutes | 75 (8.1%) | 8 (1.1%) |
| 60 to 89 Minutes | 16 (1.7%) | 24 (3.3%) |
| 90 or more Minutes | 17 (1.8%) | 6 (0.8%) |
Time of Departure to Work by Sex in Central Park
The most frequent times of departure to work in Central Park are 6:00 AM to 6:29 AM (272, 29.4%) for males and 7:00 AM to 7:29 AM (161, 21.9%) for females.
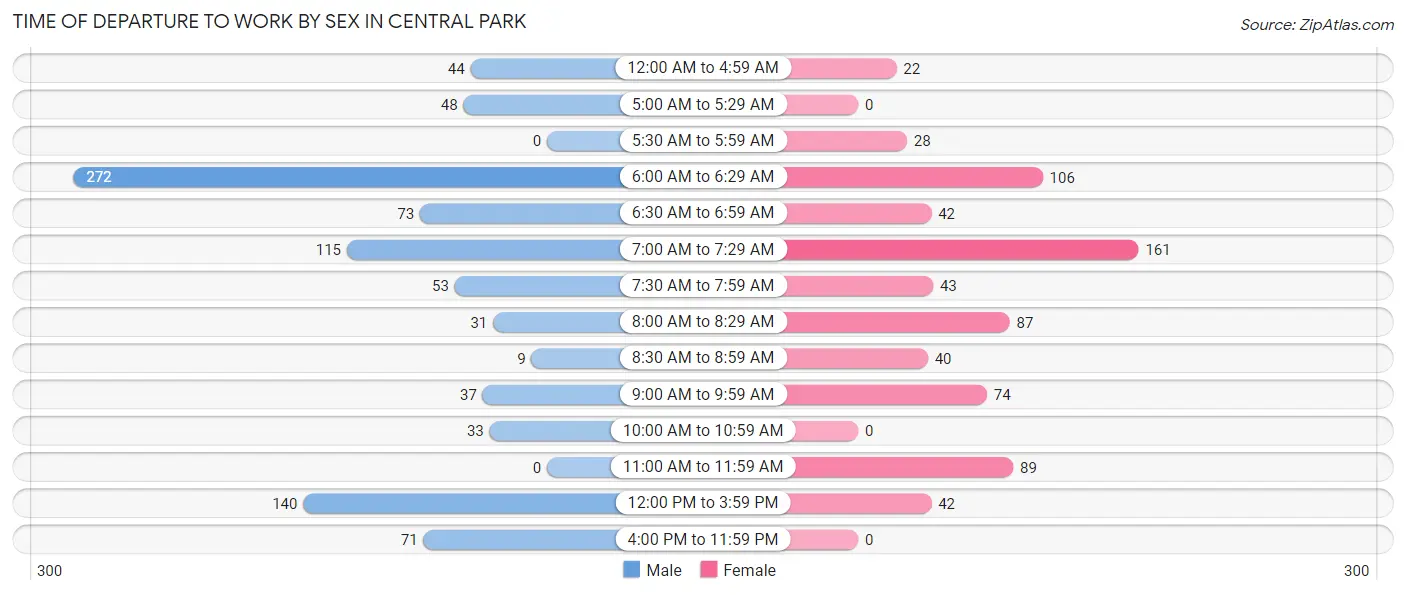
| Time of Departure | Male | Female |
| 12:00 AM to 4:59 AM | 44 (4.8%) | 22 (3.0%) |
| 5:00 AM to 5:29 AM | 48 (5.2%) | 0 (0.0%) |
| 5:30 AM to 5:59 AM | 0 (0.0%) | 28 (3.8%) |
| 6:00 AM to 6:29 AM | 272 (29.4%) | 106 (14.4%) |
| 6:30 AM to 6:59 AM | 73 (7.9%) | 42 (5.7%) |
| 7:00 AM to 7:29 AM | 115 (12.4%) | 161 (21.9%) |
| 7:30 AM to 7:59 AM | 53 (5.7%) | 43 (5.9%) |
| 8:00 AM to 8:29 AM | 31 (3.4%) | 87 (11.8%) |
| 8:30 AM to 8:59 AM | 9 (1.0%) | 40 (5.4%) |
| 9:00 AM to 9:59 AM | 37 (4.0%) | 74 (10.1%) |
| 10:00 AM to 10:59 AM | 33 (3.6%) | 0 (0.0%) |
| 11:00 AM to 11:59 AM | 0 (0.0%) | 89 (12.1%) |
| 12:00 PM to 3:59 PM | 140 (15.1%) | 42 (5.7%) |
| 4:00 PM to 11:59 PM | 71 (7.7%) | 0 (0.0%) |
| Total | 926 (100.0%) | 734 (100.0%) |
Housing Occupancy in Central Park
Occupancy by Ownership in Central Park
Of the total 1,316 dwellings in Central Park, owner-occupied units account for 1,107 (84.1%), while renter-occupied units make up 209 (15.9%).
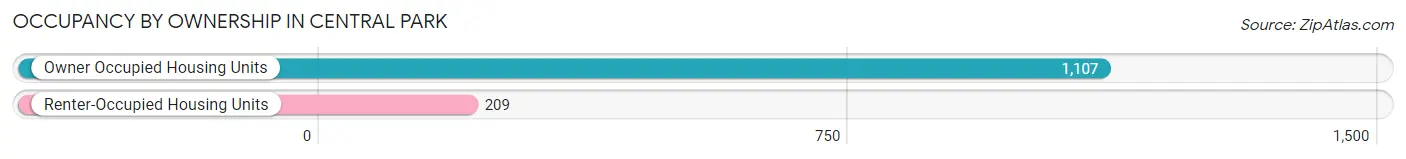
| Occupancy | # Housing Units | % Housing Units |
| Owner Occupied Housing Units | 1,107 | 84.1% |
| Renter-Occupied Housing Units | 209 | 15.9% |
| Total Occupied Housing Units | 1,316 | 100.0% |
Occupancy by Household Size in Central Park
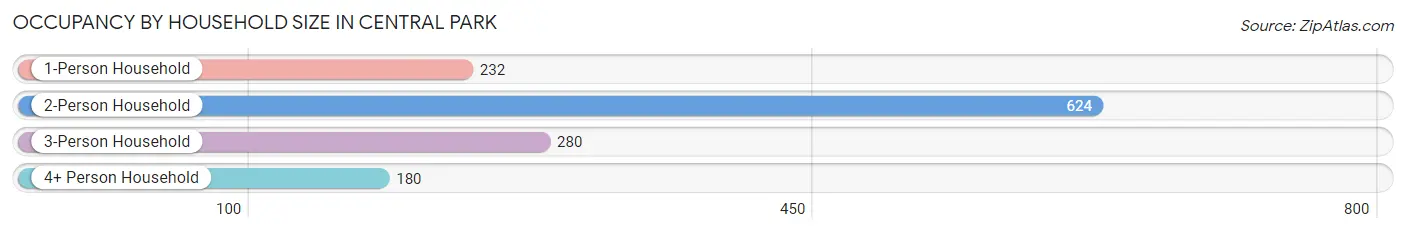
| Household Size | # Housing Units | % Housing Units |
| 1-Person Household | 232 | 17.6% |
| 2-Person Household | 624 | 47.4% |
| 3-Person Household | 280 | 21.3% |
| 4+ Person Household | 180 | 13.7% |
| Total Housing Units | 1,316 | 100.0% |
Occupancy by Ownership by Household Size in Central Park
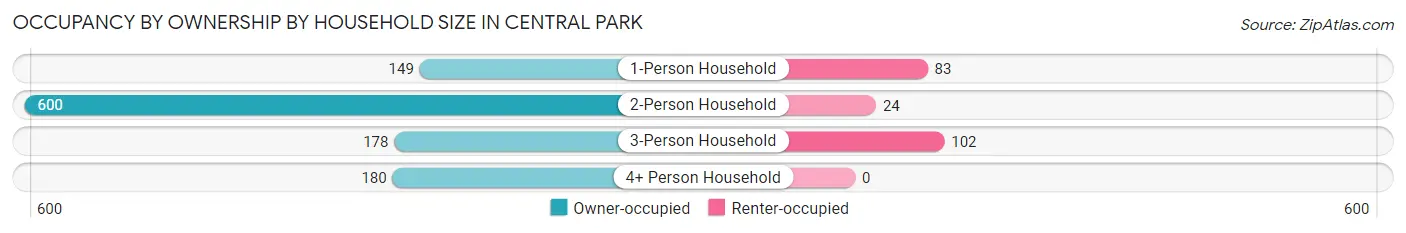
| Household Size | Owner-occupied | Renter-occupied |
| 1-Person Household | 149 (64.2%) | 83 (35.8%) |
| 2-Person Household | 600 (96.2%) | 24 (3.8%) |
| 3-Person Household | 178 (63.6%) | 102 (36.4%) |
| 4+ Person Household | 180 (100.0%) | 0 (0.0%) |
| Total Housing Units | 1,107 (84.1%) | 209 (15.9%) |
Occupancy by Educational Attainment in Central Park
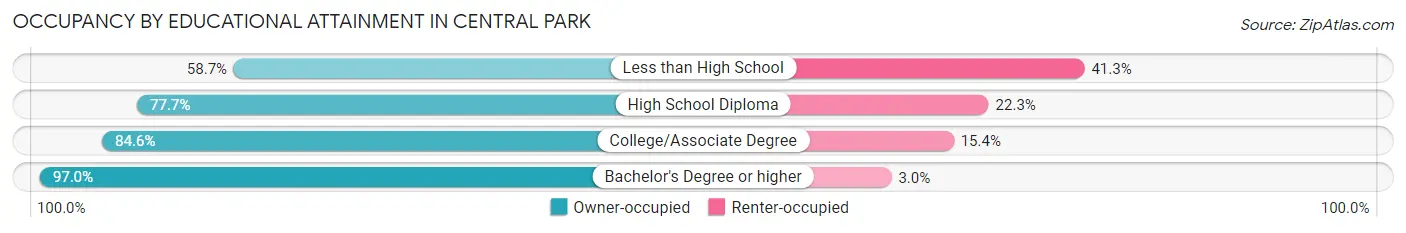
| Household Size | Owner-occupied | Renter-occupied |
| Less than High School | 27 (58.7%) | 19 (41.3%) |
| High School Diploma | 352 (77.7%) | 101 (22.3%) |
| College/Associate Degree | 440 (84.6%) | 80 (15.4%) |
| Bachelor's Degree or higher | 288 (97.0%) | 9 (3.0%) |
Occupancy by Age of Householder in Central Park
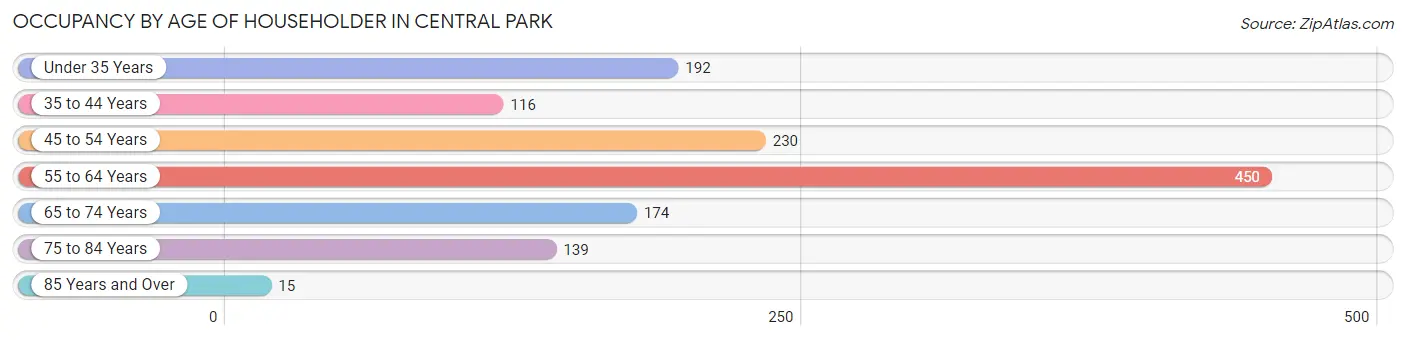
| Age Bracket | # Households | % Households |
| Under 35 Years | 192 | 14.6% |
| 35 to 44 Years | 116 | 8.8% |
| 45 to 54 Years | 230 | 17.5% |
| 55 to 64 Years | 450 | 34.2% |
| 65 to 74 Years | 174 | 13.2% |
| 75 to 84 Years | 139 | 10.6% |
| 85 Years and Over | 15 | 1.1% |
| Total | 1,316 | 100.0% |
Housing Finances in Central Park
Median Income by Occupancy in Central Park
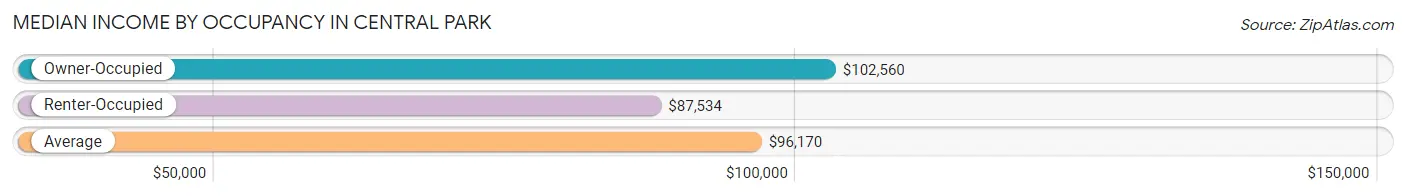
| Occupancy Type | # Households | Median Income |
| Owner-Occupied | 1,107 (84.1%) | $102,560 |
| Renter-Occupied | 209 (15.9%) | $87,534 |
| Average | 1,316 (100.0%) | $96,170 |
Occupancy by Householder Income Bracket in Central Park
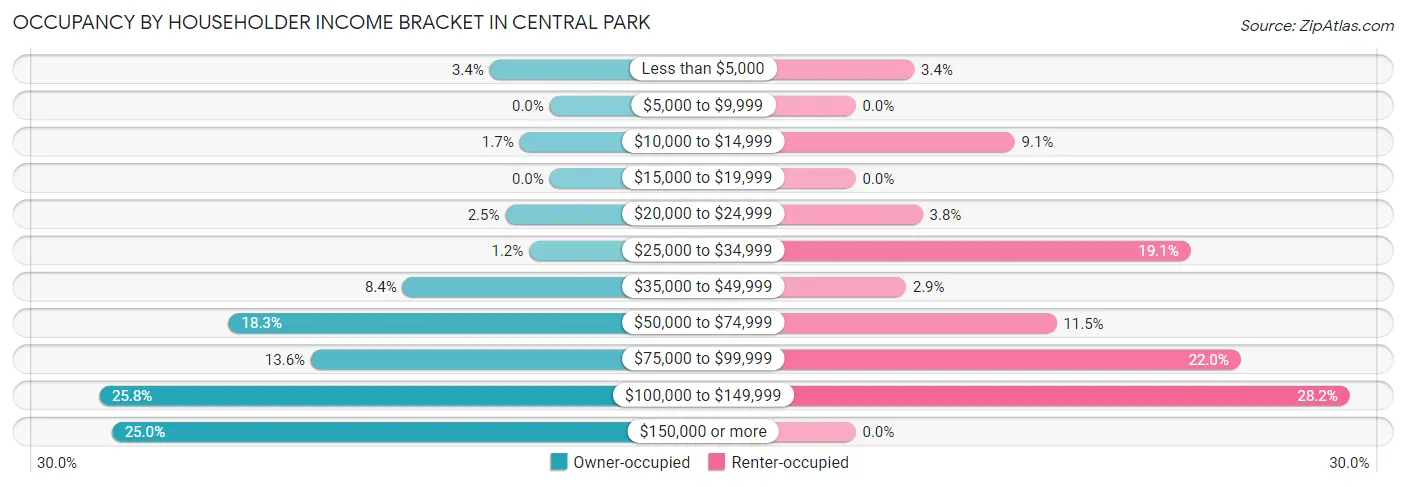
| Income Bracket | Owner-occupied | Renter-occupied |
| Less than $5,000 | 38 (3.4%) | 7 (3.4%) |
| $5,000 to $9,999 | 0 (0.0%) | 0 (0.0%) |
| $10,000 to $14,999 | 19 (1.7%) | 19 (9.1%) |
| $15,000 to $19,999 | 0 (0.0%) | 0 (0.0%) |
| $20,000 to $24,999 | 28 (2.5%) | 8 (3.8%) |
| $25,000 to $34,999 | 13 (1.2%) | 40 (19.1%) |
| $35,000 to $49,999 | 93 (8.4%) | 6 (2.9%) |
| $50,000 to $74,999 | 203 (18.3%) | 24 (11.5%) |
| $75,000 to $99,999 | 151 (13.6%) | 46 (22.0%) |
| $100,000 to $149,999 | 285 (25.8%) | 59 (28.2%) |
| $150,000 or more | 277 (25.0%) | 0 (0.0%) |
| Total | 1,107 (100.0%) | 209 (100.0%) |
Monthly Housing Cost Tiers in Central Park
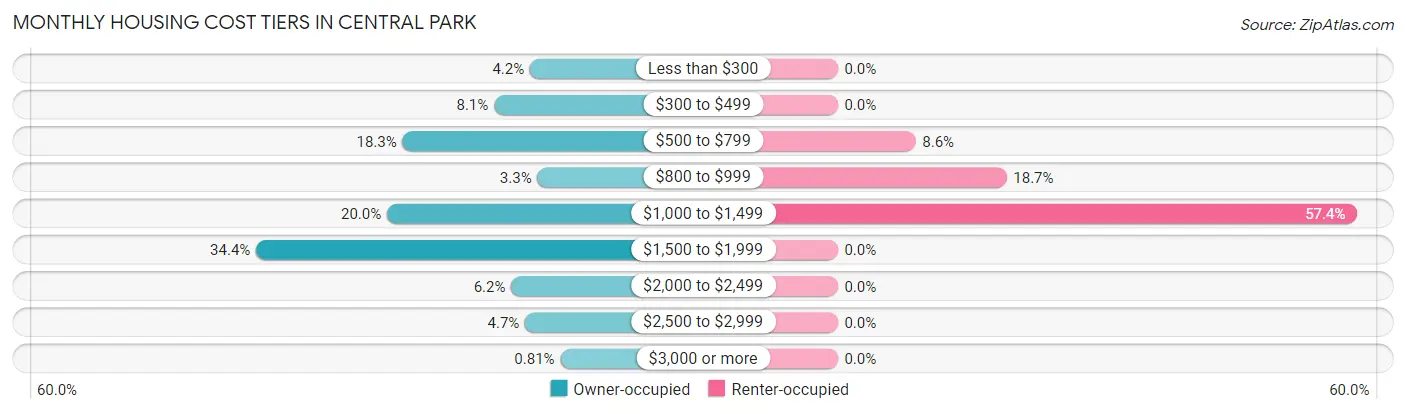
| Monthly Cost | Owner-occupied | Renter-occupied |
| Less than $300 | 46 (4.2%) | 0 (0.0%) |
| $300 to $499 | 90 (8.1%) | 0 (0.0%) |
| $500 to $799 | 202 (18.2%) | 18 (8.6%) |
| $800 to $999 | 37 (3.3%) | 39 (18.7%) |
| $1,000 to $1,499 | 221 (20.0%) | 120 (57.4%) |
| $1,500 to $1,999 | 381 (34.4%) | 0 (0.0%) |
| $2,000 to $2,499 | 69 (6.2%) | 0 (0.0%) |
| $2,500 to $2,999 | 52 (4.7%) | 0 (0.0%) |
| $3,000 or more | 9 (0.8%) | 0 (0.0%) |
| Total | 1,107 (100.0%) | 209 (100.0%) |
Physical Housing Characteristics in Central Park
Housing Structures in Central Park
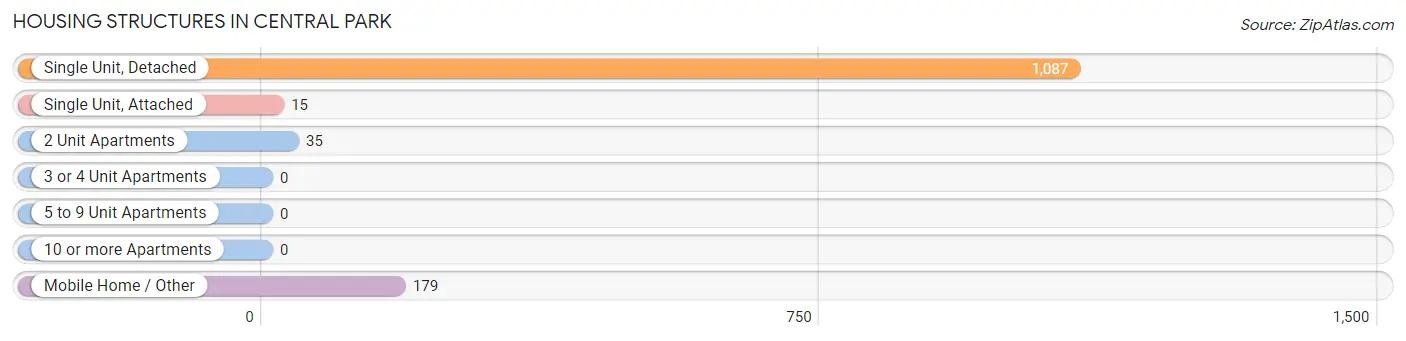
| Structure Type | # Housing Units | % Housing Units |
| Single Unit, Detached | 1,087 | 82.6% |
| Single Unit, Attached | 15 | 1.1% |
| 2 Unit Apartments | 35 | 2.7% |
| 3 or 4 Unit Apartments | 0 | 0.0% |
| 5 to 9 Unit Apartments | 0 | 0.0% |
| 10 or more Apartments | 0 | 0.0% |
| Mobile Home / Other | 179 | 13.6% |
| Total | 1,316 | 100.0% |
Housing Structures by Occupancy in Central Park
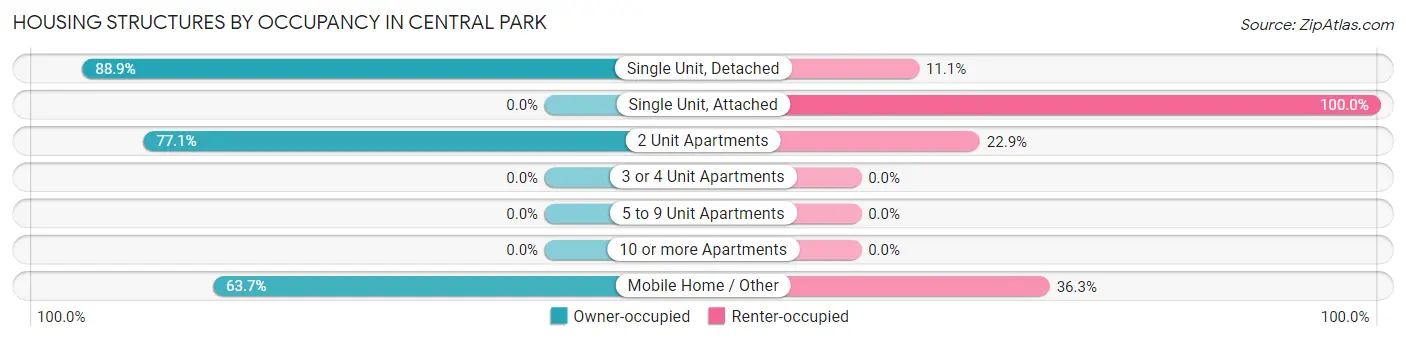
| Structure Type | Owner-occupied | Renter-occupied |
| Single Unit, Detached | 966 (88.9%) | 121 (11.1%) |
| Single Unit, Attached | 0 (0.0%) | 15 (100.0%) |
| 2 Unit Apartments | 27 (77.1%) | 8 (22.9%) |
| 3 or 4 Unit Apartments | 0 (0.0%) | 0 (0.0%) |
| 5 to 9 Unit Apartments | 0 (0.0%) | 0 (0.0%) |
| 10 or more Apartments | 0 (0.0%) | 0 (0.0%) |
| Mobile Home / Other | 114 (63.7%) | 65 (36.3%) |
| Total | 1,107 (84.1%) | 209 (15.9%) |
Housing Structures by Number of Rooms in Central Park
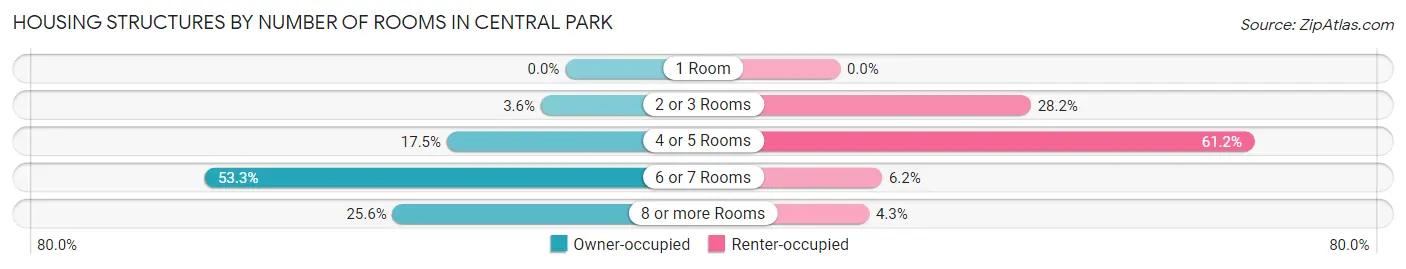
| Number of Rooms | Owner-occupied | Renter-occupied |
| 1 Room | 0 (0.0%) | 0 (0.0%) |
| 2 or 3 Rooms | 40 (3.6%) | 59 (28.2%) |
| 4 or 5 Rooms | 194 (17.5%) | 128 (61.2%) |
| 6 or 7 Rooms | 590 (53.3%) | 13 (6.2%) |
| 8 or more Rooms | 283 (25.6%) | 9 (4.3%) |
| Total | 1,107 (100.0%) | 209 (100.0%) |
Housing Structure by Heating Type in Central Park
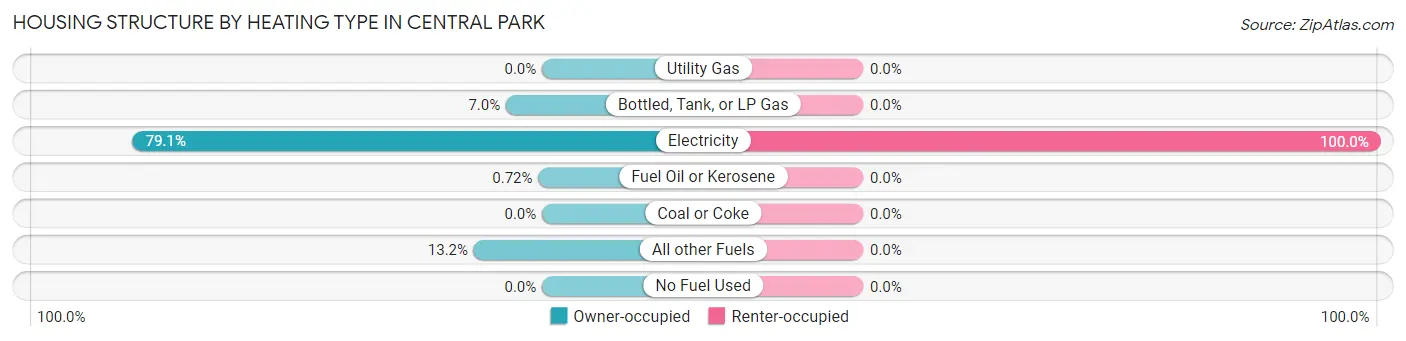
| Heating Type | Owner-occupied | Renter-occupied |
| Utility Gas | 0 (0.0%) | 0 (0.0%) |
| Bottled, Tank, or LP Gas | 77 (7.0%) | 0 (0.0%) |
| Electricity | 876 (79.1%) | 209 (100.0%) |
| Fuel Oil or Kerosene | 8 (0.7%) | 0 (0.0%) |
| Coal or Coke | 0 (0.0%) | 0 (0.0%) |
| All other Fuels | 146 (13.2%) | 0 (0.0%) |
| No Fuel Used | 0 (0.0%) | 0 (0.0%) |
| Total | 1,107 (100.0%) | 209 (100.0%) |
Household Vehicle Usage in Central Park
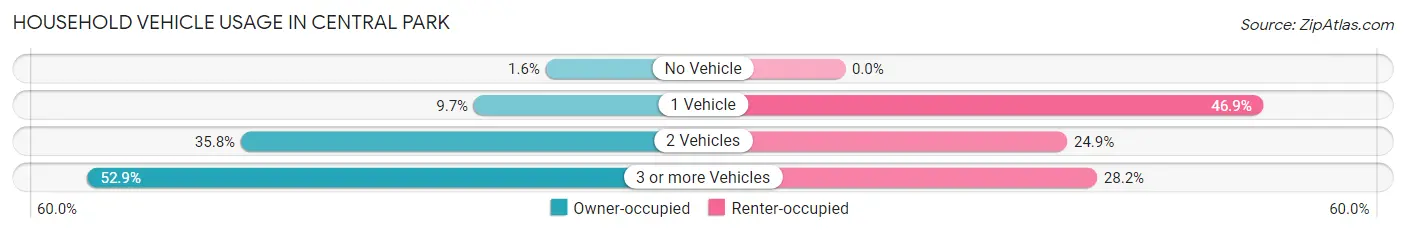
| Vehicles per Household | Owner-occupied | Renter-occupied |
| No Vehicle | 18 (1.6%) | 0 (0.0%) |
| 1 Vehicle | 107 (9.7%) | 98 (46.9%) |
| 2 Vehicles | 396 (35.8%) | 52 (24.9%) |
| 3 or more Vehicles | 586 (52.9%) | 59 (28.2%) |
| Total | 1,107 (100.0%) | 209 (100.0%) |
Real Estate & Mortgages in Central Park
Real Estate and Mortgage Overview in Central Park
| Characteristic | Without Mortgage | With Mortgage |
| Housing Units | 380 | 727 |
| Median Property Value | $291,000 | $308,200 |
| Median Household Income | $70,938 | $232 |
| Monthly Housing Costs | $588 | $9 |
| Real Estate Taxes | $2,836 | $21 |
Property Value by Mortgage Status in Central Park
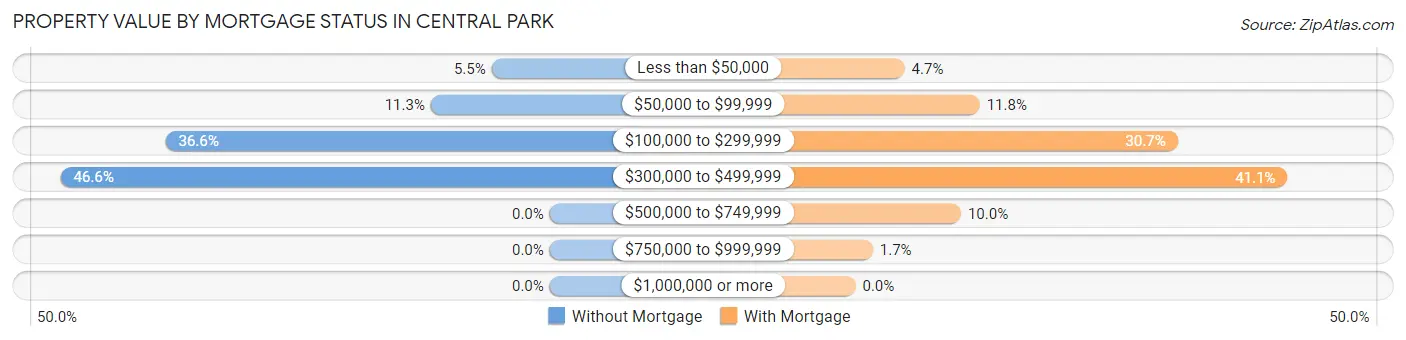
| Property Value | Without Mortgage | With Mortgage |
| Less than $50,000 | 21 (5.5%) | 34 (4.7%) |
| $50,000 to $99,999 | 43 (11.3%) | 86 (11.8%) |
| $100,000 to $299,999 | 139 (36.6%) | 223 (30.7%) |
| $300,000 to $499,999 | 177 (46.6%) | 299 (41.1%) |
| $500,000 to $749,999 | 0 (0.0%) | 73 (10.0%) |
| $750,000 to $999,999 | 0 (0.0%) | 12 (1.7%) |
| $1,000,000 or more | 0 (0.0%) | 0 (0.0%) |
| Total | 380 (100.0%) | 727 (100.0%) |
Household Income by Mortgage Status in Central Park
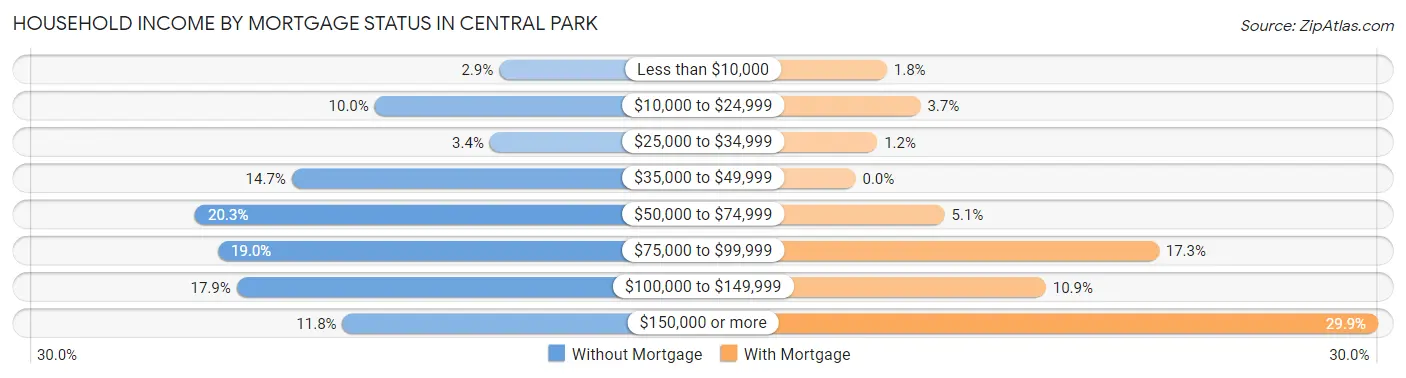
| Household Income | Without Mortgage | With Mortgage |
| Less than $10,000 | 11 (2.9%) | 13 (1.8%) |
| $10,000 to $24,999 | 38 (10.0%) | 27 (3.7%) |
| $25,000 to $34,999 | 13 (3.4%) | 9 (1.2%) |
| $35,000 to $49,999 | 56 (14.7%) | 0 (0.0%) |
| $50,000 to $74,999 | 77 (20.3%) | 37 (5.1%) |
| $75,000 to $99,999 | 72 (19.0%) | 126 (17.3%) |
| $100,000 to $149,999 | 68 (17.9%) | 79 (10.9%) |
| $150,000 or more | 45 (11.8%) | 217 (29.8%) |
| Total | 380 (100.0%) | 727 (100.0%) |
Property Value to Household Income Ratio in Central Park
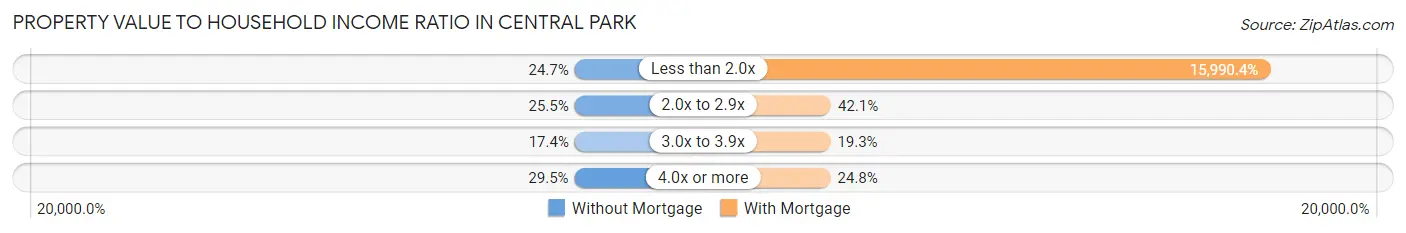
| Value-to-Income Ratio | Without Mortgage | With Mortgage |
| Less than 2.0x | 94 (24.7%) | 116,250 (15,990.4%) |
| 2.0x to 2.9x | 97 (25.5%) | 306 (42.1%) |
| 3.0x to 3.9x | 66 (17.4%) | 140 (19.3%) |
| 4.0x or more | 112 (29.5%) | 180 (24.8%) |
| Total | 380 (100.0%) | 727 (100.0%) |
Real Estate Taxes by Mortgage Status in Central Park
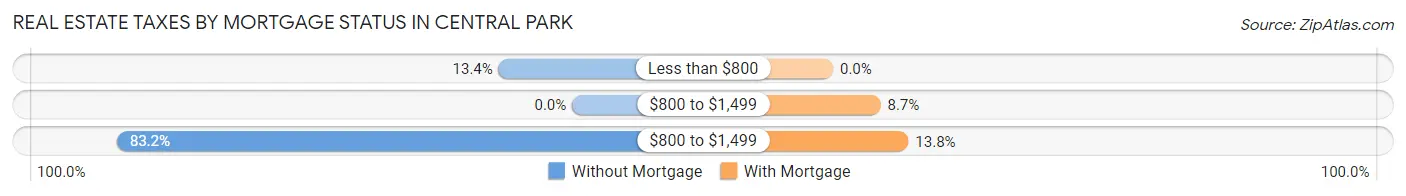
| Property Taxes | Without Mortgage | With Mortgage |
| Less than $800 | 51 (13.4%) | 0 (0.0%) |
| $800 to $1,499 | 0 (0.0%) | 63 (8.7%) |
| $800 to $1,499 | 316 (83.2%) | 100 (13.8%) |
| Total | 380 (100.0%) | 727 (100.0%) |
Health & Disability in Central Park
Health Insurance Coverage by Age in Central Park
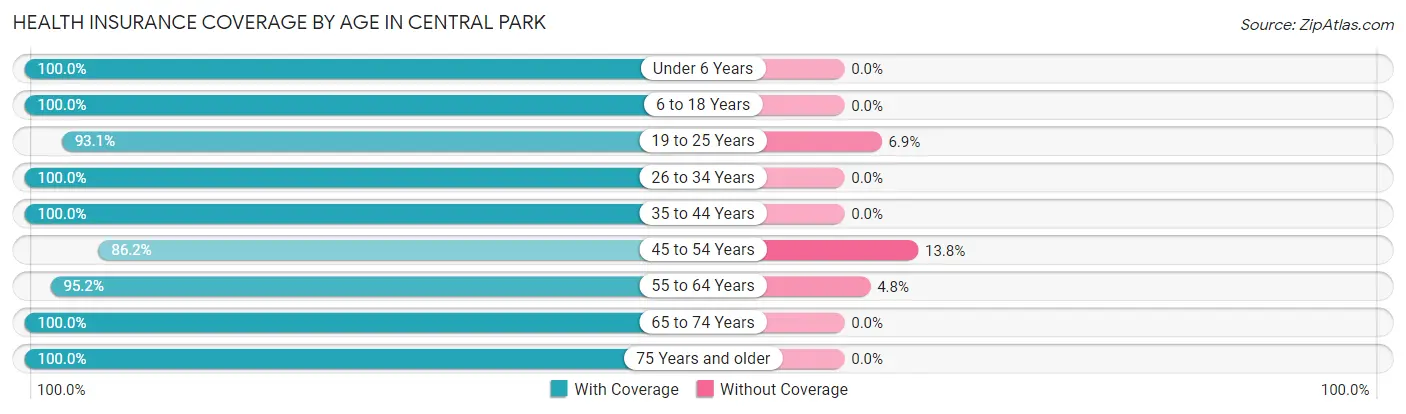
| Age Bracket | With Coverage | Without Coverage |
| Under 6 Years | 140 (100.0%) | 0 (0.0%) |
| 6 to 18 Years | 658 (100.0%) | 0 (0.0%) |
| 19 to 25 Years | 282 (93.1%) | 21 (6.9%) |
| 26 to 34 Years | 304 (100.0%) | 0 (0.0%) |
| 35 to 44 Years | 245 (100.0%) | 0 (0.0%) |
| 45 to 54 Years | 395 (86.2%) | 63 (13.8%) |
| 55 to 64 Years | 729 (95.2%) | 37 (4.8%) |
| 65 to 74 Years | 308 (100.0%) | 0 (0.0%) |
| 75 Years and older | 234 (100.0%) | 0 (0.0%) |
| Total | 3,295 (96.5%) | 121 (3.5%) |
Health Insurance Coverage by Citizenship Status in Central Park
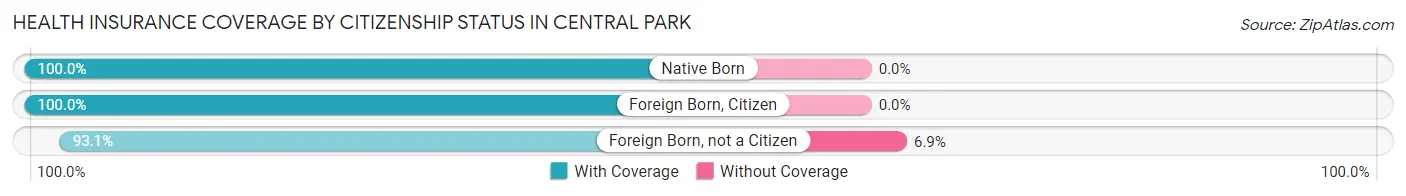
| Citizenship Status | With Coverage | Without Coverage |
| Native Born | 140 (100.0%) | 0 (0.0%) |
| Foreign Born, Citizen | 658 (100.0%) | 0 (0.0%) |
| Foreign Born, not a Citizen | 282 (93.1%) | 21 (6.9%) |
Health Insurance Coverage by Household Income in Central Park
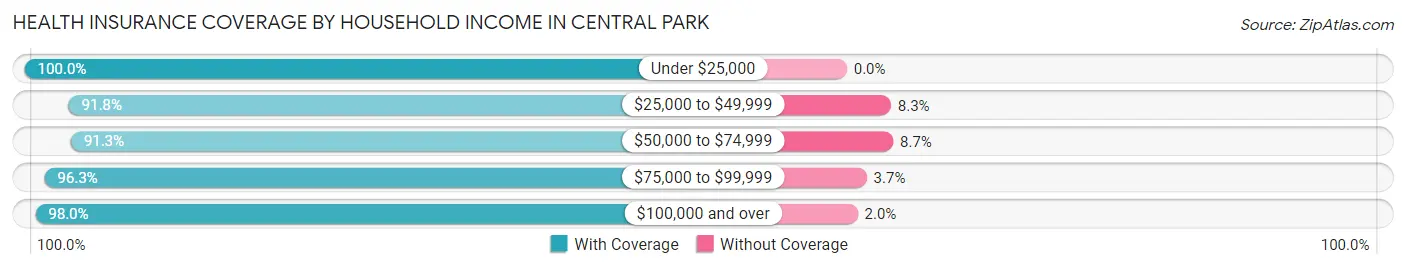
| Household Income | With Coverage | Without Coverage |
| Under $25,000 | 189 (100.0%) | 0 (0.0%) |
| $25,000 to $49,999 | 267 (91.7%) | 24 (8.3%) |
| $50,000 to $74,999 | 390 (91.3%) | 37 (8.7%) |
| $75,000 to $99,999 | 544 (96.3%) | 21 (3.7%) |
| $100,000 and over | 1,895 (98.0%) | 39 (2.0%) |
Public vs Private Health Insurance Coverage by Age in Central Park
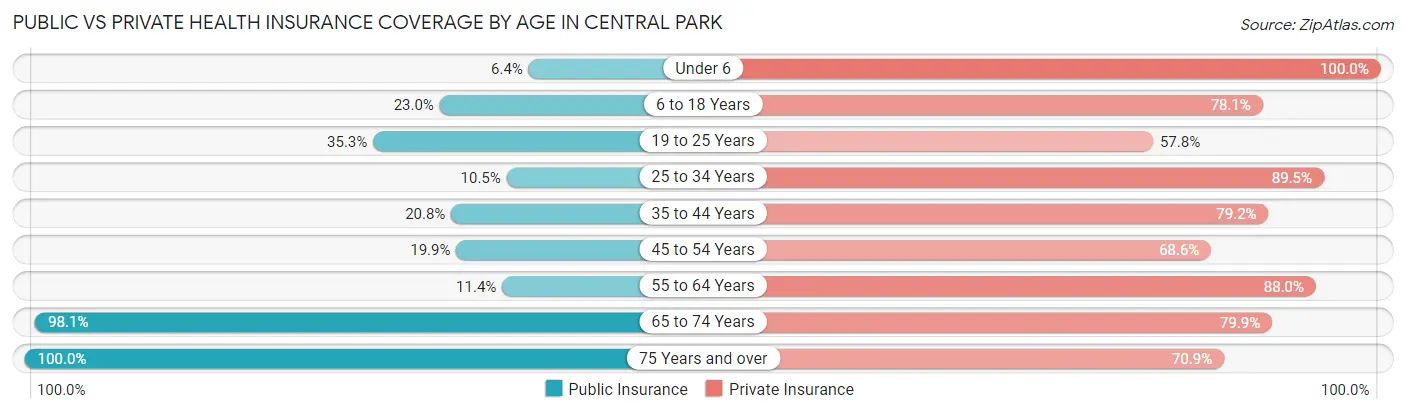
| Age Bracket | Public Insurance | Private Insurance |
| Under 6 | 9 (6.4%) | 140 (100.0%) |
| 6 to 18 Years | 151 (23.0%) | 514 (78.1%) |
| 19 to 25 Years | 107 (35.3%) | 175 (57.8%) |
| 25 to 34 Years | 32 (10.5%) | 272 (89.5%) |
| 35 to 44 Years | 51 (20.8%) | 194 (79.2%) |
| 45 to 54 Years | 91 (19.9%) | 314 (68.6%) |
| 55 to 64 Years | 87 (11.4%) | 674 (88.0%) |
| 65 to 74 Years | 302 (98.1%) | 246 (79.9%) |
| 75 Years and over | 234 (100.0%) | 166 (70.9%) |
| Total | 1,064 (31.1%) | 2,695 (78.9%) |
Disability Status by Sex by Age in Central Park
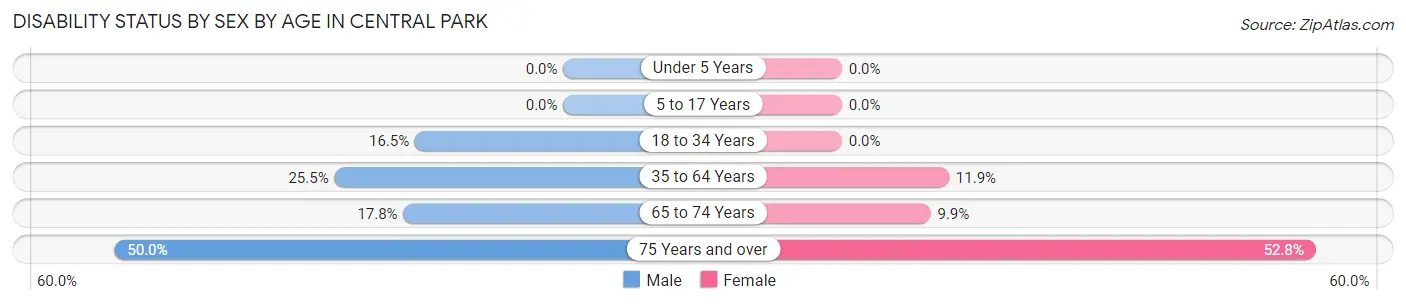
| Age Bracket | Male | Female |
| Under 5 Years | 0 (0.0%) | 0 (0.0%) |
| 5 to 17 Years | 0 (0.0%) | 0 (0.0%) |
| 18 to 34 Years | 73 (16.5%) | 0 (0.0%) |
| 35 to 64 Years | 195 (25.5%) | 84 (11.9%) |
| 65 to 74 Years | 26 (17.8%) | 16 (9.9%) |
| 75 Years and over | 45 (50.0%) | 76 (52.8%) |
Disability Class by Sex by Age in Central Park
Disability Class: Hearing Difficulty
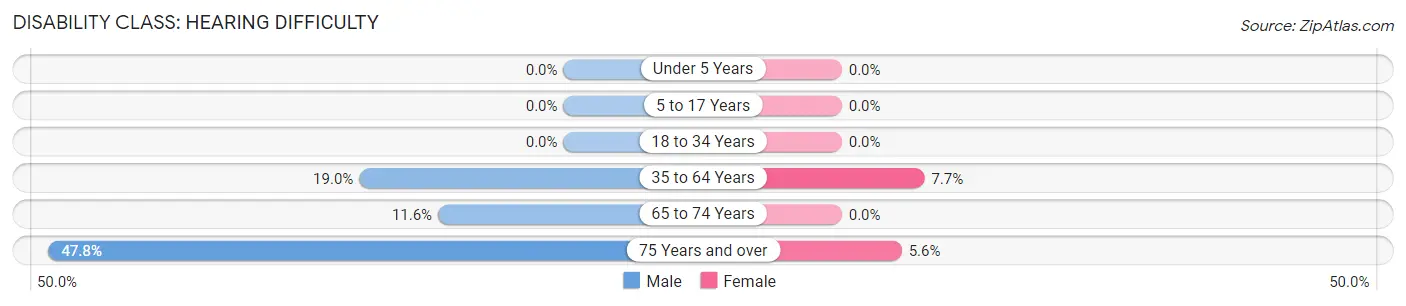
| Age Bracket | Male | Female |
| Under 5 Years | 0 (0.0%) | 0 (0.0%) |
| 5 to 17 Years | 0 (0.0%) | 0 (0.0%) |
| 18 to 34 Years | 0 (0.0%) | 0 (0.0%) |
| 35 to 64 Years | 145 (19.0%) | 54 (7.7%) |
| 65 to 74 Years | 17 (11.6%) | 0 (0.0%) |
| 75 Years and over | 43 (47.8%) | 8 (5.6%) |
Disability Class: Vision Difficulty
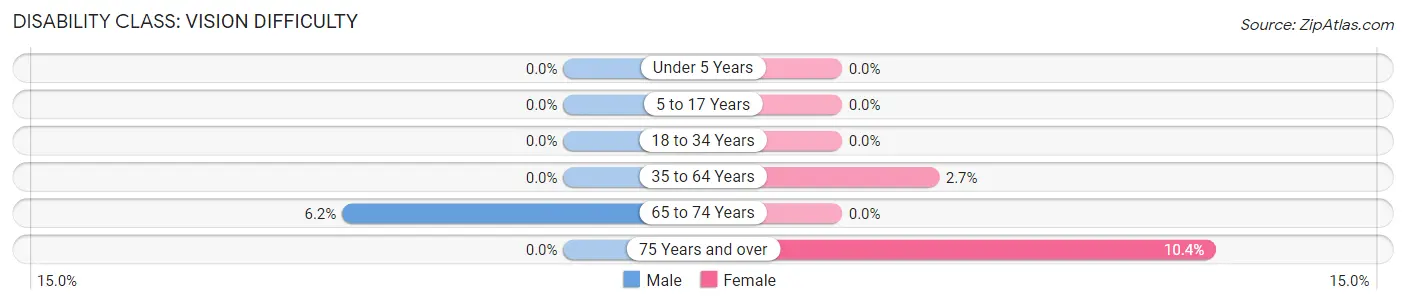
| Age Bracket | Male | Female |
| Under 5 Years | 0 (0.0%) | 0 (0.0%) |
| 5 to 17 Years | 0 (0.0%) | 0 (0.0%) |
| 18 to 34 Years | 0 (0.0%) | 0 (0.0%) |
| 35 to 64 Years | 0 (0.0%) | 19 (2.7%) |
| 65 to 74 Years | 9 (6.2%) | 0 (0.0%) |
| 75 Years and over | 0 (0.0%) | 15 (10.4%) |
Disability Class: Cognitive Difficulty
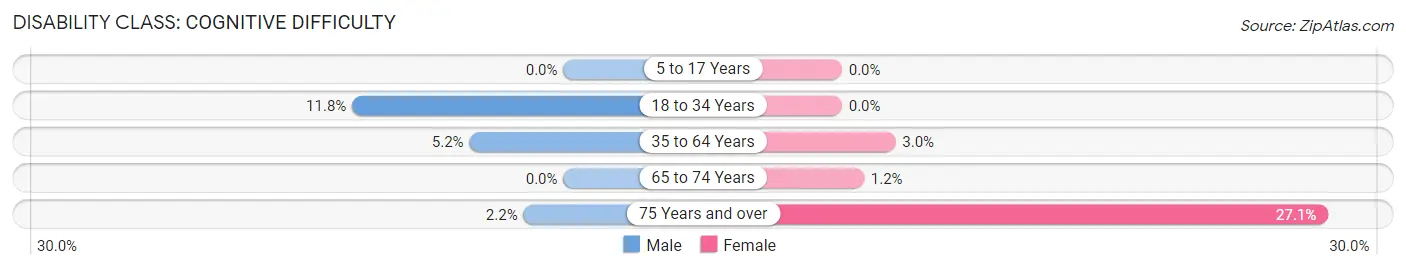
| Age Bracket | Male | Female |
| 5 to 17 Years | 0 (0.0%) | 0 (0.0%) |
| 18 to 34 Years | 52 (11.8%) | 0 (0.0%) |
| 35 to 64 Years | 40 (5.2%) | 21 (3.0%) |
| 65 to 74 Years | 0 (0.0%) | 2 (1.2%) |
| 75 Years and over | 2 (2.2%) | 39 (27.1%) |
Disability Class: Ambulatory Difficulty
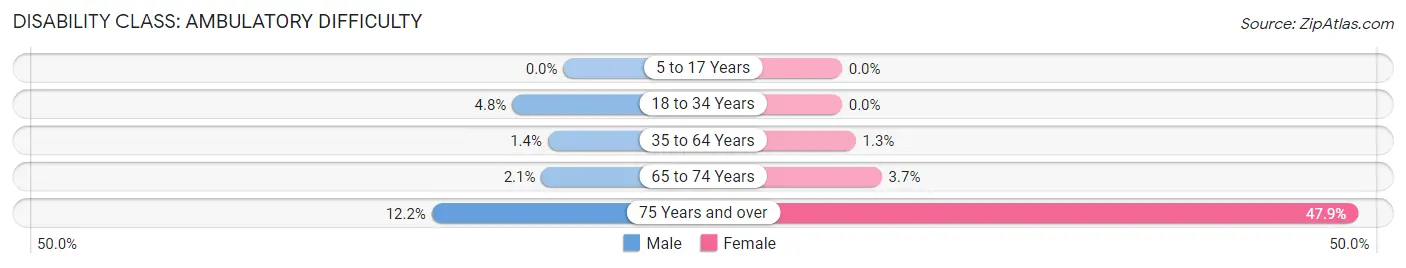
| Age Bracket | Male | Female |
| 5 to 17 Years | 0 (0.0%) | 0 (0.0%) |
| 18 to 34 Years | 21 (4.8%) | 0 (0.0%) |
| 35 to 64 Years | 11 (1.4%) | 9 (1.3%) |
| 65 to 74 Years | 3 (2.1%) | 6 (3.7%) |
| 75 Years and over | 11 (12.2%) | 69 (47.9%) |
Disability Class: Self-Care Difficulty
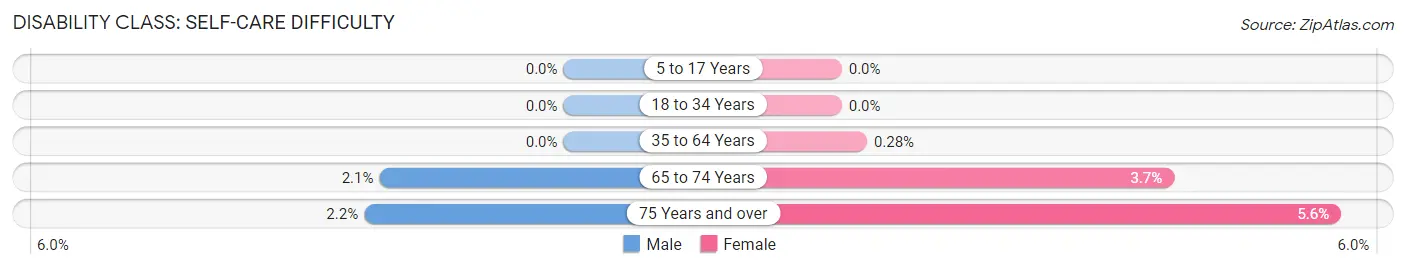
| Age Bracket | Male | Female |
| 5 to 17 Years | 0 (0.0%) | 0 (0.0%) |
| 18 to 34 Years | 0 (0.0%) | 0 (0.0%) |
| 35 to 64 Years | 0 (0.0%) | 2 (0.3%) |
| 65 to 74 Years | 3 (2.1%) | 6 (3.7%) |
| 75 Years and over | 2 (2.2%) | 8 (5.6%) |
Technology Access in Central Park
Computing Device Access in Central Park
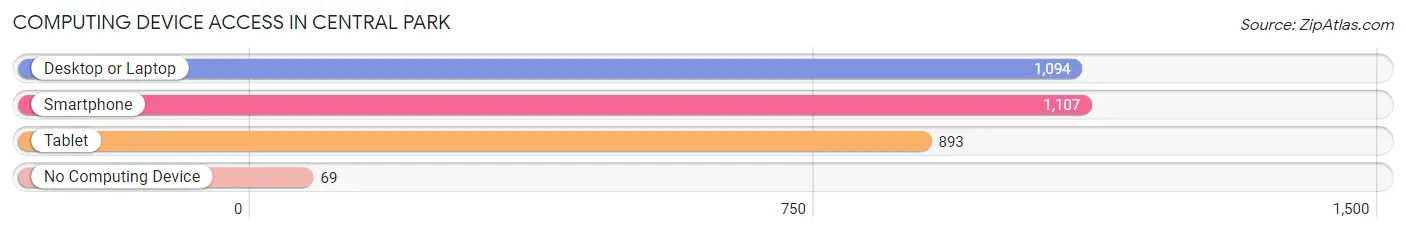
| Device Type | # Households | % Households |
| Desktop or Laptop | 1,094 | 83.1% |
| Smartphone | 1,107 | 84.1% |
| Tablet | 893 | 67.9% |
| No Computing Device | 69 | 5.2% |
| Total | 1,316 | 100.0% |
Internet Access in Central Park
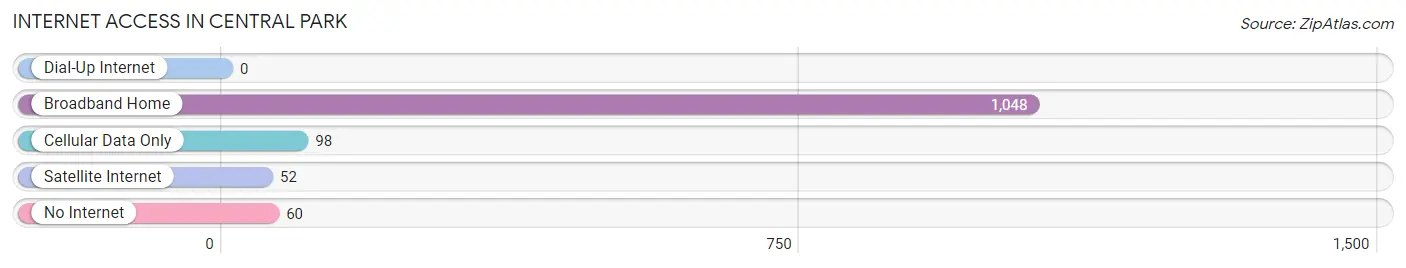
| Internet Type | # Households | % Households |
| Dial-Up Internet | 0 | 0.0% |
| Broadband Home | 1,048 | 79.6% |
| Cellular Data Only | 98 | 7.4% |
| Satellite Internet | 52 | 4.0% |
| No Internet | 60 | 4.6% |
| Total | 1,316 | 100.0% |
Central Park Summary
Introduction
Central Park is a small city located in Pierce County, Washington, United States. It is located in the south-central part of the county, just south of Tacoma and north of Puyallup. The city was incorporated in 1951 and has a population of approximately 8,000 people. Central Park is a vibrant and diverse community that is home to a variety of businesses, parks, and recreational activities.
History
Central Park was first settled in the late 1800s by a group of settlers from the Midwest. The settlers were attracted to the area due to its proximity to Tacoma and the abundance of natural resources. The settlers established a small farming community and named it Central Park. The community grew slowly but steadily over the years and by the early 1900s, it had become a thriving agricultural center.
In 1951, the residents of Central Park voted to incorporate the city. The city was officially incorporated on April 1, 1951. Since then, the city has grown and developed into a vibrant and diverse community.
Geography
Central Park is located in the south-central part of Pierce County, Washington. It is situated between Tacoma and Puyallup, and is bordered by the Puyallup River to the north and the White River to the south. The city covers an area of approximately 4.5 square miles and has an elevation of approximately 400 feet.
The city is located in a temperate climate zone and experiences mild temperatures throughout the year. The average high temperature in the summer is around 75 degrees Fahrenheit and the average low temperature in the winter is around 40 degrees Fahrenheit.
Economy
Central Park is home to a variety of businesses and industries. The city is home to several large employers, including the Tacoma-Pierce County Health Department, the Pierce County Library System, and the Tacoma Public Schools. The city also has a thriving retail sector, with several large shopping centers and retail stores.
The city is also home to several small businesses, including restaurants, cafes, and specialty shops. The city is also home to several parks and recreational facilities, including the Central Park Community Center, the Central Park Aquatic Center, and the Central Park Golf Course.
Demographics
As of the 2010 census, the population of Central Park was 8,000 people. The population is diverse, with a mix of races and ethnicities. The largest racial group is White (63.3%), followed by Hispanic or Latino (17.2%), African American (7.7%), Asian (5.2%), and Native American (2.2%).
The median household income in Central Park is $50,000, and the median home value is $250,000. The city has a high rate of homeownership, with approximately 70% of the population owning their own homes.
Conclusion
Central Park is a vibrant and diverse city located in Pierce County, Washington. The city was incorporated in 1951 and has a population of approximately 8,000 people. Central Park is home to a variety of businesses, parks, and recreational activities. The city has a diverse population and a strong economy, with a median household income of $50,000 and a median home value of $250,000. Central Park is a great place to live, work, and play.
Common Questions
What is Per Capita Income in Central Park?
Per Capita income in Central Park is $41,497.
What is the Median Family Income in Central Park?
Median Family Income in Central Park is $110,000.
What is the Median Household income in Central Park?
Median Household Income in Central Park is $96,170.
What is Income or Wage Gap in Central Park?
Income or Wage Gap in Central Park is 44.0%.
Women in Central Park earn 56.0 cents for every dollar earned by a man.
What is Inequality or Gini Index in Central Park?
Inequality or Gini Index in Central Park is 0.34.
What is the Total Population of Central Park?
Total Population of Central Park is 3,416.
What is the Total Male Population of Central Park?
Total Male Population of Central Park is 1,854.
What is the Total Female Population of Central Park?
Total Female Population of Central Park is 1,562.
What is the Ratio of Males per 100 Females in Central Park?
There are 118.69 Males per 100 Females in Central Park.
What is the Ratio of Females per 100 Males in Central Park?
There are 84.25 Females per 100 Males in Central Park.
What is the Median Population Age in Central Park?
Median Population Age in Central Park is 47.2 Years.
What is the Average Family Size in Central Park
Average Family Size in Central Park is 2.9 People.
What is the Average Household Size in Central Park
Average Household Size in Central Park is 2.6 People.
How Large is the Labor Force in Central Park?
There are 1,831 People in the Labor Forcein in Central Park.
What is the Percentage of People in the Labor Force in Central Park?
65.8% of People are in the Labor Force in Central Park.
What is the Unemployment Rate in Central Park?
Unemployment Rate in Central Park is 0.7%.