South Hill, WA Map & Demographics
South Hill Map
South Hill Overview
$42,125
PER CAPITA INCOME
$111,052
AVG FAMILY INCOME
$103,707
AVG HOUSEHOLD INCOME
41.3%
WAGE / INCOME GAP [ % ]
58.7¢/ $1
WAGE / INCOME GAP [ $ ]
0.38
INEQUALITY / GINI INDEX
67,835
TOTAL POPULATION
34,234
MALE POPULATION
33,601
FEMALE POPULATION
101.88
MALES / 100 FEMALES
98.15
FEMALES / 100 MALES
34.3
MEDIAN AGE
3.3
AVG FAMILY SIZE
3.0
AVG HOUSEHOLD SIZE
35,667
LABOR FORCE [ PEOPLE ]
70.0%
PERCENT IN LABOR FORCE
4.6%
UNEMPLOYMENT RATE
South Hill Area Codes
Income in South Hill
Income Overview in South Hill
Per Capita Income in South Hill is $42,125, while median incomes of families and households are $111,052 and $103,707 respectively.
| Characteristic | Number | Measure |
| Per Capita Income | 67,835 | $42,125 |
| Median Family Income | 18,151 | $111,052 |
| Mean Family Income | 18,151 | $131,159 |
| Median Household Income | 22,324 | $103,707 |
| Mean Household Income | 22,324 | $126,470 |
| Income Deficit | 18,151 | $0 |
| Wage / Income Gap (%) | 67,835 | 41.28% |
| Wage / Income Gap ($) | 67,835 | 58.72¢ per $1 |
| Gini / Inequality Index | 67,835 | 0.38 |
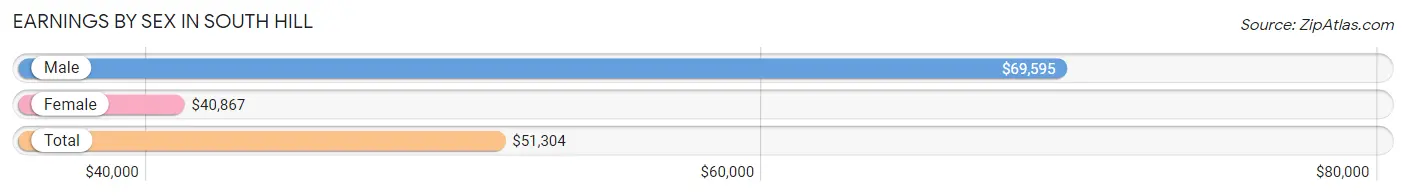
Earnings by Sex in South Hill
Average Earnings in South Hill are $51,304, $69,595 for men and $40,867 for women, a difference of 41.3%.
| Sex | Number | Average Earnings |
| Male | 19,417 (52.9%) | $69,595 |
| Female | 17,297 (47.1%) | $40,867 |
| Total | 36,714 (100.0%) | $51,304 |
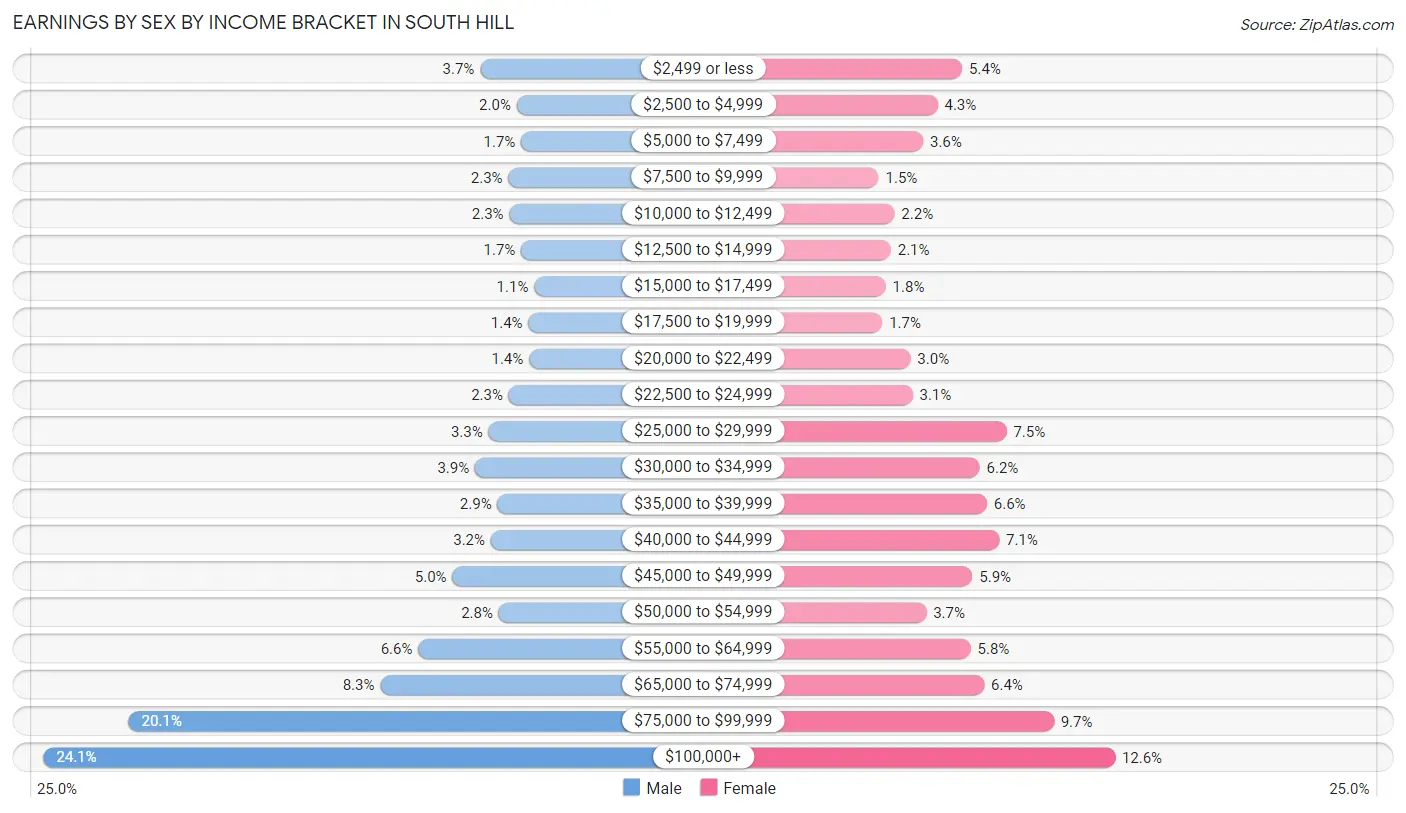
Earnings by Sex by Income Bracket in South Hill
The most common earnings brackets in South Hill are $100,000+ for men (4,684 | 24.1%) and $100,000+ for women (2,172 | 12.6%).
| Income | Male | Female |
| $2,499 or less | 710 (3.7%) | 934 (5.4%) |
| $2,500 to $4,999 | 378 (1.9%) | 735 (4.3%) |
| $5,000 to $7,499 | 337 (1.7%) | 617 (3.6%) |
| $7,500 to $9,999 | 454 (2.3%) | 257 (1.5%) |
| $10,000 to $12,499 | 445 (2.3%) | 385 (2.2%) |
| $12,500 to $14,999 | 337 (1.7%) | 357 (2.1%) |
| $15,000 to $17,499 | 220 (1.1%) | 314 (1.8%) |
| $17,500 to $19,999 | 271 (1.4%) | 287 (1.7%) |
| $20,000 to $22,499 | 266 (1.4%) | 515 (3.0%) |
| $22,500 to $24,999 | 450 (2.3%) | 532 (3.1%) |
| $25,000 to $29,999 | 634 (3.3%) | 1,294 (7.5%) |
| $30,000 to $34,999 | 758 (3.9%) | 1,076 (6.2%) |
| $35,000 to $39,999 | 554 (2.9%) | 1,134 (6.6%) |
| $40,000 to $44,999 | 614 (3.2%) | 1,234 (7.1%) |
| $45,000 to $49,999 | 964 (5.0%) | 1,017 (5.9%) |
| $50,000 to $54,999 | 541 (2.8%) | 644 (3.7%) |
| $55,000 to $64,999 | 1,273 (6.6%) | 1,004 (5.8%) |
| $65,000 to $74,999 | 1,619 (8.3%) | 1,113 (6.4%) |
| $75,000 to $99,999 | 3,908 (20.1%) | 1,676 (9.7%) |
| $100,000+ | 4,684 (24.1%) | 2,172 (12.6%) |
| Total | 19,417 (100.0%) | 17,297 (100.0%) |
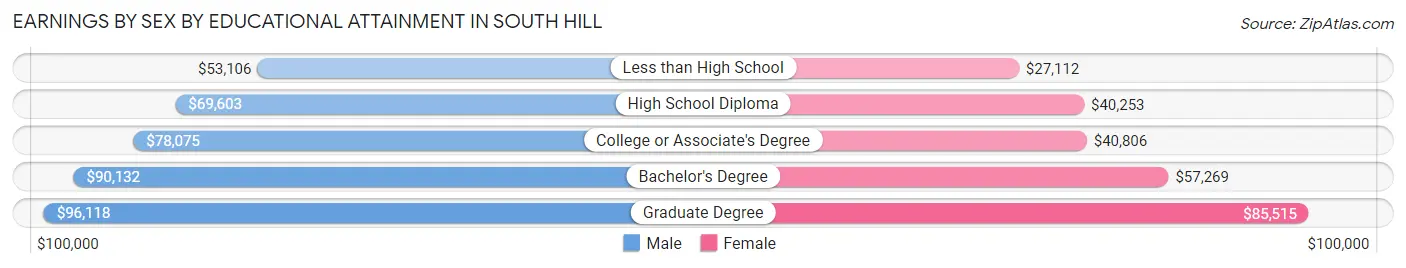
Earnings by Sex by Educational Attainment in South Hill
Average earnings in South Hill are $76,686 for men and $45,281 for women, a difference of 40.9%. Men with an educational attainment of graduate degree enjoy the highest average annual earnings of $96,118, while those with less than high school education earn the least with $53,106. Women with an educational attainment of graduate degree earn the most with the average annual earnings of $85,515, while those with less than high school education have the smallest earnings of $27,112.
| Educational Attainment | Male Income | Female Income |
| Less than High School | $53,106 | $27,112 |
| High School Diploma | $69,603 | $40,253 |
| College or Associate's Degree | $78,075 | $40,806 |
| Bachelor's Degree | $90,132 | $57,269 |
| Graduate Degree | $96,118 | $85,515 |
| Total | $76,686 | $45,281 |
Family Income in South Hill
Family Income Brackets in South Hill
According to the South Hill family income data, there are 4,374 families falling into the $100,000 to $149,999 income range, which is the most common income bracket and makes up 24.1% of all families. Conversely, the $10,000 to $14,999 income bracket is the least frequent group with only 91 families (0.5%) belonging to this category.
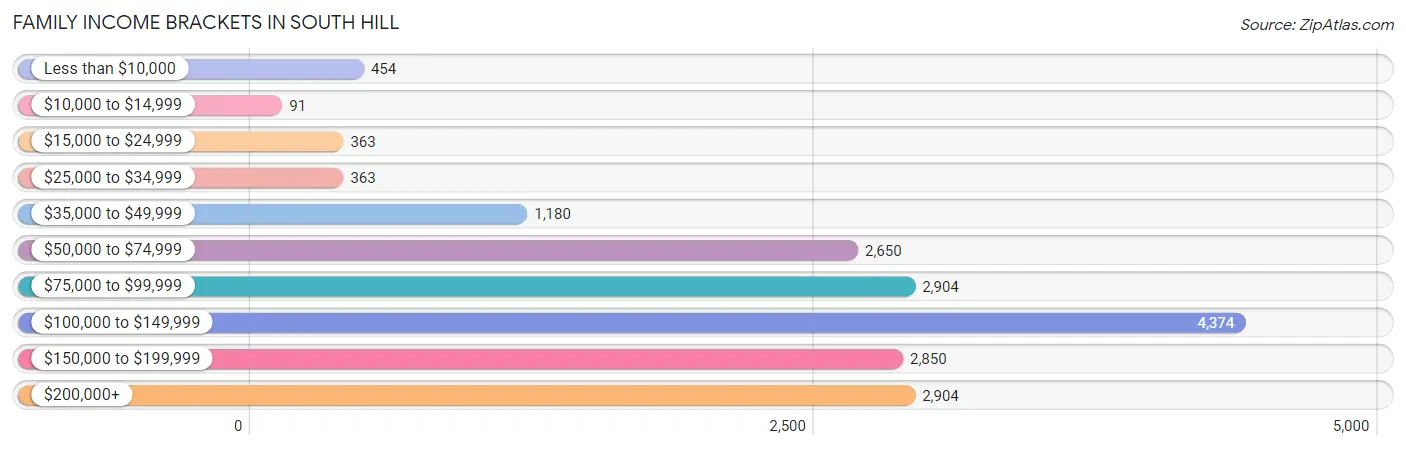
| Income Bracket | # Families | % Families |
| Less than $10,000 | 454 | 2.5% |
| $10,000 to $14,999 | 91 | 0.5% |
| $15,000 to $24,999 | 363 | 2.0% |
| $25,000 to $34,999 | 363 | 2.0% |
| $35,000 to $49,999 | 1,180 | 6.5% |
| $50,000 to $74,999 | 2,650 | 14.6% |
| $75,000 to $99,999 | 2,904 | 16.0% |
| $100,000 to $149,999 | 4,374 | 24.1% |
| $150,000 to $199,999 | 2,850 | 15.7% |
| $200,000+ | 2,904 | 16.0% |
Family Income by Famaliy Size in South Hill
7+ person families (337 | 1.9%) account for the highest median family income in South Hill with $159,206 per family, while 2-person families (6,915 | 38.1%) have the highest median income of $47,038 per family member.
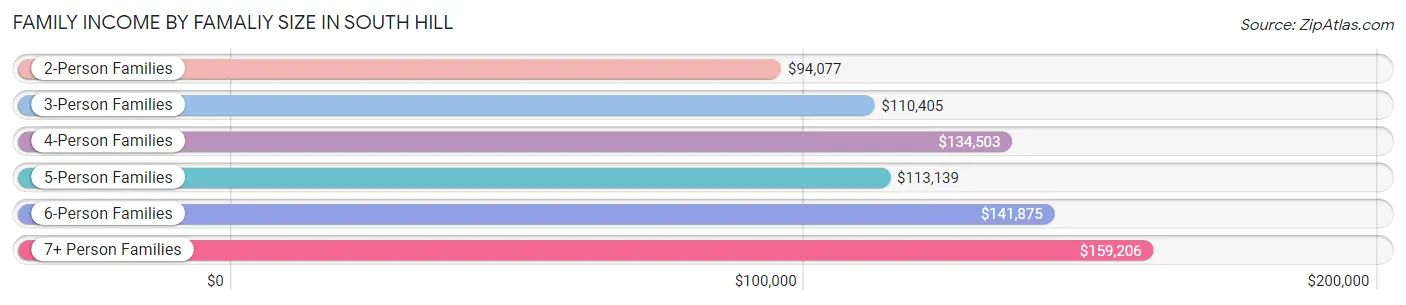
| Income Bracket | # Families | Median Income |
| 2-Person Families | 6,915 (38.1%) | $94,077 |
| 3-Person Families | 4,161 (22.9%) | $110,405 |
| 4-Person Families | 4,309 (23.7%) | $134,503 |
| 5-Person Families | 1,773 (9.8%) | $113,139 |
| 6-Person Families | 656 (3.6%) | $141,875 |
| 7+ Person Families | 337 (1.9%) | $159,206 |
| Total | 18,151 (100.0%) | $111,052 |
Family Income by Number of Earners in South Hill
The median family income in South Hill is $111,052, with families comprising 3+ earners (2,608) having the highest median family income of $170,294, while families with no earners (1,729) have the lowest median family income of $66,513, accounting for 14.4% and 9.5% of families, respectively.
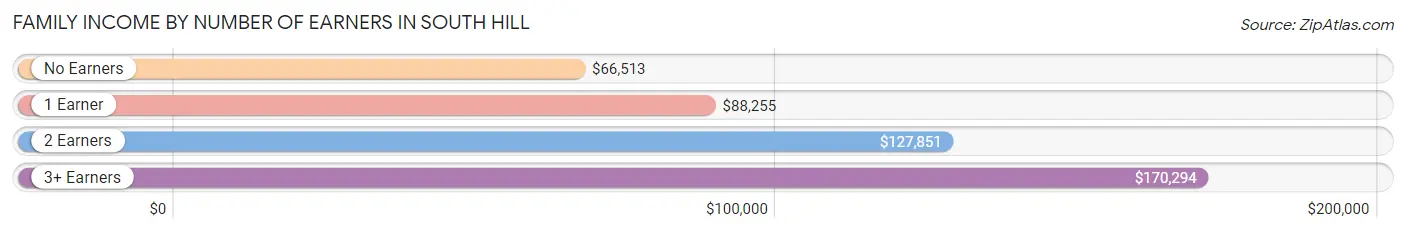
| Number of Earners | # Families | Median Income |
| No Earners | 1,729 (9.5%) | $66,513 |
| 1 Earner | 5,671 (31.2%) | $88,255 |
| 2 Earners | 8,143 (44.9%) | $127,851 |
| 3+ Earners | 2,608 (14.4%) | $170,294 |
| Total | 18,151 (100.0%) | $111,052 |
Household Income in South Hill
Household Income Brackets in South Hill
With 5,268 households falling in the category, the $100,000 to $149,999 income range is the most frequent in South Hill, accounting for 23.6% of all households. In contrast, only 112 households (0.5%) fall into the $10,000 to $14,999 income bracket, making it the least populous group.
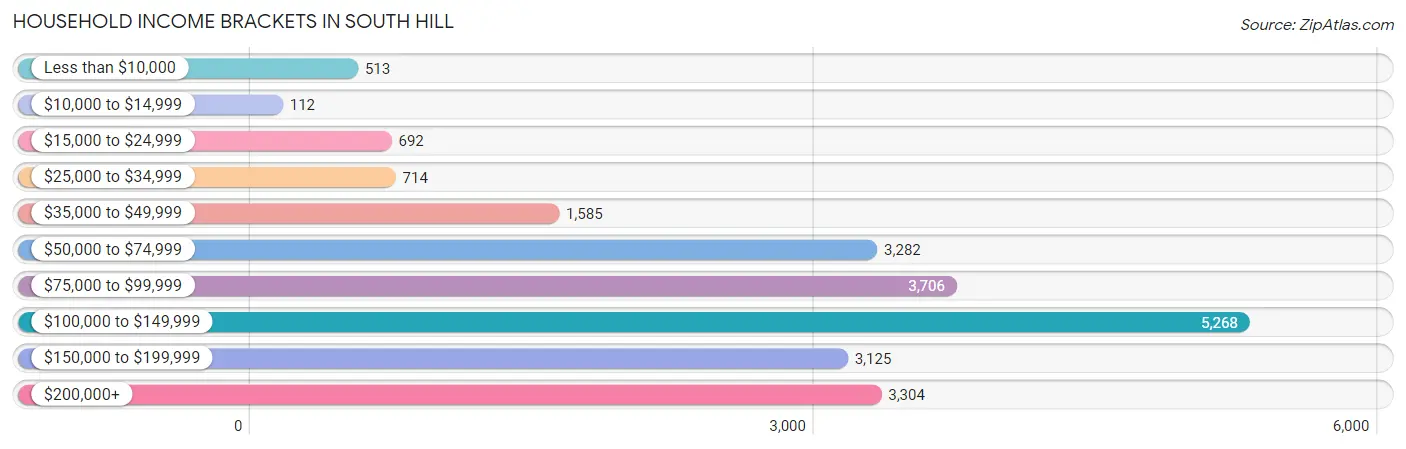
| Income Bracket | # Households | % Households |
| Less than $10,000 | 513 | 2.3% |
| $10,000 to $14,999 | 112 | 0.5% |
| $15,000 to $24,999 | 692 | 3.1% |
| $25,000 to $34,999 | 714 | 3.2% |
| $35,000 to $49,999 | 1,585 | 7.1% |
| $50,000 to $74,999 | 3,282 | 14.7% |
| $75,000 to $99,999 | 3,706 | 16.6% |
| $100,000 to $149,999 | 5,268 | 23.6% |
| $150,000 to $199,999 | 3,125 | 14.0% |
| $200,000+ | 3,304 | 14.8% |
Household Income by Householder Age in South Hill
The median household income in South Hill is $103,707, with the highest median household income of $116,781 found in the 45 to 64 years age bracket for the primary householder. A total of 8,471 households (38.0%) fall into this category. Meanwhile, the 15 to 24 years age bracket for the primary householder has the lowest median household income of $61,367, with 698 households (3.1%) in this group.
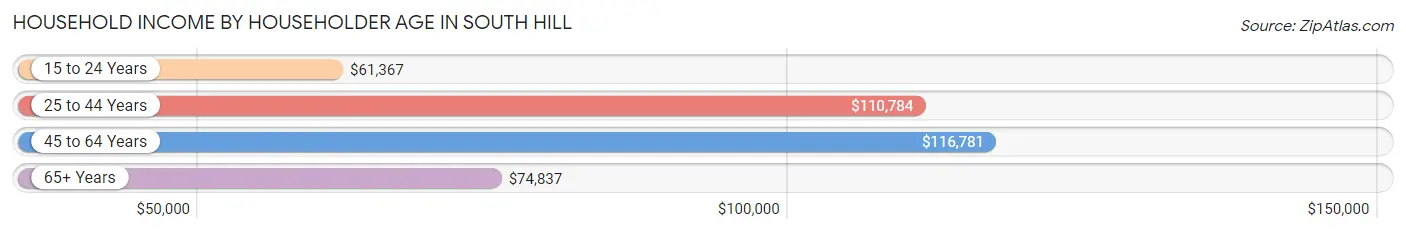
| Income Bracket | # Households | Median Income |
| 15 to 24 Years | 698 (3.1%) | $61,367 |
| 25 to 44 Years | 9,166 (41.1%) | $110,784 |
| 45 to 64 Years | 8,471 (38.0%) | $116,781 |
| 65+ Years | 3,989 (17.9%) | $74,837 |
| Total | 22,324 (100.0%) | $103,707 |
Poverty in South Hill
Income Below Poverty by Sex and Age in South Hill
With 6.0% poverty level for males and 6.6% for females among the residents of South Hill, 16 and 17 year old males and 15 year old females are the most vulnerable to poverty, with 164 males (12.7%) and 126 females (18.4%) in their respective age groups living below the poverty level.
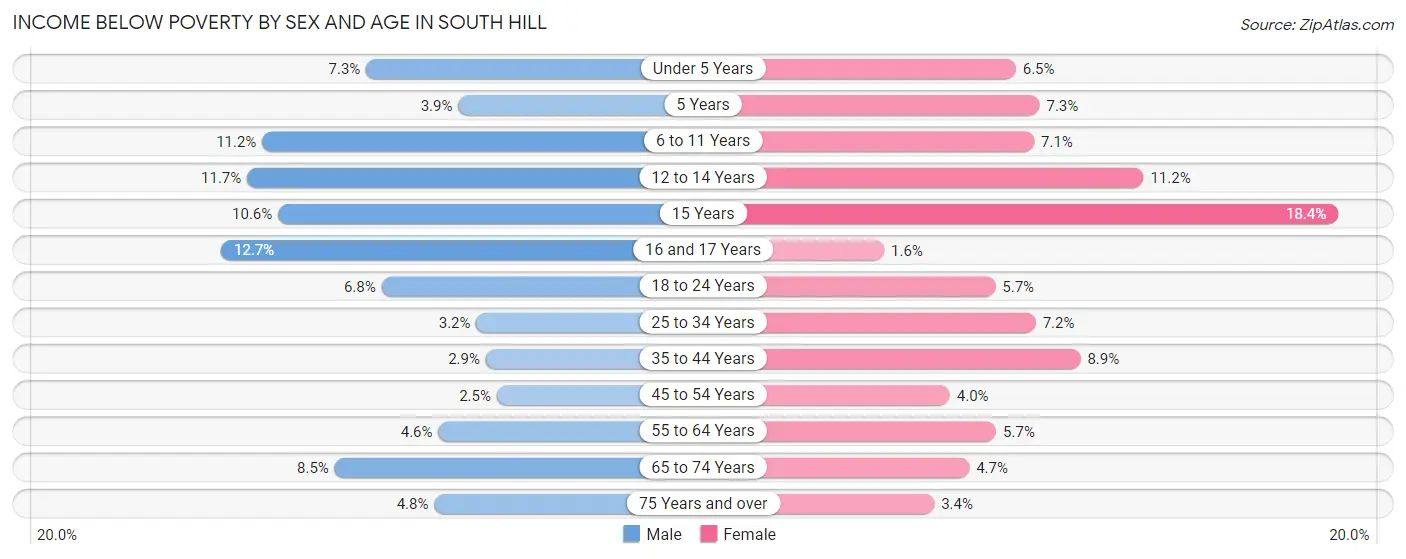
| Age Bracket | Male | Female |
| Under 5 Years | 191 (7.3%) | 134 (6.5%) |
| 5 Years | 18 (3.9%) | 29 (7.3%) |
| 6 to 11 Years | 370 (11.2%) | 222 (7.1%) |
| 12 to 14 Years | 206 (11.7%) | 173 (11.2%) |
| 15 Years | 81 (10.6%) | 126 (18.4%) |
| 16 and 17 Years | 164 (12.7%) | 17 (1.6%) |
| 18 to 24 Years | 234 (6.8%) | 146 (5.7%) |
| 25 to 34 Years | 150 (3.2%) | 332 (7.2%) |
| 35 to 44 Years | 143 (2.9%) | 449 (8.9%) |
| 45 to 54 Years | 101 (2.5%) | 166 (4.0%) |
| 55 to 64 Years | 170 (4.6%) | 234 (5.7%) |
| 65 to 74 Years | 158 (8.5%) | 114 (4.7%) |
| 75 Years and over | 59 (4.8%) | 59 (3.4%) |
| Total | 2,045 (6.0%) | 2,201 (6.6%) |
Income Above Poverty by Sex and Age in South Hill
According to the poverty statistics in South Hill, males aged 45 to 54 years and females aged 16 and 17 years are the age groups that are most secure financially, with 97.5% of males and 98.4% of females in these age groups living above the poverty line.
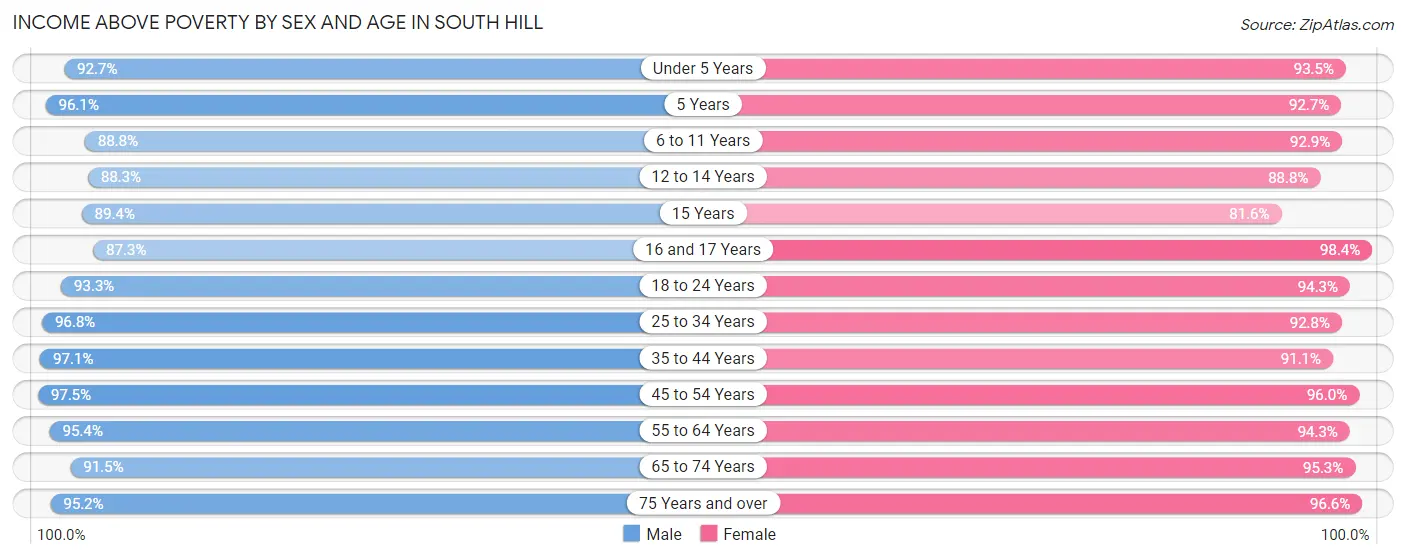
| Age Bracket | Male | Female |
| Under 5 Years | 2,418 (92.7%) | 1,941 (93.5%) |
| 5 Years | 444 (96.1%) | 366 (92.7%) |
| 6 to 11 Years | 2,939 (88.8%) | 2,889 (92.9%) |
| 12 to 14 Years | 1,548 (88.3%) | 1,372 (88.8%) |
| 15 Years | 684 (89.4%) | 558 (81.6%) |
| 16 and 17 Years | 1,126 (87.3%) | 1,064 (98.4%) |
| 18 to 24 Years | 3,231 (93.2%) | 2,416 (94.3%) |
| 25 to 34 Years | 4,495 (96.8%) | 4,282 (92.8%) |
| 35 to 44 Years | 4,823 (97.1%) | 4,621 (91.1%) |
| 45 to 54 Years | 3,990 (97.5%) | 3,976 (96.0%) |
| 55 to 64 Years | 3,495 (95.4%) | 3,849 (94.3%) |
| 65 to 74 Years | 1,702 (91.5%) | 2,294 (95.3%) |
| 75 Years and over | 1,174 (95.2%) | 1,661 (96.6%) |
| Total | 32,069 (94.0%) | 31,289 (93.4%) |
Income Below Poverty Among Married-Couple Families in South Hill
The poverty statistics for married-couple families in South Hill show that 2.2% or 284 of the total 12,923 families live below the poverty line. Families with 1 or 2 children have the highest poverty rate of 2.7%, comprising of 141 families. On the other hand, families with 5 or more children have the lowest poverty rate of 0.0%, which includes 0 families.
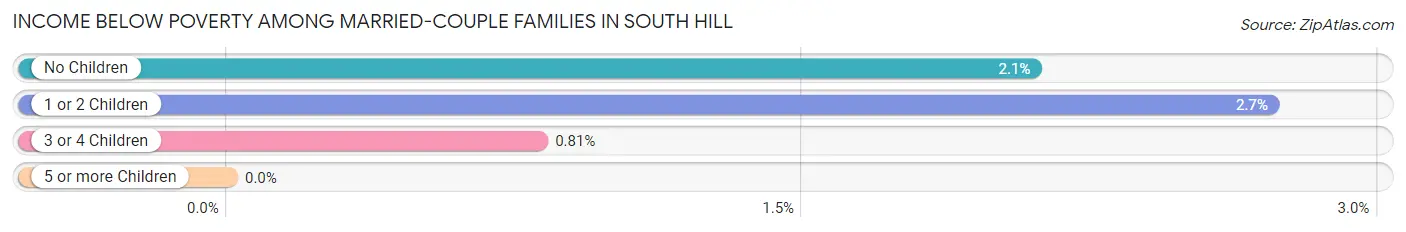
| Children | Above Poverty | Below Poverty |
| No Children | 6,207 (97.9%) | 133 (2.1%) |
| 1 or 2 Children | 5,045 (97.3%) | 141 (2.7%) |
| 3 or 4 Children | 1,225 (99.2%) | 10 (0.8%) |
| 5 or more Children | 162 (100.0%) | 0 (0.0%) |
| Total | 12,639 (97.8%) | 284 (2.2%) |
Income Below Poverty Among Single-Parent Households in South Hill
According to the poverty data in South Hill, 3.3% or 53 single-father households and 14.6% or 528 single-mother households are living below the poverty line. Among single-father households, those with 1 or 2 children have the highest poverty rate, with 43 households (5.7%) experiencing poverty. Likewise, among single-mother households, those with 5 or more children have the highest poverty rate, with 10 households (43.5%) falling below the poverty line.
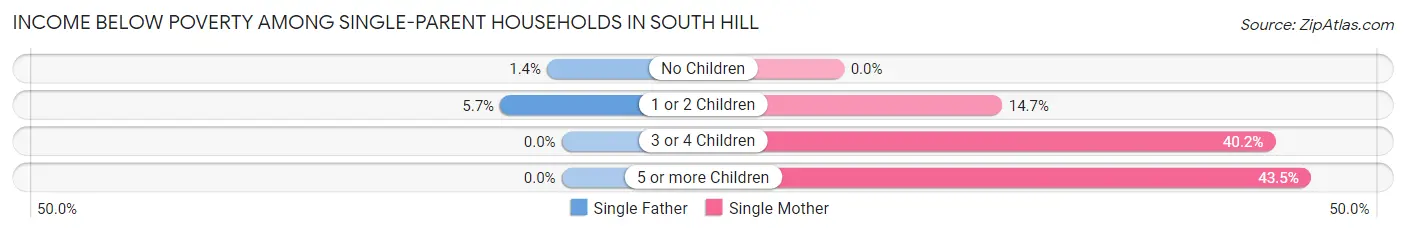
| Children | Single Father | Single Mother |
| No Children | 10 (1.4%) | 0 (0.0%) |
| 1 or 2 Children | 43 (5.7%) | 291 (14.7%) |
| 3 or 4 Children | 0 (0.0%) | 227 (40.2%) |
| 5 or more Children | 0 (0.0%) | 10 (43.5%) |
| Total | 53 (3.3%) | 528 (14.6%) |
Income Below Poverty Among Married-Couple vs Single-Parent Households in South Hill
The poverty data for South Hill shows that 284 of the married-couple family households (2.2%) and 581 of the single-parent households (11.1%) are living below the poverty level. Within the married-couple family households, those with 1 or 2 children have the highest poverty rate, with 141 households (2.7%) falling below the poverty line. Among the single-parent households, those with 5 or more children have the highest poverty rate, with 10 household (43.5%) living below poverty.

| Children | Married-Couple Families | Single-Parent Households |
| No Children | 133 (2.1%) | 10 (0.6%) |
| 1 or 2 Children | 141 (2.7%) | 334 (12.2%) |
| 3 or 4 Children | 10 (0.8%) | 227 (33.2%) |
| 5 or more Children | 0 (0.0%) | 10 (43.5%) |
| Total | 284 (2.2%) | 581 (11.1%) |
Race in South Hill
The most populous races in South Hill are White / Caucasian (45,982 | 67.8%), Two or more Races (10,569 | 15.6%), and Hispanic or Latino (8,413 | 12.4%).
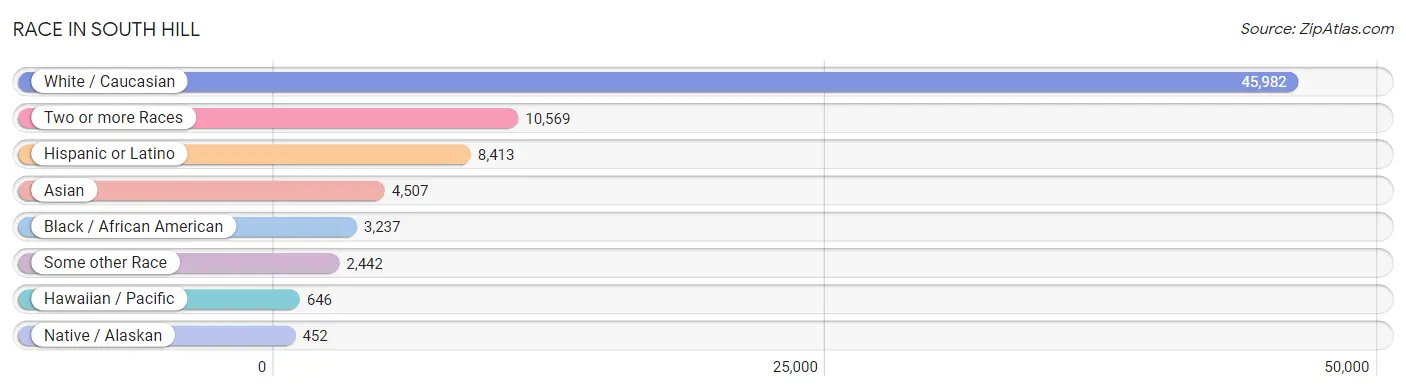
| Race | # Population | % Population |
| Asian | 4,507 | 6.6% |
| Black / African American | 3,237 | 4.8% |
| Hawaiian / Pacific | 646 | 0.9% |
| Hispanic or Latino | 8,413 | 12.4% |
| Native / Alaskan | 452 | 0.7% |
| White / Caucasian | 45,982 | 67.8% |
| Two or more Races | 10,569 | 15.6% |
| Some other Race | 2,442 | 3.6% |
| Total | 67,835 | 100.0% |
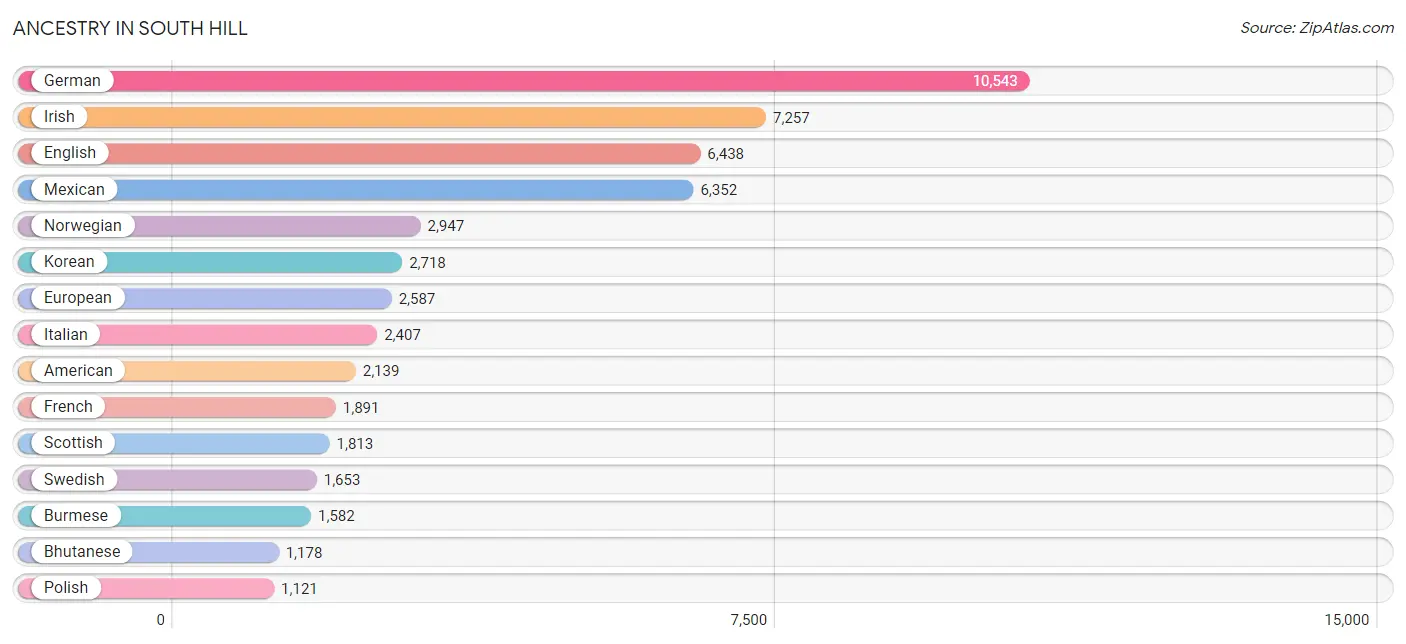
Ancestry in South Hill
The most populous ancestries reported in South Hill are German (10,543 | 15.5%), Irish (7,257 | 10.7%), English (6,438 | 9.5%), Mexican (6,352 | 9.4%), and Norwegian (2,947 | 4.3%), together accounting for 49.4% of all South Hill residents.
| Ancestry | # Population | % Population |
| African | 378 | 0.6% |
| Alaskan Athabascan | 65 | 0.1% |
| Aleut | 54 | 0.1% |
| American | 2,139 | 3.2% |
| Apache | 11 | 0.0% |
| Arab | 325 | 0.5% |
| Argentinean | 44 | 0.1% |
| Australian | 10 | 0.0% |
| Austrian | 46 | 0.1% |
| Basque | 10 | 0.0% |
| Belgian | 244 | 0.4% |
| Bhutanese | 1,178 | 1.7% |
| Blackfeet | 107 | 0.2% |
| Bolivian | 8 | 0.0% |
| Brazilian | 91 | 0.1% |
| British | 789 | 1.2% |
| Bulgarian | 82 | 0.1% |
| Burmese | 1,582 | 2.3% |
| Cambodian | 14 | 0.0% |
| Canadian | 258 | 0.4% |
| Central American | 321 | 0.5% |
| Central American Indian | 94 | 0.1% |
| Cherokee | 176 | 0.3% |
| Chippewa | 102 | 0.2% |
| Choctaw | 8 | 0.0% |
| Colombian | 15 | 0.0% |
| Colville | 42 | 0.1% |
| Costa Rican | 31 | 0.1% |
| Cree | 14 | 0.0% |
| Croatian | 121 | 0.2% |
| Cuban | 58 | 0.1% |
| Czech | 465 | 0.7% |
| Czechoslovakian | 109 | 0.2% |
| Danish | 1,027 | 1.5% |
| Dominican | 25 | 0.0% |
| Dutch | 803 | 1.2% |
| Eastern European | 82 | 0.1% |
| Egyptian | 10 | 0.0% |
| English | 6,438 | 9.5% |
| European | 2,587 | 3.8% |
| Filipino | 10 | 0.0% |
| Finnish | 347 | 0.5% |
| French | 1,891 | 2.8% |
| French American Indian | 13 | 0.0% |
| French Canadian | 148 | 0.2% |
| German | 10,543 | 15.5% |
| Ghanaian | 16 | 0.0% |
| Greek | 231 | 0.3% |
| Guamanian / Chamorro | 509 | 0.7% |
| Guatemalan | 77 | 0.1% |
| Haitian | 19 | 0.0% |
| Honduran | 51 | 0.1% |
| Hungarian | 128 | 0.2% |
| Icelander | 10 | 0.0% |
| Indian (Asian) | 1,103 | 1.6% |
| Indonesian | 42 | 0.1% |
| Iranian | 72 | 0.1% |
| Iraqi | 217 | 0.3% |
| Irish | 7,257 | 10.7% |
| Iroquois | 191 | 0.3% |
| Italian | 2,407 | 3.5% |
| Jamaican | 41 | 0.1% |
| Japanese | 778 | 1.1% |
| Kenyan | 341 | 0.5% |
| Korean | 2,718 | 4.0% |
| Latvian | 8 | 0.0% |
| Lebanese | 90 | 0.1% |
| Lithuanian | 63 | 0.1% |
| Malaysian | 52 | 0.1% |
| Mexican | 6,352 | 9.4% |
| Mexican American Indian | 109 | 0.2% |
| Native Hawaiian | 700 | 1.0% |
| Nepalese | 8 | 0.0% |
| Nicaraguan | 39 | 0.1% |
| Nigerian | 172 | 0.3% |
| Northern European | 150 | 0.2% |
| Norwegian | 2,947 | 4.3% |
| Pakistani | 172 | 0.3% |
| Palestinian | 8 | 0.0% |
| Panamanian | 31 | 0.1% |
| Pennsylvania German | 9 | 0.0% |
| Peruvian | 175 | 0.3% |
| Polish | 1,121 | 1.7% |
| Portuguese | 389 | 0.6% |
| Potawatomi | 13 | 0.0% |
| Pueblo | 20 | 0.0% |
| Puerto Rican | 746 | 1.1% |
| Puget Sound Salish | 342 | 0.5% |
| Romanian | 549 | 0.8% |
| Russian | 843 | 1.2% |
| Salvadoran | 92 | 0.1% |
| Samoan | 327 | 0.5% |
| Scandinavian | 667 | 1.0% |
| Scotch-Irish | 320 | 0.5% |
| Scottish | 1,813 | 2.7% |
| Serbian | 54 | 0.1% |
| Sierra Leonean | 9 | 0.0% |
| Slavic | 15 | 0.0% |
| Slovak | 37 | 0.1% |
| Slovene | 14 | 0.0% |
| Somali | 105 | 0.2% |
| South African | 16 | 0.0% |
| South American | 242 | 0.4% |
| South American Indian | 34 | 0.1% |
| Spaniard | 260 | 0.4% |
| Spanish | 230 | 0.3% |
| Sri Lankan | 636 | 0.9% |
| Subsaharan African | 1,094 | 1.6% |
| Swedish | 1,653 | 2.4% |
| Swiss | 196 | 0.3% |
| Thai | 586 | 0.9% |
| Tongan | 43 | 0.1% |
| Trinidadian and Tobagonian | 27 | 0.0% |
| Ukrainian | 969 | 1.4% |
| Welsh | 297 | 0.4% |
| West Indian | 9 | 0.0% |
| Yakama | 33 | 0.1% |
| Yugoslavian | 10 | 0.0% | View All 118 Rows |
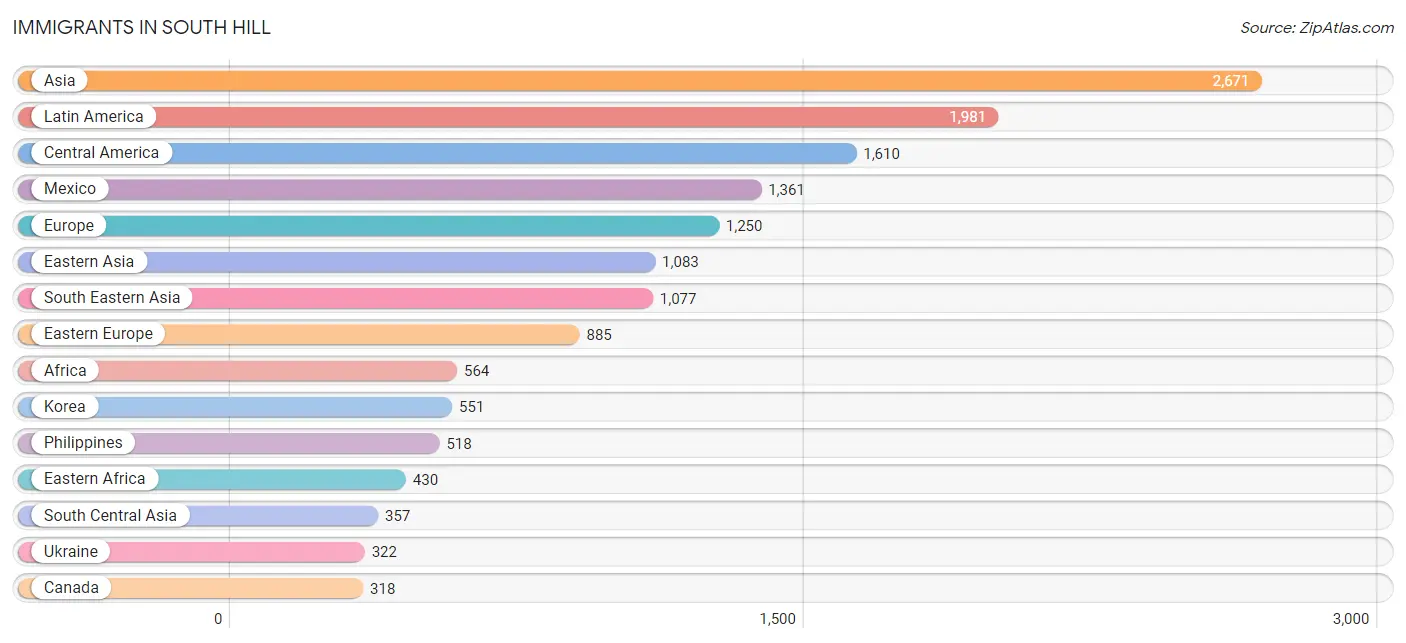
Immigrants in South Hill
The most numerous immigrant groups reported in South Hill came from Asia (2,671 | 3.9%), Latin America (1,981 | 2.9%), Central America (1,610 | 2.4%), Mexico (1,361 | 2.0%), and Europe (1,250 | 1.8%), together accounting for 13.1% of all South Hill residents.
| Immigration Origin | # Population | % Population |
| Africa | 564 | 0.8% |
| Argentina | 22 | 0.0% |
| Asia | 2,671 | 3.9% |
| Australia | 14 | 0.0% |
| Austria | 8 | 0.0% |
| Belarus | 49 | 0.1% |
| Bolivia | 8 | 0.0% |
| Brazil | 25 | 0.0% |
| Cambodia | 284 | 0.4% |
| Canada | 318 | 0.5% |
| Caribbean | 203 | 0.3% |
| Central America | 1,610 | 2.4% |
| China | 275 | 0.4% |
| Colombia | 15 | 0.0% |
| Czechoslovakia | 21 | 0.0% |
| Denmark | 32 | 0.1% |
| Eastern Africa | 430 | 0.6% |
| Eastern Asia | 1,083 | 1.6% |
| Eastern Europe | 885 | 1.3% |
| El Salvador | 121 | 0.2% |
| England | 26 | 0.0% |
| Europe | 1,250 | 1.8% |
| Germany | 203 | 0.3% |
| Haiti | 52 | 0.1% |
| Honduras | 97 | 0.1% |
| Hungary | 31 | 0.1% |
| India | 251 | 0.4% |
| Iraq | 90 | 0.1% |
| Israel | 25 | 0.0% |
| Italy | 32 | 0.1% |
| Jamaica | 124 | 0.2% |
| Japan | 257 | 0.4% |
| Kazakhstan | 16 | 0.0% |
| Kenya | 198 | 0.3% |
| Korea | 551 | 0.8% |
| Latin America | 1,981 | 2.9% |
| Latvia | 8 | 0.0% |
| Lebanon | 39 | 0.1% |
| Lithuania | 6 | 0.0% |
| Malaysia | 49 | 0.1% |
| Mexico | 1,361 | 2.0% |
| Micronesia | 31 | 0.1% |
| Moldova | 281 | 0.4% |
| Netherlands | 8 | 0.0% |
| Northern Europe | 102 | 0.2% |
| Oceania | 59 | 0.1% |
| Pakistan | 73 | 0.1% |
| Panama | 31 | 0.1% |
| Peru | 98 | 0.1% |
| Philippines | 518 | 0.8% |
| Russia | 135 | 0.2% |
| Scotland | 21 | 0.0% |
| Sierra Leone | 20 | 0.0% |
| Somalia | 31 | 0.1% |
| South Africa | 16 | 0.0% |
| South America | 168 | 0.3% |
| South Central Asia | 357 | 0.5% |
| South Eastern Asia | 1,077 | 1.6% |
| Southern Europe | 37 | 0.1% |
| Spain | 5 | 0.0% |
| Sweden | 8 | 0.0% |
| Switzerland | 7 | 0.0% |
| Taiwan | 76 | 0.1% |
| Thailand | 34 | 0.1% |
| Trinidad and Tobago | 27 | 0.0% |
| Uganda | 106 | 0.2% |
| Ukraine | 322 | 0.5% |
| Uzbekistan | 17 | 0.0% |
| Vietnam | 165 | 0.2% |
| Western Africa | 118 | 0.2% |
| Western Asia | 154 | 0.2% |
| Western Europe | 226 | 0.3% |
| Zimbabwe | 31 | 0.1% | View All 73 Rows |
Sex and Age in South Hill
Sex and Age in South Hill
The most populous age groups in South Hill are 15 to 19 Years (3,030 | 8.8%) for men and 5 to 9 Years (2,638 | 7.9%) for women.
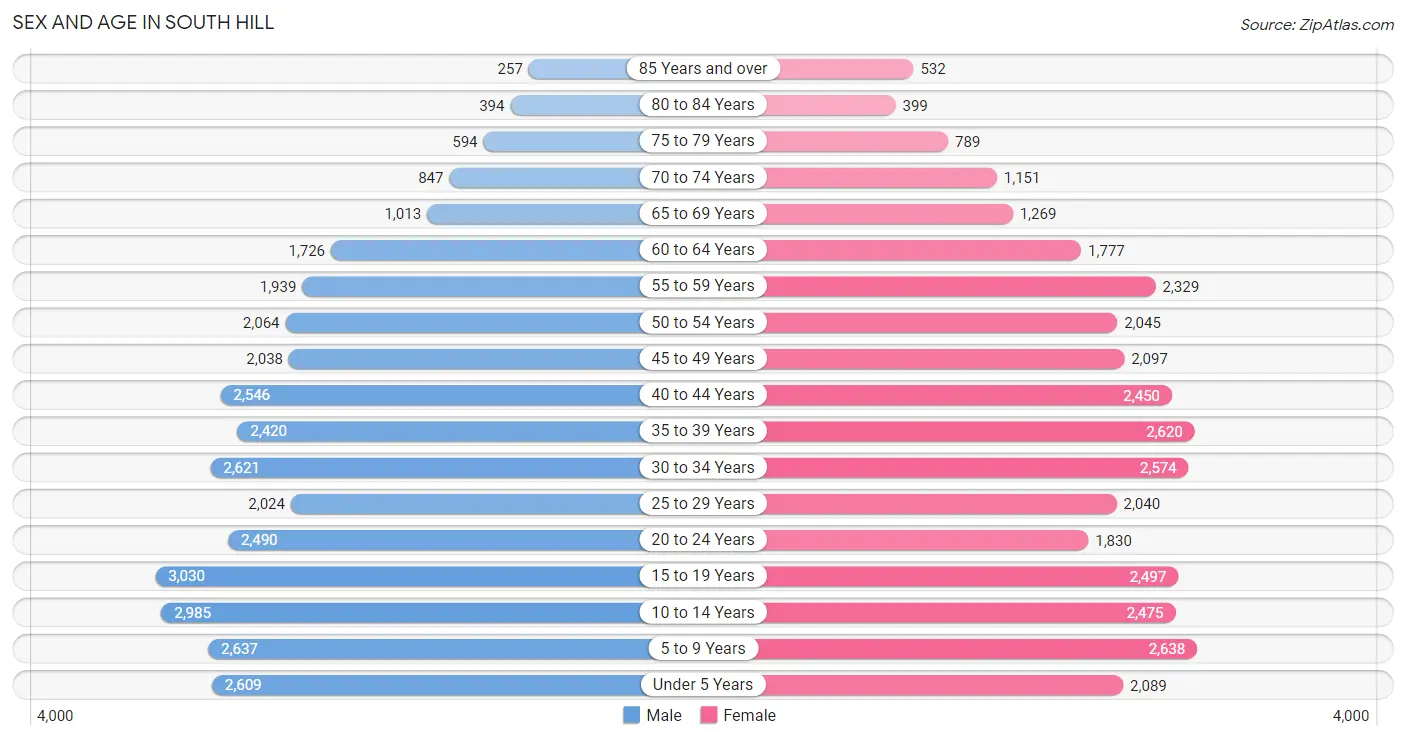
| Age Bracket | Male | Female |
| Under 5 Years | 2,609 (7.6%) | 2,089 (6.2%) |
| 5 to 9 Years | 2,637 (7.7%) | 2,638 (7.9%) |
| 10 to 14 Years | 2,985 (8.7%) | 2,475 (7.4%) |
| 15 to 19 Years | 3,030 (8.8%) | 2,497 (7.4%) |
| 20 to 24 Years | 2,490 (7.3%) | 1,830 (5.4%) |
| 25 to 29 Years | 2,024 (5.9%) | 2,040 (6.1%) |
| 30 to 34 Years | 2,621 (7.7%) | 2,574 (7.7%) |
| 35 to 39 Years | 2,420 (7.1%) | 2,620 (7.8%) |
| 40 to 44 Years | 2,546 (7.4%) | 2,450 (7.3%) |
| 45 to 49 Years | 2,038 (5.9%) | 2,097 (6.2%) |
| 50 to 54 Years | 2,064 (6.0%) | 2,045 (6.1%) |
| 55 to 59 Years | 1,939 (5.7%) | 2,329 (6.9%) |
| 60 to 64 Years | 1,726 (5.0%) | 1,777 (5.3%) |
| 65 to 69 Years | 1,013 (3.0%) | 1,269 (3.8%) |
| 70 to 74 Years | 847 (2.5%) | 1,151 (3.4%) |
| 75 to 79 Years | 594 (1.7%) | 789 (2.4%) |
| 80 to 84 Years | 394 (1.1%) | 399 (1.2%) |
| 85 Years and over | 257 (0.7%) | 532 (1.6%) |
| Total | 34,234 (100.0%) | 33,601 (100.0%) |
Families and Households in South Hill
Median Family Size in South Hill
The median family size in South Hill is 3.29 persons per family, with married-couple families (12,923 | 71.2%) accounting for the largest median family size of 3.39 persons per family. On the other hand, single male/father families (1,604 | 8.8%) represent the smallest median family size with 2.64 persons per family.
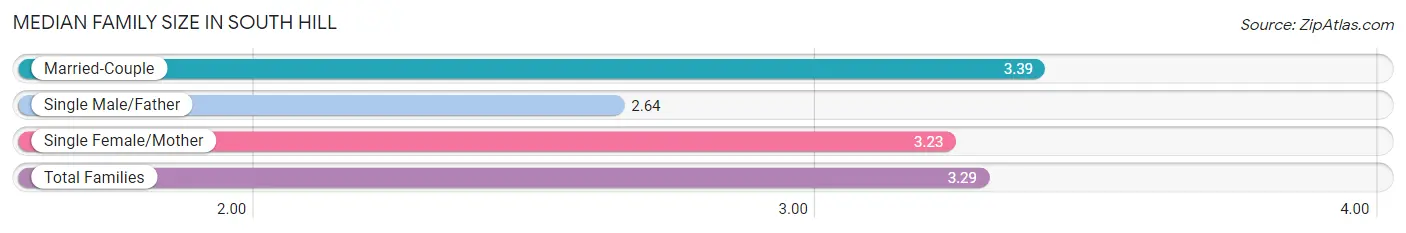
| Family Type | # Families | Family Size |
| Married-Couple | 12,923 (71.2%) | 3.39 |
| Single Male/Father | 1,604 (8.8%) | 2.64 |
| Single Female/Mother | 3,624 (20.0%) | 3.23 |
| Total Families | 18,151 (100.0%) | 3.29 |
Median Household Size in South Hill
The median household size in South Hill is 3.03 persons per household, with single female/mother households (3,624 | 16.2%) accounting for the largest median household size of 3.5 persons per household. non-family households (4,173 | 18.7%) represent the smallest median household size with 1.36 persons per household.
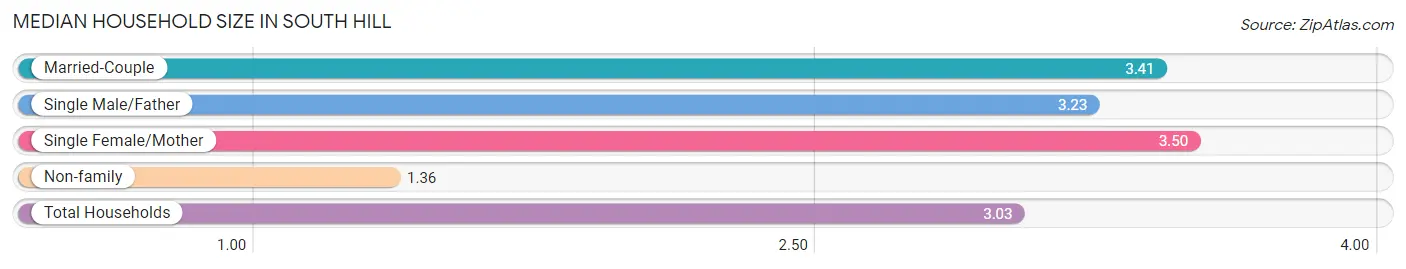
| Household Type | # Households | Household Size |
| Married-Couple | 12,923 (57.9%) | 3.41 |
| Single Male/Father | 1,604 (7.2%) | 3.23 |
| Single Female/Mother | 3,624 (16.2%) | 3.50 |
| Non-family | 4,173 (18.7%) | 1.36 |
| Total Households | 22,324 (100.0%) | 3.03 |
Household Size by Marriage Status in South Hill
Out of a total of 22,324 households in South Hill, 18,151 (81.3%) are family households, while 4,173 (18.7%) are nonfamily households. The most numerous type of family households are 2-person households, comprising 6,237, and the most common type of nonfamily households are 1-person households, comprising 2,908.
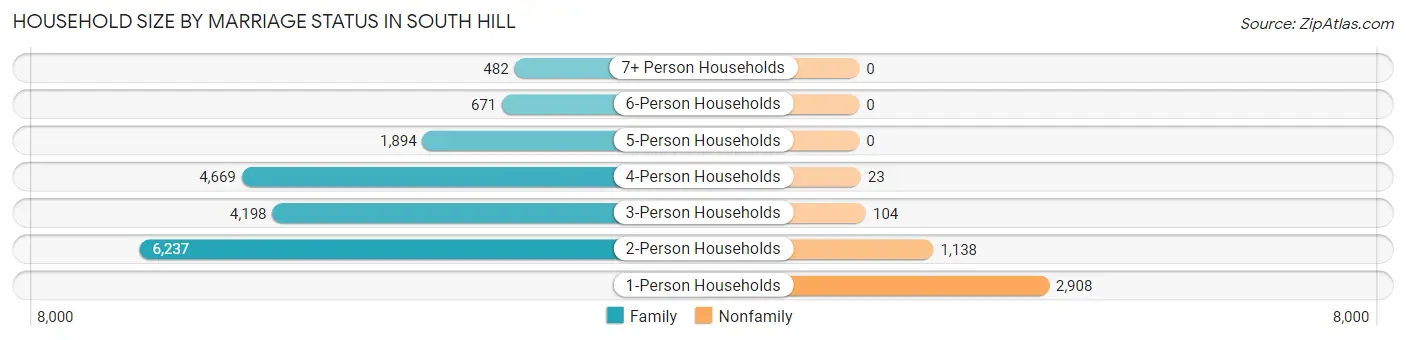
| Household Size | Family Households | Nonfamily Households |
| 1-Person Households | - | 2,908 (13.0%) |
| 2-Person Households | 6,237 (27.9%) | 1,138 (5.1%) |
| 3-Person Households | 4,198 (18.8%) | 104 (0.5%) |
| 4-Person Households | 4,669 (20.9%) | 23 (0.1%) |
| 5-Person Households | 1,894 (8.5%) | 0 (0.0%) |
| 6-Person Households | 671 (3.0%) | 0 (0.0%) |
| 7+ Person Households | 482 (2.2%) | 0 (0.0%) |
| Total | 18,151 (81.3%) | 4,173 (18.7%) |
Female Fertility in South Hill
Fertility by Age in South Hill
Average fertility rate in South Hill is 68.0 births per 1,000 women. Women in the age bracket of 20 to 34 years have the highest fertility rate with 131.0 births per 1,000 women. Women in the age bracket of 20 to 34 years acount for 74.9% of all women with births.
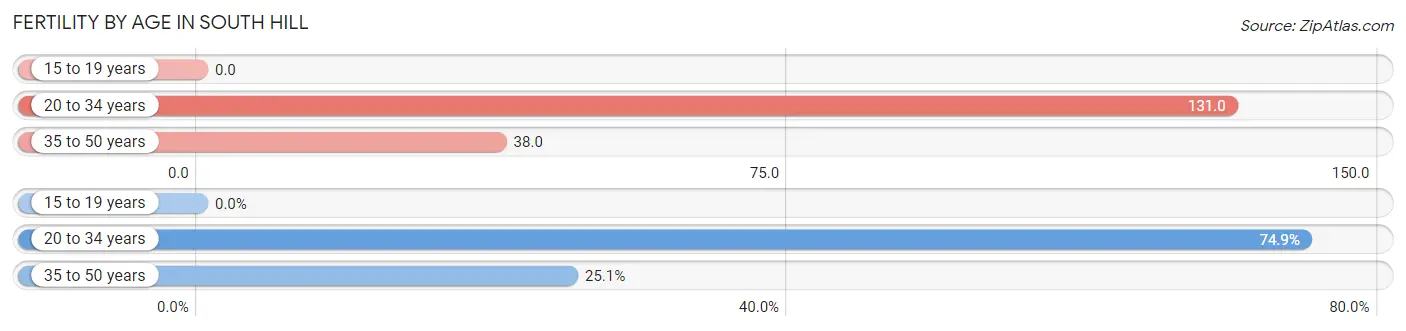
| Age Bracket | Women with Births | Births / 1,000 Women |
| 15 to 19 years | 0 (0.0%) | 0.0 |
| 20 to 34 years | 841 (74.9%) | 131.0 |
| 35 to 50 years | 282 (25.1%) | 38.0 |
| Total | 1,123 (100.0%) | 68.0 |
Fertility by Age by Marriage Status in South Hill
78.7% of women with births (1,123) in South Hill are married. The highest percentage of unmarried women with births falls into 20 to 34 years age bracket with 26.9% of them unmarried at the time of birth, while the lowest percentage of unmarried women with births belong to 35 to 50 years age bracket with 4.6% of them unmarried.
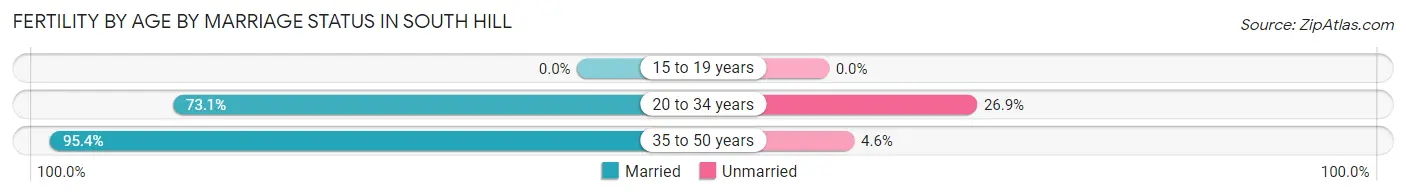
| Age Bracket | Married | Unmarried |
| 15 to 19 years | 0 (0.0%) | 0 (0.0%) |
| 20 to 34 years | 615 (73.1%) | 226 (26.9%) |
| 35 to 50 years | 269 (95.4%) | 13 (4.6%) |
| Total | 884 (78.7%) | 239 (21.3%) |
Fertility by Education in South Hill
Average fertility rate in South Hill is 68.0 births per 1,000 women. Women with the education attainment of college or associate's degree have the highest fertility rate of 89.0 births per 1,000 women, while women with the education attainment of less than high school have the lowest fertility at 19.0 births per 1,000 women. Women with the education attainment of college or associate's degree represent 45.0% of all women with births.
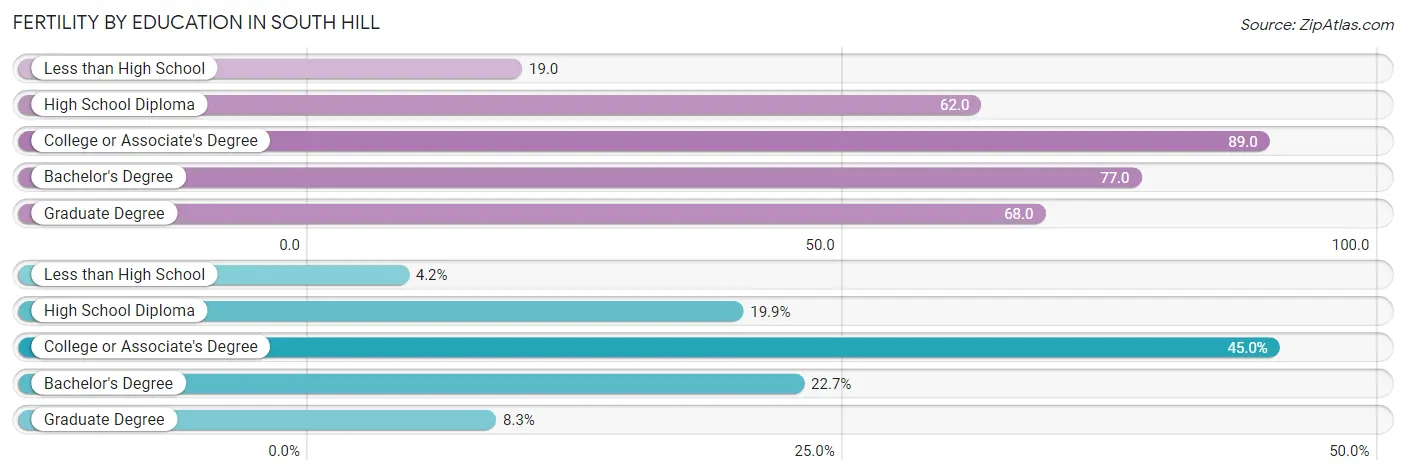
| Educational Attainment | Women with Births | Births / 1,000 Women |
| Less than High School | 47 (4.2%) | 19.0 |
| High School Diploma | 223 (19.9%) | 62.0 |
| College or Associate's Degree | 505 (45.0%) | 89.0 |
| Bachelor's Degree | 255 (22.7%) | 77.0 |
| Graduate Degree | 93 (8.3%) | 68.0 |
| Total | 1,123 (100.0%) | 68.0 |
Fertility by Education by Marriage Status in South Hill
21.3% of women with births in South Hill are unmarried. Women with the educational attainment of graduate degree are most likely to be married with 100.0% of them married at childbirth, while women with the educational attainment of high school diploma are least likely to be married with 52.0% of them unmarried at childbirth.
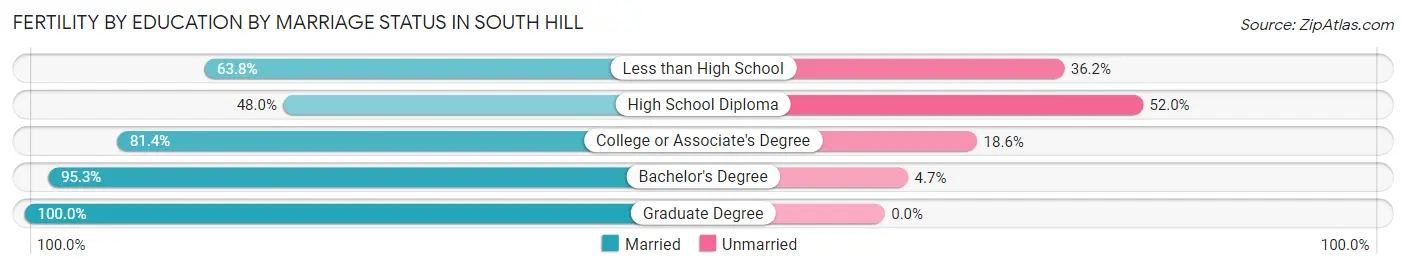
| Educational Attainment | Married | Unmarried |
| Less than High School | 30 (63.8%) | 17 (36.2%) |
| High School Diploma | 107 (48.0%) | 116 (52.0%) |
| College or Associate's Degree | 411 (81.4%) | 94 (18.6%) |
| Bachelor's Degree | 243 (95.3%) | 12 (4.7%) |
| Graduate Degree | 93 (100.0%) | 0 (0.0%) |
| Total | 884 (78.7%) | 239 (21.3%) |
Employment Characteristics in South Hill
Employment by Class of Employer in South Hill
Among the 33,236 employed individuals in South Hill, private company employees (21,679 | 65.2%), local government employees (3,798 | 11.4%), and not-for-profit organizations (2,413 | 7.3%) make up the most common classes of employment.
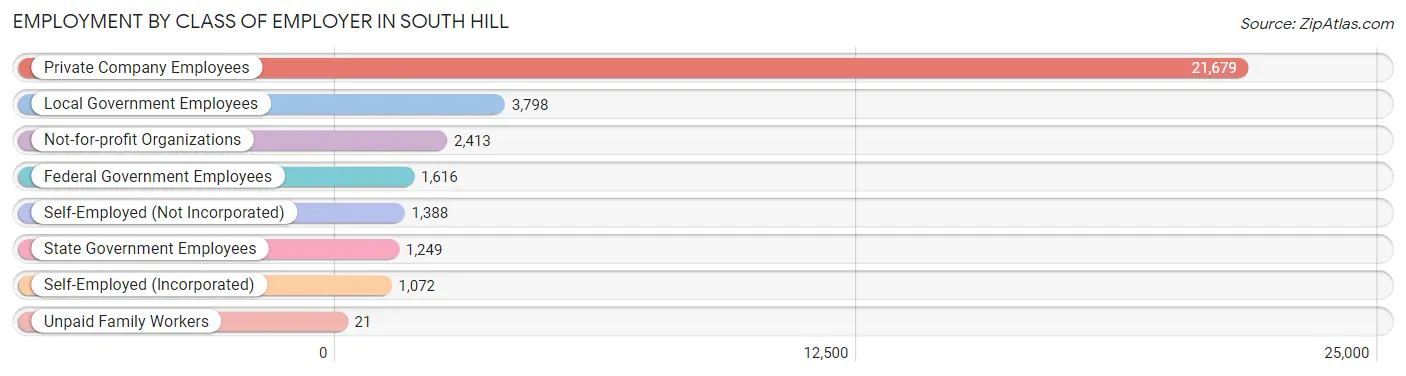
| Employer Class | # Employees | % Employees |
| Private Company Employees | 21,679 | 65.2% |
| Self-Employed (Incorporated) | 1,072 | 3.2% |
| Self-Employed (Not Incorporated) | 1,388 | 4.2% |
| Not-for-profit Organizations | 2,413 | 7.3% |
| Local Government Employees | 3,798 | 11.4% |
| State Government Employees | 1,249 | 3.8% |
| Federal Government Employees | 1,616 | 4.9% |
| Unpaid Family Workers | 21 | 0.1% |
| Total | 33,236 | 100.0% |
Employment Status by Age in South Hill
According to the labor force statistics for South Hill, out of the total population over 16 years of age (50,953), 70.0% or 35,667 individuals are in the labor force, with 4.6% or 1,641 of them unemployed. The age group with the highest labor force participation rate is 25 to 29 years, with 89.2% or 3,625 individuals in the labor force. Within the labor force, the 16 to 19 years age range has the highest percentage of unemployed individuals, with 15.7% or 245 of them being unemployed.
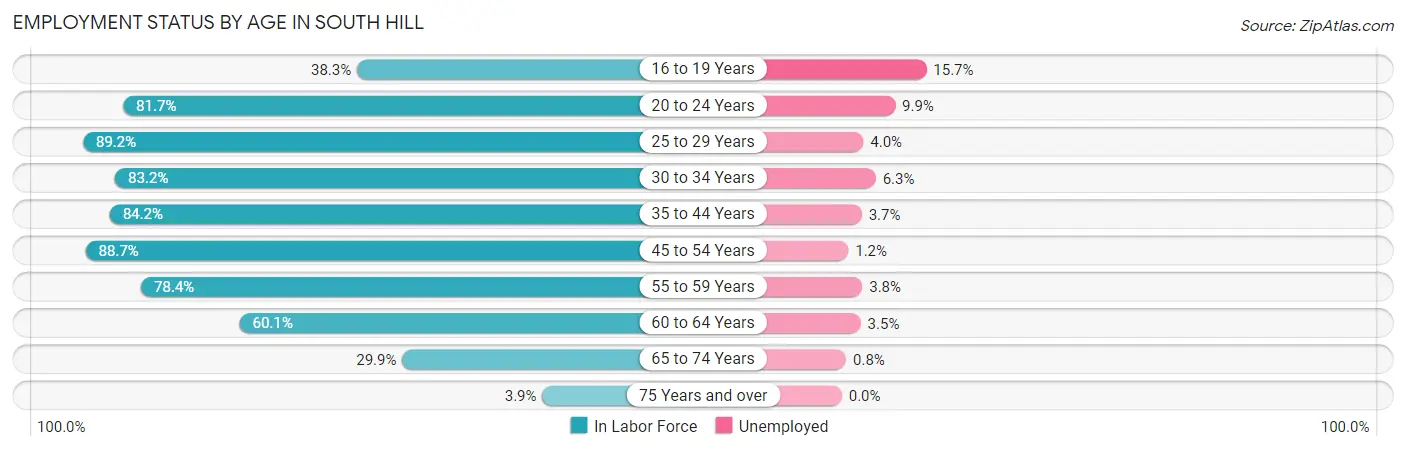
| Age Bracket | In Labor Force | Unemployed |
| 16 to 19 Years | 1,562 (38.3%) | 245 (15.7%) |
| 20 to 24 Years | 3,529 (81.7%) | 349 (9.9%) |
| 25 to 29 Years | 3,625 (89.2%) | 145 (4.0%) |
| 30 to 34 Years | 4,322 (83.2%) | 272 (6.3%) |
| 35 to 44 Years | 8,450 (84.2%) | 313 (3.7%) |
| 45 to 54 Years | 7,312 (88.7%) | 88 (1.2%) |
| 55 to 59 Years | 3,346 (78.4%) | 127 (3.8%) |
| 60 to 64 Years | 2,105 (60.1%) | 74 (3.5%) |
| 65 to 74 Years | 1,280 (29.9%) | 10 (0.8%) |
| 75 Years and over | 116 (3.9%) | 0 (0.0%) |
| Total | 35,667 (70.0%) | 1,641 (4.6%) |
Employment Status by Educational Attainment in South Hill
According to labor force statistics for South Hill, 82.6% of individuals (29,166) out of the total population between 25 and 64 years of age (35,310) are in the labor force, with 3.5% or 1,021 of them being unemployed. The group with the highest labor force participation rate are those with the educational attainment of bachelor's degree or higher, with 86.3% or 9,205 individuals in the labor force. Within the labor force, individuals with high school diploma education have the highest percentage of unemployment, with 4.4% or 314 of them being unemployed.
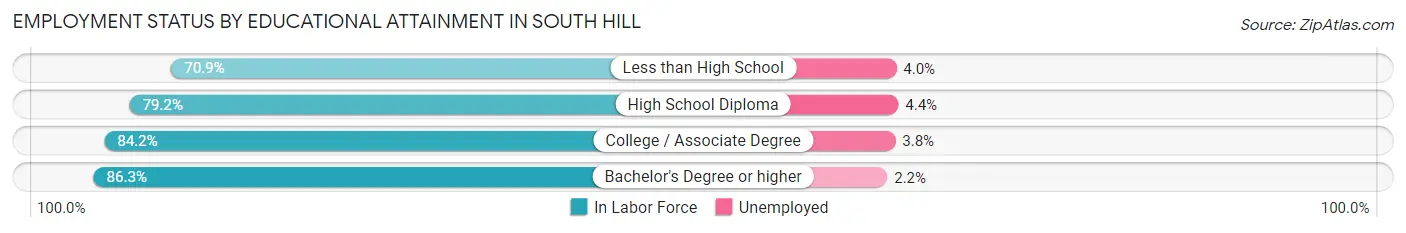
| Educational Attainment | In Labor Force | Unemployed |
| Less than High School | 1,828 (70.9%) | 103 (4.0%) |
| High School Diploma | 7,130 (79.2%) | 396 (4.4%) |
| College / Associate Degree | 10,999 (84.2%) | 496 (3.8%) |
| Bachelor's Degree or higher | 9,205 (86.3%) | 235 (2.2%) |
| Total | 29,166 (82.6%) | 1,236 (3.5%) |
Employment Occupations by Sex in South Hill
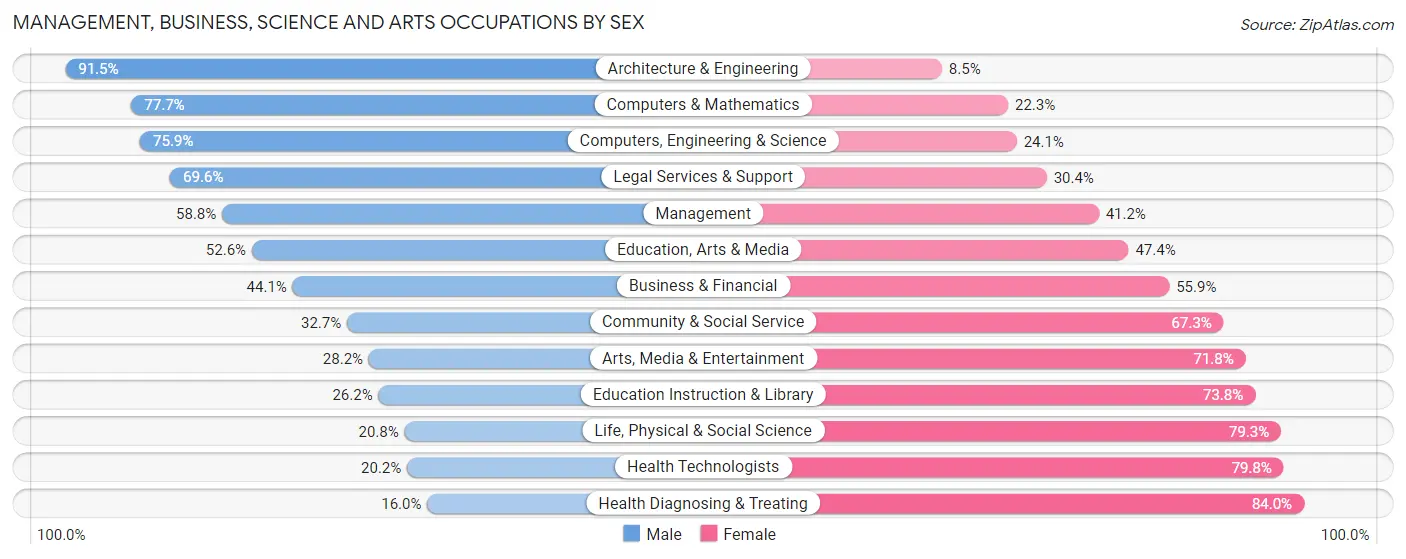
Management, Business, Science and Arts Occupations
The most common Management, Business, Science and Arts occupations in South Hill are Community & Social Service (3,891 | 11.7%), Management (3,716 | 11.1%), Education Instruction & Library (2,609 | 7.8%), Health Diagnosing & Treating (1,976 | 5.9%), and Business & Financial (1,706 | 5.1%).
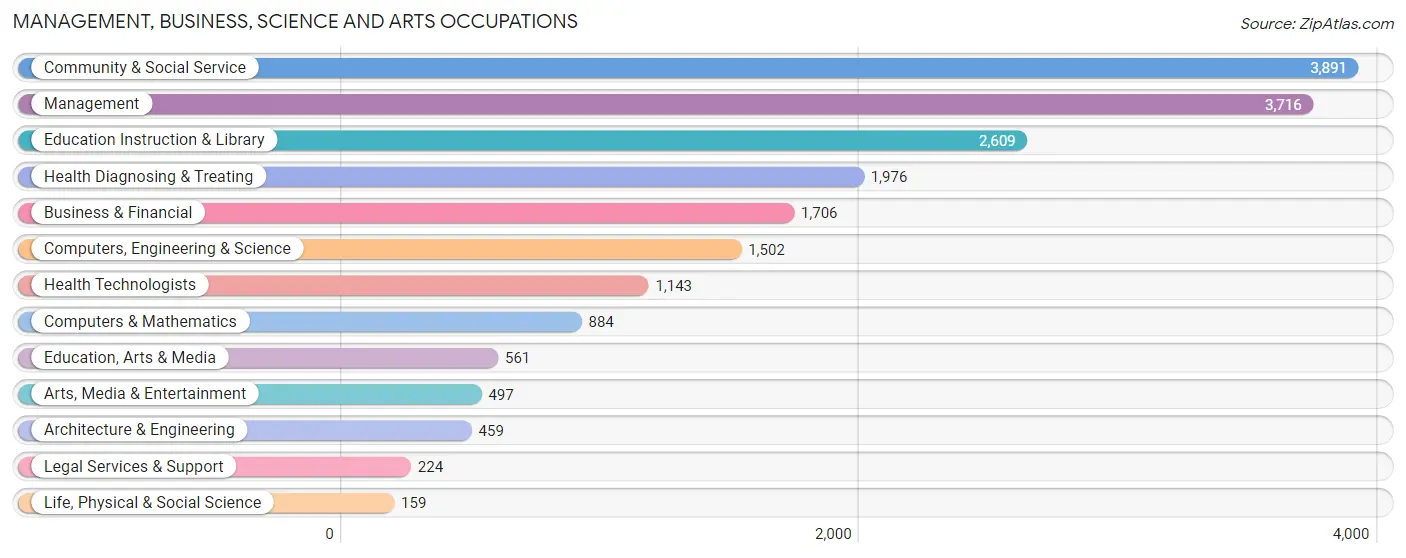
Management, Business, Science and Arts Occupations by Sex
Within the Management, Business, Science and Arts occupations in South Hill, the most male-oriented occupations are Architecture & Engineering (91.5%), Computers & Mathematics (77.7%), and Computers, Engineering & Science (75.9%), while the most female-oriented occupations are Health Diagnosing & Treating (84.0%), Health Technologists (79.8%), and Life, Physical & Social Science (79.2%).
| Occupation | Male | Female |
| Management | 2,185 (58.8%) | 1,531 (41.2%) |
| Business & Financial | 752 (44.1%) | 954 (55.9%) |
| Computers, Engineering & Science | 1,140 (75.9%) | 362 (24.1%) |
| Computers & Mathematics | 687 (77.7%) | 197 (22.3%) |
| Architecture & Engineering | 420 (91.5%) | 39 (8.5%) |
| Life, Physical & Social Science | 33 (20.7%) | 126 (79.2%) |
| Community & Social Service | 1,274 (32.7%) | 2,617 (67.3%) |
| Education, Arts & Media | 295 (52.6%) | 266 (47.4%) |
| Legal Services & Support | 156 (69.6%) | 68 (30.4%) |
| Education Instruction & Library | 683 (26.2%) | 1,926 (73.8%) |
| Arts, Media & Entertainment | 140 (28.2%) | 357 (71.8%) |
| Health Diagnosing & Treating | 316 (16.0%) | 1,660 (84.0%) |
| Health Technologists | 231 (20.2%) | 912 (79.8%) |
| Total (Category) | 5,667 (44.3%) | 7,124 (55.7%) |
| Total (Overall) | 17,572 (52.6%) | 15,830 (47.4%) |
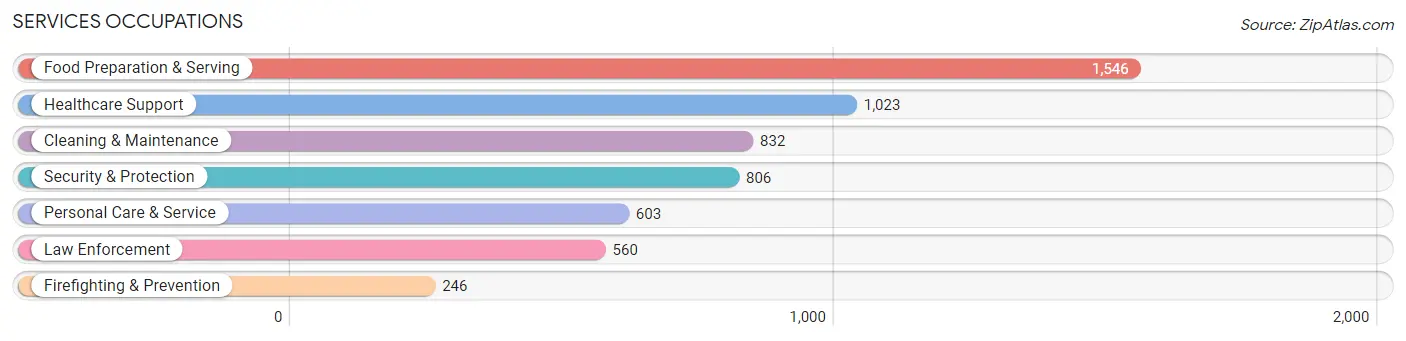
Services Occupations
The most common Services occupations in South Hill are Food Preparation & Serving (1,546 | 4.6%), Healthcare Support (1,023 | 3.1%), Cleaning & Maintenance (832 | 2.5%), Security & Protection (806 | 2.4%), and Personal Care & Service (603 | 1.8%).
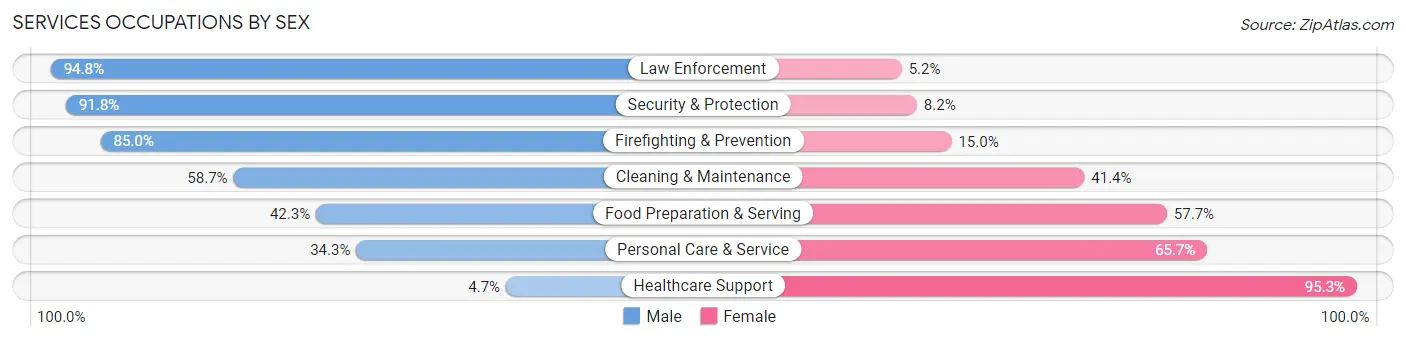
Services Occupations by Sex
Within the Services occupations in South Hill, the most male-oriented occupations are Law Enforcement (94.8%), Security & Protection (91.8%), and Firefighting & Prevention (85.0%), while the most female-oriented occupations are Healthcare Support (95.3%), Personal Care & Service (65.7%), and Food Preparation & Serving (57.7%).
| Occupation | Male | Female |
| Healthcare Support | 48 (4.7%) | 975 (95.3%) |
| Security & Protection | 740 (91.8%) | 66 (8.2%) |
| Firefighting & Prevention | 209 (85.0%) | 37 (15.0%) |
| Law Enforcement | 531 (94.8%) | 29 (5.2%) |
| Food Preparation & Serving | 654 (42.3%) | 892 (57.7%) |
| Cleaning & Maintenance | 488 (58.7%) | 344 (41.3%) |
| Personal Care & Service | 207 (34.3%) | 396 (65.7%) |
| Total (Category) | 2,137 (44.4%) | 2,673 (55.6%) |
| Total (Overall) | 17,572 (52.6%) | 15,830 (47.4%) |
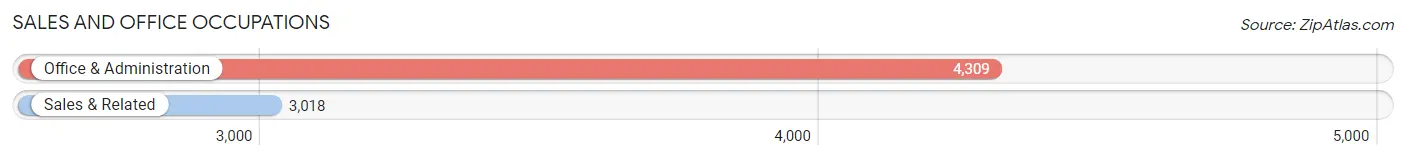
Sales and Office Occupations
The most common Sales and Office occupations in South Hill are Office & Administration (4,309 | 12.9%), and Sales & Related (3,018 | 9.0%).
Sales and Office Occupations by Sex
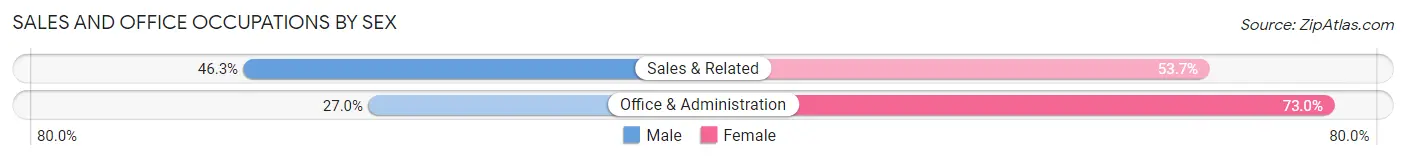
| Occupation | Male | Female |
| Sales & Related | 1,396 (46.3%) | 1,622 (53.7%) |
| Office & Administration | 1,165 (27.0%) | 3,144 (73.0%) |
| Total (Category) | 2,561 (34.9%) | 4,766 (65.0%) |
| Total (Overall) | 17,572 (52.6%) | 15,830 (47.4%) |
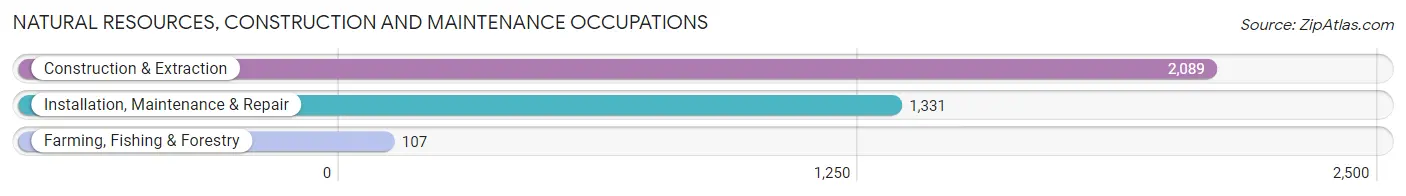
Natural Resources, Construction and Maintenance Occupations
The most common Natural Resources, Construction and Maintenance occupations in South Hill are Construction & Extraction (2,089 | 6.2%), Installation, Maintenance & Repair (1,331 | 4.0%), and Farming, Fishing & Forestry (107 | 0.3%).
Natural Resources, Construction and Maintenance Occupations by Sex
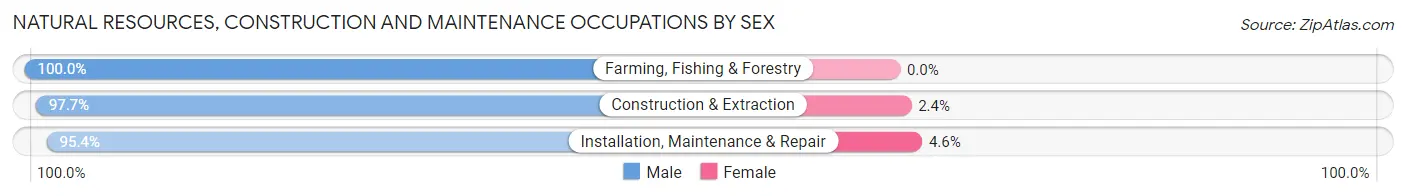
| Occupation | Male | Female |
| Farming, Fishing & Forestry | 107 (100.0%) | 0 (0.0%) |
| Construction & Extraction | 2,040 (97.7%) | 49 (2.4%) |
| Installation, Maintenance & Repair | 1,270 (95.4%) | 61 (4.6%) |
| Total (Category) | 3,417 (96.9%) | 110 (3.1%) |
| Total (Overall) | 17,572 (52.6%) | 15,830 (47.4%) |
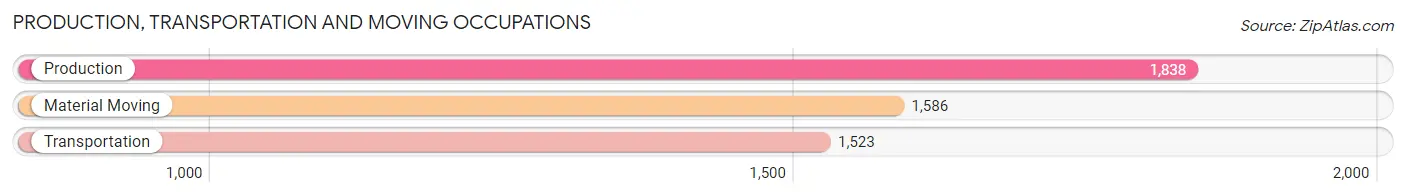
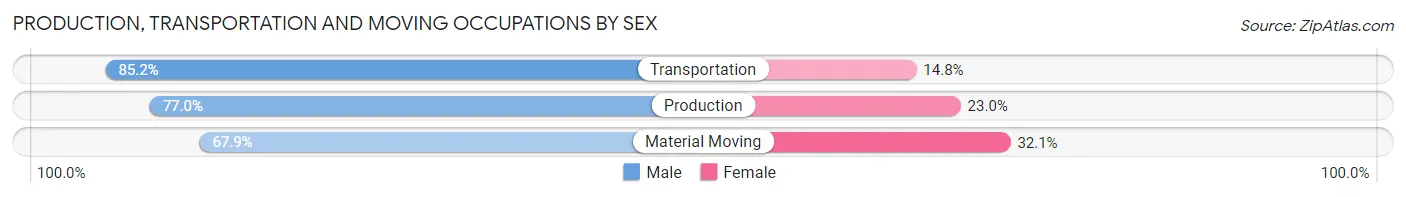
Production, Transportation and Moving Occupations
The most common Production, Transportation and Moving occupations in South Hill are Production (1,838 | 5.5%), Material Moving (1,586 | 4.8%), and Transportation (1,523 | 4.6%).
Production, Transportation and Moving Occupations by Sex
| Occupation | Male | Female |
| Production | 1,416 (77.0%) | 422 (23.0%) |
| Transportation | 1,297 (85.2%) | 226 (14.8%) |
| Material Moving | 1,077 (67.9%) | 509 (32.1%) |
| Total (Category) | 3,790 (76.6%) | 1,157 (23.4%) |
| Total (Overall) | 17,572 (52.6%) | 15,830 (47.4%) |
Employment Industries by Sex in South Hill
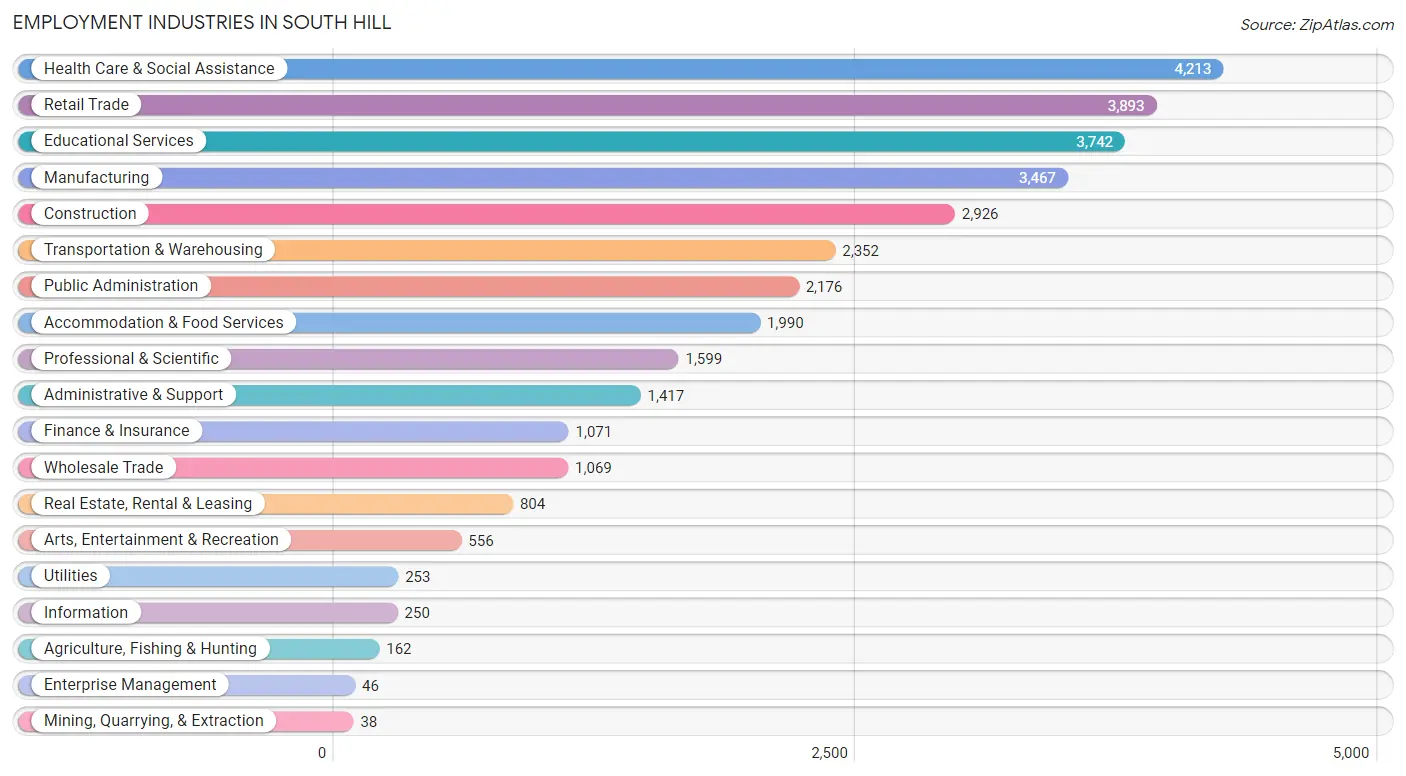
Employment Industries in South Hill
The major employment industries in South Hill include Health Care & Social Assistance (4,213 | 12.6%), Retail Trade (3,893 | 11.7%), Educational Services (3,742 | 11.2%), Manufacturing (3,467 | 10.4%), and Construction (2,926 | 8.8%).
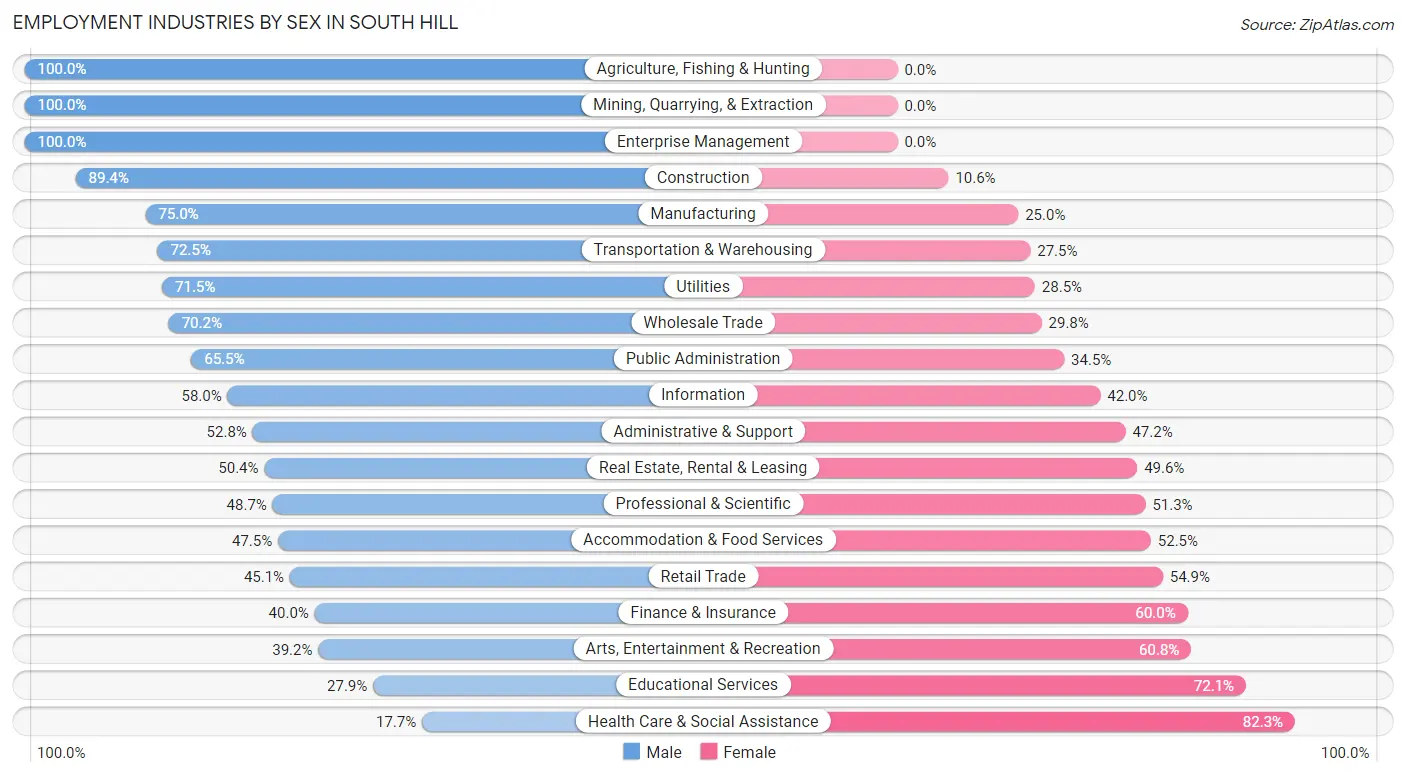
Employment Industries by Sex in South Hill
The South Hill industries that see more men than women are Agriculture, Fishing & Hunting (100.0%), Mining, Quarrying, & Extraction (100.0%), and Enterprise Management (100.0%), whereas the industries that tend to have a higher number of women are Health Care & Social Assistance (82.3%), Educational Services (72.1%), and Arts, Entertainment & Recreation (60.8%).
| Industry | Male | Female |
| Agriculture, Fishing & Hunting | 162 (100.0%) | 0 (0.0%) |
| Mining, Quarrying, & Extraction | 38 (100.0%) | 0 (0.0%) |
| Construction | 2,617 (89.4%) | 309 (10.6%) |
| Manufacturing | 2,600 (75.0%) | 867 (25.0%) |
| Wholesale Trade | 750 (70.2%) | 319 (29.8%) |
| Retail Trade | 1,755 (45.1%) | 2,138 (54.9%) |
| Transportation & Warehousing | 1,705 (72.5%) | 647 (27.5%) |
| Utilities | 181 (71.5%) | 72 (28.5%) |
| Information | 145 (58.0%) | 105 (42.0%) |
| Finance & Insurance | 428 (40.0%) | 643 (60.0%) |
| Real Estate, Rental & Leasing | 405 (50.4%) | 399 (49.6%) |
| Professional & Scientific | 778 (48.7%) | 821 (51.3%) |
| Enterprise Management | 46 (100.0%) | 0 (0.0%) |
| Administrative & Support | 748 (52.8%) | 669 (47.2%) |
| Educational Services | 1,043 (27.9%) | 2,699 (72.1%) |
| Health Care & Social Assistance | 747 (17.7%) | 3,466 (82.3%) |
| Arts, Entertainment & Recreation | 218 (39.2%) | 338 (60.8%) |
| Accommodation & Food Services | 946 (47.5%) | 1,044 (52.5%) |
| Public Administration | 1,425 (65.5%) | 751 (34.5%) |
| Total | 17,572 (52.6%) | 15,830 (47.4%) |
Education in South Hill
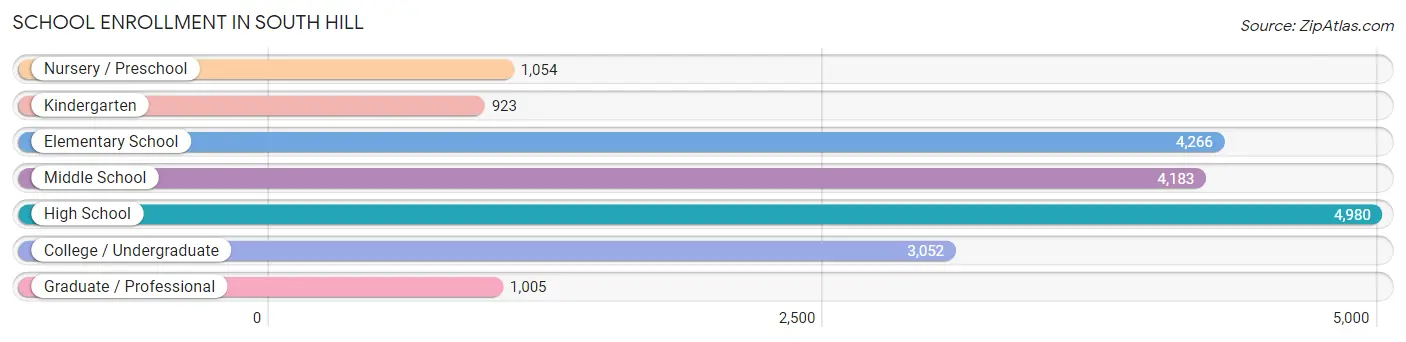
School Enrollment in South Hill
The most common levels of schooling among the 19,463 students in South Hill are high school (4,980 | 25.6%), elementary school (4,266 | 21.9%), and middle school (4,183 | 21.5%).
| School Level | # Students | % Students |
| Nursery / Preschool | 1,054 | 5.4% |
| Kindergarten | 923 | 4.7% |
| Elementary School | 4,266 | 21.9% |
| Middle School | 4,183 | 21.5% |
| High School | 4,980 | 25.6% |
| College / Undergraduate | 3,052 | 15.7% |
| Graduate / Professional | 1,005 | 5.2% |
| Total | 19,463 | 100.0% |
School Enrollment by Age by Funding Source in South Hill
Out of a total of 19,463 students who are enrolled in schools in South Hill, 2,978 (15.3%) attend a private institution, while the remaining 16,485 (84.7%) are enrolled in public schools. The age group of 3 to 4 year olds has the highest likelihood of being enrolled in private schools, with 517 (63.2% in the age bracket) enrolled. Conversely, the age group of 15 to 17 year olds has the lowest likelihood of being enrolled in a private school, with 3,412 (91.3% in the age bracket) attending a public institution.
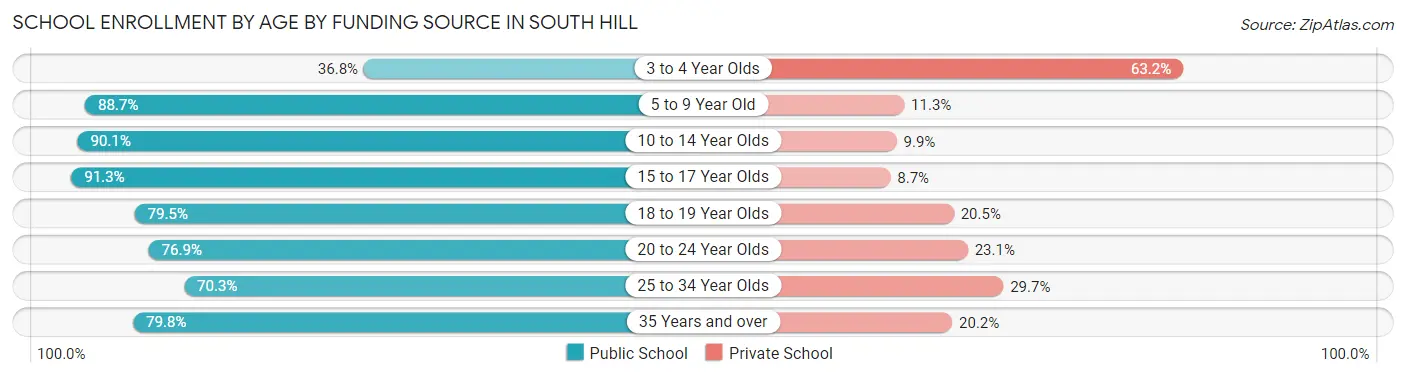
| Age Bracket | Public School | Private School |
| 3 to 4 Year Olds | 301 (36.8%) | 517 (63.2%) |
| 5 to 9 Year Old | 4,360 (88.7%) | 554 (11.3%) |
| 10 to 14 Year Olds | 4,863 (90.1%) | 532 (9.9%) |
| 15 to 17 Year Olds | 3,412 (91.3%) | 325 (8.7%) |
| 18 to 19 Year Olds | 865 (79.5%) | 223 (20.5%) |
| 20 to 24 Year Olds | 845 (76.9%) | 254 (23.1%) |
| 25 to 34 Year Olds | 700 (70.3%) | 296 (29.7%) |
| 35 Years and over | 1,130 (79.8%) | 286 (20.2%) |
| Total | 16,485 (84.7%) | 2,978 (15.3%) |
Educational Attainment by Field of Study in South Hill
Business (2,898 | 20.7%), education (1,716 | 12.2%), science & technology (1,369 | 9.8%), arts & humanities (1,317 | 9.4%), and social sciences (1,014 | 7.2%) are the most common fields of study among 14,020 individuals in South Hill who have obtained a bachelor's degree or higher.
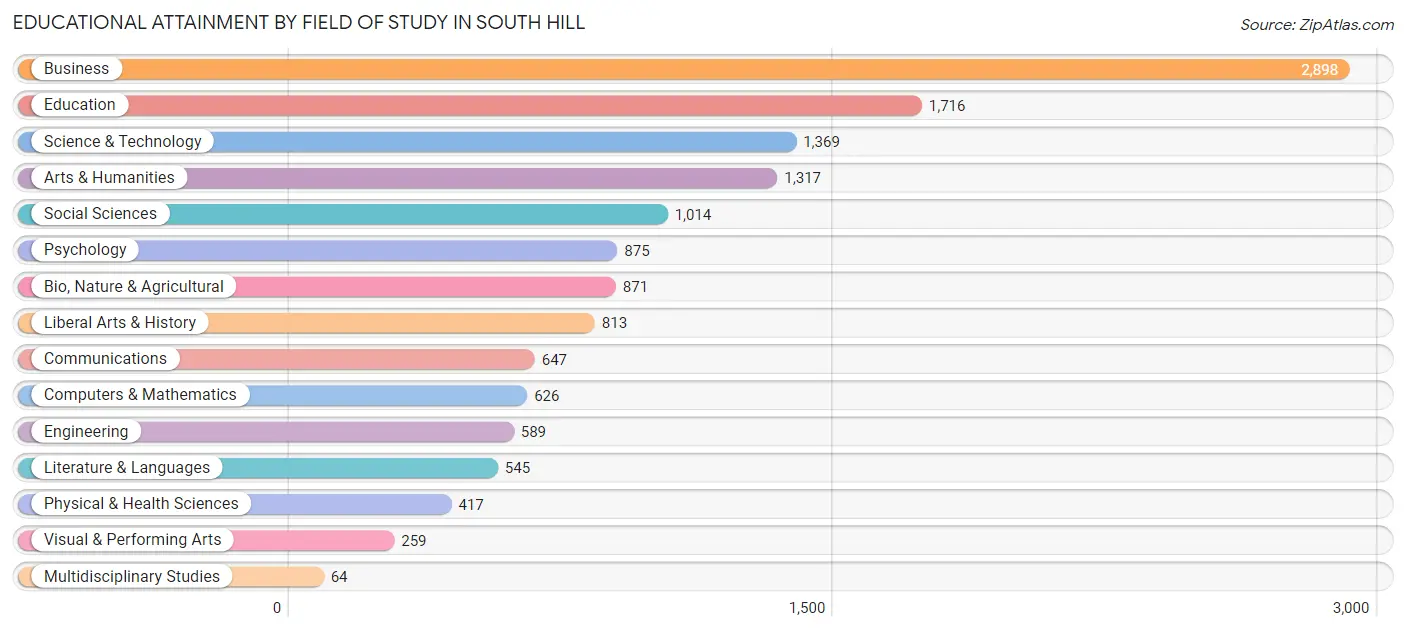
| Field of Study | # Graduates | % Graduates |
| Computers & Mathematics | 626 | 4.5% |
| Bio, Nature & Agricultural | 871 | 6.2% |
| Physical & Health Sciences | 417 | 3.0% |
| Psychology | 875 | 6.2% |
| Social Sciences | 1,014 | 7.2% |
| Engineering | 589 | 4.2% |
| Multidisciplinary Studies | 64 | 0.5% |
| Science & Technology | 1,369 | 9.8% |
| Business | 2,898 | 20.7% |
| Education | 1,716 | 12.2% |
| Literature & Languages | 545 | 3.9% |
| Liberal Arts & History | 813 | 5.8% |
| Visual & Performing Arts | 259 | 1.8% |
| Communications | 647 | 4.6% |
| Arts & Humanities | 1,317 | 9.4% |
| Total | 14,020 | 100.0% |
Transportation & Commute in South Hill
Vehicle Availability by Sex in South Hill
The most prevalent vehicle ownership categories in South Hill are males with 2 vehicles (8,010, accounting for 44.9%) and females with 2 vehicles (6,952, making up 52.0%).
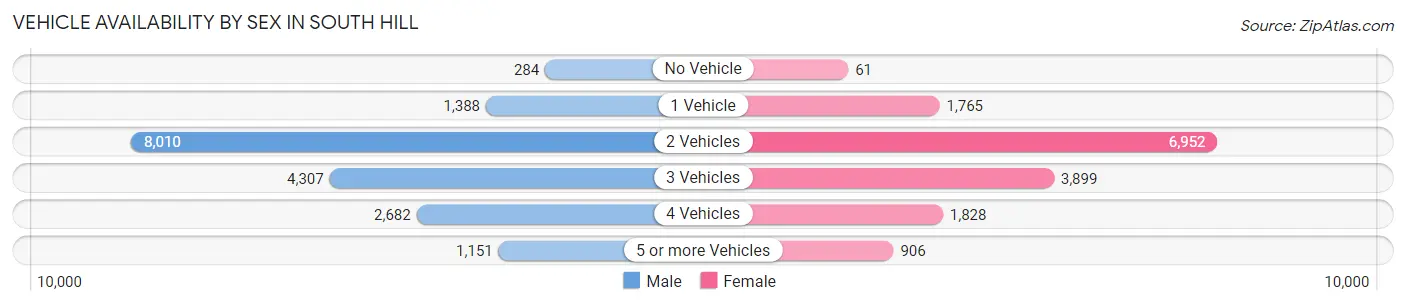
| Vehicles Available | Male | Female |
| No Vehicle | 284 (1.6%) | 61 (0.4%) |
| 1 Vehicle | 1,388 (7.8%) | 1,765 (11.5%) |
| 2 Vehicles | 8,010 (44.9%) | 6,952 (45.1%) |
| 3 Vehicles | 4,307 (24.2%) | 3,899 (25.3%) |
| 4 Vehicles | 2,682 (15.0%) | 1,828 (11.9%) |
| 5 or more Vehicles | 1,151 (6.5%) | 906 (5.9%) |
| Total | 17,822 (100.0%) | 15,411 (100.0%) |
Commute Time in South Hill
The most frequently occuring commute durations in South Hill are 30 to 34 minutes (4,565 commuters, 15.4%), 45 to 59 minutes (4,206 commuters, 14.2%), and 20 to 24 minutes (3,333 commuters, 11.2%).
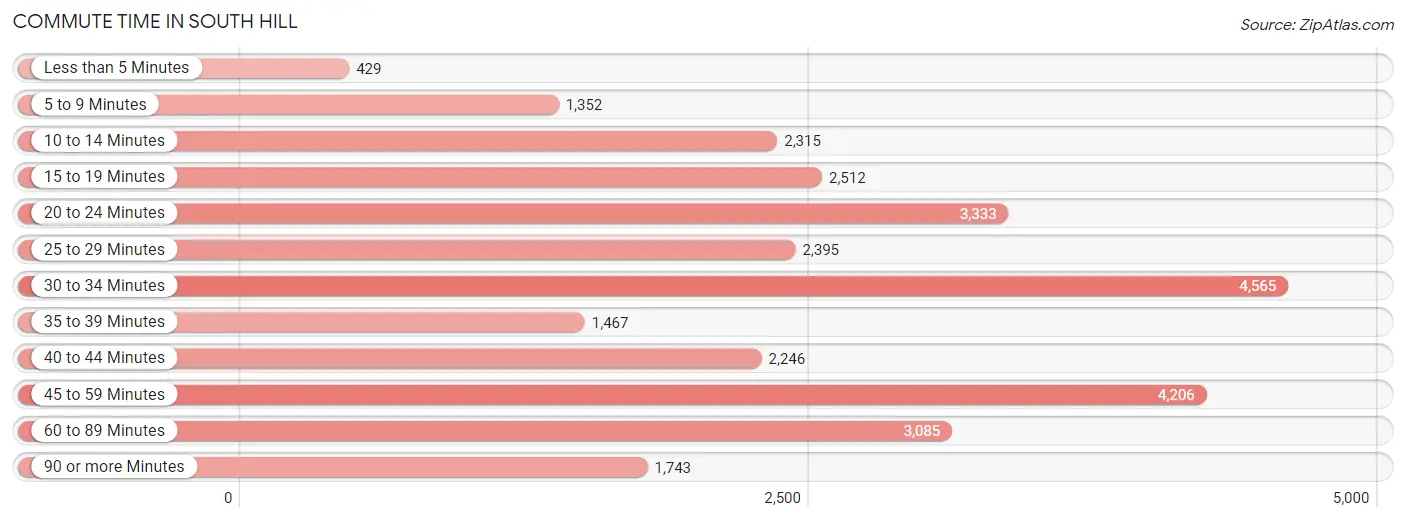
| Commute Time | # Commuters | % Commuters |
| Less than 5 Minutes | 429 | 1.5% |
| 5 to 9 Minutes | 1,352 | 4.6% |
| 10 to 14 Minutes | 2,315 | 7.8% |
| 15 to 19 Minutes | 2,512 | 8.5% |
| 20 to 24 Minutes | 3,333 | 11.2% |
| 25 to 29 Minutes | 2,395 | 8.1% |
| 30 to 34 Minutes | 4,565 | 15.4% |
| 35 to 39 Minutes | 1,467 | 5.0% |
| 40 to 44 Minutes | 2,246 | 7.6% |
| 45 to 59 Minutes | 4,206 | 14.2% |
| 60 to 89 Minutes | 3,085 | 10.4% |
| 90 or more Minutes | 1,743 | 5.9% |
Commute Time by Sex in South Hill
The most common commute times in South Hill are 30 to 34 minutes (2,779 commuters, 16.8%) for males and 30 to 34 minutes (1,786 commuters, 13.6%) for females.
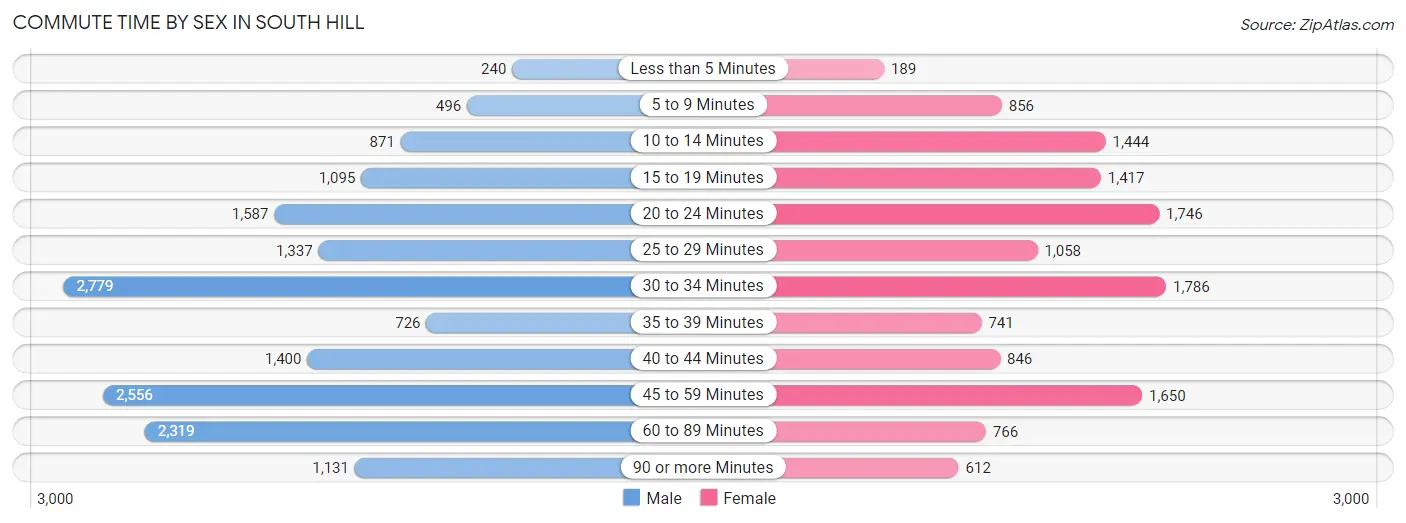
| Commute Time | Male | Female |
| Less than 5 Minutes | 240 (1.5%) | 189 (1.4%) |
| 5 to 9 Minutes | 496 (3.0%) | 856 (6.5%) |
| 10 to 14 Minutes | 871 (5.3%) | 1,444 (11.0%) |
| 15 to 19 Minutes | 1,095 (6.6%) | 1,417 (10.8%) |
| 20 to 24 Minutes | 1,587 (9.6%) | 1,746 (13.3%) |
| 25 to 29 Minutes | 1,337 (8.1%) | 1,058 (8.1%) |
| 30 to 34 Minutes | 2,779 (16.8%) | 1,786 (13.6%) |
| 35 to 39 Minutes | 726 (4.4%) | 741 (5.7%) |
| 40 to 44 Minutes | 1,400 (8.5%) | 846 (6.5%) |
| 45 to 59 Minutes | 2,556 (15.5%) | 1,650 (12.6%) |
| 60 to 89 Minutes | 2,319 (14.0%) | 766 (5.8%) |
| 90 or more Minutes | 1,131 (6.8%) | 612 (4.7%) |
Time of Departure to Work by Sex in South Hill
The most frequent times of departure to work in South Hill are 12:00 AM to 4:59 AM (2,686, 16.2%) for males and 7:00 AM to 7:29 AM (2,216, 16.9%) for females.
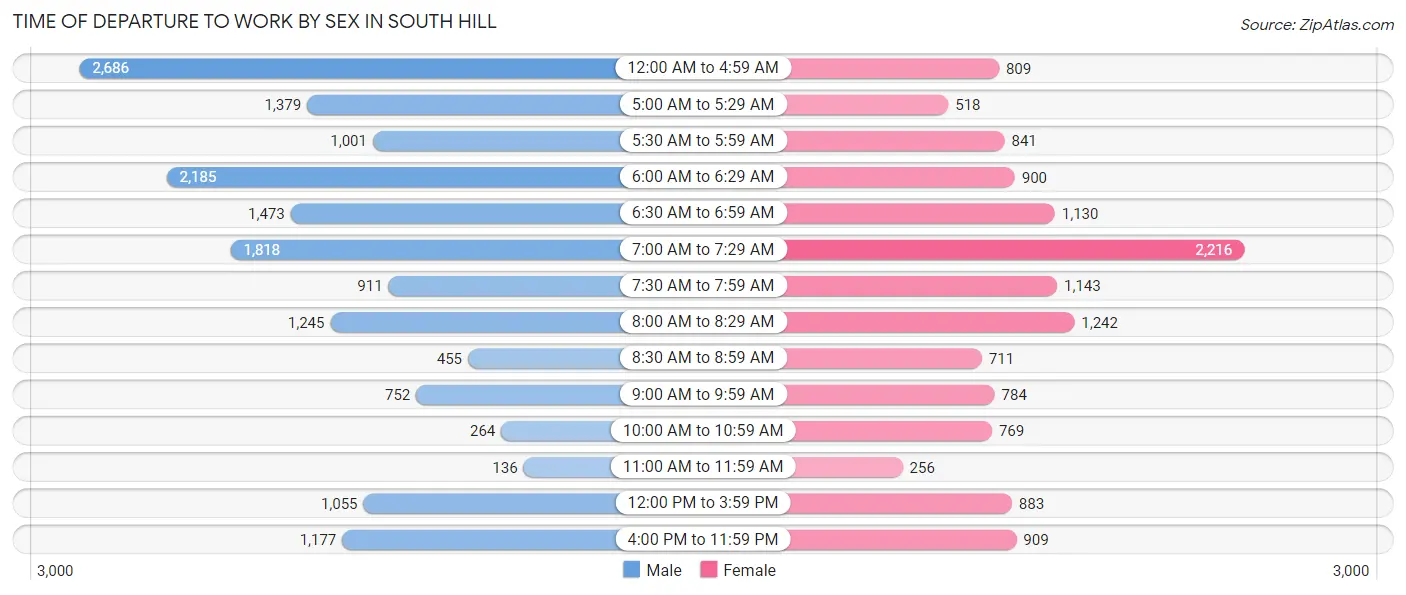
| Time of Departure | Male | Female |
| 12:00 AM to 4:59 AM | 2,686 (16.2%) | 809 (6.2%) |
| 5:00 AM to 5:29 AM | 1,379 (8.3%) | 518 (4.0%) |
| 5:30 AM to 5:59 AM | 1,001 (6.0%) | 841 (6.4%) |
| 6:00 AM to 6:29 AM | 2,185 (13.2%) | 900 (6.9%) |
| 6:30 AM to 6:59 AM | 1,473 (8.9%) | 1,130 (8.6%) |
| 7:00 AM to 7:29 AM | 1,818 (11.0%) | 2,216 (16.9%) |
| 7:30 AM to 7:59 AM | 911 (5.5%) | 1,143 (8.7%) |
| 8:00 AM to 8:29 AM | 1,245 (7.5%) | 1,242 (9.5%) |
| 8:30 AM to 8:59 AM | 455 (2.8%) | 711 (5.4%) |
| 9:00 AM to 9:59 AM | 752 (4.5%) | 784 (6.0%) |
| 10:00 AM to 10:59 AM | 264 (1.6%) | 769 (5.9%) |
| 11:00 AM to 11:59 AM | 136 (0.8%) | 256 (1.9%) |
| 12:00 PM to 3:59 PM | 1,055 (6.4%) | 883 (6.7%) |
| 4:00 PM to 11:59 PM | 1,177 (7.1%) | 909 (6.9%) |
| Total | 16,537 (100.0%) | 13,111 (100.0%) |
Housing Occupancy in South Hill
Occupancy by Ownership in South Hill
Of the total 22,324 dwellings in South Hill, owner-occupied units account for 16,002 (71.7%), while renter-occupied units make up 6,322 (28.3%).
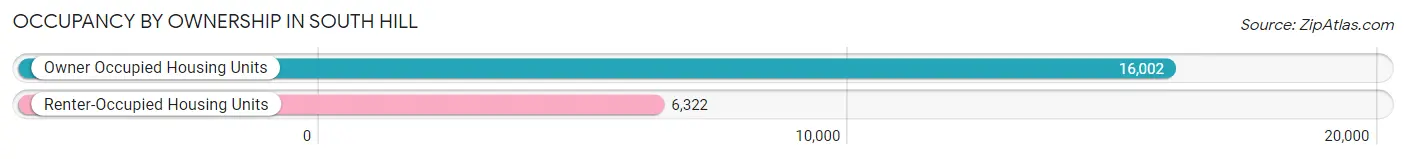
| Occupancy | # Housing Units | % Housing Units |
| Owner Occupied Housing Units | 16,002 | 71.7% |
| Renter-Occupied Housing Units | 6,322 | 28.3% |
| Total Occupied Housing Units | 22,324 | 100.0% |
Occupancy by Household Size in South Hill
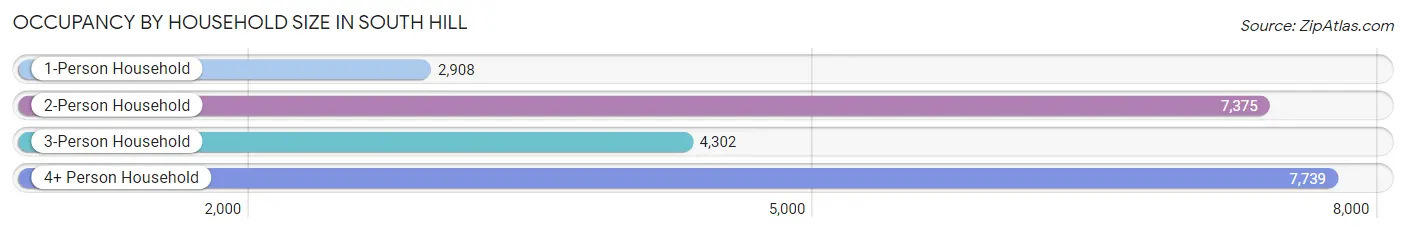
| Household Size | # Housing Units | % Housing Units |
| 1-Person Household | 2,908 | 13.0% |
| 2-Person Household | 7,375 | 33.0% |
| 3-Person Household | 4,302 | 19.3% |
| 4+ Person Household | 7,739 | 34.7% |
| Total Housing Units | 22,324 | 100.0% |
Occupancy by Ownership by Household Size in South Hill
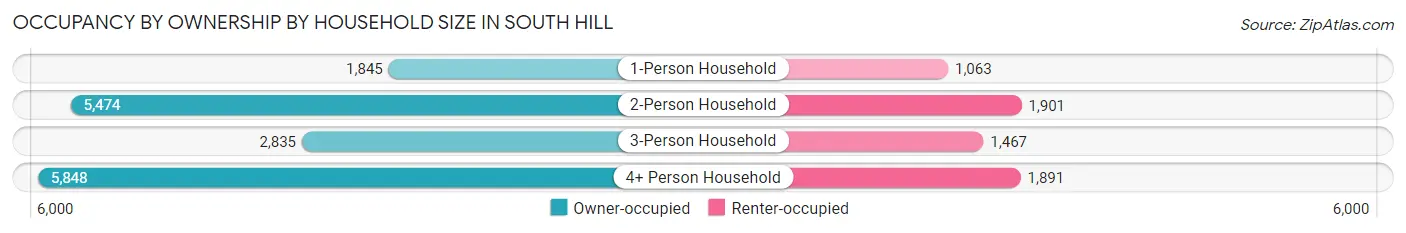
| Household Size | Owner-occupied | Renter-occupied |
| 1-Person Household | 1,845 (63.4%) | 1,063 (36.5%) |
| 2-Person Household | 5,474 (74.2%) | 1,901 (25.8%) |
| 3-Person Household | 2,835 (65.9%) | 1,467 (34.1%) |
| 4+ Person Household | 5,848 (75.6%) | 1,891 (24.4%) |
| Total Housing Units | 16,002 (71.7%) | 6,322 (28.3%) |
Occupancy by Educational Attainment in South Hill
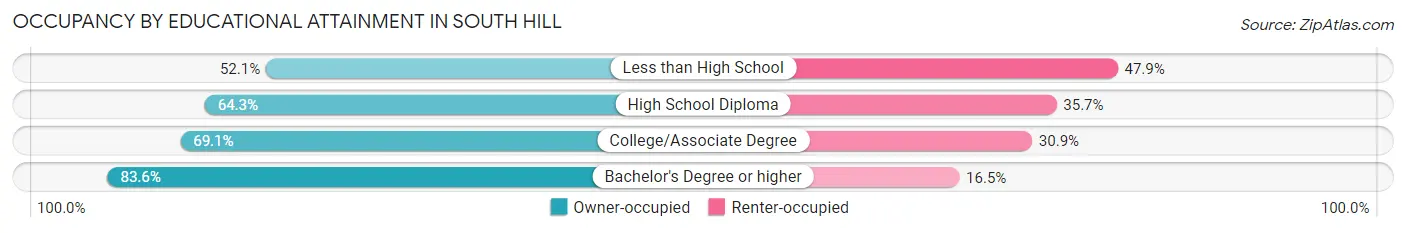
| Household Size | Owner-occupied | Renter-occupied |
| Less than High School | 732 (52.1%) | 672 (47.9%) |
| High School Diploma | 2,925 (64.3%) | 1,626 (35.7%) |
| College/Associate Degree | 6,378 (69.1%) | 2,849 (30.9%) |
| Bachelor's Degree or higher | 5,967 (83.6%) | 1,175 (16.5%) |
Occupancy by Age of Householder in South Hill
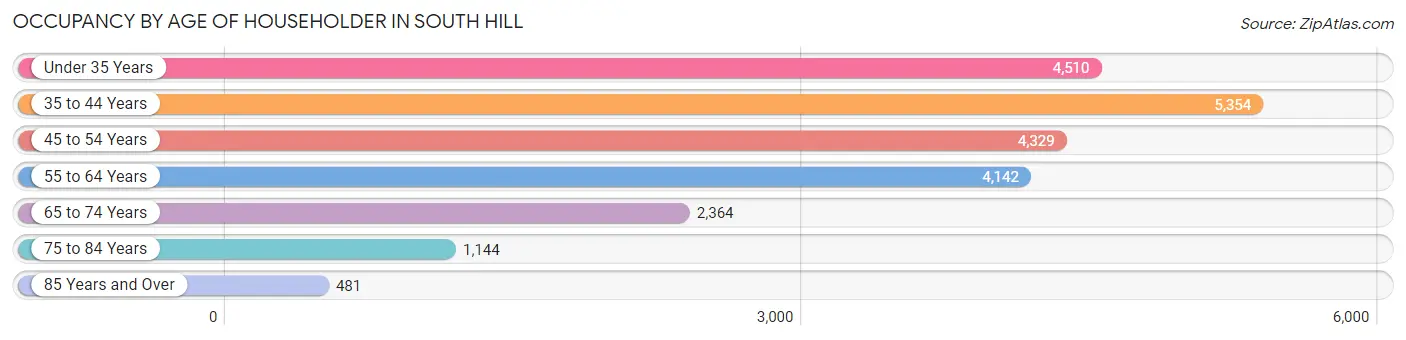
| Age Bracket | # Households | % Households |
| Under 35 Years | 4,510 | 20.2% |
| 35 to 44 Years | 5,354 | 24.0% |
| 45 to 54 Years | 4,329 | 19.4% |
| 55 to 64 Years | 4,142 | 18.5% |
| 65 to 74 Years | 2,364 | 10.6% |
| 75 to 84 Years | 1,144 | 5.1% |
| 85 Years and Over | 481 | 2.1% |
| Total | 22,324 | 100.0% |
Housing Finances in South Hill
Median Income by Occupancy in South Hill
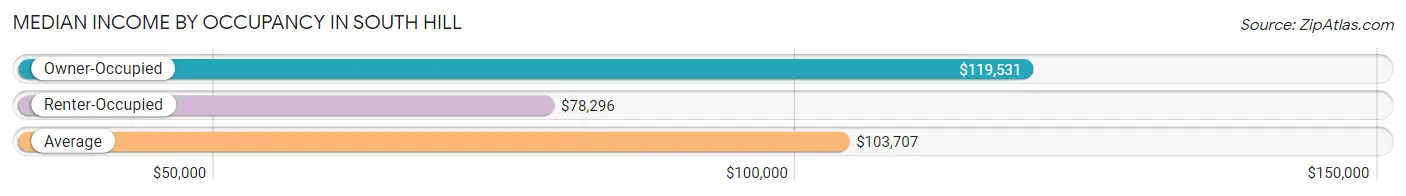
| Occupancy Type | # Households | Median Income |
| Owner-Occupied | 16,002 (71.7%) | $119,531 |
| Renter-Occupied | 6,322 (28.3%) | $78,296 |
| Average | 22,324 (100.0%) | $103,707 |
Occupancy by Householder Income Bracket in South Hill
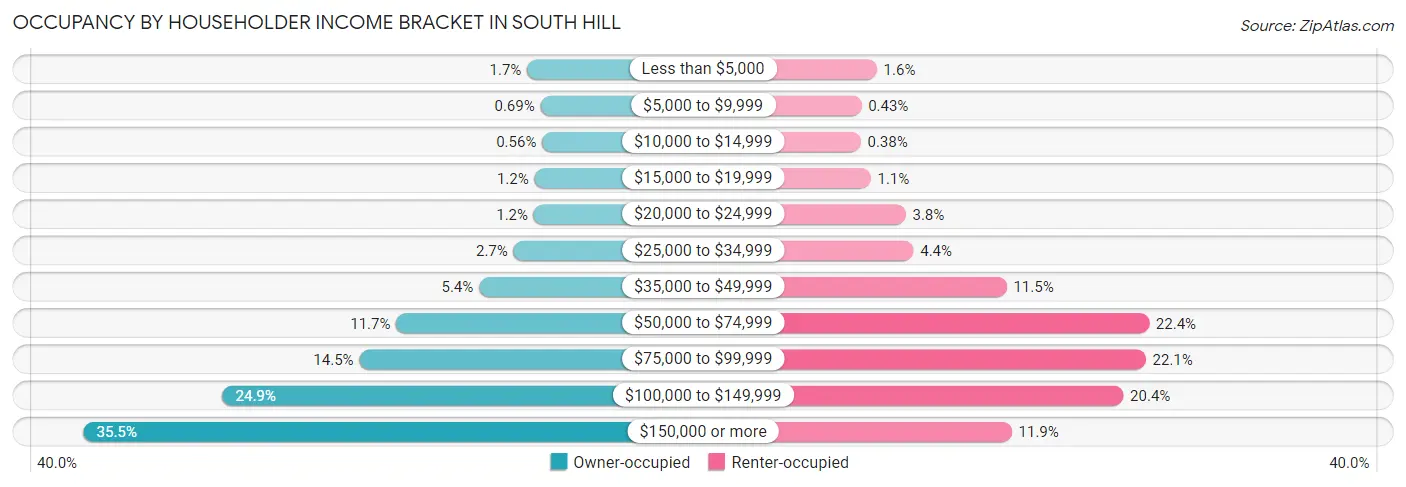
| Income Bracket | Owner-occupied | Renter-occupied |
| Less than $5,000 | 274 (1.7%) | 102 (1.6%) |
| $5,000 to $9,999 | 110 (0.7%) | 27 (0.4%) |
| $10,000 to $14,999 | 90 (0.6%) | 24 (0.4%) |
| $15,000 to $19,999 | 184 (1.1%) | 72 (1.1%) |
| $20,000 to $24,999 | 192 (1.2%) | 241 (3.8%) |
| $25,000 to $34,999 | 439 (2.7%) | 278 (4.4%) |
| $35,000 to $49,999 | 860 (5.4%) | 727 (11.5%) |
| $50,000 to $74,999 | 1,869 (11.7%) | 1,413 (22.4%) |
| $75,000 to $99,999 | 2,318 (14.5%) | 1,397 (22.1%) |
| $100,000 to $149,999 | 3,986 (24.9%) | 1,289 (20.4%) |
| $150,000 or more | 5,680 (35.5%) | 752 (11.9%) |
| Total | 16,002 (100.0%) | 6,322 (100.0%) |
Monthly Housing Cost Tiers in South Hill
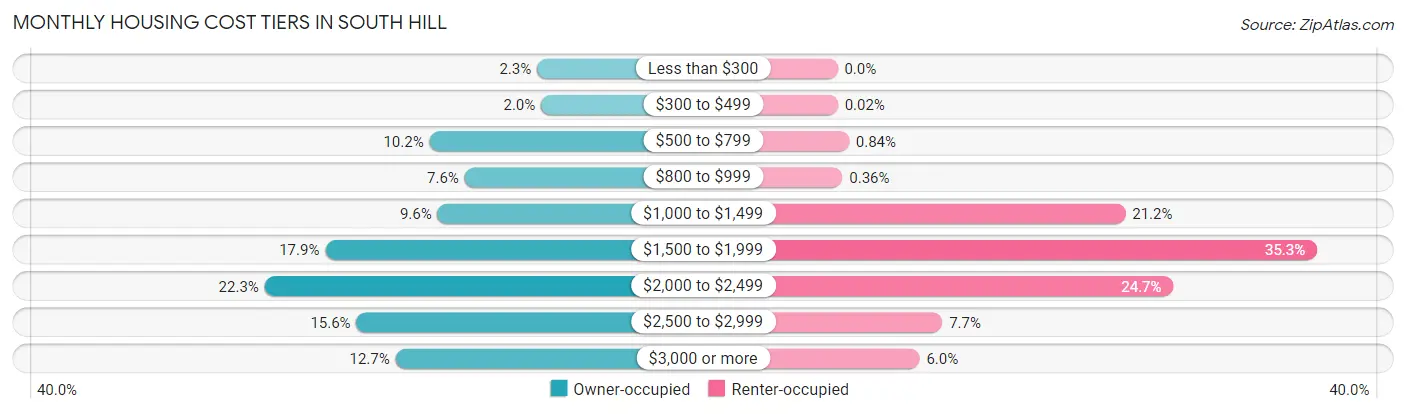
| Monthly Cost | Owner-occupied | Renter-occupied |
| Less than $300 | 362 (2.3%) | 0 (0.0%) |
| $300 to $499 | 313 (2.0%) | 1 (0.0%) |
| $500 to $799 | 1,629 (10.2%) | 53 (0.8%) |
| $800 to $999 | 1,214 (7.6%) | 23 (0.4%) |
| $1,000 to $1,499 | 1,535 (9.6%) | 1,340 (21.2%) |
| $1,500 to $1,999 | 2,858 (17.9%) | 2,233 (35.3%) |
| $2,000 to $2,499 | 3,572 (22.3%) | 1,564 (24.7%) |
| $2,500 to $2,999 | 2,490 (15.6%) | 488 (7.7%) |
| $3,000 or more | 2,029 (12.7%) | 382 (6.0%) |
| Total | 16,002 (100.0%) | 6,322 (100.0%) |
Physical Housing Characteristics in South Hill
Housing Structures in South Hill
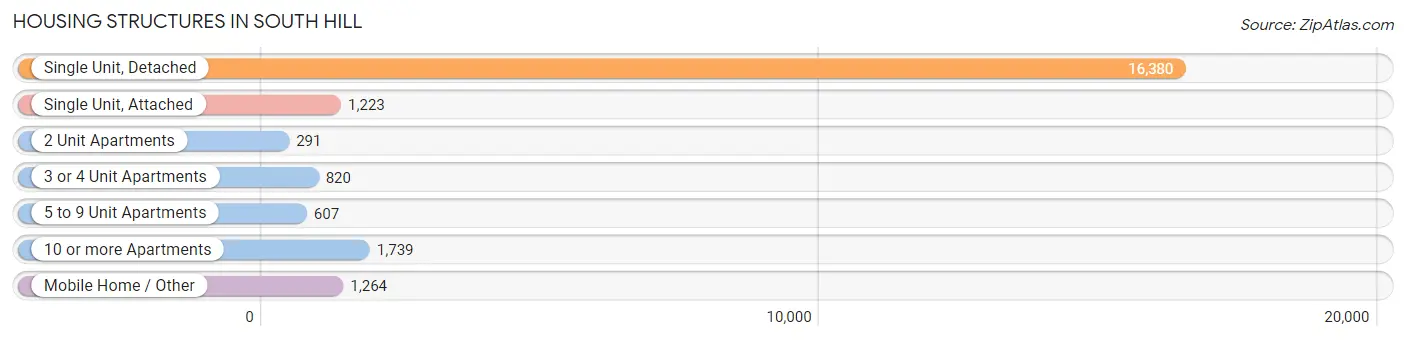
| Structure Type | # Housing Units | % Housing Units |
| Single Unit, Detached | 16,380 | 73.4% |
| Single Unit, Attached | 1,223 | 5.5% |
| 2 Unit Apartments | 291 | 1.3% |
| 3 or 4 Unit Apartments | 820 | 3.7% |
| 5 to 9 Unit Apartments | 607 | 2.7% |
| 10 or more Apartments | 1,739 | 7.8% |
| Mobile Home / Other | 1,264 | 5.7% |
| Total | 22,324 | 100.0% |
Housing Structures by Occupancy in South Hill
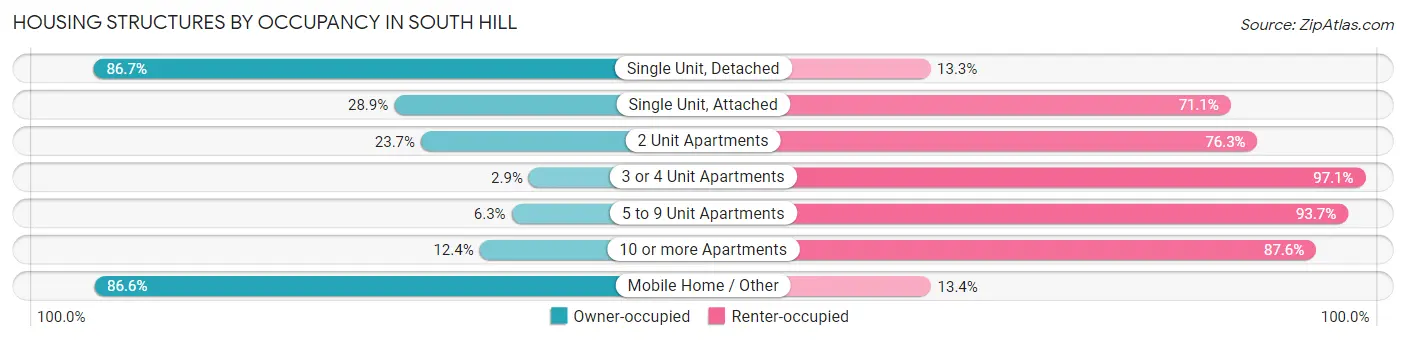
| Structure Type | Owner-occupied | Renter-occupied |
| Single Unit, Detached | 14,207 (86.7%) | 2,173 (13.3%) |
| Single Unit, Attached | 353 (28.9%) | 870 (71.1%) |
| 2 Unit Apartments | 69 (23.7%) | 222 (76.3%) |
| 3 or 4 Unit Apartments | 24 (2.9%) | 796 (97.1%) |
| 5 to 9 Unit Apartments | 38 (6.3%) | 569 (93.7%) |
| 10 or more Apartments | 216 (12.4%) | 1,523 (87.6%) |
| Mobile Home / Other | 1,095 (86.6%) | 169 (13.4%) |
| Total | 16,002 (71.7%) | 6,322 (28.3%) |
Housing Structures by Number of Rooms in South Hill
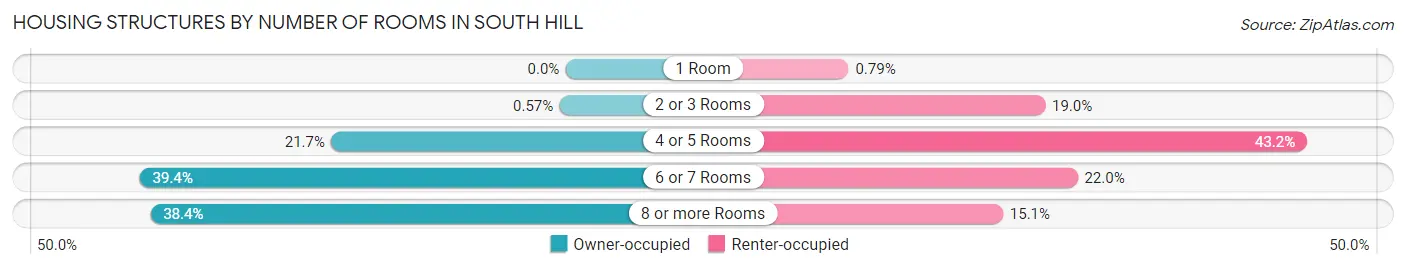
| Number of Rooms | Owner-occupied | Renter-occupied |
| 1 Room | 0 (0.0%) | 50 (0.8%) |
| 2 or 3 Rooms | 91 (0.6%) | 1,199 (19.0%) |
| 4 or 5 Rooms | 3,470 (21.7%) | 2,731 (43.2%) |
| 6 or 7 Rooms | 6,300 (39.4%) | 1,389 (22.0%) |
| 8 or more Rooms | 6,141 (38.4%) | 953 (15.1%) |
| Total | 16,002 (100.0%) | 6,322 (100.0%) |
Housing Structure by Heating Type in South Hill
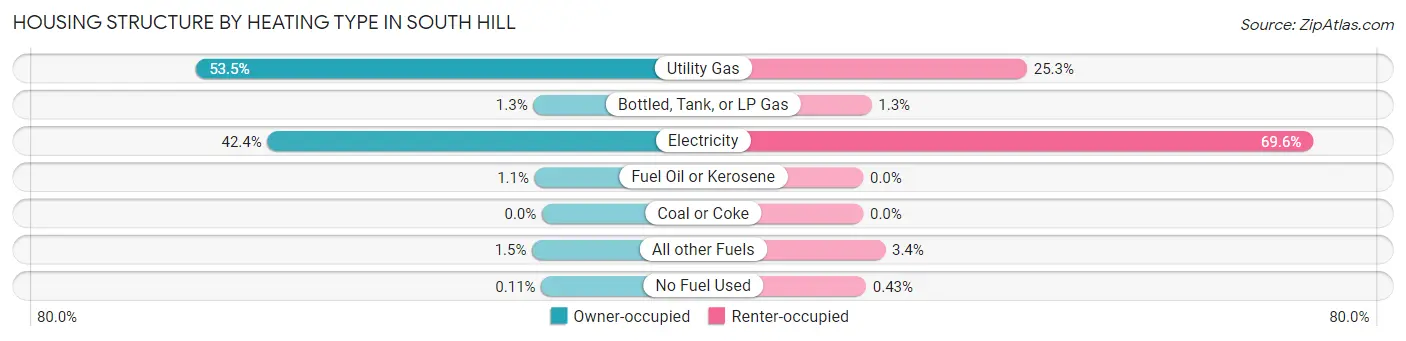
| Heating Type | Owner-occupied | Renter-occupied |
| Utility Gas | 8,555 (53.5%) | 1,600 (25.3%) |
| Bottled, Tank, or LP Gas | 213 (1.3%) | 81 (1.3%) |
| Electricity | 6,792 (42.4%) | 4,399 (69.6%) |
| Fuel Oil or Kerosene | 181 (1.1%) | 0 (0.0%) |
| Coal or Coke | 0 (0.0%) | 0 (0.0%) |
| All other Fuels | 244 (1.5%) | 215 (3.4%) |
| No Fuel Used | 17 (0.1%) | 27 (0.4%) |
| Total | 16,002 (100.0%) | 6,322 (100.0%) |
Household Vehicle Usage in South Hill
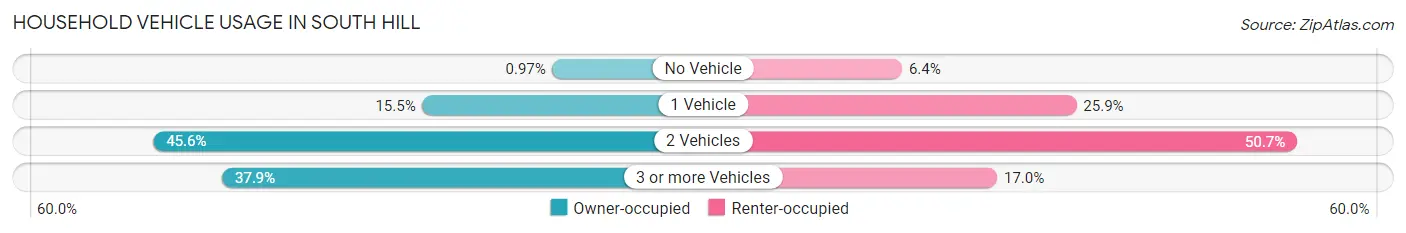
| Vehicles per Household | Owner-occupied | Renter-occupied |
| No Vehicle | 156 (1.0%) | 404 (6.4%) |
| 1 Vehicle | 2,486 (15.5%) | 1,639 (25.9%) |
| 2 Vehicles | 7,295 (45.6%) | 3,202 (50.6%) |
| 3 or more Vehicles | 6,065 (37.9%) | 1,077 (17.0%) |
| Total | 16,002 (100.0%) | 6,322 (100.0%) |
Real Estate & Mortgages in South Hill
Real Estate and Mortgage Overview in South Hill
| Characteristic | Without Mortgage | With Mortgage |
| Housing Units | 3,927 | 12,075 |
| Median Property Value | $392,200 | $452,200 |
| Median Household Income | $88,980 | $4,659 |
| Monthly Housing Costs | $776 | $2,014 |
| Real Estate Taxes | $4,248 | $400 |
Property Value by Mortgage Status in South Hill
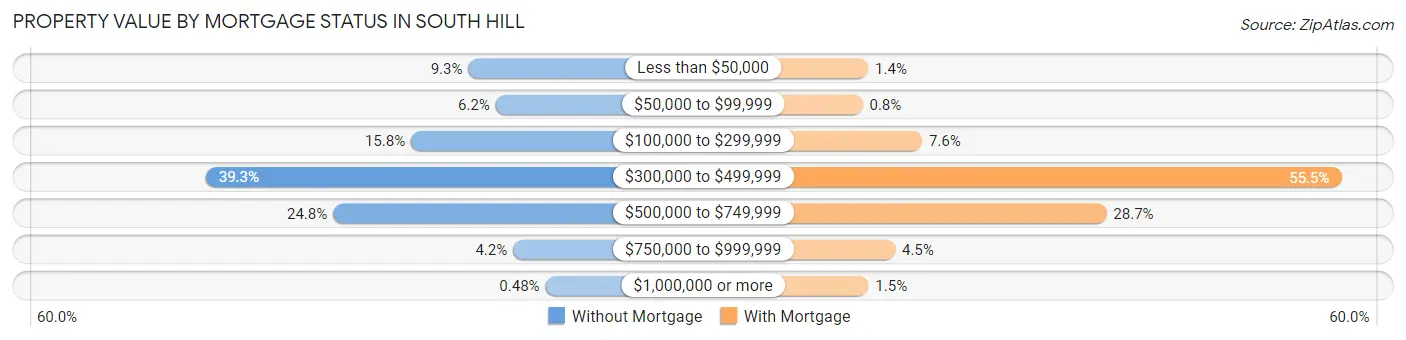
| Property Value | Without Mortgage | With Mortgage |
| Less than $50,000 | 365 (9.3%) | 174 (1.4%) |
| $50,000 to $99,999 | 242 (6.2%) | 97 (0.8%) |
| $100,000 to $299,999 | 622 (15.8%) | 916 (7.6%) |
| $300,000 to $499,999 | 1,543 (39.3%) | 6,704 (55.5%) |
| $500,000 to $749,999 | 972 (24.7%) | 3,462 (28.7%) |
| $750,000 to $999,999 | 164 (4.2%) | 544 (4.5%) |
| $1,000,000 or more | 19 (0.5%) | 178 (1.5%) |
| Total | 3,927 (100.0%) | 12,075 (100.0%) |
Household Income by Mortgage Status in South Hill
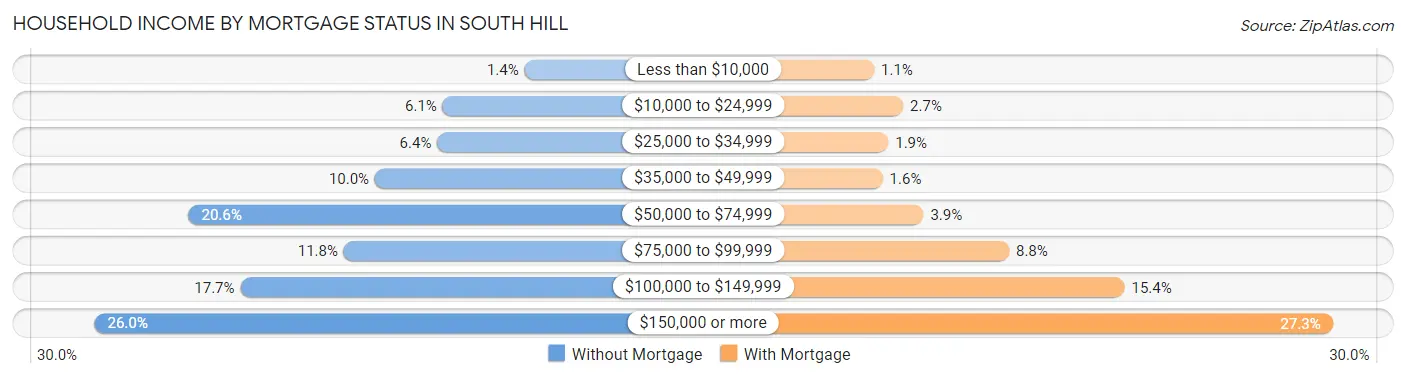
| Household Income | Without Mortgage | With Mortgage |
| Less than $10,000 | 56 (1.4%) | 128 (1.1%) |
| $10,000 to $24,999 | 240 (6.1%) | 328 (2.7%) |
| $25,000 to $34,999 | 252 (6.4%) | 226 (1.9%) |
| $35,000 to $49,999 | 392 (10.0%) | 187 (1.5%) |
| $50,000 to $74,999 | 810 (20.6%) | 468 (3.9%) |
| $75,000 to $99,999 | 462 (11.8%) | 1,059 (8.8%) |
| $100,000 to $149,999 | 694 (17.7%) | 1,856 (15.4%) |
| $150,000 or more | 1,021 (26.0%) | 3,292 (27.3%) |
| Total | 3,927 (100.0%) | 12,075 (100.0%) |
Property Value to Household Income Ratio in South Hill
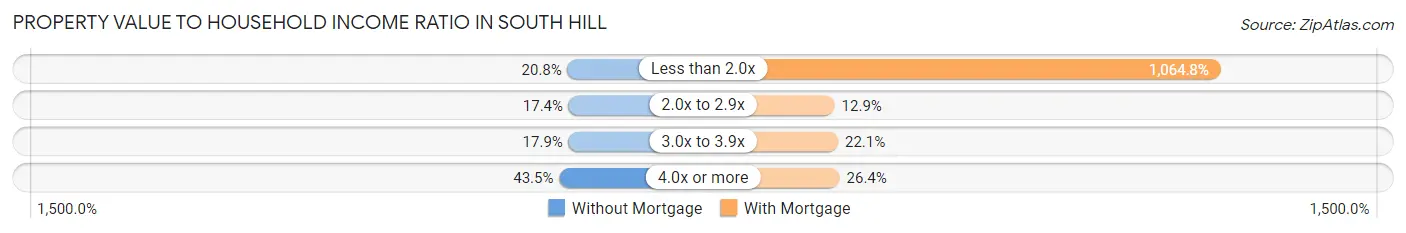
| Value-to-Income Ratio | Without Mortgage | With Mortgage |
| Less than 2.0x | 817 (20.8%) | 128,580 (1,064.8%) |
| 2.0x to 2.9x | 683 (17.4%) | 1,557 (12.9%) |
| 3.0x to 3.9x | 701 (17.8%) | 2,668 (22.1%) |
| 4.0x or more | 1,708 (43.5%) | 3,193 (26.4%) |
| Total | 3,927 (100.0%) | 12,075 (100.0%) |
Real Estate Taxes by Mortgage Status in South Hill
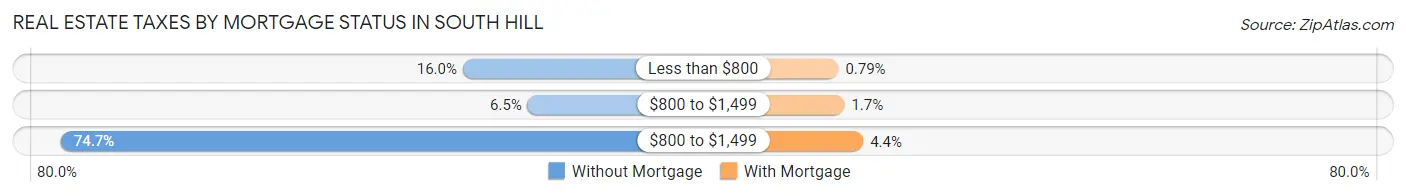
| Property Taxes | Without Mortgage | With Mortgage |
| Less than $800 | 627 (16.0%) | 95 (0.8%) |
| $800 to $1,499 | 255 (6.5%) | 202 (1.7%) |
| $800 to $1,499 | 2,933 (74.7%) | 533 (4.4%) |
| Total | 3,927 (100.0%) | 12,075 (100.0%) |
Health & Disability in South Hill
Health Insurance Coverage by Age in South Hill
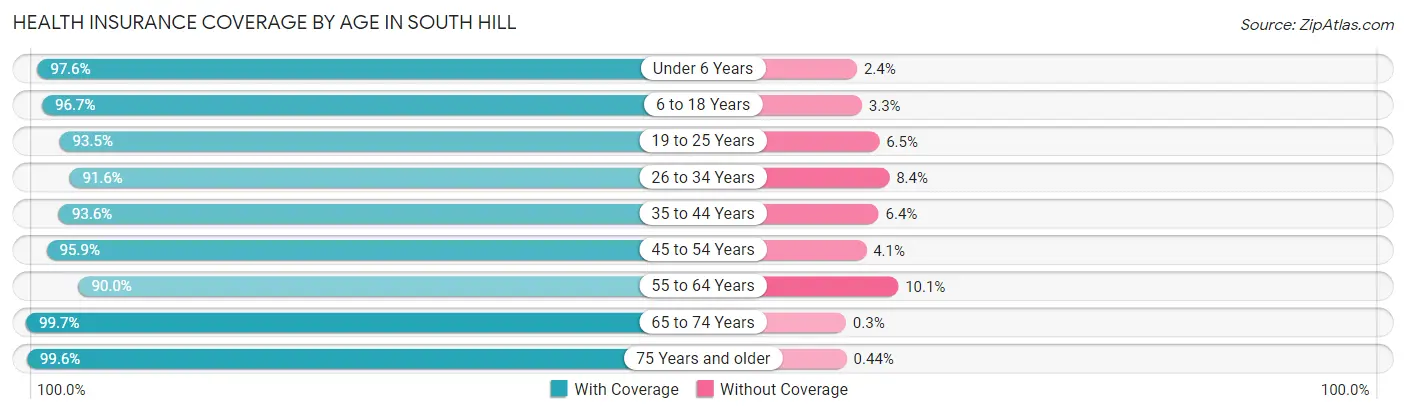
| Age Bracket | With Coverage | Without Coverage |
| Under 6 Years | 5,445 (97.6%) | 132 (2.4%) |
| 6 to 18 Years | 13,996 (96.7%) | 473 (3.3%) |
| 19 to 25 Years | 5,497 (93.5%) | 383 (6.5%) |
| 26 to 34 Years | 7,639 (91.6%) | 698 (8.4%) |
| 35 to 44 Years | 9,076 (93.6%) | 621 (6.4%) |
| 45 to 54 Years | 7,862 (95.9%) | 335 (4.1%) |
| 55 to 64 Years | 6,969 (89.9%) | 779 (10.1%) |
| 65 to 74 Years | 4,255 (99.7%) | 13 (0.3%) |
| 75 Years and older | 2,940 (99.6%) | 13 (0.4%) |
| Total | 63,679 (94.9%) | 3,447 (5.1%) |
Health Insurance Coverage by Citizenship Status in South Hill
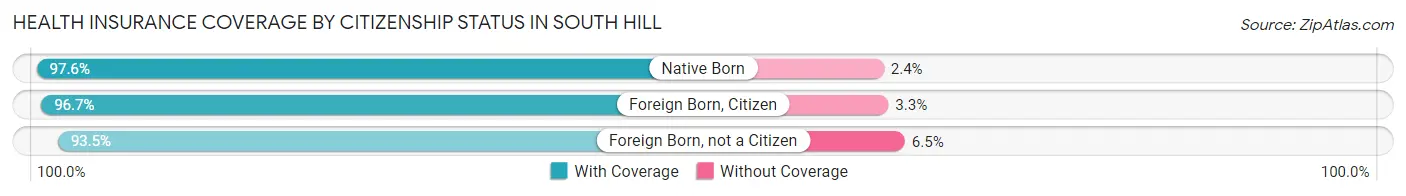
| Citizenship Status | With Coverage | Without Coverage |
| Native Born | 5,445 (97.6%) | 132 (2.4%) |
| Foreign Born, Citizen | 13,996 (96.7%) | 473 (3.3%) |
| Foreign Born, not a Citizen | 5,497 (93.5%) | 383 (6.5%) |
Health Insurance Coverage by Household Income in South Hill
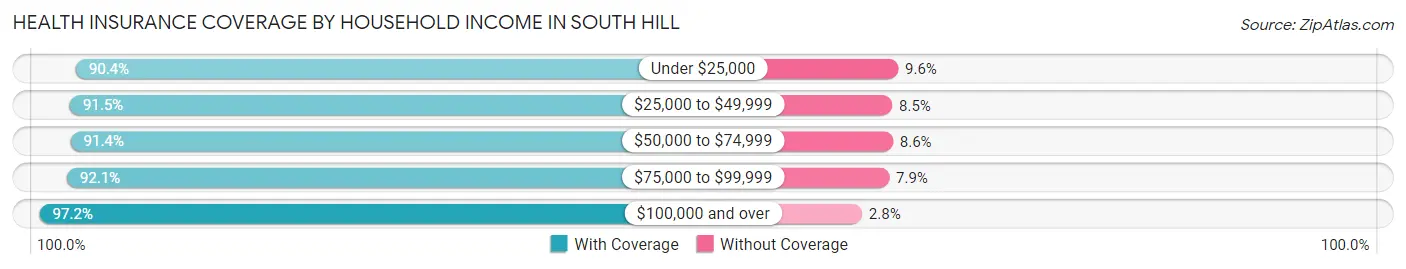
| Household Income | With Coverage | Without Coverage |
| Under $25,000 | 2,709 (90.4%) | 288 (9.6%) |
| $25,000 to $49,999 | 4,528 (91.5%) | 420 (8.5%) |
| $50,000 to $74,999 | 8,325 (91.4%) | 786 (8.6%) |
| $75,000 to $99,999 | 9,657 (92.1%) | 832 (7.9%) |
| $100,000 and over | 38,369 (97.2%) | 1,117 (2.8%) |
Public vs Private Health Insurance Coverage by Age in South Hill
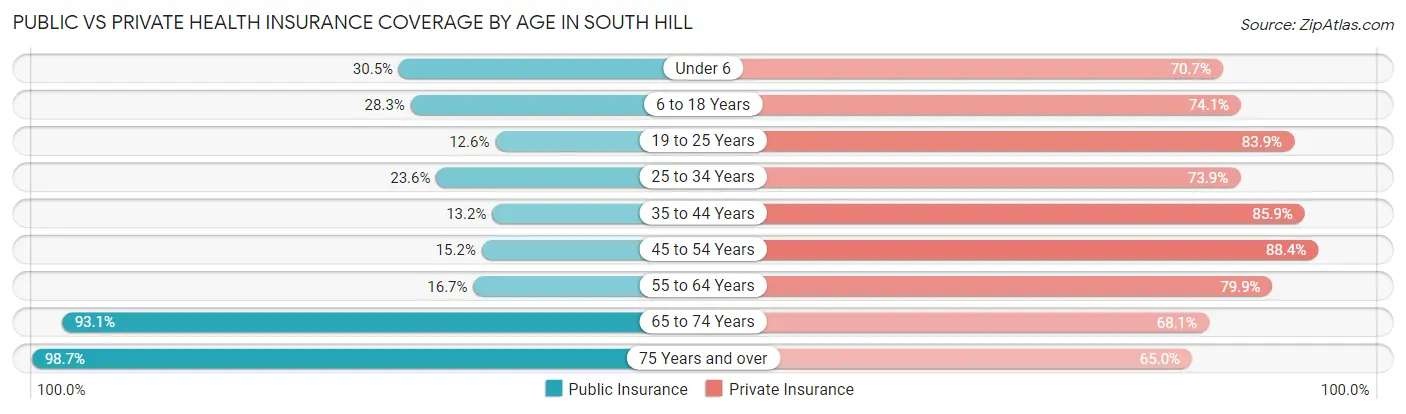
| Age Bracket | Public Insurance | Private Insurance |
| Under 6 | 1,702 (30.5%) | 3,943 (70.7%) |
| 6 to 18 Years | 4,101 (28.3%) | 10,718 (74.1%) |
| 19 to 25 Years | 743 (12.6%) | 4,934 (83.9%) |
| 25 to 34 Years | 1,966 (23.6%) | 6,163 (73.9%) |
| 35 to 44 Years | 1,280 (13.2%) | 8,331 (85.9%) |
| 45 to 54 Years | 1,242 (15.1%) | 7,247 (88.4%) |
| 55 to 64 Years | 1,294 (16.7%) | 6,193 (79.9%) |
| 65 to 74 Years | 3,974 (93.1%) | 2,908 (68.1%) |
| 75 Years and over | 2,914 (98.7%) | 1,919 (65.0%) |
| Total | 19,216 (28.6%) | 52,356 (78.0%) |
Disability Status by Sex by Age in South Hill
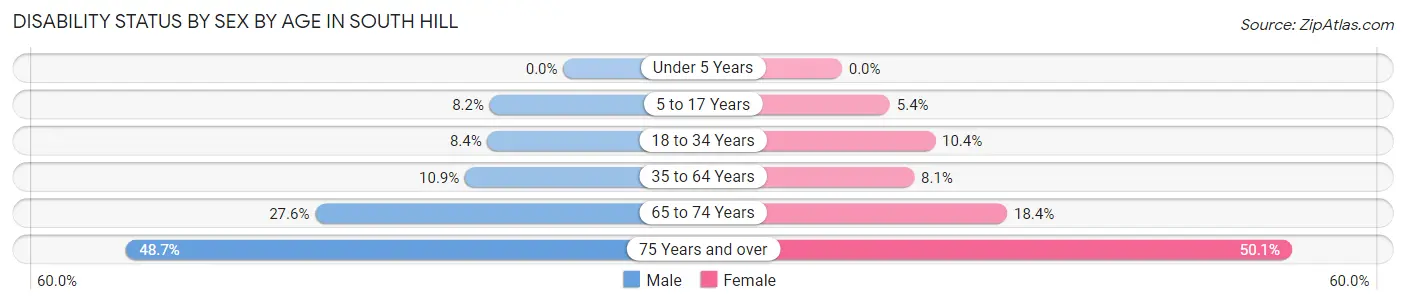
| Age Bracket | Male | Female |
| Under 5 Years | 0 (0.0%) | 0 (0.0%) |
| 5 to 17 Years | 629 (8.2%) | 368 (5.3%) |
| 18 to 34 Years | 669 (8.4%) | 735 (10.4%) |
| 35 to 64 Years | 1,351 (10.9%) | 1,070 (8.1%) |
| 65 to 74 Years | 514 (27.6%) | 443 (18.4%) |
| 75 Years and over | 600 (48.7%) | 862 (50.1%) |
Disability Class by Sex by Age in South Hill
Disability Class: Hearing Difficulty
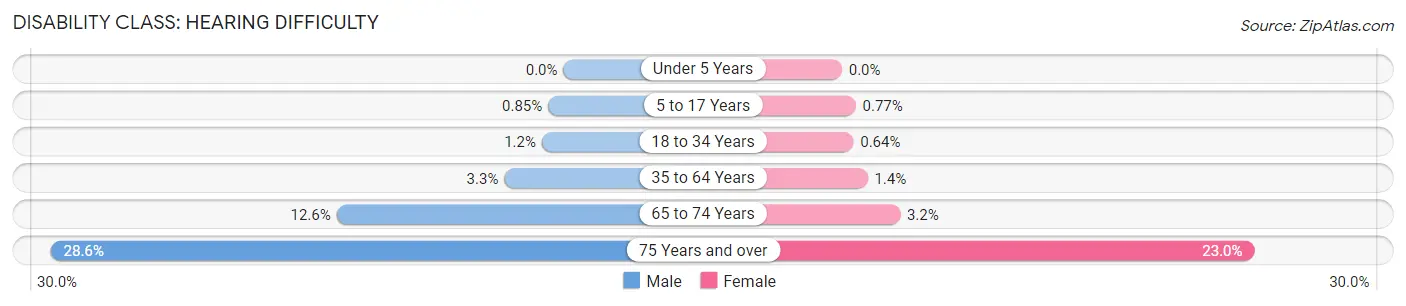
| Age Bracket | Male | Female |
| Under 5 Years | 0 (0.0%) | 0 (0.0%) |
| 5 to 17 Years | 65 (0.9%) | 53 (0.8%) |
| 18 to 34 Years | 95 (1.2%) | 45 (0.6%) |
| 35 to 64 Years | 406 (3.3%) | 190 (1.4%) |
| 65 to 74 Years | 235 (12.6%) | 78 (3.2%) |
| 75 Years and over | 352 (28.5%) | 395 (23.0%) |
Disability Class: Vision Difficulty
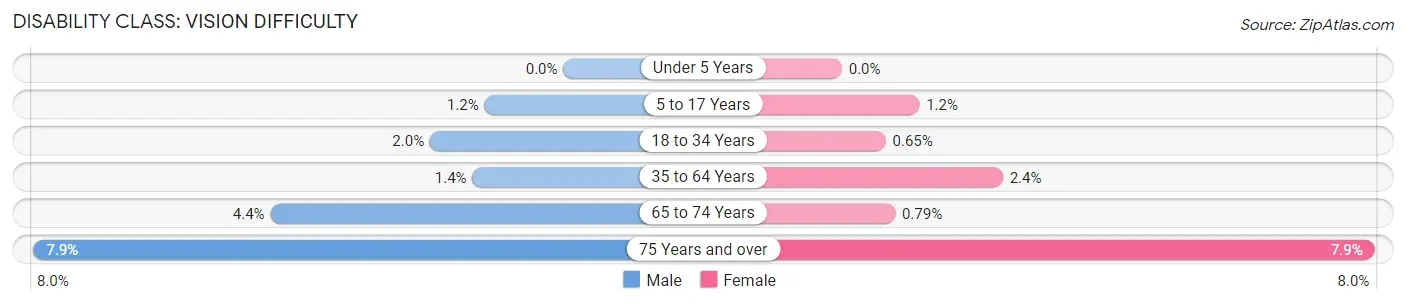
| Age Bracket | Male | Female |
| Under 5 Years | 0 (0.0%) | 0 (0.0%) |
| 5 to 17 Years | 90 (1.2%) | 79 (1.1%) |
| 18 to 34 Years | 157 (2.0%) | 46 (0.6%) |
| 35 to 64 Years | 167 (1.3%) | 318 (2.4%) |
| 65 to 74 Years | 81 (4.3%) | 19 (0.8%) |
| 75 Years and over | 97 (7.9%) | 136 (7.9%) |
Disability Class: Cognitive Difficulty
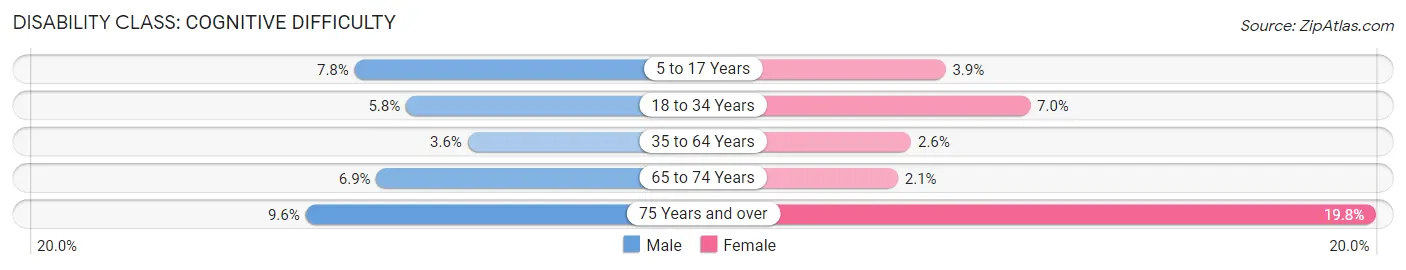
| Age Bracket | Male | Female |
| 5 to 17 Years | 595 (7.7%) | 265 (3.8%) |
| 18 to 34 Years | 463 (5.8%) | 495 (7.0%) |
| 35 to 64 Years | 438 (3.5%) | 342 (2.6%) |
| 65 to 74 Years | 129 (6.9%) | 50 (2.1%) |
| 75 Years and over | 118 (9.6%) | 341 (19.8%) |
Disability Class: Ambulatory Difficulty
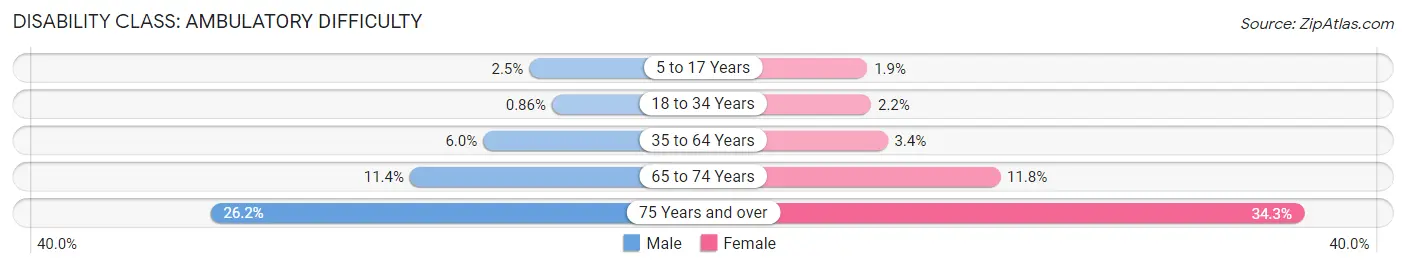
| Age Bracket | Male | Female |
| 5 to 17 Years | 195 (2.5%) | 130 (1.9%) |
| 18 to 34 Years | 68 (0.9%) | 154 (2.2%) |
| 35 to 64 Years | 736 (6.0%) | 451 (3.4%) |
| 65 to 74 Years | 212 (11.4%) | 283 (11.7%) |
| 75 Years and over | 323 (26.2%) | 590 (34.3%) |
Disability Class: Self-Care Difficulty
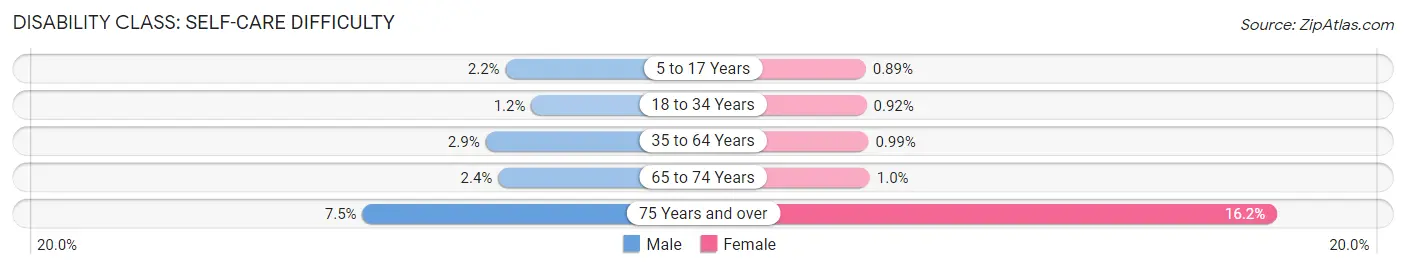
| Age Bracket | Male | Female |
| 5 to 17 Years | 165 (2.1%) | 61 (0.9%) |
| 18 to 34 Years | 94 (1.2%) | 65 (0.9%) |
| 35 to 64 Years | 357 (2.9%) | 131 (1.0%) |
| 65 to 74 Years | 45 (2.4%) | 25 (1.0%) |
| 75 Years and over | 92 (7.5%) | 278 (16.2%) |
Technology Access in South Hill
Computing Device Access in South Hill
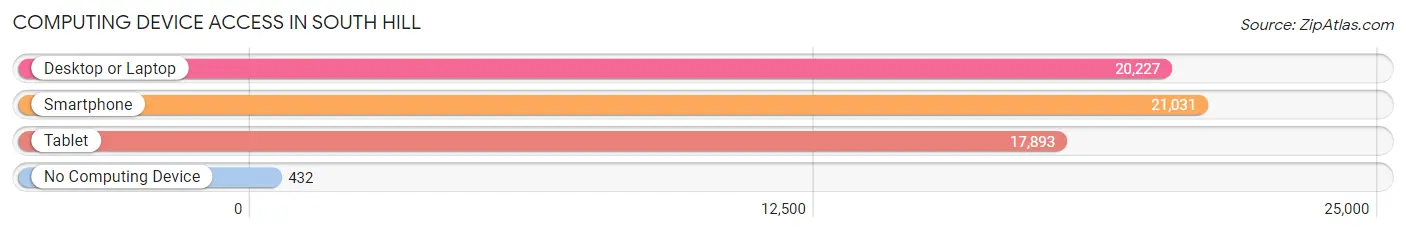
| Device Type | # Households | % Households |
| Desktop or Laptop | 20,227 | 90.6% |
| Smartphone | 21,031 | 94.2% |
| Tablet | 17,893 | 80.1% |
| No Computing Device | 432 | 1.9% |
| Total | 22,324 | 100.0% |
Internet Access in South Hill
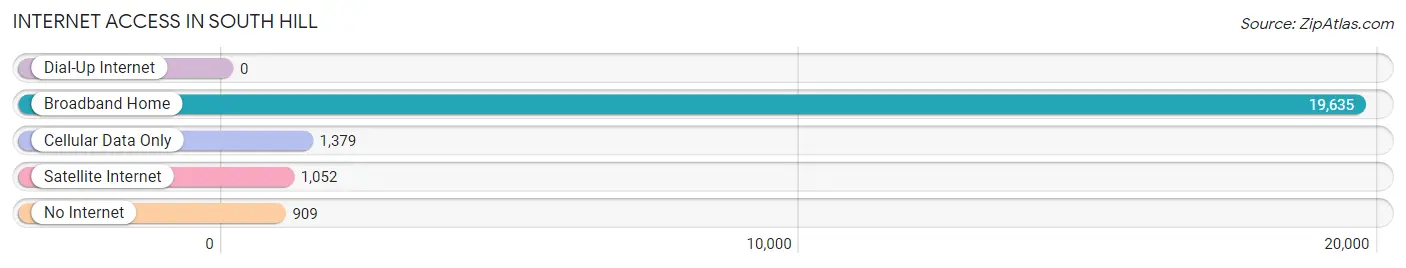
| Internet Type | # Households | % Households |
| Dial-Up Internet | 0 | 0.0% |
| Broadband Home | 19,635 | 87.9% |
| Cellular Data Only | 1,379 | 6.2% |
| Satellite Internet | 1,052 | 4.7% |
| No Internet | 909 | 4.1% |
| Total | 22,324 | 100.0% |
South Hill Summary
History
South Hill is a census-designated place (CDP) located in Pierce County, Washington, United States. It is located approximately 10 miles (16 km) south of Tacoma and 30 miles (48 km) south of Seattle. The population was 28,205 at the 2010 census.
South Hill was first settled in the late 1800s by homesteaders who were attracted to the area by its rich soil and abundant timber. The area was originally known as "South Prairie" and was home to a small farming community. In the early 1900s, the area began to grow as the Northern Pacific Railroad built a line through the area. The railroad brought new settlers and businesses to the area, and the town of South Hill was officially incorporated in 1909.
The town grew steadily throughout the 20th century, and by the 1970s, it had become a bedroom community for Tacoma and Seattle. In the 1980s, the area experienced a population boom as new housing developments were built to accommodate the influx of people moving to the area.
Geography
South Hill is located in Pierce County, Washington, at 47°9′N 122°20′W (47.1499, -122.3345). It is bordered to the north by the city of Puyallup, to the east by the city of Sumner, to the south by the city of Spanaway, and to the west by the city of Tacoma.
The area is mostly flat, with an elevation of approximately 400 feet (122 m). The area is drained by the Puyallup River, which flows through the center of the CDP.
Economy
South Hill is primarily a residential community, but it does have a few businesses. The largest employer in the area is the South Hill Mall, which is home to over 100 stores and restaurants. Other businesses in the area include a variety of retail stores, restaurants, and professional services.
The area is also home to several industrial parks, which are home to a variety of light manufacturing and distribution businesses. The largest of these is the South Hill Business Park, which is home to over 50 businesses.
Demographics
As of the 2010 census, there were 28,205 people, 10,845 households, and 7,845 families residing in the CDP. The population density was 2,845.3 people per square mile (1,098.7/km2). There were 11,541 housing units at an average density of 1,164.3 per square mile (449.2/km2).
The racial makeup of the CDP was 79.2% White, 8.2% African American, 0.7% Native American, 4.3% Asian, 0.2% Pacific Islander, 3.3% from other races, and 4.1% from two or more races. Hispanic or Latino of any race were 8.7% of the population.
There were 10,845 households, out of which 33.2% had children under the age of 18 living with them, 56.2% were married couples living together, 10.7% had a female householder with no husband present, and 28.7% were non-families. 22.2% of all households were made up of individuals, and 6.7% had someone living alone who was 65 years of age or older. The average household size was 2.60 and the average family size was 3.05.
In the CDP, the population was spread out, with 25.2% under the age of 18, 8.2% from 18 to 24, 30.2% from 25 to 44, 25.2% from 45 to 64, and 11.2% who were 65 years of age or older. The median age was 36 years. For every 100 females, there were 95.2 males. For every 100 females age 18 and over, there were 92.2 males.
The median income for a household in the CDP was $60,945, and the median income for a family was $68,945. Males had a median income of $50,945 versus $36,945 for females. The per capita income for the CDP was $26,945. About 4.2% of families and 6.2% of the population were below the poverty line, including 8.2% of those under age 18 and 4.2% of those age 65 or over.
Common Questions
What is Per Capita Income in South Hill?
Per Capita income in South Hill is $42,125.
What is the Median Family Income in South Hill?
Median Family Income in South Hill is $111,052.
What is the Median Household income in South Hill?
Median Household Income in South Hill is $103,707.
What is Income or Wage Gap in South Hill?
Income or Wage Gap in South Hill is 41.3%.
Women in South Hill earn 58.7 cents for every dollar earned by a man.
What is Inequality or Gini Index in South Hill?
Inequality or Gini Index in South Hill is 0.38.
What is the Total Population of South Hill?
Total Population of South Hill is 67,835.
What is the Total Male Population of South Hill?
Total Male Population of South Hill is 34,234.
What is the Total Female Population of South Hill?
Total Female Population of South Hill is 33,601.
What is the Ratio of Males per 100 Females in South Hill?
There are 101.88 Males per 100 Females in South Hill.
What is the Ratio of Females per 100 Males in South Hill?
There are 98.15 Females per 100 Males in South Hill.
What is the Median Population Age in South Hill?
Median Population Age in South Hill is 34.3 Years.
What is the Average Family Size in South Hill
Average Family Size in South Hill is 3.3 People.
What is the Average Household Size in South Hill
Average Household Size in South Hill is 3.0 People.
How Large is the Labor Force in South Hill?
There are 35,667 People in the Labor Forcein in South Hill.
What is the Percentage of People in the Labor Force in South Hill?
70.0% of People are in the Labor Force in South Hill.
What is the Unemployment Rate in South Hill?
Unemployment Rate in South Hill is 4.6%.