Cities with the Lowest Poverty Level Among Children Under the Age of 5 in Massachusetts
RELATED REPORTS & OPTIONS
Lowest Poverty | Child 0-5
Massachusetts
Compare Cities
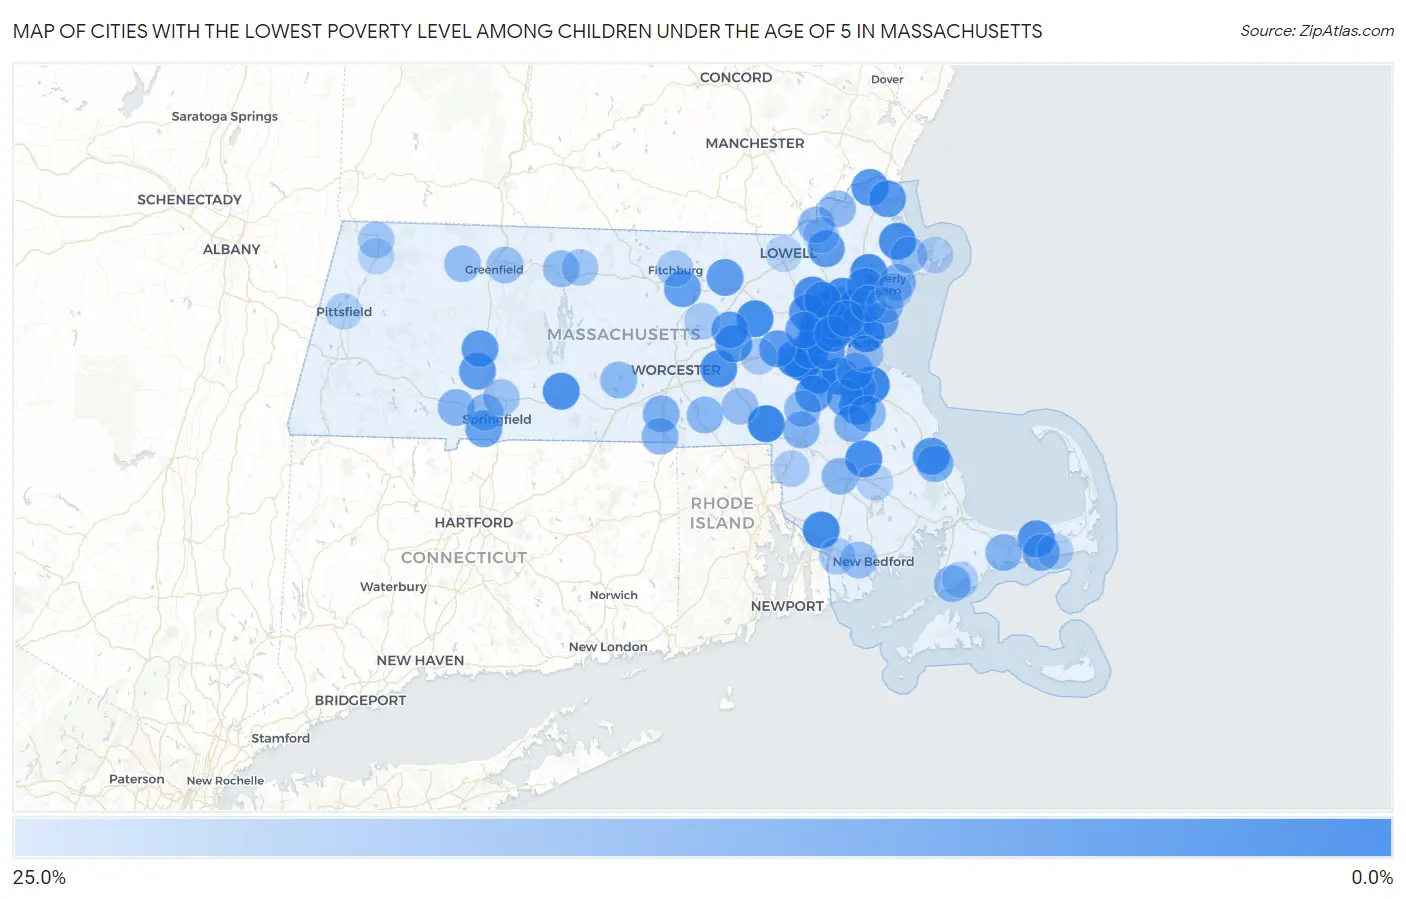
Map of Cities with the Lowest Poverty Level Among Children Under the Age of 5 in Massachusetts
25.0%
0.0%
Cities with the Lowest Poverty Level Among Children Under the Age of 5 in Massachusetts
| City | Child Poverty | vs State | vs National | |
| 1. | Arlington | 0.42% | 12.6%(-12.2)#1 | 18.1%(-17.6)#16 |
| 2. | Dedham | 0.65% | 12.6%(-11.9)#2 | 18.1%(-17.4)#35 |
| 3. | Winchester | 0.68% | 12.6%(-11.9)#3 | 18.1%(-17.4)#43 |
| 4. | Franklin Town | 0.74% | 12.6%(-11.8)#4 | 18.1%(-17.3)#55 |
| 5. | Needham | 0.81% | 12.6%(-11.8)#5 | 18.1%(-17.2)#64 |
| 6. | Winthrop Town | 1.1% | 12.6%(-11.4)#6 | 18.1%(-16.9)#128 |
| 7. | Melrose | 1.4% | 12.6%(-11.2)#7 | 18.1%(-16.7)#177 |
| 8. | Weymouth Town | 1.6% | 12.6%(-11.0)#8 | 18.1%(-16.5)#223 |
| 9. | Stoneham | 1.9% | 12.6%(-10.7)#9 | 18.1%(-16.2)#309 |
| 10. | Wakefield | 2.2% | 12.6%(-10.4)#10 | 18.1%(-15.8)#413 |
| 11. | Danvers | 2.2% | 12.6%(-10.3)#11 | 18.1%(-15.8)#420 |
| 12. | Wellesley | 2.4% | 12.6%(-10.2)#12 | 18.1%(-15.7)#464 |
| 13. | Newton | 2.7% | 12.6%(-9.86)#13 | 18.1%(-15.3)#586 |
| 14. | Maynard | 2.9% | 12.6%(-9.72)#14 | 18.1%(-15.2)#656 |
| 15. | Somerset | 3.0% | 12.6%(-9.57)#15 | 18.1%(-15.0)#715 |
| 16. | Milton | 3.2% | 12.6%(-9.40)#16 | 18.1%(-14.9)#785 |
| 17. | Bridgewater Town | 3.4% | 12.6%(-9.17)#17 | 18.1%(-14.7)#878 |
| 18. | Ipswich | 3.5% | 12.6%(-9.05)#18 | 18.1%(-14.5)#925 |
| 19. | Burlington | 3.6% | 12.6%(-9.03)#19 | 18.1%(-14.5)#938 |
| 20. | Belmont | 4.0% | 12.6%(-8.56)#20 | 18.1%(-14.0)#1,142 |
| 21. | Holbrook | 4.3% | 12.6%(-8.29)#21 | 18.1%(-13.8)#1,254 |
| 22. | Palmer Town | 4.4% | 12.6%(-8.16)#22 | 18.1%(-13.6)#1,299 |
| 23. | Westborough | 4.6% | 12.6%(-7.99)#23 | 18.1%(-13.5)#1,381 |
| 24. | Watertown Town | 4.6% | 12.6%(-7.96)#24 | 18.1%(-13.4)#1,392 |
| 25. | Brookline | 5.1% | 12.6%(-7.46)#25 | 18.1%(-12.9)#1,623 |
| 26. | Somerville | 5.3% | 12.6%(-7.27)#26 | 18.1%(-12.7)#1,716 |
| 27. | Yarmouth Port | 5.4% | 12.6%(-7.23)#27 | 18.1%(-12.7)#1,728 |
| 28. | Marlborough | 5.4% | 12.6%(-7.18)#28 | 18.1%(-12.7)#1,754 |
| 29. | Amherst | 5.5% | 12.6%(-7.08)#29 | 18.1%(-12.6)#1,788 |
| 30. | Lexington | 5.9% | 12.6%(-6.73)#30 | 18.1%(-12.2)#1,926 |
| 31. | Amesbury Town | 6.0% | 12.6%(-6.55)#31 | 18.1%(-12.0)#1,997 |
| 32. | North Plymouth | 6.3% | 12.6%(-6.31)#32 | 18.1%(-11.8)#2,119 |
| 33. | Saugus | 6.3% | 12.6%(-6.29)#33 | 18.1%(-11.8)#2,123 |
| 34. | Newburyport | 6.6% | 12.6%(-5.98)#34 | 18.1%(-11.5)#2,238 |
| 35. | Norwood | 6.7% | 12.6%(-5.91)#35 | 18.1%(-11.4)#2,279 |
| 36. | North Attleborough | 7.3% | 12.6%(-5.31)#36 | 18.1%(-10.8)#2,546 |
| 37. | Cochituate | 7.6% | 12.6%(-5.00)#37 | 18.1%(-10.5)#2,660 |
| 38. | Andover | 7.7% | 12.6%(-4.92)#38 | 18.1%(-10.4)#2,695 |
| 39. | Easthampton Town | 7.8% | 12.6%(-4.77)#39 | 18.1%(-10.2)#2,773 |
| 40. | Ayer | 7.8% | 12.6%(-4.77)#40 | 18.1%(-10.2)#2,774 |
| 41. | Northampton | 8.0% | 12.6%(-4.62)#41 | 18.1%(-10.1)#2,814 |
| 42. | Hudson | 8.0% | 12.6%(-4.60)#42 | 18.1%(-10.1)#2,825 |
| 43. | Leominster | 8.7% | 12.6%(-3.89)#43 | 18.1%(-9.37)#3,118 |
| 44. | Medford | 8.8% | 12.6%(-3.80)#44 | 18.1%(-9.27)#3,167 |
| 45. | Woburn | 9.0% | 12.6%(-3.63)#45 | 18.1%(-9.10)#3,232 |
| 46. | Revere | 9.1% | 12.6%(-3.53)#46 | 18.1%(-9.01)#3,259 |
| 47. | Braintree Town | 9.3% | 12.6%(-3.29)#47 | 18.1%(-8.77)#3,387 |
| 48. | Agawam Town | 9.8% | 12.6%(-2.77)#48 | 18.1%(-8.25)#3,582 |
| 49. | Waltham | 10.0% | 12.6%(-2.62)#49 | 18.1%(-8.10)#3,617 |
| 50. | Peabody | 10.1% | 12.6%(-2.48)#50 | 18.1%(-7.96)#3,704 |
| 51. | Randolph Town | 10.2% | 12.6%(-2.39)#51 | 18.1%(-7.87)#3,734 |
| 52. | Cambridge | 10.7% | 12.6%(-1.93)#52 | 18.1%(-7.40)#3,924 |
| 53. | Nahant | 11.0% | 12.6%(-1.58)#53 | 18.1%(-7.05)#4,042 |
| 54. | South Yarmouth | 11.4% | 12.6%(-1.21)#54 | 18.1%(-6.69)#4,216 |
| 55. | Brockton | 13.1% | 12.6%(+0.492)#55 | 18.1%(-4.98)#4,865 |
| 56. | Quincy | 13.2% | 12.6%(+0.653)#56 | 18.1%(-4.82)#4,922 |
| 57. | Plymouth | 13.5% | 12.6%(+0.885)#57 | 18.1%(-4.59)#5,009 |
| 58. | Beverly | 13.5% | 12.6%(+0.901)#58 | 18.1%(-4.58)#5,016 |
| 59. | Oxford | 13.8% | 12.6%(+1.21)#59 | 18.1%(-4.27)#5,127 |
| 60. | Foxborough | 14.5% | 12.6%(+1.91)#60 | 18.1%(-3.57)#5,410 |
| 61. | Barnstable Town | 14.9% | 12.6%(+2.26)#61 | 18.1%(-3.21)#5,534 |
| 62. | Swampscott | 14.9% | 12.6%(+2.35)#62 | 18.1%(-3.13)#5,559 |
| 63. | Westfield | 15.0% | 12.6%(+2.41)#63 | 18.1%(-3.07)#5,581 |
| 64. | Methuen Town | 15.3% | 12.6%(+2.75)#64 | 18.1%(-2.72)#5,693 |
| 65. | Webster | 15.4% | 12.6%(+2.77)#65 | 18.1%(-2.70)#5,695 |
| 66. | Taunton | 15.4% | 12.6%(+2.79)#66 | 18.1%(-2.69)#5,699 |
| 67. | Whitinsville | 16.0% | 12.6%(+3.38)#67 | 18.1%(-2.10)#5,915 |
| 68. | Teaticket | 16.0% | 12.6%(+3.41)#68 | 18.1%(-2.06)#5,928 |
| 69. | Abington | 16.0% | 12.6%(+3.44)#69 | 18.1%(-2.04)#5,944 |
| 70. | West Springfield Town | 16.1% | 12.6%(+3.55)#70 | 18.1%(-1.92)#5,983 |
| 71. | East Brookfield | 16.4% | 12.6%(+3.81)#71 | 18.1%(-1.67)#6,057 |
| 72. | Haverhill | 16.5% | 12.6%(+3.93)#72 | 18.1%(-1.54)#6,099 |
| 73. | Malden | 16.9% | 12.6%(+4.32)#73 | 18.1%(-1.16)#6,260 |
| 74. | Walpole | 16.9% | 12.6%(+4.34)#74 | 18.1%(-1.13)#6,266 |
| 75. | Essex | 17.3% | 12.6%(+4.70)#75 | 18.1%(-0.779)#6,364 |
| 76. | Orange | 17.4% | 12.6%(+4.83)#76 | 18.1%(-0.647)#6,419 |
| 77. | Milford | 18.0% | 12.6%(+5.36)#77 | 18.1%(-0.113)#6,603 |
| 78. | Smith Mills | 18.2% | 12.6%(+5.59)#78 | 18.1%(+0.119)#6,653 |
| 79. | Shelburne Falls | 18.4% | 12.6%(+5.78)#79 | 18.1%(+0.305)#6,733 |
| 80. | Turners Falls | 18.5% | 12.6%(+5.91)#80 | 18.1%(+0.437)#6,774 |
| 81. | Lynn | 19.0% | 12.6%(+6.45)#81 | 18.1%(+0.976)#6,942 |
| 82. | Chicopee | 19.4% | 12.6%(+6.77)#82 | 18.1%(+1.29)#7,037 |
| 83. | Boston | 19.5% | 12.6%(+6.92)#83 | 18.1%(+1.45)#7,102 |
| 84. | Athol | 20.3% | 12.6%(+7.75)#84 | 18.1%(+2.28)#7,367 |
| 85. | North Adams | 20.8% | 12.6%(+8.18)#85 | 18.1%(+2.70)#7,499 |
| 86. | Fitchburg | 20.8% | 12.6%(+8.18)#86 | 18.1%(+2.70)#7,500 |
| 87. | North Westport | 21.5% | 12.6%(+8.91)#87 | 18.1%(+3.44)#7,736 |
| 88. | Clinton | 21.5% | 12.6%(+8.95)#88 | 18.1%(+3.47)#7,746 |
| 89. | Attleboro | 21.6% | 12.6%(+9.06)#89 | 18.1%(+3.58)#7,781 |
| 90. | Salem | 21.9% | 12.6%(+9.32)#90 | 18.1%(+3.84)#7,872 |
| 91. | Framingham | 21.9% | 12.6%(+9.33)#91 | 18.1%(+3.85)#7,876 |
| 92. | East Falmouth | 22.4% | 12.6%(+9.84)#92 | 18.1%(+4.36)#8,034 |
| 93. | Greenfield | 22.6% | 12.6%(+10.0)#93 | 18.1%(+4.55)#8,096 |
| 94. | Dennis Port | 22.9% | 12.6%(+10.3)#94 | 18.1%(+4.79)#8,155 |
| 95. | Pittsfield | 23.0% | 12.6%(+10.5)#95 | 18.1%(+4.98)#8,192 |
| 96. | Gloucester | 23.2% | 12.6%(+10.6)#96 | 18.1%(+5.17)#8,279 |
| 97. | Middleborough Center | 23.4% | 12.6%(+10.8)#97 | 18.1%(+5.32)#8,311 |
| 98. | Lawrence | 23.9% | 12.6%(+11.3)#98 | 18.1%(+5.87)#8,460 |
| 99. | Adams | 24.0% | 12.6%(+11.4)#99 | 18.1%(+5.95)#8,487 |
| 100. | Lowell | 24.1% | 12.6%(+11.5)#100 | 18.1%(+6.06)#8,521 |
Common Questions
What are the Top 10 Cities with the Lowest Poverty Level Among Children Under the Age of 5 in Massachusetts?
Top 10 Cities with the Lowest Poverty Level Among Children Under the Age of 5 in Massachusetts are:
#1
0.42%
#2
0.65%
#3
0.68%
#4
0.74%
#5
0.81%
#6
1.1%
#7
1.4%
#8
1.6%
#9
1.9%
#10
2.2%
What city has the Lowest Poverty Level Among Children Under the Age of 5 in Massachusetts?
Arlington has the Lowest Poverty Level Among Children Under the Age of 5 in Massachusetts with 0.42%.
What is the Poverty Level Among Children Under the Age of 5 in the State of Massachusetts?
Poverty Level Among Children Under the Age of 5 in Massachusetts is 12.6%.
What is the Poverty Level Among Children Under the Age of 5 in the United States?
Poverty Level Among Children Under the Age of 5 in the United States is 18.1%.