Cities with the Lowest Poverty Level Among Children Under the Age of 5 in Kansas
RELATED REPORTS & OPTIONS
Lowest Poverty | Child 0-5
Kansas
Compare Cities
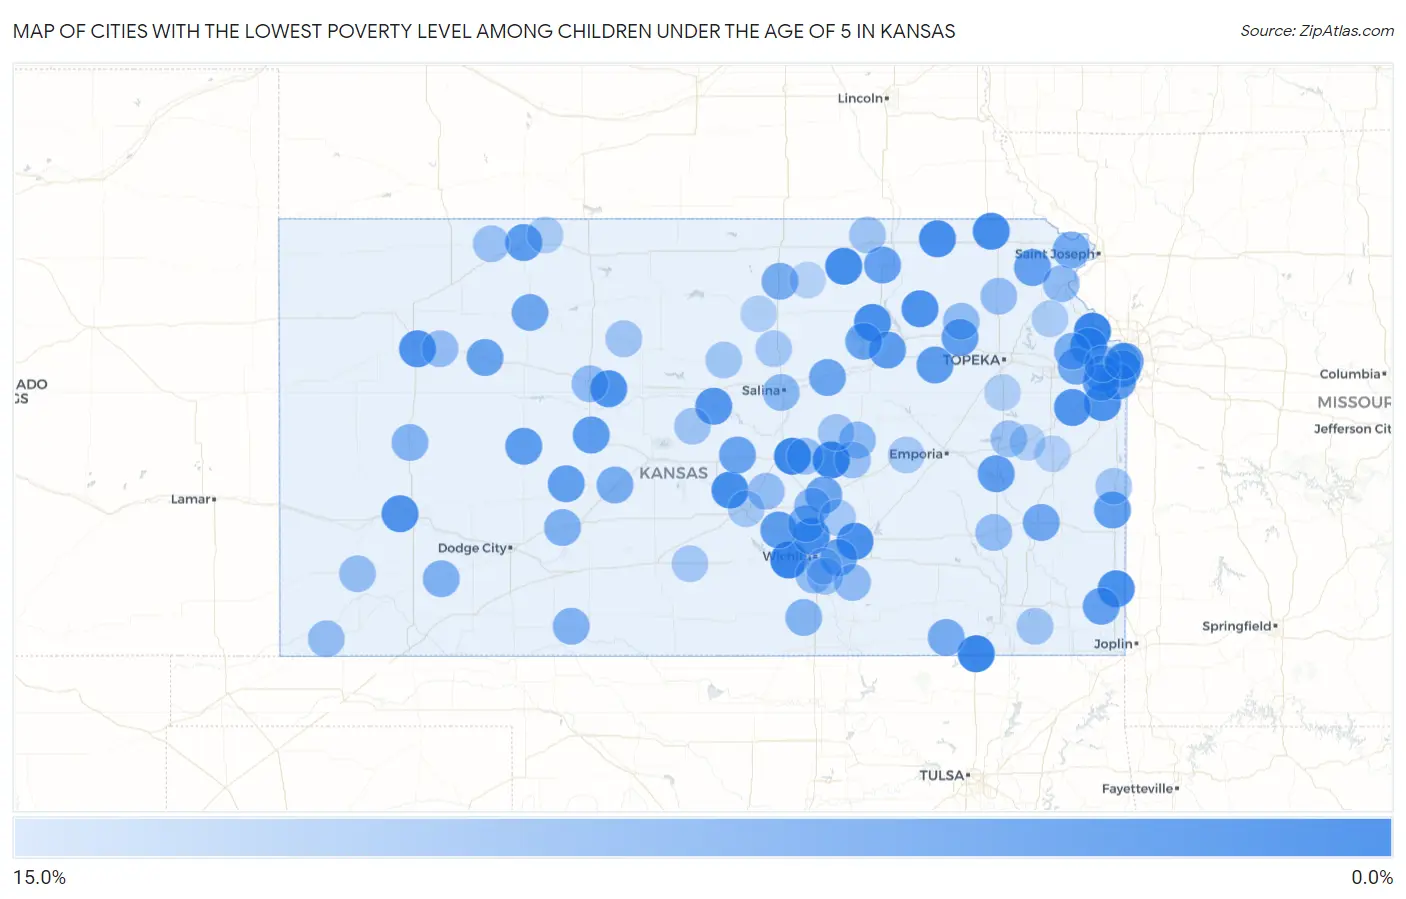
Map of Cities with the Lowest Poverty Level Among Children Under the Age of 5 in Kansas
15.0%
0.0%
Cities with the Lowest Poverty Level Among Children Under the Age of 5 in Kansas
| City | Child Poverty | vs State | vs National | |
| 1. | Goddard | 0.73% | 16.0%(-15.3)#1 | 18.1%(-17.3)#51 |
| 2. | Hillsboro | 0.92% | 16.0%(-15.1)#2 | 18.1%(-17.1)#81 |
| 3. | Caney | 0.96% | 16.0%(-15.0)#3 | 18.1%(-17.1)#95 |
| 4. | Lansing | 0.99% | 16.0%(-15.0)#4 | 18.1%(-17.1)#102 |
| 5. | Galva | 1.2% | 16.0%(-14.7)#5 | 18.1%(-16.8)#145 |
| 6. | Nickerson | 1.8% | 16.0%(-14.2)#6 | 18.1%(-16.2)#293 |
| 7. | Linn | 1.9% | 16.0%(-14.1)#7 | 18.1%(-16.1)#319 |
| 8. | Valley Center | 1.9% | 16.0%(-14.0)#8 | 18.1%(-16.1)#327 |
| 9. | Sabetha | 2.1% | 16.0%(-13.9)#9 | 18.1%(-16.0)#379 |
| 10. | Axtell | 2.1% | 16.0%(-13.9)#10 | 18.1%(-15.9)#390 |
| 11. | Riley | 2.2% | 16.0%(-13.7)#11 | 18.1%(-15.8)#426 |
| 12. | Towanda | 2.3% | 16.0%(-13.7)#12 | 18.1%(-15.8)#436 |
| 13. | Frontenac | 2.5% | 16.0%(-13.5)#13 | 18.1%(-15.6)#503 |
| 14. | Spring Hill | 2.6% | 16.0%(-13.4)#14 | 18.1%(-15.5)#542 |
| 15. | Westmoreland | 2.6% | 16.0%(-13.4)#15 | 18.1%(-15.4)#554 |
| 16. | Victoria | 2.7% | 16.0%(-13.3)#16 | 18.1%(-15.4)#581 |
| 17. | Oakley | 2.7% | 16.0%(-13.2)#17 | 18.1%(-15.3)#593 |
| 18. | Holcomb | 2.8% | 16.0%(-13.2)#18 | 18.1%(-15.3)#609 |
| 19. | Basehor | 2.8% | 16.0%(-13.2)#19 | 18.1%(-15.3)#622 |
| 20. | Westwood | 2.9% | 16.0%(-13.0)#20 | 18.1%(-15.1)#684 |
| 21. | Wellsville | 3.1% | 16.0%(-12.9)#21 | 18.1%(-15.0)#728 |
| 22. | Prairie Village | 3.3% | 16.0%(-12.7)#22 | 18.1%(-14.8)#817 |
| 23. | Ellsworth | 3.3% | 16.0%(-12.7)#23 | 18.1%(-14.8)#835 |
| 24. | La Crosse | 3.8% | 16.0%(-12.1)#24 | 18.1%(-14.2)#1,056 |
| 25. | Norton | 3.9% | 16.0%(-12.1)#25 | 18.1%(-14.2)#1,089 |
| 26. | Ogden | 4.0% | 16.0%(-12.0)#26 | 18.1%(-14.1)#1,117 |
| 27. | Ness City | 4.1% | 16.0%(-11.9)#27 | 18.1%(-14.0)#1,166 |
| 28. | Mount Hope | 4.2% | 16.0%(-11.8)#28 | 18.1%(-13.9)#1,200 |
| 29. | Alma | 4.2% | 16.0%(-11.8)#29 | 18.1%(-13.9)#1,202 |
| 30. | St Marys | 4.3% | 16.0%(-11.7)#30 | 18.1%(-13.8)#1,252 |
| 31. | New Strawn | 4.3% | 16.0%(-11.6)#31 | 18.1%(-13.7)#1,276 |
| 32. | Overland Park | 4.4% | 16.0%(-11.6)#32 | 18.1%(-13.7)#1,284 |
| 33. | Lenexa | 4.4% | 16.0%(-11.6)#33 | 18.1%(-13.7)#1,294 |
| 34. | Burdett | 4.5% | 16.0%(-11.4)#34 | 18.1%(-13.5)#1,359 |
| 35. | Fulton | 4.5% | 16.0%(-11.4)#35 | 18.1%(-13.5)#1,367 |
| 36. | Waterville | 4.7% | 16.0%(-11.3)#36 | 18.1%(-13.4)#1,418 |
| 37. | Cherokee | 4.8% | 16.0%(-11.2)#37 | 18.1%(-13.3)#1,453 |
| 38. | Everest | 4.8% | 16.0%(-11.2)#38 | 18.1%(-13.3)#1,460 |
| 39. | Olathe | 4.8% | 16.0%(-11.2)#39 | 18.1%(-13.3)#1,477 |
| 40. | Quinter | 5.1% | 16.0%(-10.9)#40 | 18.1%(-12.9)#1,629 |
| 41. | Little River | 5.3% | 16.0%(-10.7)#41 | 18.1%(-12.8)#1,694 |
| 42. | Milford | 5.3% | 16.0%(-10.7)#42 | 18.1%(-12.8)#1,698 |
| 43. | Andover | 5.3% | 16.0%(-10.7)#43 | 18.1%(-12.7)#1,714 |
| 44. | Abilene | 5.5% | 16.0%(-10.5)#44 | 18.1%(-12.6)#1,778 |
| 45. | Hill City | 5.7% | 16.0%(-10.3)#45 | 18.1%(-12.4)#1,873 |
| 46. | Walton | 5.7% | 16.0%(-10.3)#46 | 18.1%(-12.3)#1,894 |
| 47. | Gas | 5.9% | 16.0%(-10.1)#47 | 18.1%(-12.2)#1,941 |
| 48. | Linwood | 5.9% | 16.0%(-10.1)#48 | 18.1%(-12.2)#1,944 |
| 49. | Troy | 6.2% | 16.0%(-9.73)#49 | 18.1%(-11.8)#2,095 |
| 50. | Sedgwick | 6.3% | 16.0%(-9.63)#50 | 18.1%(-11.7)#2,139 |
| 51. | Sedan | 6.4% | 16.0%(-9.60)#51 | 18.1%(-11.7)#2,148 |
| 52. | Concordia | 6.5% | 16.0%(-9.50)#52 | 18.1%(-11.6)#2,185 |
| 53. | Larned | 6.5% | 16.0%(-9.44)#53 | 18.1%(-11.5)#2,209 |
| 54. | Tonganoxie | 6.8% | 16.0%(-9.19)#54 | 18.1%(-11.3)#2,324 |
| 55. | Copeland | 7.1% | 16.0%(-8.84)#55 | 18.1%(-10.9)#2,492 |
| 56. | Offerle | 7.1% | 16.0%(-8.84)#56 | 18.1%(-10.9)#2,497 |
| 57. | Protection | 7.4% | 16.0%(-8.58)#57 | 18.1%(-10.7)#2,602 |
| 58. | Scott City | 7.6% | 16.0%(-8.37)#58 | 18.1%(-10.4)#2,675 |
| 59. | Wellington | 7.8% | 16.0%(-8.20)#59 | 18.1%(-10.3)#2,756 |
| 60. | Newton | 8.1% | 16.0%(-7.90)#60 | 18.1%(-9.98)#2,862 |
| 61. | Salina | 8.1% | 16.0%(-7.86)#61 | 18.1%(-9.94)#2,879 |
| 62. | Lincolnville | 8.3% | 16.0%(-7.65)#62 | 18.1%(-9.73)#2,986 |
| 63. | Hays | 8.6% | 16.0%(-7.39)#63 | 18.1%(-9.47)#3,083 |
| 64. | Douglass | 8.6% | 16.0%(-7.34)#64 | 18.1%(-9.42)#3,102 |
| 65. | Atchison | 8.7% | 16.0%(-7.25)#65 | 18.1%(-9.33)#3,149 |
| 66. | Yates Center | 8.8% | 16.0%(-7.21)#66 | 18.1%(-9.29)#3,158 |
| 67. | Emmett | 8.8% | 16.0%(-7.16)#67 | 18.1%(-9.24)#3,181 |
| 68. | Haysville | 8.9% | 16.0%(-7.07)#68 | 18.1%(-9.14)#3,218 |
| 69. | Buhler | 9.0% | 16.0%(-6.99)#69 | 18.1%(-9.07)#3,241 |
| 70. | Holton | 9.1% | 16.0%(-6.89)#70 | 18.1%(-8.97)#3,271 |
| 71. | Rolla | 9.1% | 16.0%(-6.89)#71 | 18.1%(-8.97)#3,288 |
| 72. | Canton | 9.1% | 16.0%(-6.89)#72 | 18.1%(-8.97)#3,291 |
| 73. | Grinnell | 9.1% | 16.0%(-6.89)#73 | 18.1%(-8.97)#3,304 |
| 74. | Ulysses | 9.2% | 16.0%(-6.80)#74 | 18.1%(-8.88)#3,346 |
| 75. | Marion | 9.5% | 16.0%(-6.49)#75 | 18.1%(-8.57)#3,454 |
| 76. | Shawnee | 9.6% | 16.0%(-6.34)#76 | 18.1%(-8.42)#3,524 |
| 77. | Melvern | 9.7% | 16.0%(-6.31)#77 | 18.1%(-8.39)#3,539 |
| 78. | Norcatur | 9.7% | 16.0%(-6.31)#78 | 18.1%(-8.39)#3,541 |
| 79. | Derby | 9.7% | 16.0%(-6.24)#79 | 18.1%(-8.32)#3,558 |
| 80. | Hanover | 10.0% | 16.0%(-5.98)#80 | 18.1%(-8.06)#3,645 |
| 81. | Holyrood | 10.0% | 16.0%(-5.98)#81 | 18.1%(-8.06)#3,660 |
| 82. | Natoma | 10.0% | 16.0%(-5.98)#82 | 18.1%(-8.06)#3,662 |
| 83. | Mound Valley | 10.0% | 16.0%(-5.98)#83 | 18.1%(-8.06)#3,669 |
| 84. | Tampa | 10.0% | 16.0%(-5.98)#84 | 18.1%(-8.06)#3,677 |
| 85. | Pleasanton | 10.2% | 16.0%(-5.80)#85 | 18.1%(-7.88)#3,733 |
| 86. | Lincoln Center | 10.3% | 16.0%(-5.64)#86 | 18.1%(-7.72)#3,790 |
| 87. | South Hutchinson | 10.4% | 16.0%(-5.54)#87 | 18.1%(-7.62)#3,827 |
| 88. | Minneapolis | 10.5% | 16.0%(-5.51)#88 | 18.1%(-7.59)#3,838 |
| 89. | Whitewater | 10.5% | 16.0%(-5.46)#89 | 18.1%(-7.54)#3,871 |
| 90. | Cunningham | 10.5% | 16.0%(-5.46)#90 | 18.1%(-7.54)#3,880 |
| 91. | Strong City | 10.7% | 16.0%(-5.27)#91 | 18.1%(-7.35)#3,946 |
| 92. | Almena | 11.1% | 16.0%(-4.87)#92 | 18.1%(-6.95)#4,116 |
| 93. | Winchester | 11.1% | 16.0%(-4.87)#93 | 18.1%(-6.95)#4,118 |
| 94. | Carbondale | 11.4% | 16.0%(-4.59)#94 | 18.1%(-6.67)#4,224 |
| 95. | Roeland Park | 11.4% | 16.0%(-4.55)#95 | 18.1%(-6.63)#4,245 |
| 96. | Glasco | 11.5% | 16.0%(-4.45)#96 | 18.1%(-6.52)#4,284 |
| 97. | Mcconnell Afb | 11.6% | 16.0%(-4.34)#97 | 18.1%(-6.42)#4,322 |
| 98. | Richmond | 11.8% | 16.0%(-4.22)#98 | 18.1%(-6.30)#4,366 |
| 99. | Williamsburg | 11.8% | 16.0%(-4.22)#99 | 18.1%(-6.30)#4,370 |
| 100. | Clyde | 12.0% | 16.0%(-3.94)#100 | 18.1%(-6.01)#4,476 |
Common Questions
What are the Top 10 Cities with the Lowest Poverty Level Among Children Under the Age of 5 in Kansas?
Top 10 Cities with the Lowest Poverty Level Among Children Under the Age of 5 in Kansas are:
What city has the Lowest Poverty Level Among Children Under the Age of 5 in Kansas?
Goddard has the Lowest Poverty Level Among Children Under the Age of 5 in Kansas with 0.73%.
What is the Poverty Level Among Children Under the Age of 5 in the State of Kansas?
Poverty Level Among Children Under the Age of 5 in Kansas is 16.0%.
What is the Poverty Level Among Children Under the Age of 5 in the United States?
Poverty Level Among Children Under the Age of 5 in the United States is 18.1%.